Article

Changes in Storage and the Stratification Ratio of Soil Organic Carbon under Different Vegetation Types in Northeastern China

1
Chongqing Jinfo Mountain Field Scientific Observation and Research Station for Karst Ecosystem, School of Geographical Sciences, Southwest University, Chongqing 400715, China
2
State Cultivation Base of Eco-agriculture for Southwest Mountainous Land, Southwest University, Chongqing 400715, China
3
Northeast Institute of Geography and Agroecology, Chinese Academy of Sciences, Changchun 130102, China
4
College of Mobile Telecommunications, Chongqing University of Posts and Telecom, Chongqing 401520, China
*
Author to whom correspondence should be addressed.
Agronomy 2020, 10(2), 290; https://doi.org/10.3390/agronomy10020290
Submission received: 11 December 2019 / Revised: 12 February 2020 / Accepted: 13 February 2020 / Published: 18 February 2020

Abstract

:
The depth distribution of soil organic carbon (SOC) in a soil profile is important to examine the effects of different treatments on SOC sequestration. This study was conducted to determine the effects of different vegetation types on the concentration, storage, and stratification ratio (SR) of SOC in northeastern China. Five vegetation types, Leymus chinensis (LEY), Puccinellia tenuiflora (PUC), Echinochloa phyllopogon (ECH), saline seepweed (SUA), and Chloris virgata Swartz (CHL), were selected as treatments. Soil bulk density and SOC concentration were measured at 0 to 50 cm depth, and SOC storage and four SRs (SR1 [0–10:10–20 cm], SR2 [0–10:20–30 cm], SR3 [0–10:30–40 cm], and SR4 [0–10:40–50 cm]) were calculated under the five vegetation types. Results showed a pronounced reduction in SOC concentration with increasing soil depth. Vegetation types had significant effects on SOC concentration and storage. Under PUC, ECH, SUA, and CHL treatments, SOC concentrations (2.150, 1.068, 4.110, and 2.542 g kg−1, respectively) and storages (15.075, 7.273, 30.024, and 18.078 Mg ha−1, respectively) at 0–50 cm depth were lower than those under the LEY treatment. SR1 values were all < 2, while SR2, SR3, and SR4 values were all > 2 except for SR2 under ECH and SUA treatments. Vegetation types had significant effects on SR3 (p < 0.001) and SR4 (p = 0.040), while no significant differences were found for SR1 and SR2 due to the narrow range, with values of 0.248 and 0.553 for SR1 and SR2, respectively, among the vegetation types. These results indicated that the degraded soils have great potential to sequester organic carbon in northeastern China, and SR3 could be used as an effective index to show the changes in SOC concentration and soil quality in northeastern China.

1. Introduction

As an important part of the terrestrial ecosystem, grassland ecosystems cover a large part of Earth’s land surface and contain more than one third of the terrestrial organic carbon [1,2]. In terrestrial ecosystems, soils store more C than is contained in plants and the atmosphere combined [3,4]. In grassland ecosystems, soils are the largest organic carbon pool, and more than 90% of organic carbon is stored in grassland soils [5,6]. The patterns and influential factors of soil organic carbon (SOC) storage are critical for our understanding of grassland ecosystem services given the importance of SOC for grassland ecosystem process, its key role in the control of soil fertility and plant production, and the mitigation of global climate change [3,7].
SOC dynamics in grassland ecosystems are controlled by various ecosystem processes, e.g., land-use change, fencing, grazing, and fertilization [8,9]. Changes in ecosystem processes could easily result in the conversion of vegetation type, thus affecting the recycling of carbon in the plant-soil system, which depends on the organic carbon inputs from plant biomass, outputs through microorganism decomposition, and the patterns of above- and belowground biomass allocation [10,11]. For example, Lemenih and Itanna [12] investigated the influences of five vegetation types on SOC storage in southern Ethiopia and found that SOC in the upper 60 cm differed significantly, with values ranging from 40.3 to 234.6 Mg C ha−1. Yu, et al. [9] found that SOC concentrations under Echinochloa phyllopogon and Leymus chinensis were higher than that under Suaeda glauca, and halophytic vegetation has great potential to sequester SOC. Although increasing interests stimulated great efforts to monitor the changes in SOC concentration and storage related to vegetation type, large and different responses of SOC to vegetation conversion were observed due to the diverse soil types, land-use practices, initial soil properties, and environmental factors [13,14,15,16]. Assessing the influence of vegetation type on SOC concentration and stocks is a basic step in evaluating the carbon sequestration and storage potential of grassland ecosystems [10], and a clear understanding of SOC sequestration in grassland ecosystems could help us predict and ameliorate the consequences of climate change [2,17].
Stratification of some soil properties (e.g., SOC, soil nitrogen, soil phosphorus, and microbial biomass) with soil depth is common in many natural ecosystems [18,19,20]. The stratification ratio (SR) is defined as the ratio of soil properties in surface soil divided by the those in deeper soil layers [21]. The SOC concentration of surface soil is essential for erosion control, water infiltration, and nutrient conservation, and it can easily be affected by changes in various ecosystem processes [18,22]. However, the SOC concentration in deeper soil layers is relatively stable and is usually used as the baseline to normalize assessments and compare the changes among soils from different research sites [23]. Therefore, SR of SOC concentration can be related to the changes in SOC sequestration, and it has been proposed as an efficient indicator of SOC sequestration and soil quality change in various natural ecosystems and under various management practices [24,25,26]. However, different surface and deeper soil layers were used to calculate SR in different studies [16,21,22,23].
Over the last decades, grassland was significantly degraded in the Songnen plain due to overgrazing, which led to the conversion of native plants (e.g., Leymus chinensis (Trin.) Tzvel) to halophilous plants [9,16]. This vegetation conversion will change the SOC sequestration in this region. However, very few quantitative studies have been done on the influence of vegetation conversion, especially along a vegetation degradation sequence, on SOC sequestration in the Songnen plain. Consequently, the main objectives of this study were to (1) investigate the changes in SOC concentrations and storage under different vegetation types and (2) compare the differences in SRs of SOC concentration under the different vegetation types, as well as evaluate the feasibility of using SR as an index of SOC sequestration in northeastern China.

2. Materials and Methods
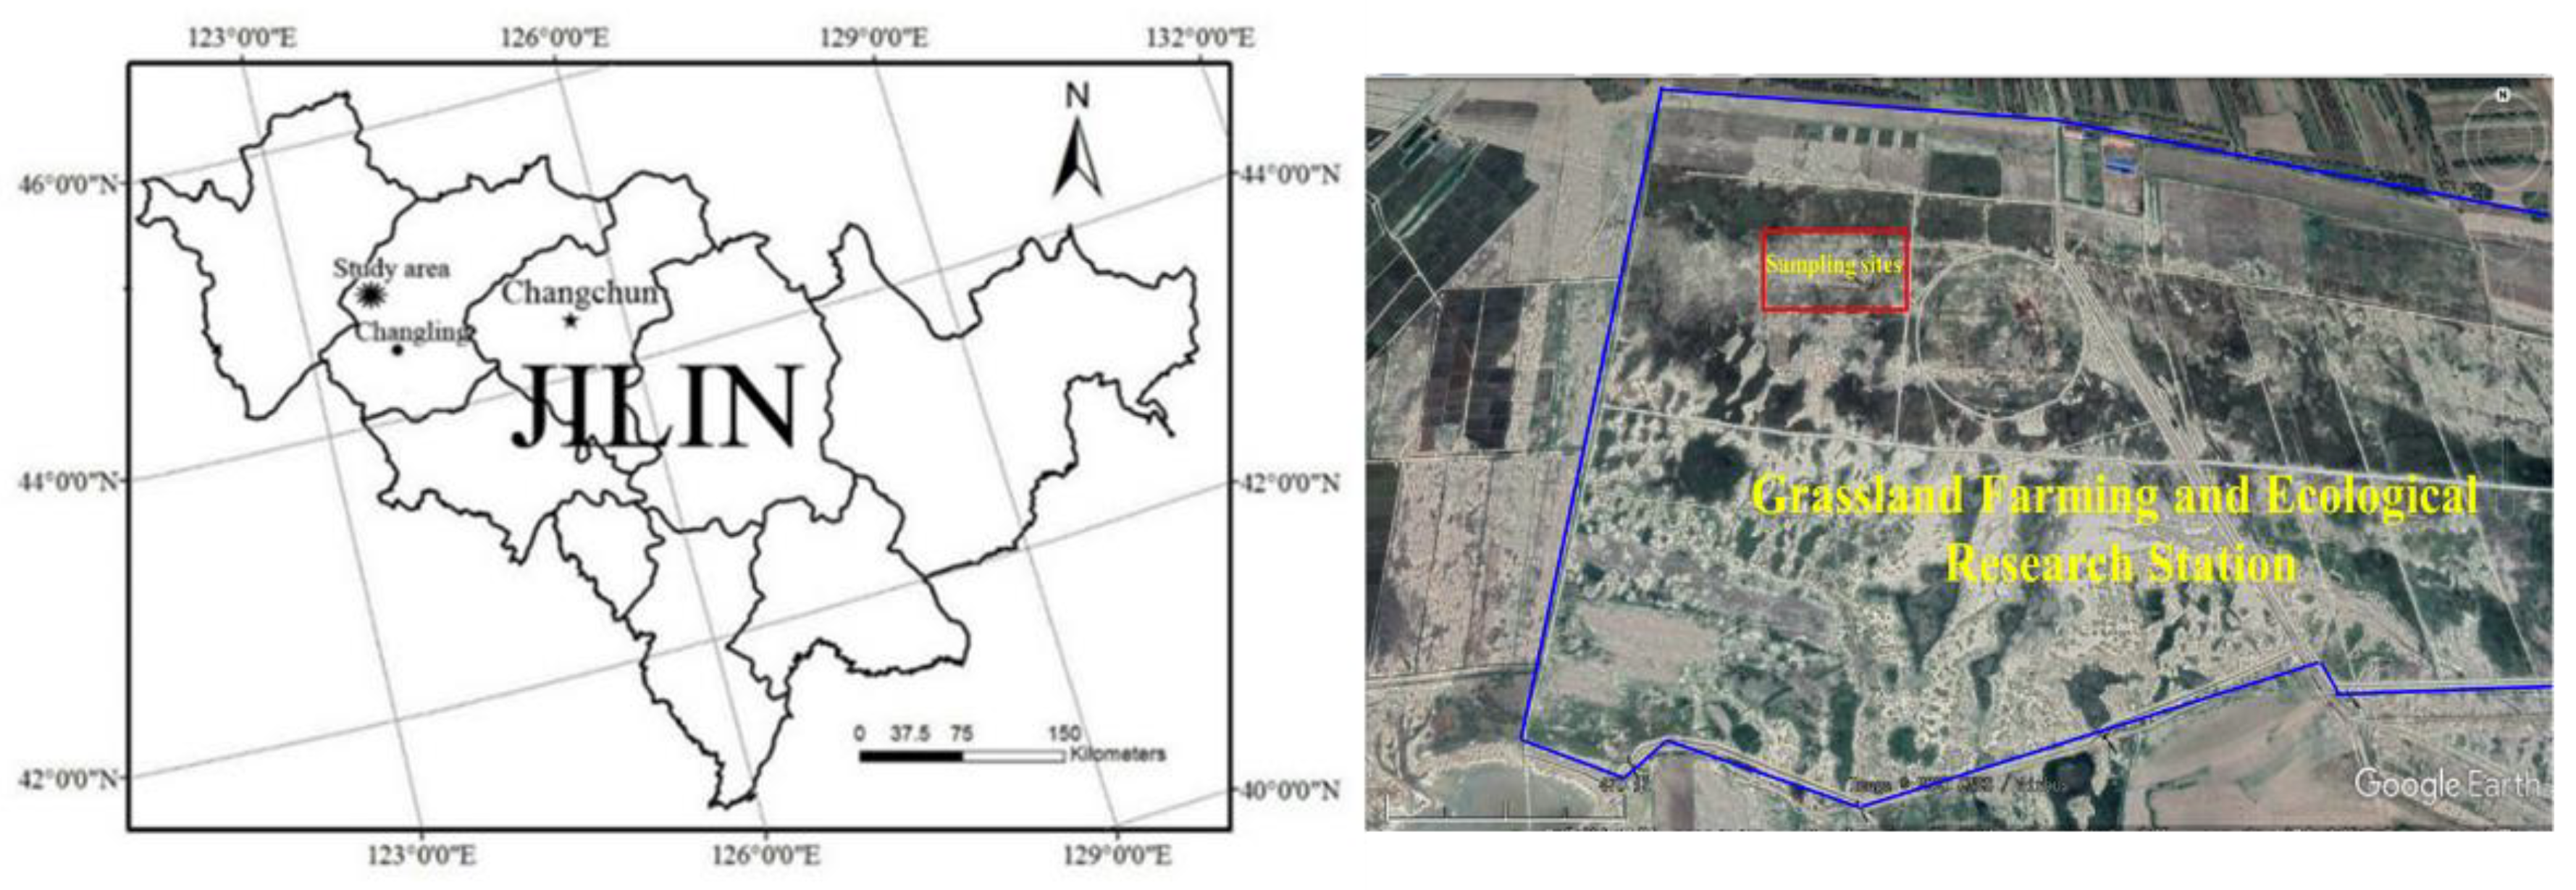
2.1. Study Area

The study area was located at the Grassland Farming and Ecological Research Station, Changling city, Jilin Province, northeastern China (44°33′ N, 123°31′ E), which covers an area of 300 ha on the northern Songnen plain (Figure 1). This area is relatively flat, and its elevation is about 145 m above sea level. The region is characterized as a temperate, semi-arid continental monsoon climate. The mean annual precipitation and the mean annual air temperature were approximately 440 mm and 5.9 °C, respectively, in the recent 30 years [16]. The annual pan evaporation is approximately 1600 mm, and the frost-free period is approximately 140 days. The soil in the study area is a salt-affected soil with high contents of NaHCO3 (0.554 g kg−1) and Na2CO3 (0.645 g kg−1) and is classified as an Aqui-Alkalic Halosol in the Chinese soil taxonomic system or as a Solonetz in the World Reference Base (WRB) for Soil Resources [16]. The dominant native species is Leymus chinensis (Trin.) Tzvel, which represents the most widely distributed grassland community of the Songnen plain. The major companion species are Chloris virgata Swartz, Puccinellia tenuiflora (Griseb.) Scribn, and saline seepweed (Suaeda heteroptera Kitagawa). The vegetation coverage is approximately 50–90%, with 120–360 g m−2 standing biomass [16].
The soluble salt content of surface soil is very low, and the soluble salt ions mostly exist below a 30 cm depth in the study area [9]. The surface soil with a low soluble salt content is perfect for the growth of Leymus chinensis (Trin.) Tzvel. Therefore, the dominant native species Leymus chinensis (Trin.) Tzvel covered the whole area, and other vegetation communities were very limited in the study area before the 1960s [16]. Due to the influences of grazing, trampling, and mowing, the vegetation cover decreased in the study area after the 1960s, which then substantially accelerated land salinization in the surface soil. Leymus chinensis (Trin.) Tzvel was gradually replaced by halophilous plants (e.g., Chloris virgata Swartz, Puccinellia tenuiflora (Griseb.) Scribn and saline seepweed) [9]. The study area was severely degraded due to the long-term heavy grazing before 2009. Since early 2009, the degraded grassland has been restored by fencing. The fencing significantly recovered the vegetation, and the exposed surface with a high content of soluble soil salt was gradually covered by saline seepweed. The aboveground biomass was only approximately 37 g/m2 due to the long-term heavy grazing in the study area [27]. The aboveground biomass of vegetation significantly increased after fencing, and the average aboveground biomass in the study area has reached approximately 310 g/m2 (Table 1).

2.2. Soil Sampling and Analysis

Based on the detailed investigation of the vegetation type in the study area, five vegetation types, Leymus chinensis (Trin.) Tzvel (LEY), Puccinellia tenuiflora (Griseb.) Scribn (PUC), Echinochloa phyllopogon (Stapf) Koss (ECH), saline seepweed (SUA), and Chloris virgata Swartz (CHL), were selected in this study as our treatments in August 2018. The vegetation cover of the dominant species in the five communities was more than 90%, and thus it is suitable to study the effects of vegetation type on SOC sequestration. The vegetation biomass and surface soil salinity are shown in Table 1.
Field sampling was conducted in late August 2018. This grassland had been restored for approximately 10 years by the time of sampling. The SOC concentration at the 0–20 cm depth was 10.021, 5.674, 8.192, 4.128, and 6.625 g kg−1 for the vegetation types LEY, PUC, ECH, SUA, and CHL, respectively, in the study area according to a survey in 2011. In each vegetation community, 5 replicated sampling plots of 1 m × 1 m were established at 20 m intervals along a random transect. The aboveground biomass in each sampling plot was clipped at the ground level. Belowground biomass was determined using a soil corer (7 cm diameter) in each plot after removal of the aboveground biomass and litter. Belowground biomass was collected at a 0–50 cm soil depth. Soil samples were collected to a depth of 50 cm at 5 intervals of 0–10, 10–20, 20–30, 30–40, and 40–50 cm by using a 5 × 20 cm soil auger. In each plot, four soil cores were taken and mixed at each soil depth. In total, 125 soil samples were obtained. These soil samples were transported to the laboratory and air-dried at room temperature. After removing the visible plant materials, these disturbed soil samples were sieved through a 0.25-mm mesh for determining the SOC concentration. The SOC concentration was determined using the K2Cr2O7-H2SO4 oxidation method [16]. Soil bulk density (BD) at each depth in each sampling plot was measured using the core method described by Blake and Hartage [28]. Soil bulk density was measured using soil cores (volume, 100 cm3) with five replicates for each vegetation type. Soil pH was measured using a PHS-3C instrument (INESAS Scientific Instrument Co., Ltd., Shanghai, China), and electrical conductivity (EC) was measured using a DDS-307 instrument (INESAS Scientific Instrument Co., Ltd., Shanghai, China) in a 1:5 soil/water solution [16].

2.3. Calculations and Statistical Analysis

SR is defined as the value of a soil property in the surface soil divided by the value at a lower depth [18,22]. SRs of SOC concentration at the 0–10 cm depth relative to those at 10–20 cm, 20–30 cm, 30–40 cm, and 40–50 cm depths (SR1 [0–10:10–20 cm], SR2 [0–10: 20–30 cm], SR3 [0–10:30–40 cm], and SR4 [0–10:40–50 cm], respectively) were calculated in this study.
Total SOC storage (SOCS) at 0–50 cm depth was obtained as the sum of the SOCS of five depths. For each soil depth interval, SOCS was calculated as:
S O C S = B D × C S O C × H × 10
where SOCS is the SOC storage (Mg C ha−1), BD is the bulk density (g cm−3), Csoc is the SOC concentration (g kg−1), and H is the thickness of the soil layer (cm) [29].
All statistical analyses were carried out with the SPSS 13.0 software package (SPSS 13.0 for Windows, release 13.0, 1 September 2004, USA). The normality of all datasets was tested to meet the assumptions of statistical analysis. Data from the different vegetation types, including the BD, SOC concentration, SOCS, and SRs of SOC concentration, were compared by one-way analyses of variance (ANOVAs) followed by least significant difference (LSD) tests. Significant differences are reported at p < 0.05. The soil sample mean and standard error for each variable measured were provided at each depth for a given vegetation type.

3. Results

3.1. Changes in Soil Bulk Density under Different Vegetation Types

The BD value increased with increasing soil depth from the surface to the subsoil under all vegetation types (Table 2). Vegetation type had significant effects on the BD values at 0–10 and 10–20 cm depths, but no significant differences were found at 20–30, 30–40, and 40–50 cm depths. The BD values in LEY and ECH treatments were significantly lower than those in PUC and SUA treatments at 0–10 and 10–20 cm depths. The average BD values at 0–50 cm depth under LEY, PUC, ECH, SUA, and CHL were 1.555, 1.593, 1.570, 1.615, and 1.593 g cm−3, respectively.

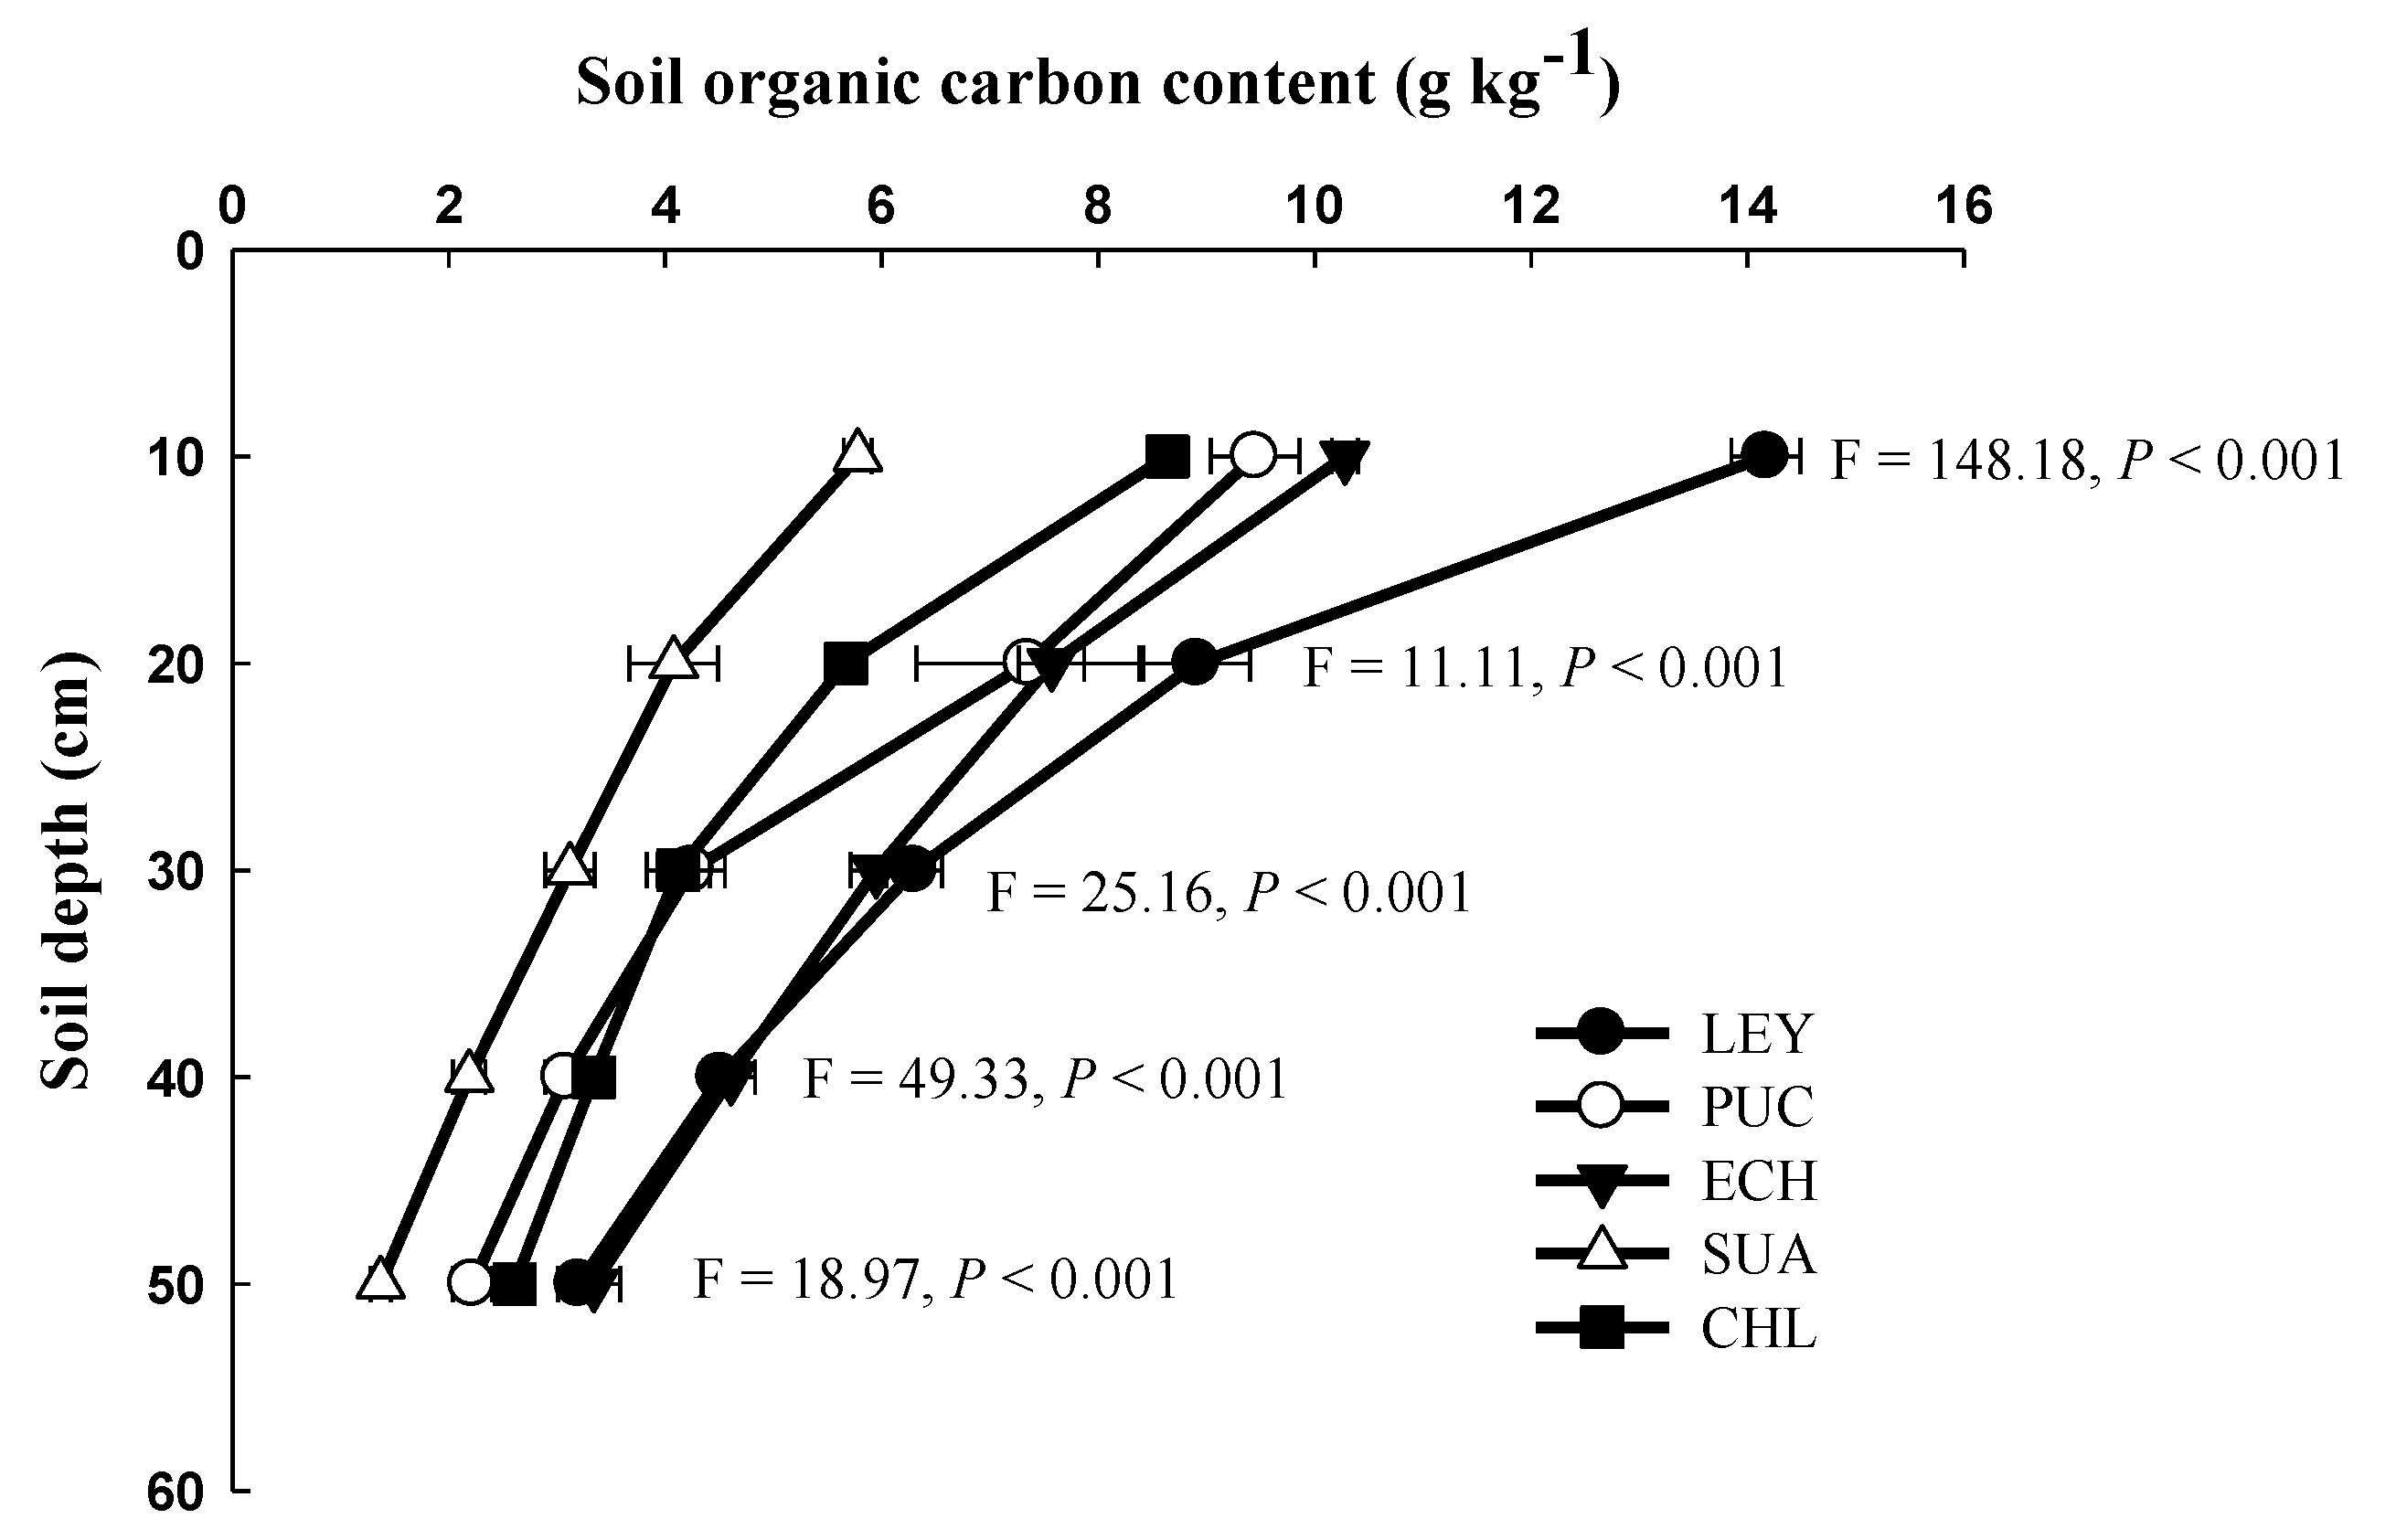
3.2. Changes in Concentrations and Storage of Soil Organic Carbon under Different Vegetation Types

A pronounced reduction (p < 0.001) in SOC concentrations with increasing soil depth was observed under all vegetation types (Figure 2). The highest SOC concentration (14.165 g kg−1) was observed in the LEY treatment at 0–10 cm depth and the lowest value (1.370 g kg−1) in the SUA treatment at the 40–50 cm depth. The range of the SOC concentrations across the soil profile was 10.970, 7.230, 6.937, 4.408, and 6.025 g kg −1 for the LEY, PUC, ECH, SUA, and CHL treatments, respectively. Vegetation type had significant effects on the SOC concentration (Figure 2). The SOC concentration at 0–10 cm depth was ranked in the order of LEY > ECH > PUC > CHL > SUA. Compared with the SUA and CHL treatments, SOC concentrations in LEY and ECH treatments were significantly higher at the 10–20 cm depth. At 20–50 cm depth, significantly higher SOC concentrations were found in treatments with LEY ≈ ECH > PUC ≈ CHL > SUA. The average SOC concentration at 0–50 cm depth was 7.418, 5.268, 6.350, 3.308, and 4.876 g kg −1 for the LEY, PUC, ECH, SUA, and CHL treatments, respectively.
Significant differences of SOCS among the vegetation types were found at each soil depth (Table 3). Greater SOCS was observed in the LEY treatment as compared to PUC ≈ ECH > CHL > SUA treatments at 0–10 cm depth. At the 10–20 cm depth, SOCS in the LEY, PUC and ECH treatments was significantly higher than that in the SUA and CHL treatments. Similar to the SOC concentration, SOCS at 20 to 50 cm depth was ranked as LEY ≈ ECH > PUC ≈ CHL > SUA. The SOCS under LEY, PUC, ECH, SUA, and CHL was 34.180, 25.923, 26.850, 15.493, and 22.040 Mg ha−1, respectively, at the 0–20 cm depth and 22.256, 15.438, 22.313, 10.919, and 16.318 Mg ha−1, respectively, at the 20–50 cm depth.

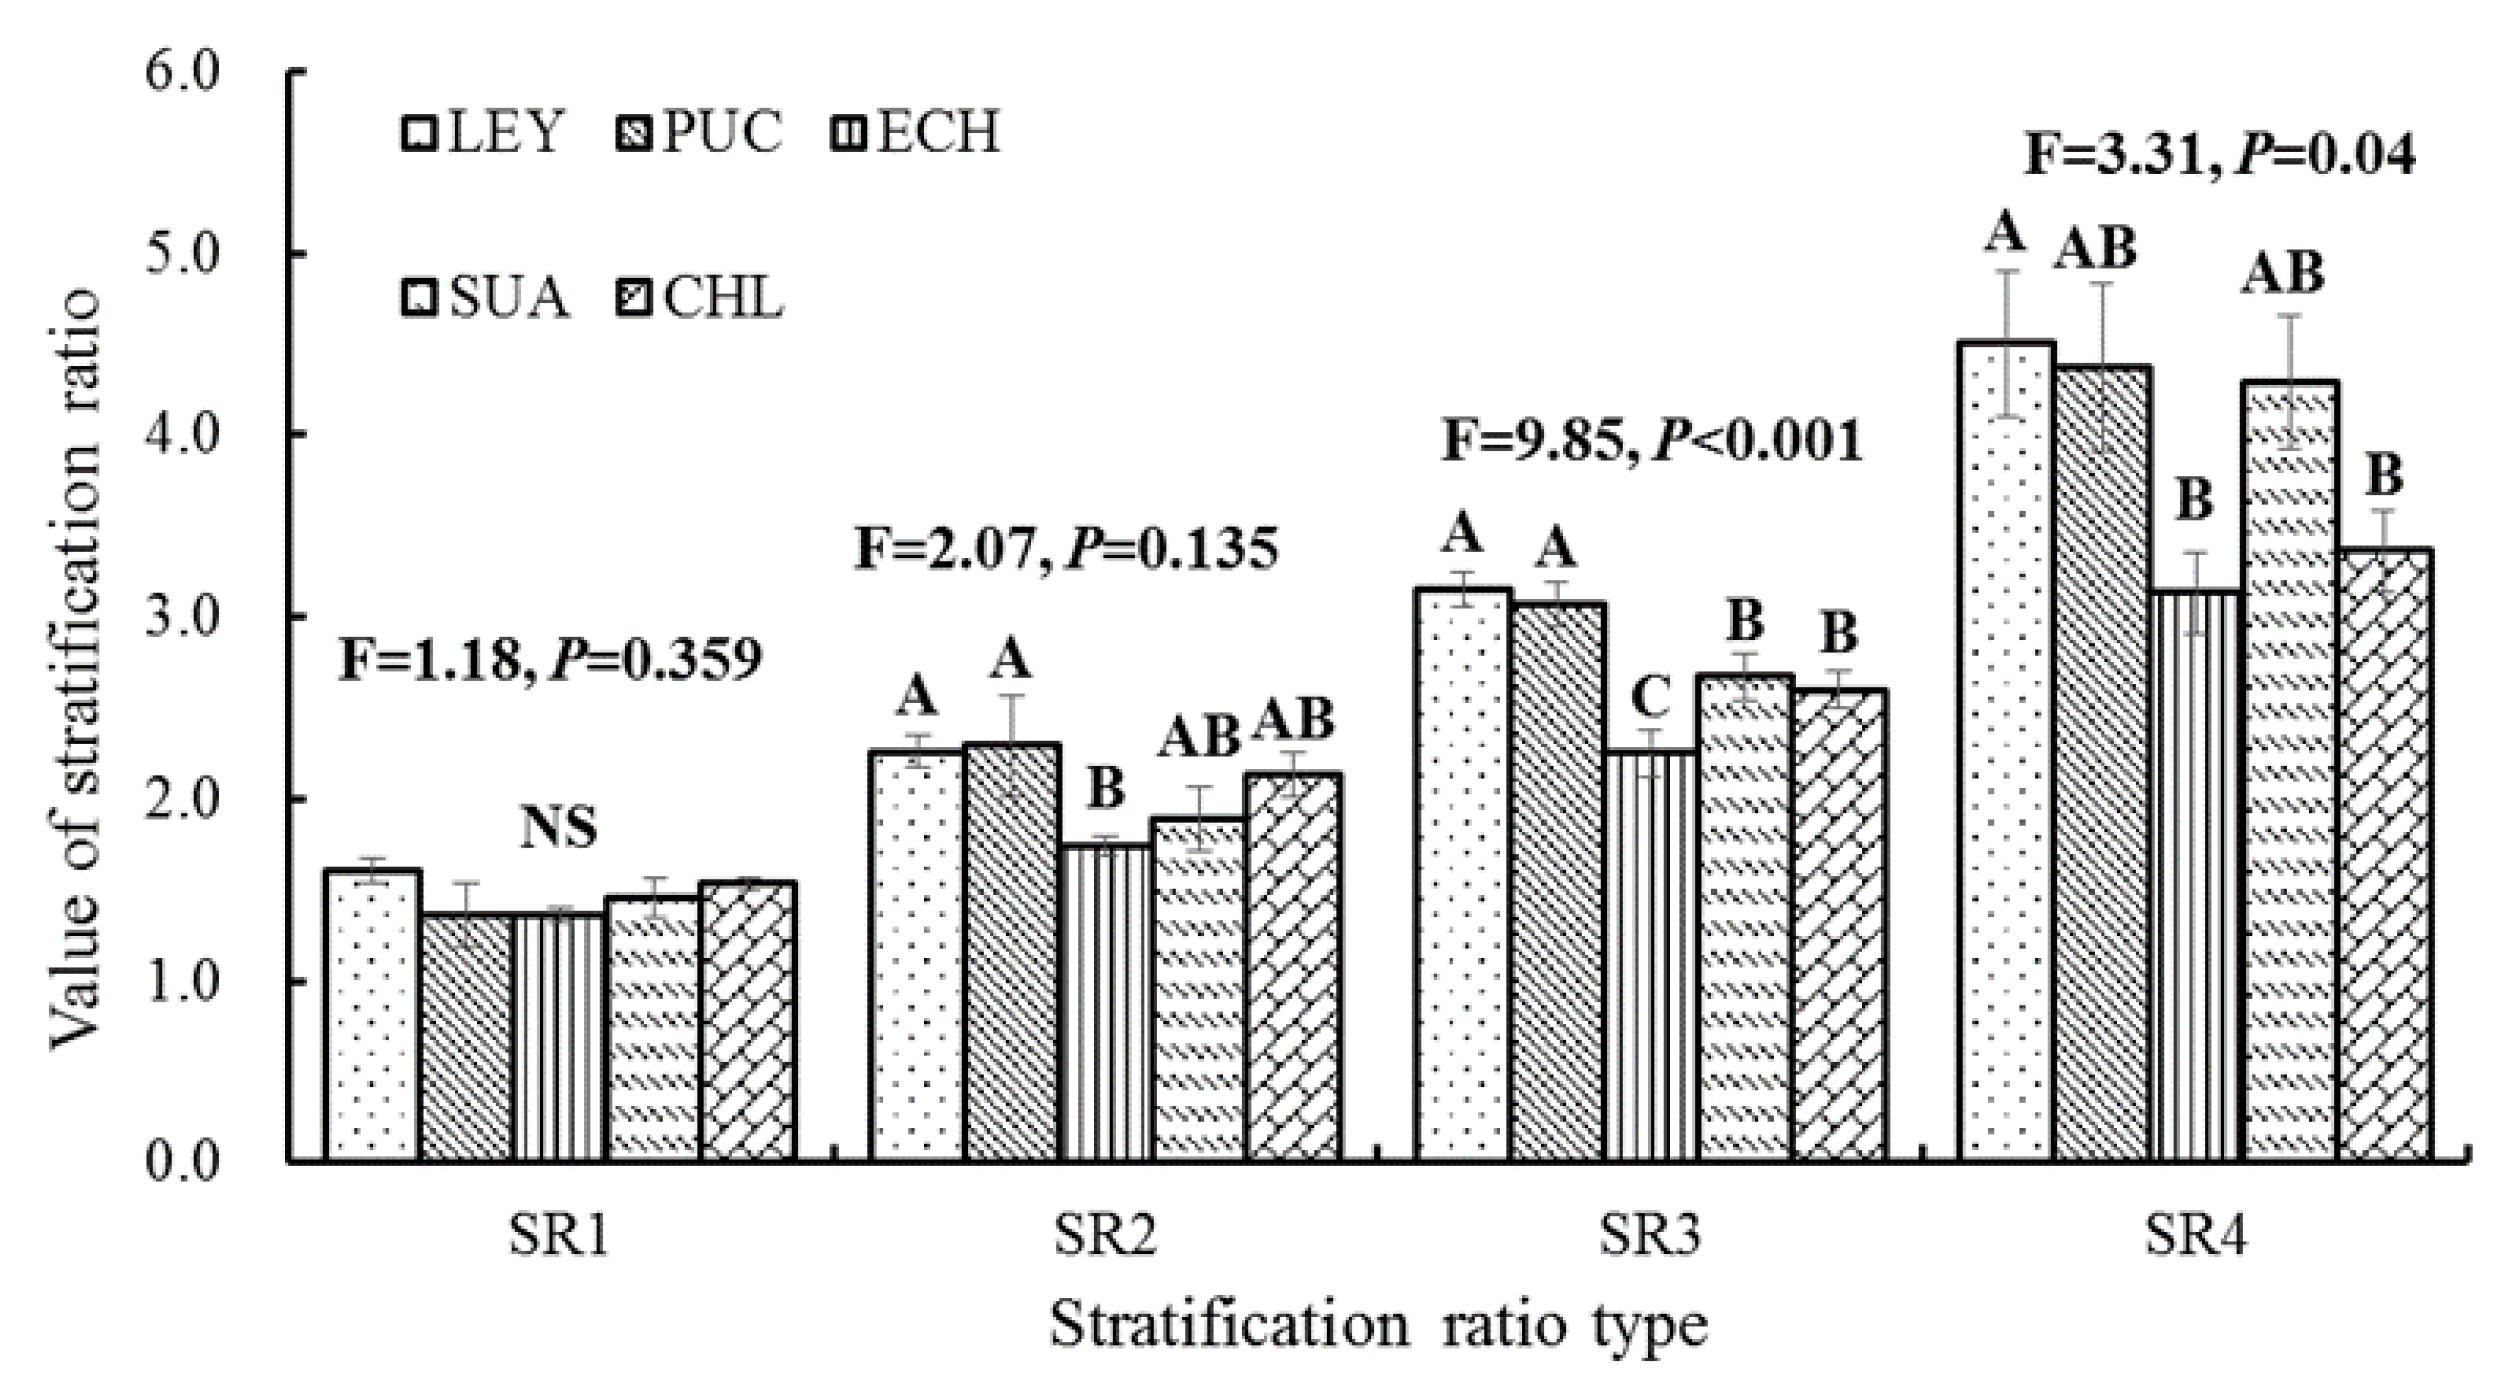
3.3. Changes in the Stratification Ratio of Soil Organic Carbon under Different Vegetation Types

SRs of SOC concentration were ranked as SR1 < SR2 < SR3 < SR4, irrespective of vegetation type (Figure 3). SR of SOC ranged from 1.355 to 1.603, 1.735 to 2.288, 2.245 to 3.150, and 3.128 to 4.503 for SR1, SR2, SR3, and SR4, respectively, among the five vegetation types. Vegetation type had no significant effect on SR1 and SR2 due to the narrow range. However, the influences of vegetation types on SR3 and SR4 were significant (Figure 3). SR3 of SOC was ranked as LEY ≈ PUC > SUA ≈ CHL > ECH. The highest SR4 value in the LEY treatment was significantly higher than that in the ECH and CHL treatments.

4. Discussion

4.1. Effect of Vegetation Type on SOC Concentration and Storage

In the present study, the SOCS under the LEY treatment was significantly higher than that under other vegetation types, indicating the community of Leymus chinensis had a greater SOC capture ability than other vegetation (Table 3). The SOCS was calculated using the bulk density, horizon depth, and SOC concentration. Therefore, the change trend of SOCS among the different vegetation types was mainly determined by the variation in BD values and SOC concentrations. The BD values in the LEY treatment were lower than those under other vegetation type (Table 2). However, the narrow differences (0.038, 0.015, 0.060, and 0.038 g cm−3, respectively) of BD value at 0–50 cm depth between the LEY treatment and PUC, ECH, SUA, and CHL treatments result in the limited effects of soil BD on the SOCS. These results indicated that the changes in SOC concentrations under different vegetation types were the primary reason for the differences in SOCS in this study. The recycling of carbon in the plant-soil system is mainly due to the carbon inputs from plant production and the outputs of microbial decomposition [10]. The higher vegetation quality and above- and belowground biomass in the LEY treatment led to the higher SOC concentration and thus resulted in the highest SOCS compared with other vegetation types [9,30,31]. In addition, the communities of Puccinellia tenuiflora (Griseb.) Scribn, Chloris virgata Swartz, and saline seepweed are all halophytic vegetation, and they grow in degraded salt-affected soils with poor fertility. Therefore, it is not surprising that SOC concentrations and SOCS in the CHL and SUA treatments were significantly lower than those in the LEY treatment.
Previous studies on SOC changes responding to different management practices mainly focused on the topsoil due to the higher SOC concentration and the sensitive responses of SOC to environmental changes at this soil depth [32]. However, many more studies reported that focusing on subsoil would give an accurate estimation of changes in SOC concentration and storage [33,34]. Our study showed that the SOCS at 0–20 cm depth in the LEY, PUC, ECH, SUA, and CHL treatments accounted for 60.567%, 62.669%, 54.627%, 58.668%, and 57.467%, respectively, of total SOCS at the 0–50 cm depth (Table 3). Approximately 40% of SOC was stored below the 20 cm depth (20–50 cm). Additionally, the present study also showed that vegetation type had significant influences on the SOC concentration and SOCS at the 20 to 50 cm depth (Figure 2, Table 3). Therefore, subsoil samples should be collected in future studies when SOC changes to different management practices are investigated.
Understanding the potential carbon storage in a specific ecosystem will help us to predict the quantity of carbon sequestered and assess the influence of management practices on carbon storage [35]. Unlike other terrestrial ecosystems, approximately 96.6% of organic carbon is stored in soils in Chinese grassland ecosystems [6]. Therefore, the potential capacities of SOC accumulation represent the potential capacities of carbon accumulation in grassland ecosystems. The SOCS under all vegetation types could reach a stable or mature condition in an ideal environment [9]. Therefore, the differences in SOCS between a healthy vegetation community and degraded vegetation community could provide useful information on the estimation of the SOC storage potential. The highest SOC storage at 0–50 cm depth was found in the LEY treatment, with a value of 56.436 Mg C ha−1 in this study (Table 3). As the dominant native vegetation, Leymus chinensis mainly grows in areas with nondegraded soils. Therefore, the SOCS in the LEY treatment can be used as peak SOCS in the region to estimate the potential carbon accumulation in northeastern China. Compared with the LEY treatment, the SOCS at 0–50 cm depth in the treatments with PUC, ECH, SUA, and CHL decreased by 15.075, 7.273, 30.024, and 18.078 Mg C ha−1, respectively. These results indicate that the degraded grassland has great potential to sequester organic carbon, and approximately 17.6 Mg C ha−1 can be stored in soils when these degraded vegetation types are restored to a Leymus chinensis community through effective management practices in northeastern China.

4.2. Effect of Vegetation Type on Stratification Ratios of SOC Concentration

Using SR as an indicator to evaluate the effects of management practices on SOC sequestration and soil quality is effective and meaningful because SR normalizes the inherent differences of soils in different eco-regions by including the properties of the subsoil [22]. SR of the SOC concentration increased from SR1 to SR4 on the Songnen plain, northeastern China (Figure 3). This change trend was caused by the remarked reduction of SOC concentration from topsoil to subsoil. This result is in line with the findings of Lozano-Garcia, et al. [36] for a Mediterranean nature reserve, Zhang, et al. [37] for a mono-cropping system of northern China, and Xu, et al. [22] for the Zhifanggou watershed, Shaanxi Province, China. Previous studies showed that an SR of SOC concentration > 2 was an indicator of improvement in soil quality [18,23]. The values of SR1 under different vegetation types in the present study were all < 2; however, the values of SR2, SR3, and SR4 were all > 2. These two opposite SR values result from the different calculation methods (using different subsoil as the lower soil depth) and will result in two different conclusions when evaluating the effects of vegetation type on SOC sequestration and soil quality. In addition, different calculation methods of SRs were used in different studies (e.g., the surface soil was defined as 0–5 cm in Xu, et al. [22], 0–20 cm in Deng, et al. [38], and 0–25 cm in Lozano-Garcia, et al. [36], and the lower depth was defined as 7.5–15 cm in Franzluebbers [18], 15–30 cm in Zhang, et al. [37], 30–50 cm in Melero, et al. [20], and 40–60 cm in Fan, et al. [39]). This makes it difficult to accurately compare the influence of management practices on SOC sequestration in different studies. Therefore, a standard SR calculation method using specific surface and lower soil depths should be defined to make the comparisons of changes in SOC and soil quality easier under different management practices.
In the present study, four SRs, SR1, SR2, SR3, and SR4, were calculated, and different influences of vegetation types on SRs were found (Figure 3). The range of SR values across the vegetation types was 0.248, 0.553, 0.905, and 1.375 for SR1, SR2, SR3, and SR4, respectively. The narrow range across the vegetation types is the primary reason for no significant difference in SR1 and SR2 among the five vegetation types. This result indicates that the index of SR1 and SR2 was unsuitable for assessing the differences in SOC sequestration and soil quality under different vegetation types on the Songnen plain. Different from SR1 and SR2, SR3 and SR4 were significantly different among the vegetation types (Figure 3). The results of ANOVA showed that SR3 had a higher F value and lower p value than SR4, indicating SR3 was better than SR4 to discriminate the differences in SOC concentration under different vegetation types. Thus, SR3 should be used as an efficient index in the assessment of the effect of management practices on soil quality in northeastern China. The values of SR3 in the LEY and PUC treatments were significantly higher than those in the SUA and CHL treatments, indicating that the soil quality and SOC storage in the LEY and PUC treatments were better than those in the SUA and CHL treatments. Saline seepweed and Chloris virgata Swartz are two typical halophytic vegetation types on the Songnen plain, and they usually grow in extremely degraded soils with a high salt concentration and low quality [9]. In addition, the therophyte saline seepweed and Chloris virgata Swartz have lower plant biomass than the perennial plants Leymus chinensis (Trin.) Tzvel and Puccinellia tenuiflora (Griseb.) Scribn (Table 1). The lower plant production in the SUA and CHL treatments does not contribute to the accumulation of SOC and improvement of soil quality.
The value of SR3 in the ECH treatment was significantly lower than that in the LEY, PUC, SUA, and CHL treatments (Figure 3). However, the SOC concentration and storage in the ECH treatment were significantly higher than those in the PUC, SUA, and CHL treatments (Figure 2 and Table 2). The result of SR3 in the ECH treatment was contrary to that of SOC concentration and storage, and it does not reflect the effects of the ECH treatment on SOC sequestration and soil quality. This is mainly related to the microhabitat where Echinochloa phyllopogon grows. Echinochloa phyllopogon is a typical hygrophyte, and it grows in low-lying sites where water usually accumulates during the growing season. The dissolved organic carbon in the high-lying sites is transported to the low-lying sites by the surface runoff and thus infiltrates into the subsoil. The accumulation of dissolved organic carbon in the subsoil in the ECH treatment reduced SOC stratification and thus weakened the correlation of SR with SOC concentration. This result confirmed that the utility of SR for indicating SOC sequestration decreases with increasing soil disturbances [22]. Since validation of SR as an indicator of carbon sequestration under different vegetation types was examined in only one eco-region on the Songnen plain, future work is needed to test its validity and accuracy in other eco-regions.

5. Conclusions

Five vegetation types were selected to assess the changes in concentration, storage, and the stratification ratio of SOC to document the effects of vegetation types on the dynamics of soil carbon in northeastern China. Higher concentration and storage of SOC were found in the topsoil under all vegetation types. The concentration and storage of SOC in the LEY treatment were significantly higher than those under other vegetation types. Compared with the LEY treatment, SOCS was 15.075, 7.273, 30.024, and 18.078 Mg C ha−1 lower, respectively, in the PUC, ECH, SUA, and CHL treatments, indicating that soils under these degraded vegetation types have great potential to sequester organic carbon in northeastern China. Therefore, vegetation recovery in the degraded regions could enhance SOC sequestration. Vegetation types had significant effects on SR3 and SR4, while no significant difference was found for SR1 and SR2 among the vegetation types. Compared with SR4, SR3 had better discrimination under different vegetation types due to the higher F value and lower p value. Therefore, SR3 is better than SR1, SR2, and SR4 and could be used as an effective index and a criterion to show changes in the SOC concentration and soil quality in northeastern China. We recommend that SR3 be used as a standard index for indicating SOC dynamics under different management options. The utility of SR3 was only used on the Songnen plain in this study. Hence, more studies are needed to assess the importance of SR3 in other eco-regions in the future.

Author Contributions

Conceptualization, P.Y., S.L., and X.T.; methodology, P.Y., Z.D., and A.Z.; software, P.Y. and Z.D.; validation, S.L., A.Z., and X.T.; investigation, P.Y.; data curation, P.Y. and S.L.; writing—original draft preparation, P.Y.; writing—review and editing, S.L., Z.D., A.Z., and X.T.; funding acquisition, P.Y., S.L. and X.T. All authors have read and agree to the published version of the manuscript.

Funding

This research was funded by the Fundamental Research Funds for the Central Universities (SWU019024; SWU019023 and XDJK2020D006), National Natural Science Foundation of China (31500446 and 41601124), Excellent Young Foundation of Jilin Province (20190103141JH), and University Innovation Research Group of Chongqing (remote sensing of fragile ecological environment in southwestern China).

Conflicts of Interest

The authors declare no conflict of interest.

References

  1. Paz-Ferreiro, J.; Medina-Roldan, E.; Ostle, N.J.; Mcnamara, N.P.; Bardgett, R.D. Grazing increases the temperature sensitivity of soil organic matter decomposition in a temperate grassland. Environ. Res. Lett. 2012, 7, 014027. [Google Scholar] [CrossRef]
  2. Conant, R.T.; Cerri, C.E.P.; Osborne, B.B.; Paustian, K. Grassland management impacts on soil organic carbon stocks: A new synthesis. Ecol. Appl. 2017, 27, 662–668. [Google Scholar] [CrossRef] [Green Version]
  3. Jobbacy, E.G.; Jackson, R.B. The vertical distribution of soil organic carbon and its relation to climate and vegetation. Ecol. Appl. 2000, 10, 423–436. [Google Scholar] [CrossRef]
  4. Novara, A.; Minacapilli, M.; Santoro, A.; Rodrigo-Comino, J.; Carrubba, A.; Sarno, M.; Venezia, G.; Gristina, L. Real cover crops contribution to soil orgnaic carbon sequestration in sloping vineyard. Sci. Total Environ. 2019, 652, 300–306. [Google Scholar] [CrossRef] [PubMed]
  5. Munoz-Rojas, M.; Rosa, D.D.; Zavala, L.M.; Jordan, A.; Anaya-Romero, M. Changes in land cover and vegetation carbon stocks in Andalusia, Southern Spain (1956–2007). Sci. Total Environ. 2011, 409, 2796–2806. [Google Scholar] [CrossRef] [PubMed]
  6. Fang, J.Y.; Yang, Y.H.; Ma, W.H.; Mohammat, A.; Shen, H. Ecosystem carbon stocks and their changes in China’s grassland. Sci. China Life Sci. 2010, 53, 757–765. [Google Scholar] [CrossRef]
  7. Santos, C.A.; Rezende, C.P.; Machado, P.E.F.; Pereira, J.M.; Alves, B.J.R.; Urquoaga, S.; Boddey, R.M. Changes in soil carbon stocks after land-use change form native vegetation to pastures in the Atlantic forest region of Brazil. Geoderma 2019, 337, 394–401. [Google Scholar] [CrossRef]
  8. Deng, L.; Wang, K.B.; Zhu, G.Y.; Liu, Y.L.; Chen, L.; Shangguan, Z.P. Changes of soil carbon in five land use stages following 10 years of vegetation succession on the Loess Plateau, China. Catena 2018, 171, 185–192. [Google Scholar] [CrossRef]
  9. Yu, P.J.; Li, Q.; Jia, H.T.; Zheng, W.; Wang, M.L.; Zhou, D.W. Carbon stocks and storage potential as affected by vegetation in the Songnen grassland of northeast China. Quat. Int. 2013, 306, 114–120. [Google Scholar] [CrossRef]
  10. Shrestha, B.M.; Singh, B.R. Soil and vegetation carbon pools in a mountainous watershed of Nepal. Nutr. Cycl. Agroecosyst. 2008, 81, 179–191. [Google Scholar] [CrossRef]
  11. Li, N.; Shao, T.Y.; Zhu, T.S.; Long, X.H.; Gao, X.M.; Liu, Z.P.; Shao, H.B.; Rengel, Z. Vegetation succession influences soil carbon sequestration in coastal alkali-saline soils in southeast China. Sci. Rep. 2018, 8, 9728. [Google Scholar] [CrossRef] [PubMed]
  12. Lemenih, M.; Itanna, F. Soil carbon stocks and turnovers in various types and arable lands along an gradient in southern Ethiopia. Geoderma 2014, 123, 177–188. [Google Scholar] [CrossRef]
  13. Hu, P.L.; Liu, S.J.; Ye, Y.Y.; Zhang, W.; Wang, K.L.; Su, Y.R. Effects of environmental factors on soil organic carbon under natural or managed vegetation restoration. Land Degrad. Dev. 2018, 29, 387–397. [Google Scholar] [CrossRef]
  14. Parker, T.C.; Subke, J.A.; Wookey, P.A. Rapid carbon turnover beneath shrub and tree vegetation is associated with low soil carbon stocks at a subarctic treeline. Glob. Chang. Biol. 2015, 21, 2070–2081. [Google Scholar] [CrossRef] [PubMed] [Green Version]
  15. Loranty, M.M.; Lieberman-Cribbin, W.; Berner, L.T.; Natali, S.M.; Goetz, S.J.; Alexander, H.D.; Kholodov, A.L. Spatial variation in vegetation productivity trends, fire disturbance, and soil carbon across arctic-boreal permafrost ecosystems. Environ. Res. Lett. 2016, 11, 095008. [Google Scholar] [CrossRef]
  16. Yu, P.J.; Tang, X.G.; Liu, S.W.; Liu, W.X.; Zhang, A.C. Short term effects of revegetation on labile carbon and available nutrients of sodic soils in northeast China. Land 2020, 9, 10. [Google Scholar] [CrossRef] [Green Version]
  17. Lal, R. Soil carbon sequestration to mitigate climate change. Geoderma 2004, 123, 1–22. [Google Scholar] [CrossRef]
  18. Franzluebbers, A.J. Soil organic matter stratification ratio as an indicator of soil quality. Soil Tillage Res. 2002, 66, 95–106. [Google Scholar] [CrossRef]
  19. Melero, S.; Lopez-Garrido, R.; Murillo, J.M.; Moreno, F. Conservation tillage, short-and long-term effects on soil carbon fractions and enzymatic activities under Mediterranean conditions. Soil Tillage Res. 2009, 104, 292–298. [Google Scholar] [CrossRef] [Green Version]
  20. Melero, S.; Lopez-Bellido, R.J.; Luis-Bellido, L.; Munoz-Romero, V.; Moren, F.; Murillo, J.M.; Franzluebbers, A.J. Stratification ratios in a rainfed Mediterranean Vertisol in wheat under differnet tillage, rotation and N fertilization rates. Soil Tillage Res. 2012, 119, 7–12. [Google Scholar] [CrossRef]
  21. Lopez-Fando, C.; Pardo, M.T. Soil carbon storage and stratification under different tillage systems in a semiarid region. Soil Tillage Res. 2011, 111, 224–230. [Google Scholar] [CrossRef]
  22. Xu, M.X.; Wang, Z.; Zhao, Y.G. Stratification ratio of soil organic carbon as an indicator of carbon sequestration and soil quality in ecological restoration. Restor. Ecol. 2018, 26, 555–562. [Google Scholar] [CrossRef]
  23. Zhao, X.; Xue, J.F.; Zhang, X.Q.; Kong, F.L.; Chen, F.; Lal, R.; Zhang, H.L. Stratification and storage of soil organic carbon and nitrogen as affected by tillage practices in the North China Plain. PLoS ONE 2015, 10, e01288873. [Google Scholar] [CrossRef] [PubMed]
  24. Moraes Sa, J.C.; Lal, R. Stratification ratio of soil organic matter pools as an indicator of carbon sequestration in a tillage chronosequence on a Brazilian Oxisol. Soil Tillage Res. 2009, 103, 46–56. [Google Scholar]
  25. Marinho, M.A.; Pereira, M.W.M.; Vazquez, E.V.; Lado, M.; Gonzalez, A.P. Depth distribution of soil organic carbon in an Oxisol under different land uses, Stratification indices and multifractal analysis. Geoderma 2017, 287, 126–134. [Google Scholar] [CrossRef]
  26. Patra, S.; Julich, S.; Feger, K.H.; Jat, M.L.; Sharma, P.C.; Schwarzel, K. Effects of converison agriculture on stratification of osil organic matter udner cereal-based cropping systems. Arch. Agron. Soil Sci. 2019, 65, 2013–2028. [Google Scholar] [CrossRef]
  27. Li, Q.; Song, Y.T.; Zhou, D.W.; Wang, M.L.; Chen, X.Y. Effects of fencing and grazing on soil carbon, nitrogen, phosphorus storage in degraded alkali-saline grassland. Pratacultural Sci. 2014, 31, 1811–1819. [Google Scholar]
  28. Blake, G.R.; Hartage, K.H. Bulk density. In Methods of Soil Analysis. Part 1—Physical Mineralogical Methods; Klute, A., Ed.; ASA and SSSA: Madison, WI, USA, 1986; pp. 363–375. [Google Scholar]
  29. Ellert, B.H.; Bettany, J.R. Calculation of organic matter and nutrients stored in soils under contrastin management regimes. Can. J. Soil Sci. 1995, 75, 529–538. [Google Scholar] [CrossRef] [Green Version]
  30. Gmach, M.R.; Dias, B.O.; Silva, C.A.; Nobrega, J.C.A.; Lustosa-Filho, J.; Siqueira-Neto, M. Soil organic matter dynamics and land use change on Oxisols in the Cerrado, Brazil. Geoderma Reg. 2018, 14, e00178. [Google Scholar] [CrossRef]
  31. Wang, M.; Liu, X.T.; Zhang, J.T.; Li, X.J.; Wang, G.D.; Lu, X.R.; Li, X.Y. Spatio-temporal variations of soil respiration in five typical plant communities in the meadow steppe of the western Songnen Plain, China. Chin. J. Plant Ecol. 2014, 38, 396–404. [Google Scholar]
  32. Poeplau, C.; Don, A.; Vesterdal, L.; Leifeld, J.; Van Wesemael, B.; Schumacher, J.; Gensior, A. Temporal dynamics of soil organic carbon after land-use change in the temperate zone-carbon response functions as a model approach. Glob. Chang. Biol. 2011, 17, 2415–2427. [Google Scholar] [CrossRef]
  33. Ding, F.; Hu, Y.L.; Li, L.J.; Li, A.; Shi, S.W.; Lian, P.Y.; Zeng, D.H. Changes in soil organic carbon and total nitrogen stocks after conversion of meadow to cropland in Northeast China. Plant Soil 2013, 373, 659–672. [Google Scholar] [CrossRef]
  34. Lal, R. Digging deeper, a holistic perspective of factors affecting soil organic carbon sequestration in agroecosystems. Glob. Chang. Biol. 2018, 24, 3285–3301. [Google Scholar] [CrossRef] [PubMed]
  35. He, N.P.; Yu, Q.; Wu, L.; Wang, Y.S.; Han, X.G. Carbon and nitrogen store and storage potential as affected by land-use in a Leymus chinensis grassland of northern China. Soil Biol. Biochem. 2008, 40, 2952–2959. [Google Scholar] [CrossRef]
  36. Lozano-Garcia, B.; Parras-Alcantara, L.; Cantudo-Perez, M. Land use change effects on stratification and storage of soil carbon and nitrogen, Application to a Mediterranean nature reserve. Agric. Ecosyst. Environ. 2016, 231, 105–113. [Google Scholar] [CrossRef]
  37. Zhang, Z.Q.; Qiang, H.J.; McHugh, A.D.; He, J.; Li, H.W.; Wang, Q.J.; Lu, Z.Y. Effect of conservation farming practices on soil organic matter and stratification in a mono-cropping system of Northern China. Soil Tillage Res. 2016, 156, 173–181. [Google Scholar] [CrossRef]
  38. Deng, J.; Sun, P.S.; Zhao, F.Z.; Han, X.H.; Yang, G.H.; Feng, Y.Z.; Ren, G.X. Soil C, N, P and its stratification ratio affected by artificial vegetation in subsoil, Loess Plateau China. PLoS ONE 2016, 11, e0151446. [Google Scholar] [CrossRef]
  39. Fan, H.; Zhao, W.W.; Daryanto, S.; Fu, B.J.; Wang, S.; Wang, Y.P. Vertical distributions of soil organic carbon and its influencing factors under different land use types in the desert riparian zone of downstream Heihe River basin, China. J. Geophys. Res. Atmos. 2018, 123, 7741–7753. [Google Scholar] [CrossRef]
Figure 1. The location map of the study area and the sampling sites.
Agronomy 10 00290 g001
Figure 2. Depth distribution of SOC concentration under different vegetation types. The bars represent standard errors. F and p values are the ANOVA results at the same soil depth. LEY, Leymus chinensis (Trin.) Tzvel; PUC, Puccinellia tenuiflora (Griseb.) Scribn; ECH, Echinochloa phyllopogon (Stapf) Koss, SUA, saline seepweed; CHL, Chloris virgata Swartz.
Agronomy 10 00290 g002
Figure 3. The stratification ratio of SOC concentration under different vegetation types. Values with the same uppercase letters within the stratification ratio are not significantly different at p < 0.05. The bars represent standard errors. F and p values are the ANOVA results at the same soil depth. See Figure 2 for abbreviations.
Agronomy 10 00290 g003
Table 1. Vegetation production and surface soil salinity and sodicity under different vegetation types. LEY, Leymus chinensis (Trin.) Tzvel; PUC, Puccinellia tenuiflora (Griseb.) Scribn; ECH, Echinochloa phyllopogon (Stapf) Koss, SUA, saline seepweed; CHL, Chloris virgata Swartz.
Vegetation TypeCompanion SpeciesSoil Salinity and Sodicity (0–20 cm)Biomass (g m−2)
EC (μm cm−1)pHAbovegroundBelowground (0–50 cm)
LEYChloris virgata4389.5411518
PUCChloris virgata, Polygonum aviculare5159.8264352
ECHPuccinellia tenuiflora, Scirpus triqueter2819.4287405
SUA 149610.227386
CHLPuccinellia tenuiflora, Polygonum aviculare82710.1316126
Table 2. Depth distribution of soil bulk density under different vegetation types. The results are shown as the mean (±SE). Values with the same uppercase letters within rows (vegetation types) and lowercase letters within columns (soil depths) are not significantly different at p < 0.05. See Table 1 for abbreviations.
Soil Depth (cm)Bulk Density (g cm−3)ANOVA
LEYPUCECHSUACHLFP
0–101.456 (±0.017) Bc1.530 (±0.014) Ac1.486 (±0.019) Bc1.564 (±0.009) Ac1.531 (±0.011) ABc8.8050.001
10–201.530 (±0.010) Bb1.560 (±0.007) Ac1.529 (±0.009) Bc1.590 (±0.009) Ac1.555 (±0.015) ABbc5.6580.006
20–301.561 (±0.028) Bb1.601 (±0.012) ABb1.578 (±0.017) ABb1.621 (±0.007) Ab1.586 (±0.008) ABb2.1210.129
30–401.599 (±0.003) Bab1.613 (±0.010) ABb1.615 (±0.009) ABab1.635 (±0.009) Aab1.636 (±0.014) Aa1.8170.178
40–501.630 (±0.011) Aa1.661 (±0.013) Aa1.639 (±0.014) Aa1.666 (±0.016) Aa1.658 (±0.011) Aa1.3260.305
Table 3. Storage of SOC under different vegetation types. The results are shown as the mean (±SE). Values with the same uppercase letters within rows (vegetation types) and lowercase letters within columns (soil depths) are not significantly different at p < 0.05. See Table 1 for abbreviations.
Soil Depth (cm)Storage of Soil Organic Carbon (Mg Ha−1)ANOVA
LEYPUCECHSUACHLFP
0–1020.625 (±0.465) Aa14.453 (±0.632) Ba15.275 (±0.181) Ba9.035 (±0.209) Da13.225 (±0.109) Ca123.578<0.001
10–2013.555 (±0.739) Ab11.470 (±1.599) Ab11.575 (±0.464) Ab6.458 (±0.653) Bb8.815 (±0.240) Bb10.042<0.001
20–309.838 (±0.400) Ac6.785 (±0.495) Bc9.390 (±0.380) Ac5.058 (±0.380) Cc6.525 (±0.455) Bc22.849<0.001
30–407.208 (±0.197) Ad4.973 (±0.099) Bcd7.453 (±0.361) Ad3.578 (±0.241) Cd5.460 (±0.202) Bd46.870<0.001
40–505.210 (±0.304) ABe3.680 (±0.298) Bd5.470 (±0.399) Ae2.283 (±0.151) Ce4.333 (±0.299) Be18.228<0.001
0–5056.436 (±1.038) A41.361 (±1.928) C49.163 (±0.804) B26.412 (±0.858) D38.358 (±0.738) C95.897<0.001

