Size Variability in Seed Lot Impact Seed Nutritional Balance, Seedling Vigor, Microbial Composition and Plant Performance of Common Corn Hybrids


Abstract
1. Introduction
2. Materials and Methods
2.1. Corn Growth Room Assay
2.2. Yield Loss Potential Calculations
2.3. Seed Nutritional Profiling
2.4. Bacterial Community DNA Extraction and TRFLP Analysis
2.5. Statistical Analysis
3. Results
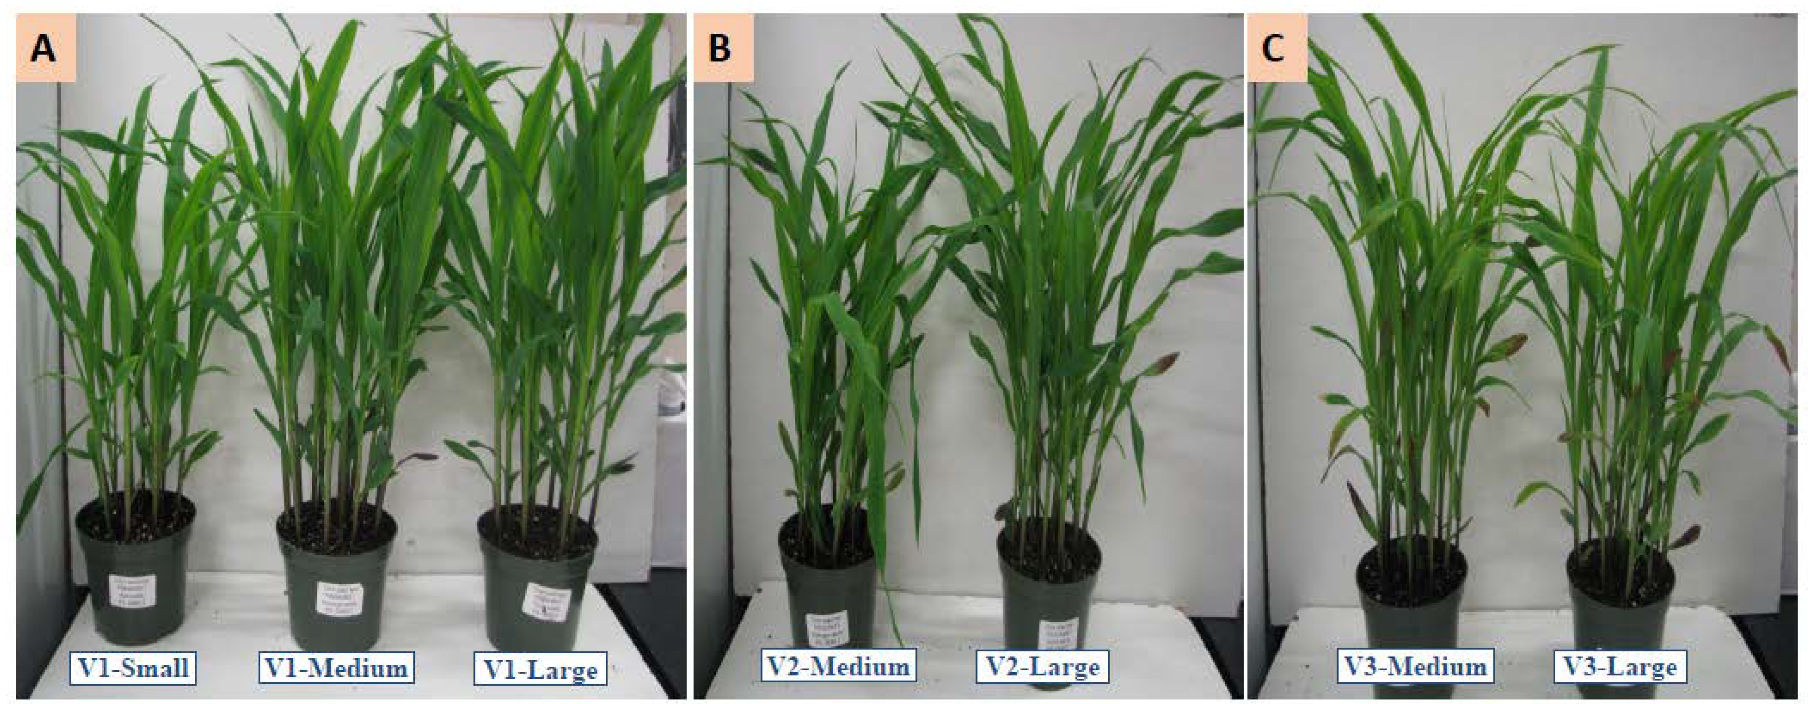
3.1. Seed Sizes
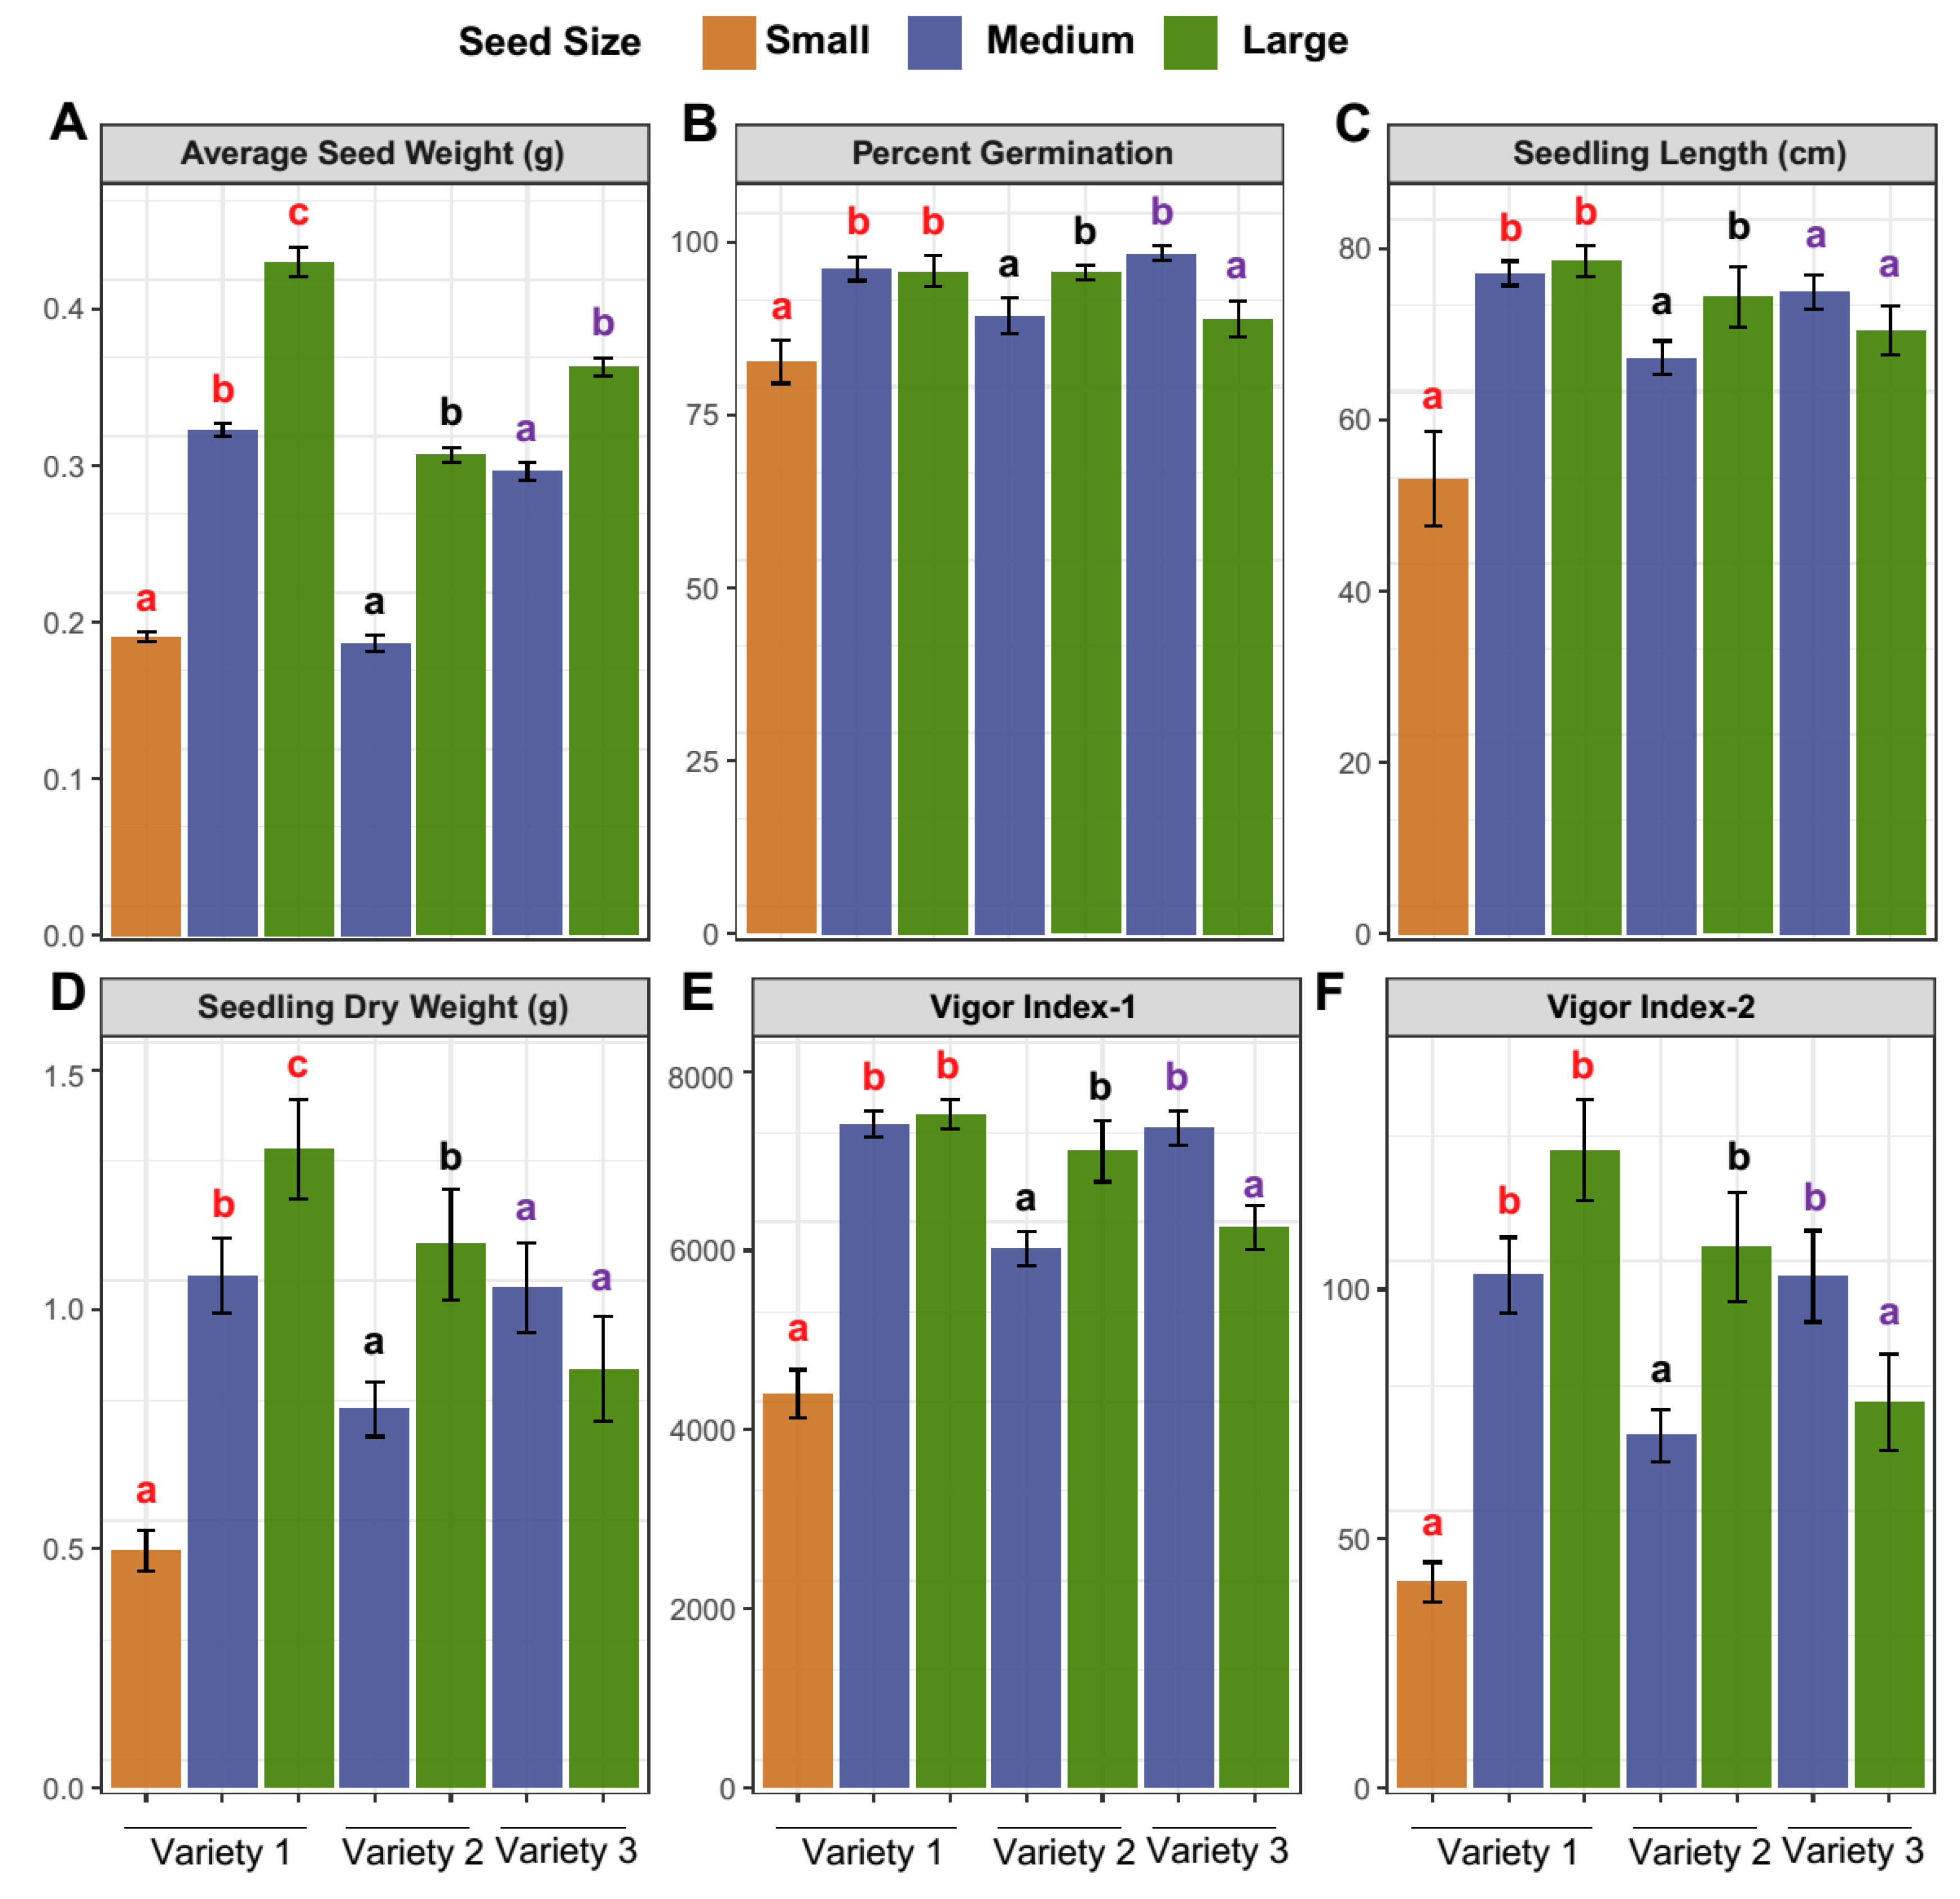
3.2. Biometric Measurements
3.3. Seed Nutritional Profiling
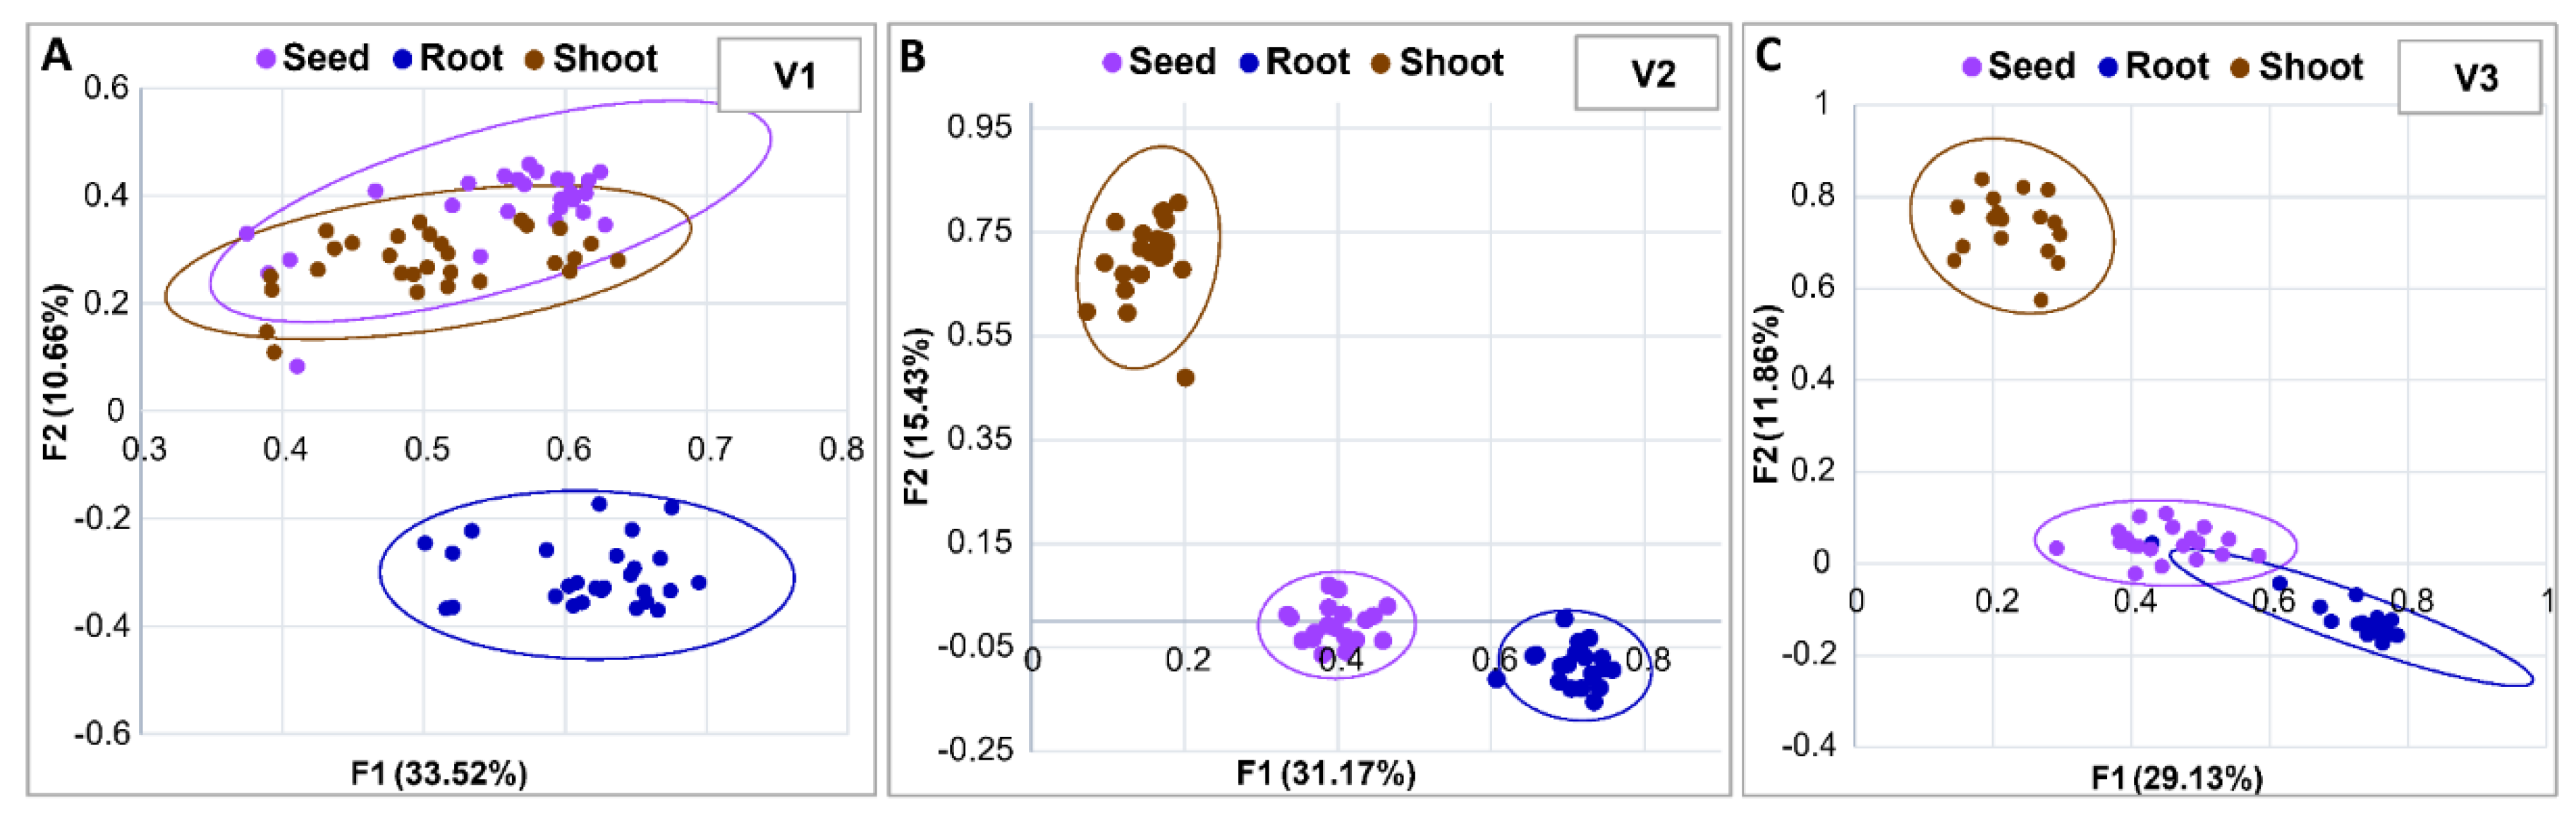
3.4. Microbial Profiling
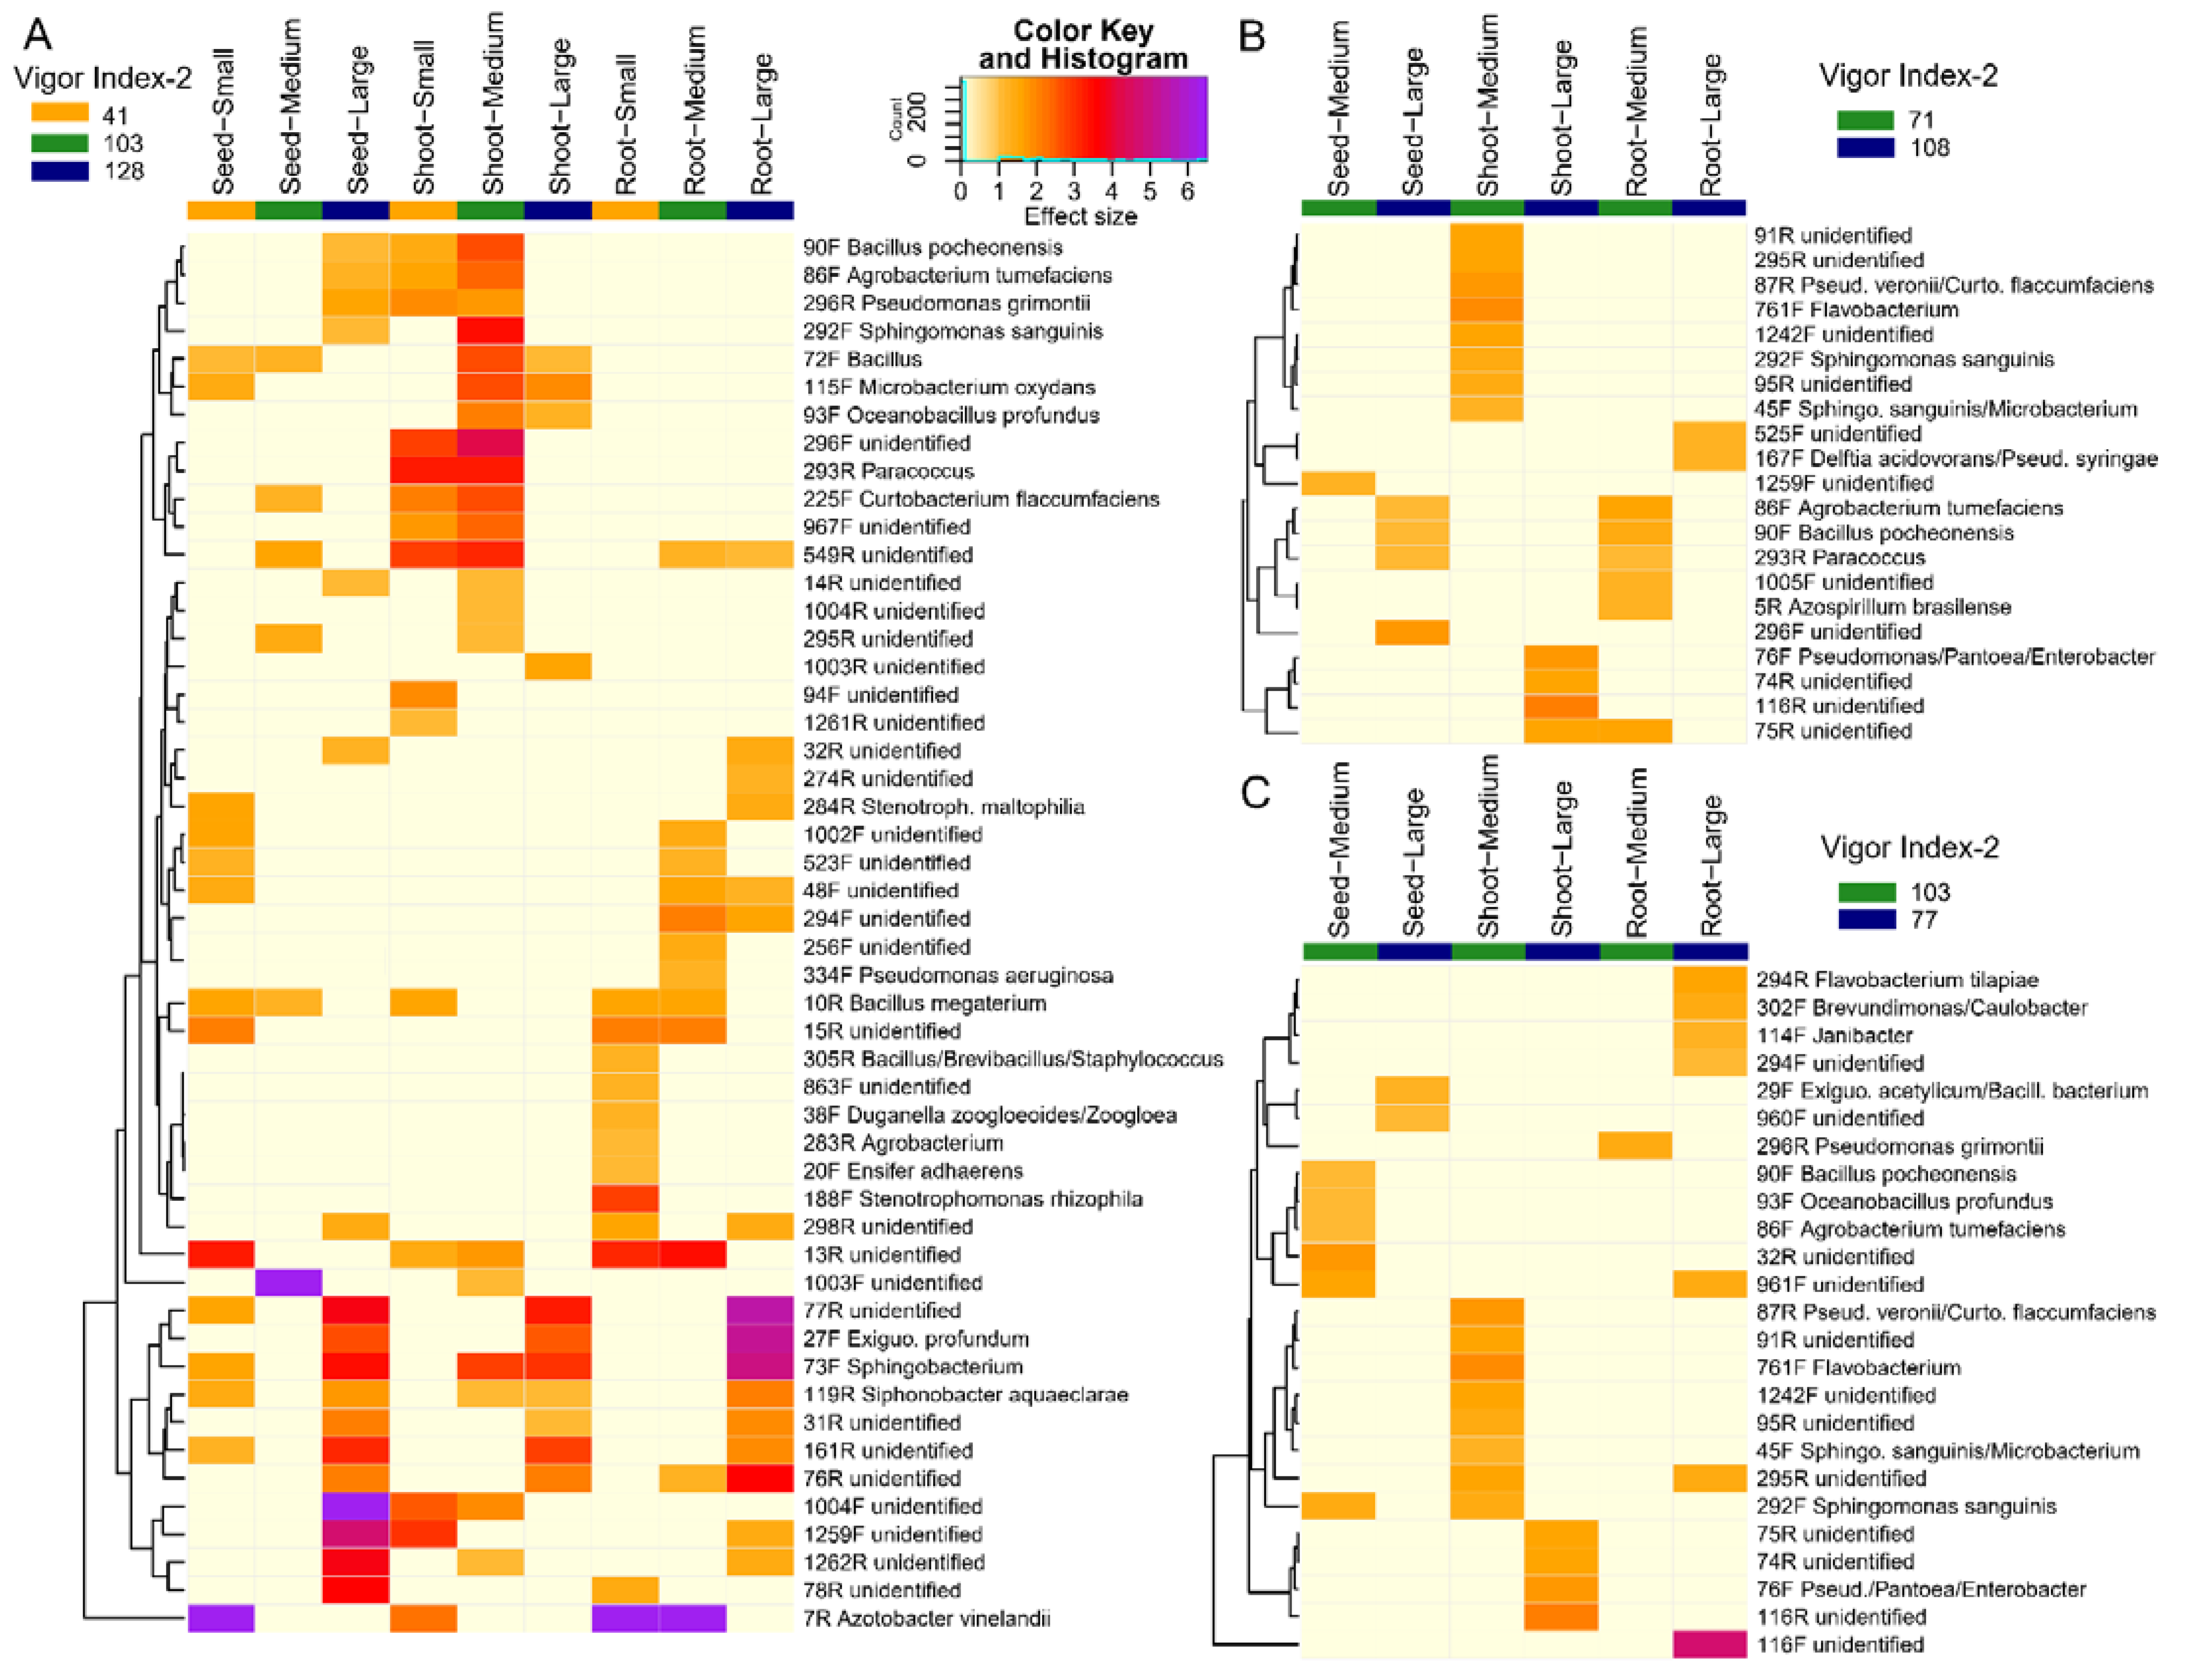
3.5. Probable Taxonomic Identities of Key Microbes
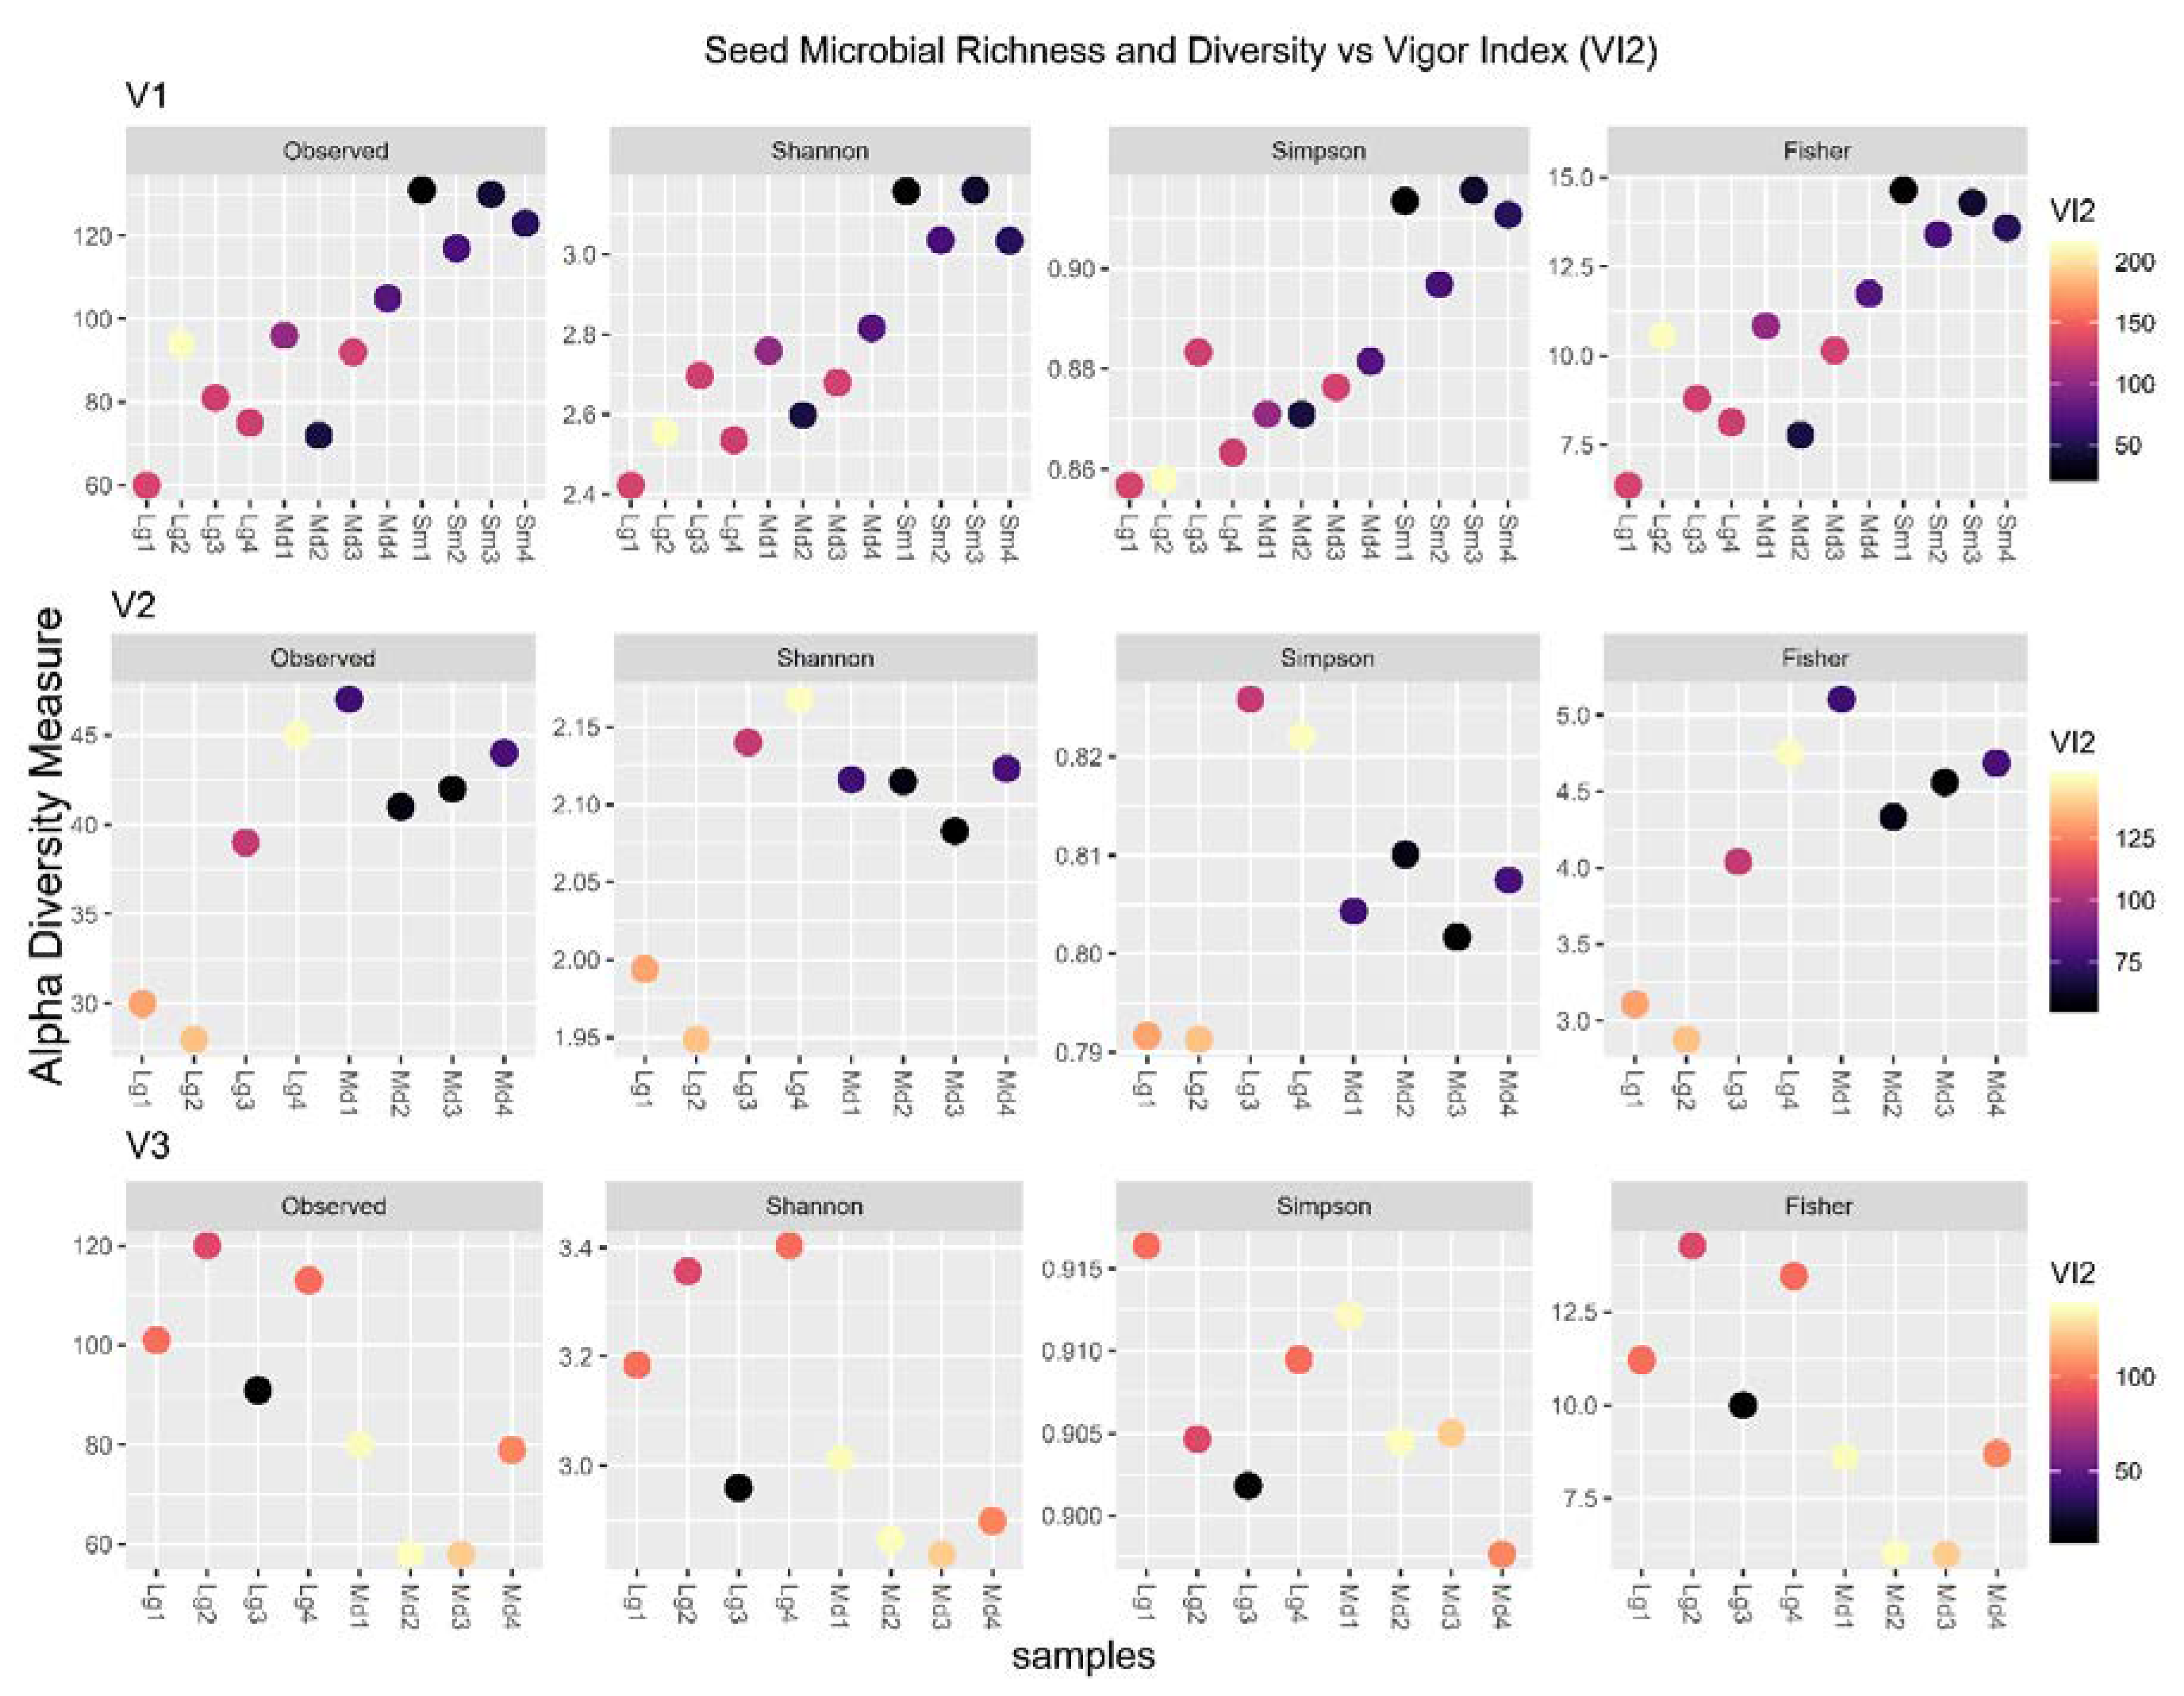
3.6. Microbial Richness and Diversity
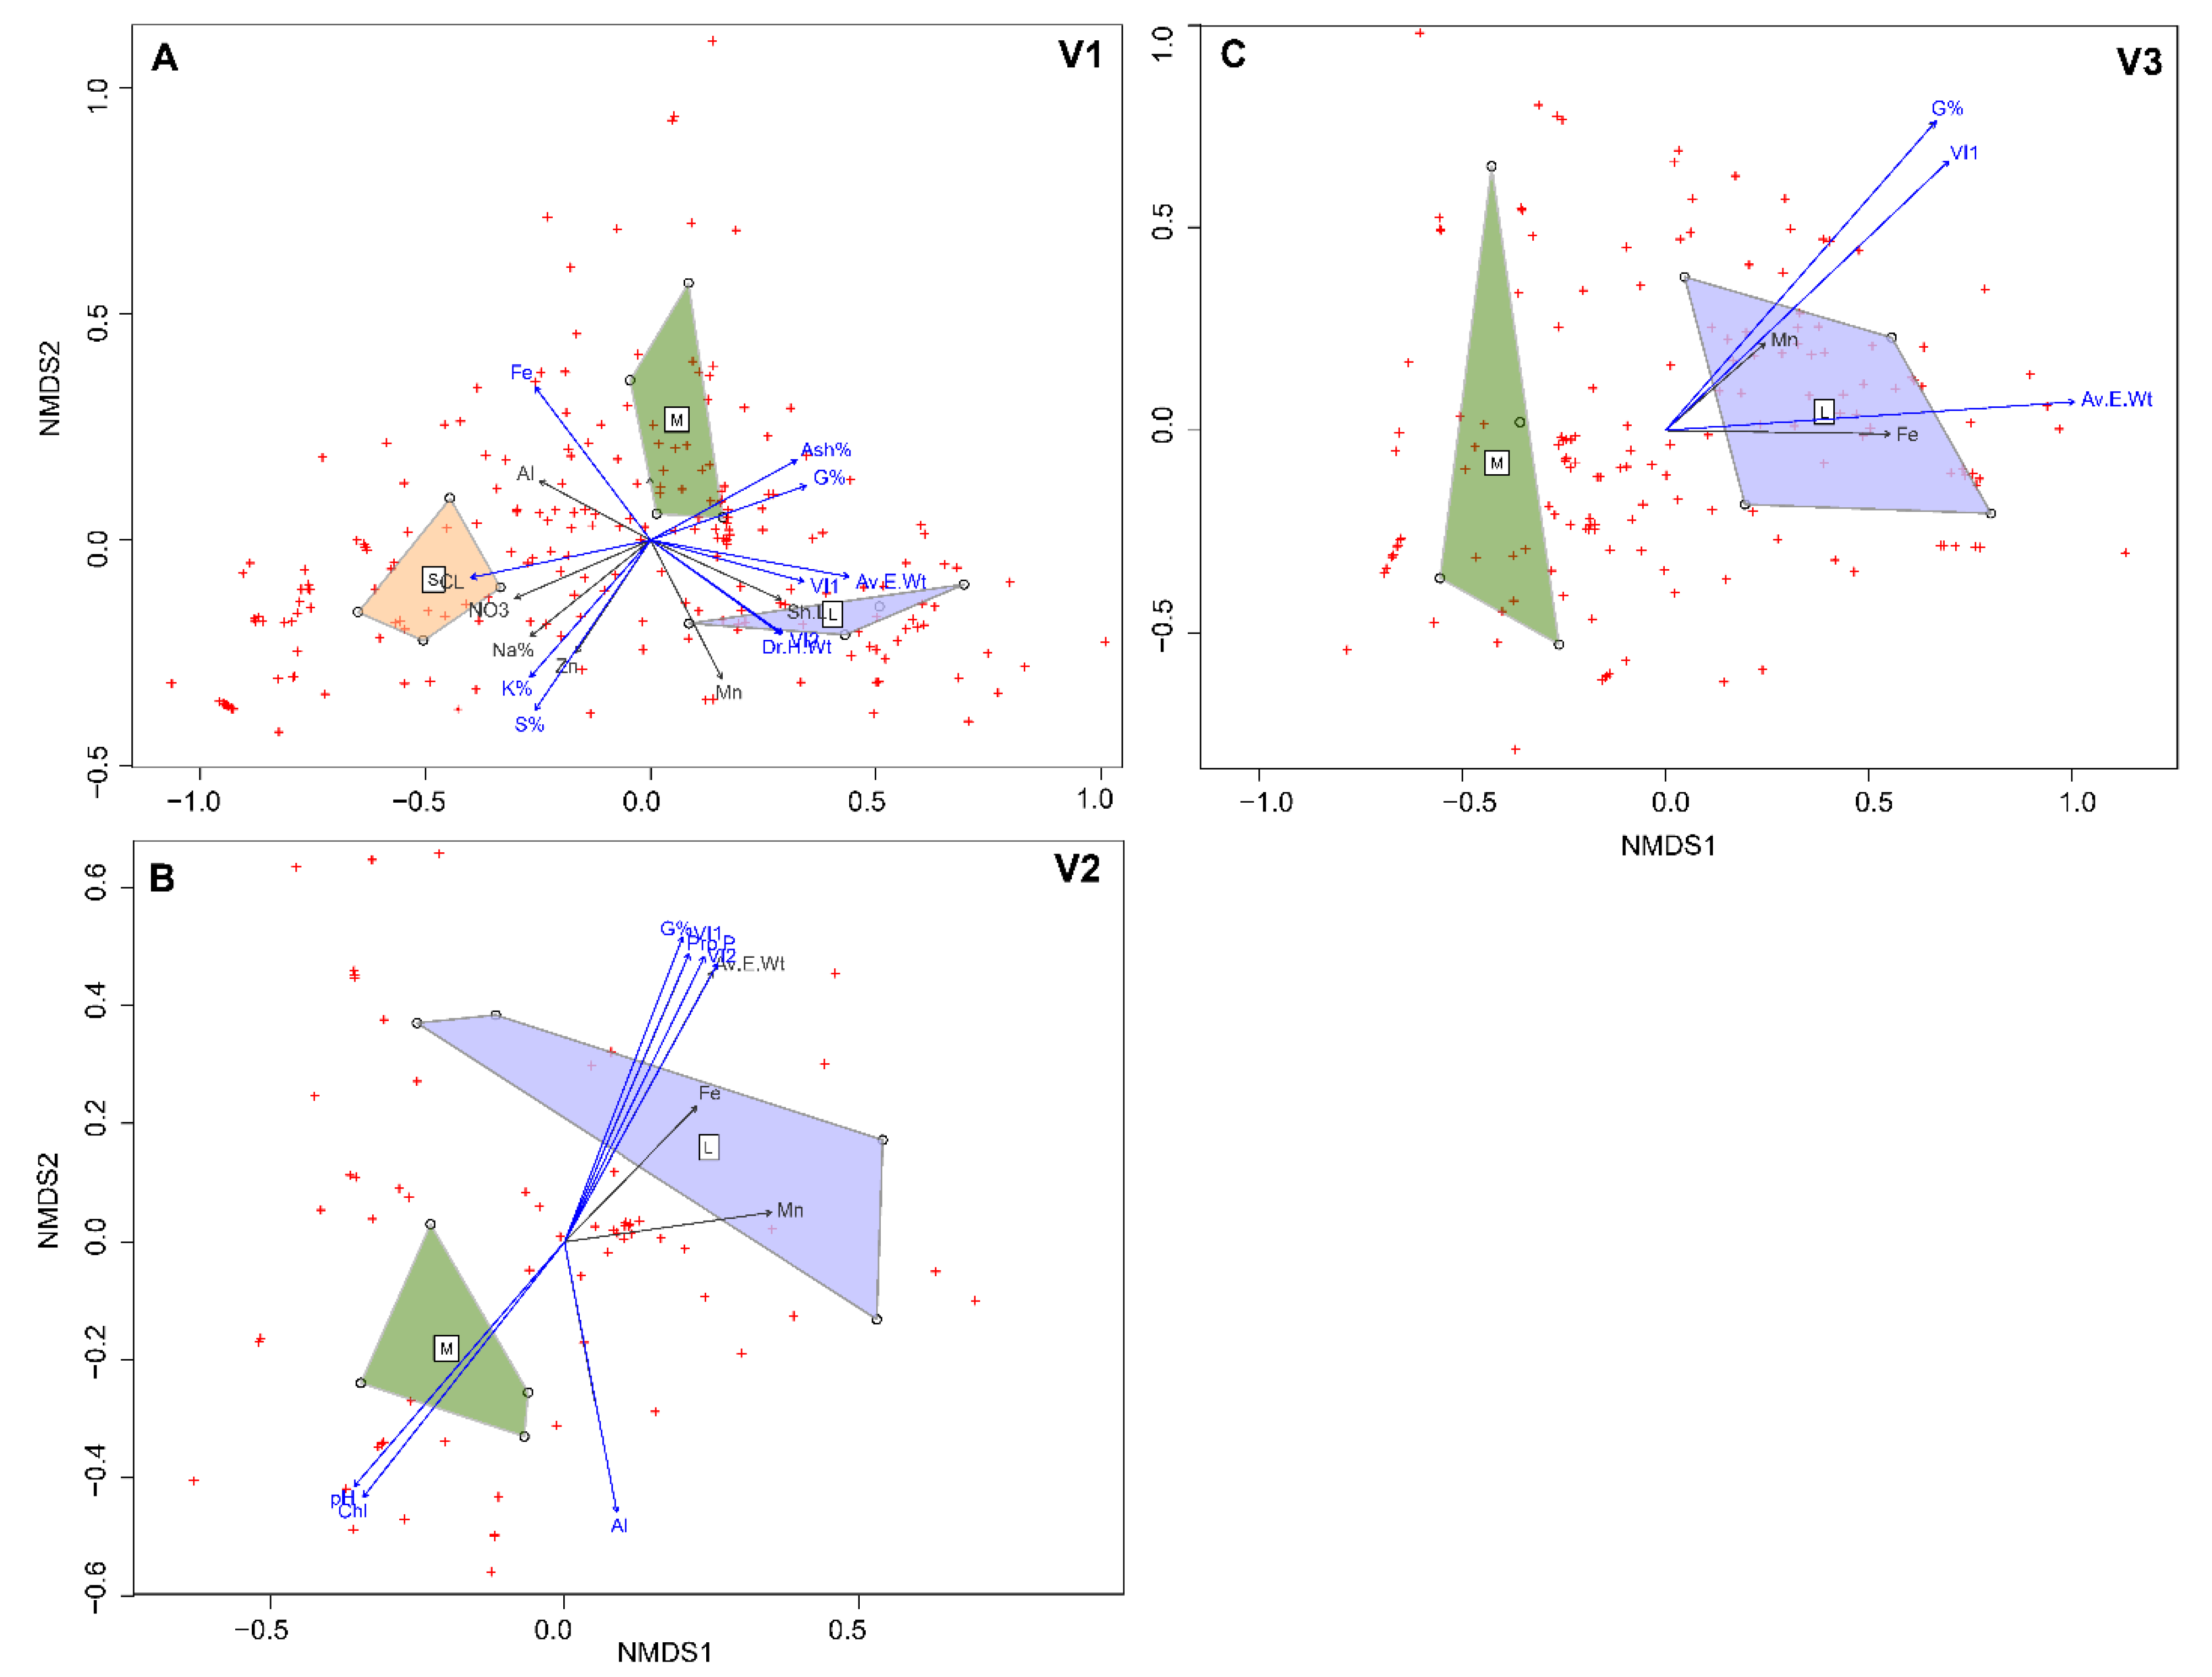
3.7. Interaction of Seed Chemistry, Microbiome and Vigor
4. Discussion
5. Conclusions
Author Contributions
Funding
Acknowledgments
Conflicts of Interest
References
- Dent, K.C.; Stephen, J.R.; Finch-Savage, W.E. Molecular profiling of microbial communities associated with seeds of Beta vulgaris subsp. vulgaris (sugar beet). J. Microbiol. Methods 2004, 56, 17–26. [Google Scholar] [CrossRef]
- Carter, P.R. Selecting Corn Hybrids; University of Wisconsin—Extension: Madison, WI, USA, 1992; p. 3265. [Google Scholar]
- Kaydan, D.; Yagmur, M. Germination, seedling growth and relative water content of shoot in different seed sizes of triticale under osmotic stress of water and NaCl. Afr. J. Biotechnol. 2008, 7, 2862–2868. [Google Scholar]
- Biçer, B.T. The effect of seed size on yield and yield components of chickpea and lentil. Afr. J. Biotechnol. 2009, 8, 1482–1487. [Google Scholar]
- Stougaard, R.N.; Xue, Q. Quality versus quantity: Spring wheat seed size and seeding rate effects on Avena fatua interference, economic returns and economic thresholds. Weed Res. 2005, 45, 351–360. [Google Scholar] [CrossRef]
- Royo, C.; Ramdani, A.; Moragues, M.; Villegas, D. Durum Wheat under Mediterranean Conditions as Affected by Seed Size. J. Agron. Crop Sci. 2006, 192, 257–266. [Google Scholar] [CrossRef]
- Stougaard, R.N.; Xue, Q. Spring wheat seed size and seeding rate effects on yield loss due to wild oat (Avena fatua) interference. Weed Sci. 2004, 52, 133–141. [Google Scholar] [CrossRef]
- Demirlicakmak, A.; Kaufmann, M.L.; Johnson, L.P. V The influence of seed size and seeding rate on yield and yield components of barley. Can. J. Plant Sci. 1963, 43, 330–337. [Google Scholar] [CrossRef]
- Mian, A.R.; Nafziger, E.D. Seed Size Effects on Emergence, Head Number, and Grain Yield of Winter Wheat. J. Prod. Agric. 1992, 5, 265–268. [Google Scholar] [CrossRef]
- Adebisi, M.A.; Okelola, F.S.; Ajala, M.O.; Kehinde, T.O.; Daniel, I.O.; Ajani, O.O. Evaluation of Variations in Seed Vigour Characters of West Afr. Rice (Oryza sativa L.) Genotypes Using Multivariate Technique. Am. J. Plant Sci. 2013, 4, 356–363. [Google Scholar] [CrossRef]
- Wen, D.; Hou, H.; Meng, A.; Meng, J.; Xie, L.; Zhang, C. Rapid evaluation of seed vigor by the absolute content of protein in seed within the same crop. Sci. Rep. 2018, 8, 5569. [Google Scholar] [CrossRef]
- Milosevic, M.; Vujakovic, M.; Karagic, D. Vigour tests as indicators of seed viability. Genetika 2010, 42, 103–118. [Google Scholar] [CrossRef]
- Zhang, A.; Liu, C.; Chen, G.; Hong, K.; Gao, Y.; Tian, P.; Peng, Y.; Zhang, B.; Ruan, B.; Jiang, H.; et al. Genetic analysis for rice seedling vigor and fine mapping of a major QTL qSSL1b for seedling shoot length. Breed. Sci. 2017, 67, 307–315. [Google Scholar] [CrossRef] [PubMed]
- Rybakova, D.; Mancinelli, R.; Wikström, M.; Birch-Jensen, A.-S.; Postma, J.; Ehlers, R.-U.; Goertz, S.; Berg, G. The structure of the Brassica napus seed microbiome is cultivar-dependent and affects the interactions of symbionts and pathogens. Microbiome 2017, 5, 104. [Google Scholar] [CrossRef] [PubMed]
- Biswas, J.C.; Ladha, J.K.; Dazzo, F.B.; Yanni, Y.G.; Rolfe, B.G. Rhizobial Inoculation Influences Seedling Vigor and Yield of Rice. Agron. J. 2000, 92, 880–886. [Google Scholar] [CrossRef]
- Gholami, A.; Shahsavani, S.; Nezarat, S. The effect of plant growth promoting rhizobacteria (PGPR) on germination, seedling growth and yield of maize. Int. J. Agric. Biosyst. Eng. 2009, 3, 35–40. [Google Scholar]
- Nonogaki, H.; Bassel, G.W.; Bewley, J.D. Germination—Still a mystery. Plant Sci. 2010, 179, 574–581. [Google Scholar] [CrossRef]
- Rajjou, L.; Duval, M.; Gallardo, K.; Catusse, J.; Bally, J.; Job, C.; Job, D. Seed Germination and Vigor. Annu. Rev. Plant Biol. 2012, 63, 507–533. [Google Scholar] [CrossRef]
- Malhi, S.S.; Raza, M.; Schoenau, J.J.; Mermut, A.R.; Kutcher, R.; Johnston, A.M.; Gill, K.S. Feasibility of boron fertilization for yield, seed quality and B uptake of canola in northeastern Saskatchewan. Can. J. Soil Sci. 2003, 83, 99–108. [Google Scholar] [CrossRef]
- Abdul-Baki, A.A.; Anderson, J.D. Vigor Determination in Soybean Seed by Multiple Criteria. Crop Sci. 1973, 13, 630. [Google Scholar] [CrossRef]
- Marchesi, J.R.; Sato, T.; Weightman, A.J.; Martin, T.A.; Fry, J.C.; Hiom, S.J.; Wade, W.G. Design and evaluation of useful bacterium-specific PCR primers that amplify genes coding for bacterial 16S rRNA. Appl. Environ. Microbiol. 1998, 64, 795–799. [Google Scholar]
- Osborn, A.M.; Moore, E.R.B.; Timmis, K.N. An evaluation of terminal-restriction fragment length polymorphism (T-RFLP) analysis for the study of microbial community structure and dynamics. Environ. Microbiol. 2000, 2, 39–50. [Google Scholar] [CrossRef] [PubMed]
- Kandasamy, S.; Liu, E.Y.R.; Patterson, G.; Saldias, S.; Ali, S.; Lazarovits, G. Introducing key microbes from high productive soil transforms native soil microbial community of low productive soil. Microbiologyopen 2019, 8, e895. [Google Scholar] [CrossRef] [PubMed]
- Oksanen, J.; Blanchet, F.G.; Kindt, R.; Legendre, P.; Minchin, P.; O’Hara, R.B.; Simpson, G.; Solymos, P.; Stevenes, M.H.H.; Wagner, H. vegan: Community Ecology Package, R package version 2.5-5; 2019. Available online: https://CRAN.R-project.org/package=vegan (accessed on 15 November 2019).
- Fernandes, A.D.; Macklaim, J.M.; Linn, T.G.; Reid, G.; Gloor, G.B. ANOVA-Like Differential Gene Expression Analysis of Single-Organism and Meta-RNA-Seq. PLoS ONE 2013, 8, e67019. [Google Scholar] [CrossRef] [PubMed]
- Warnes, G.R.; Bolker, B.; Bonebakker, L.; Gentleman, R.; Liaw, W.H.A.; Lumley, T.; Maechler, M.; Magnusson, A.; Moeller, S.; Schwartz, M.; et al. gplots: Various R Programming Tools for Plotting Data, R package version 3.0.1.1; 2019. Available online: https://CRAN.R-project.org/package=gplots (accessed on 15 November 2019).
- Adebisi, M.A.; Kehinde, T.O.; Salau, A.W.; Okesola, L.A.; Porbeni, J.B.O.; Esuruoso, A.O.; Oyekale, K.O. Influence of different seed size fractions on seed germination, seedling emergence and seed yield characters in tropical soybean (Glycine max L. Merrill). Int. J. Agric. Res. 2013, 8, 26–33. [Google Scholar] [CrossRef]
- Manonmani, V.; Vanangamudi, K.; RS, V.R. Effect of seed size on seed germination and vigour in Pongamia pinnata. J. Trop. For. Sci. 1996, 9, 1–5. [Google Scholar]
- Ambika, S.; Manonmani, V.; Somasundar, G. Review on Effect of Seed Size on Seedling Vigour and Seed Yield. Res. J. Seed Sci. 2014, 7, 31–38. [Google Scholar] [CrossRef]
- Mondo, V.H.V.; Cicero, S.M.; Dourado-Neto, D.; Pupim, T.L.; Dias, M.A.N. Seed vigor and initial growth of corn crop. J. Seed Sci. 2013, 35, 64–69. [Google Scholar] [CrossRef][Green Version]
- Finch-Savage, W.E. Influence of seed quality on crop establishment, growth and yield. In Seed Quality: Basic Mechanisms and Agricultural Implications; Basra, A.S., Ed.; Food Products Press: New York, NY, USA, 1995; pp. 361–384. [Google Scholar]
- Egli, D.B.; Rucker, M. Seed Vigor and the Uniformity of Emergence of Corn Seedlings. Crop Sci. 2012, 52, 2774. [Google Scholar] [CrossRef]
- Hofs, J.-L.; Schoeman, A.; Vaissayrel, M. Effect of Bt cotton on arthropod biodiversity in South Afr. cotton fields. Commun. Agric. Appl. Biol. Sci. 2004, 69, 191. [Google Scholar]
- Gaur, P.M.; Samineni, S.; Krishnamurthy, L.; Varshney, R.K.; Kumar, S.; Ghanem, M.E.; Beebe, S.E.; Rao, I.M.; Chaturvedi, S.K.; Basu, P.S. High temperature tolerance in grain legumes. Legum. Perspect. 2015, 7, 23–24. [Google Scholar]
- Nemeskéri, E.; Molnár, K.; Rácz, C.; Dobos, A.; Helyes, L. Effect of Water Supply on Spectral Traits and Their Relationship with the Productivity of Sweet Corns. Agronomy 2019, 9, 63. [Google Scholar]
- Eggert, K.; von Wirén, N. The role of boron nutrition in seed vigour of oilseed rape (Brassica napus L.). Plant Soil 2015, 402, 63–76. [Google Scholar] [CrossRef]
- Hänsch, R.; Mendel, R.R. Physiological functions of mineral micronutrients (Cu, Zn, Mn, Fe, Ni, Mo, B, Cl). Curr. Opin. Plant Biol. 2009, 12, 259–266. [Google Scholar] [CrossRef] [PubMed]
- Venuto, B.C.; Redfearn, D.D.; Pitman, W.D.; Alison, M.W. Seed variation among annual ryegrass cultivars in south-eastern USA and the relationship with seedling vigour and forage production. Grass Forage Sci. 2002, 57, 305–311. [Google Scholar]
- Nelson, D.R.; Mele, P.M. Subtle changes in rhizosphere microbial community structure in response to increased boron and sodium chloride concentrations. Soil Biol. Biochem. 2007, 39, 340–351. [Google Scholar] [CrossRef]
- Nelson, E.B. The seed microbiome: Origins, interactions, and impacts. Plant Soil 2018, 422, 7–34. [Google Scholar]
- Begna, S.H.; Hamilton, R.I.; Dwyer, L.M.; Stewart, D.W.; Cloutier, D.; Assemat, L.; Foroutan-pour, K.; Smith, D.L. Morphology and yield response to weed pressure by corn hybrids differing in canopy architecture. Eur. J. Agron. 2001, 14, 293–302. [Google Scholar]
- Zhao, Z.; Wu, L.; Nian, F.; Ding, G.; Shi, T.; Zhang, D.; Shi, L.; Xu, F.; Meng, J. Dissecting Quantitative Trait Loci for Boron Efficiency across Multiple Environments in Brassica napus. PLoS ONE 2012, 7, e45215. [Google Scholar] [CrossRef]
- Adams, P.D.; Kloepper, J.W. Effect of host genotype on indigenous bacterial endophytes of cotton (Gossypium hirsutum L.). Plant Soil 2002, 240, 181–189. [Google Scholar] [CrossRef]
- Truyens, S.; Weyens, N.; Cuypers, A.; Vangronsveld, J. Changes in the population of seed bacteria of transgenerationally Cd-exposed Arabidopsis thaliana. Plant Biol. 2012, 15, 971–981. [Google Scholar]
- Hardoim, P.R.; van Overbeek, L.S.; Berg, G.; Pirttilä, A.M.; Compant, S.; Campisano, A.; Döring, M.; Sessitsch, A. The hidden world within plants: Ecological and evolutionary considerations for defining functioning of microbial endophytes. Microbiol. Mol. Biol. Rev. 2015, 79, 293–320. [Google Scholar] [CrossRef] [PubMed]
- Berg, G.; Smalla, K. Plant species and soil type cooperatively shape the structure and function of microbial communities in the rhizosphere. FEMS Microbiol. Ecol. 2009, 68, 1–13. [Google Scholar] [CrossRef]
- Cardinale, M.; Grube, M.; Erlacher, A.; Quehenberger, J.; Berg, G. Bacterial networks and co-occurrence relationships in the lettuce root microbiota. Environ. Microbiol. 2014, 17, 239–252. [Google Scholar] [CrossRef] [PubMed]
- Lundberg, D.S.; Lebeis, S.L.; Paredes, S.H.; Yourstone, S.; Gehring, J.; Malfatti, S.; Tremblay, J.; Engelbrektson, A.; Kunin, V.; del Rio, T.G.; et al. Defining the core Arabidopsis thaliana root microbiome. Nature 2012, 488, 86–90. [Google Scholar] [CrossRef] [PubMed]
- Adebisi, M.; Ojo, D.K. Effect of Genotypes on Soyabean Seed Quality Development under West Afr. Rainfed Conditions. Pertanika J. Trop. Agric. Sci. 2001, 24, 139–146. [Google Scholar]
- Jones, N. Food fuelled with fungi. Nature 2013, 504, 199. [Google Scholar] [CrossRef] [PubMed][Green Version]
- Vujanovic, V.; Germida, J. Seed endosymbiosis: A vital relationship in providing prenatal care to plants. Can. J. Plant Sci. 2017, 97, 972–981. [Google Scholar] [CrossRef]
- Sessitsch, A.; Mitter, B. 21st century agriculture: Integration of plant microbiomes for improved crop production and food security. Microb. Biotechnol. 2014, 8, 32–33. [Google Scholar] [CrossRef]
- Wubs, E.R.J.; van der Putten, W.H.; Bosch, M.; Bezemer, T.M. Soil inoculation steers restoration of terrestrial ecosystems. Nat. Plants 2016, 2, 16107. [Google Scholar] [CrossRef]
- Rodríguez-Caballero, G.; Caravaca, F.; Fernández-González, A.J.; Alguacil, M.M.; Fernández-López, M.; Roldán, A. Arbuscular mycorrhizal fungi inoculation mediated changes in rhizosphere bacterial community structure while promoting revegetation in a semiarid ecosystem. Sci. Total Environ. 2017, 584, 838–848. [Google Scholar] [CrossRef]


| Variety | Variety Name | Size | Contribution to Seed Lot % | Yield Potential % | Yield Loss Potential % | Contribution to Yield Loss % | Potential Yield Loss % |
|---|---|---|---|---|---|---|---|
| 1 | P9998AMXT | Small | 31 | 30 | 70 | 21.08 | 25.28 |
| Medium | 21 | 80 | 20 | 4.20 | |||
| Large | 48 | 100 | - | - | |||
| 2 | P0157AMXT | Small | <3% | - | - | - | 7.14 |
| Medium | 21 | 66 | 34 | 7.14 | |||
| Large | 79 | 100 | - | - | |||
| 3 | DKC48-56RIB | Small | <3% | - | - | - | 22.38 |
| Medium | 10.5 | 100 | - | - | |||
| Large | 89.5 | 75 | 25 | 22.38 |
| Particulars | V1-Small | V1-Medium | V1-Large | V2-Medium | V2-Large | V3-Medium | V3-Large |
|---|---|---|---|---|---|---|---|
| Ash (%) | 0.30a | 0.86b | 1.11b | 1.58 | 1.69 | 1.20 | 1.02 |
| Acid Detergent Fiber (ADF) (%) | 2.73 | 3.20 | 2.83 | 2.68 | 2.94 | 3.38 | 3.39 |
| Fat (%) | 3.51 | 3.14 | 3.14 | 3.62 | 3.52 | 3.80 | 3.89 |
| Starch (%) | 58.77 | 57.27 | 60.10 | 59.59 | 58.27 | 57.21 | 57.09 |
| Crude protein (%) | 10.78 | 10.92 | 11.51 | 9.57a | 9.95b | 10.76 | 11.43 |
| Water Soluble Sugars (WSS) (%) | 2.61 | 2.86 | 2.81 | 2.80 | 2.98 | 3.18 | 3.37 |
| pH | 6.12 | 6.11 | 6.11 | 6.18a | 6.13b | 6.05 | 6.03 |
| Nitrate Nitrogen [NO3-N] (%) | 0.08 | 0.06 | 0.05 | 0.06 | 0.06 | 0.07 | 0.07 |
| Phosphorus [P] (%) | 0.32 | 0.28 | 0.31 | 0.30 | 0.29 | 0.31 | 0.32 |
| Potassium [K] (%) | 0.40a | 0.33b | 0.33b | 0.32 | 0.30 | 0.34 | 0.34 |
| Calcium [Ca] (%) | 0.03 | 0.02 | 0.03 | 0.03 | 0.03 | 0.03 | 0.03 |
| Magnesium [Mg] (%) | 0.11 | 0.10 | 0.12 | 0.10 | 0.11 | 0.11 | 0.12 |
| Sulphur [S] (%) | 0.16a | 0.13b | 0.13b | 0.11 | 0.11 | 0.14 | 0.14 |
| Boron [B] (µg/g) | 1.49 | 1.61 | 1.91 | 1.20 | 1.33 | 1.48 | 1.32 |
| Copper [Cu] (µg/g) | 2.22 | 2.77 | 2.15 | 1.89 | 2.20 | 2.70 | 2.92 |
| Iron [Fe] (µg/g) | 10.8a | 11.8b | 40c | 35a | 38b | 28a | 49b |
| Manganese [Mn] (µg/g) | 5.21a | 5.25a | 6.33b | 3.35 | 3.62 | 5.29a | 6.92b |
| Zinc [Zn] (µg/g) | 23.04a | 15.11b | 18.29b | 16.35 | 16.69 | 21.86 | 22.64 |
| Chloride [CL] (%) | 27.71a | 9.30b | 4.50b | 12.34 | 14.46 | 12.87 | 11.79 |
| Aluminum [Al] (µg/g) | 6.30a | 5.54b | 4.43c | 5.73a | 3.98b | 5.25 | 5.24 |
| Sodium [Na] (%) | 0.03 | 0.02 | 0.02 | 0.02 | 0.02 | 0.02 | 0.02 |
© 2020 by the authors. Licensee MDPI, Basel, Switzerland. This article is an open access article distributed under the terms and conditions of the Creative Commons Attribution (CC BY) license (http://creativecommons.org/licenses/by/4.0/).
Share and Cite
Kandasamy, S.; Weerasuriya, N.; Gritsiouk, D.; Patterson, G.; Saldias, S.; Ali, S.; Lazarovits, G. Size Variability in Seed Lot Impact Seed Nutritional Balance, Seedling Vigor, Microbial Composition and Plant Performance of Common Corn Hybrids. Agronomy 2020, 10, 157. https://doi.org/10.3390/agronomy10020157
Kandasamy S, Weerasuriya N, Gritsiouk D, Patterson G, Saldias S, Ali S, Lazarovits G. Size Variability in Seed Lot Impact Seed Nutritional Balance, Seedling Vigor, Microbial Composition and Plant Performance of Common Corn Hybrids. Agronomy. 2020; 10(2):157. https://doi.org/10.3390/agronomy10020157
Chicago/Turabian StyleKandasamy, Saveetha, Nimalka Weerasuriya, Daniella Gritsiouk, Greg Patterson, Soledad Saldias, Shimaila Ali, and George Lazarovits. 2020. "Size Variability in Seed Lot Impact Seed Nutritional Balance, Seedling Vigor, Microbial Composition and Plant Performance of Common Corn Hybrids" Agronomy 10, no. 2: 157. https://doi.org/10.3390/agronomy10020157
APA StyleKandasamy, S., Weerasuriya, N., Gritsiouk, D., Patterson, G., Saldias, S., Ali, S., & Lazarovits, G. (2020). Size Variability in Seed Lot Impact Seed Nutritional Balance, Seedling Vigor, Microbial Composition and Plant Performance of Common Corn Hybrids. Agronomy, 10(2), 157. https://doi.org/10.3390/agronomy10020157