Article

The Correct Cover Crop Species Integrated with Slurry Can Increase Biomass, Quality and Nitrogen Cycling to Positively Affect Yields in a Subsequent Spring Barley Rotation

1
Agri-Food and Biosciences Institute, Crossnacreevy BT6 9SH, UK
2
Institute for Global Food Security, School of Biological Sciences, Queen’s University Belfast, Belfast BT9 5DL, Northern Ireland, UK
*
Author to whom correspondence should be addressed.
The author has been retired.
Agronomy 2020, 10(11), 1760; https://doi.org/10.3390/agronomy10111760
Submission received: 9 October 2020 / Revised: 4 November 2020 / Accepted: 6 November 2020 / Published: 12 November 2020
(This article belongs to the Special Issue Impacts of Cover Crop Management Strategies on Soil Health)

Abstract

:
The aim of this study is to identify species of cover crops that cause an increase in biomass and total nutrient accumulation in response to manure/slurry. This could improve nutrient efficiency and intensify the benefits from over-winter cover crops in arable rotations and improve following commercial crop yields. In a pot experiment, sixteen cover crops were grown for 100 days in response to slurry. Growth and nutrient (N, P, K, Mg and S) accumulation were measured, and then residue was reincorporated into the soil with spring barley (Hodeum vulgare L.) sown and harvested for yield. In response to slurry, tillage radish (Raphanus sativus L.) increased N accumulation by 101% due to a significant increase in biomass and % N (p < 0.05) over its relative control plots. Significant interactions between species and the application of slurry were found in cover crop biomass, cover crop and spring barley nutrient uptake, as well as cover crop carbon accumulation, particularly in the brassica species used. Slurry integrated with cover crops both reduced the cover crop C:N ratio and enhanced nutrient cycling compared to the control when soil mineral nitrogen (SMN) and spring barley crop N offtake were pooled. However, this was not observed in the legumes. This study shows that slurry integration with cover crops is a promising sustainable farming practice to sequester N and other macro-nutrients whilst providing a range of synergistic benefits to spring barley production when compared to unplanted/fallow land rotations. However, this advantage is subject to use of responsive cover crop species identified in this study.

1. Introduction

Globally, an estimated 33% of soils are degraded [1]. In response, a global soil partnership was formed to converge both policy and research to identify and integrate pillars of action and priorities. Cover crops were identified to have considerable potential to address such priorities by both enhancing and stabilising stores of soil organic matter and reducing the use of nitrogen (N) and phosphorous (P) [1]. There is increasing evidence that cover crops can provide weed, pest and disease control [2,3,4,5,6] and reduce nutrient loss [7,8,9]. However, harnessing the benefits from cover crops, for both soil and commercial crops, is highly dependent on species choice and management [10] and both quantity and quality of the biomass produced [11]. Maximising the biomass of cover crops is desirable as it has been found that their benefits to soil biology are associated with the amount of biomass produced [12,13]. Cover crops also offer weed suppression through smothering [14] and allelopathy [15] which is key to sustainable weed management. Exploiting the natural evapotranspiration of cover crops has been highlighted as an effective strategy against rainfall variability when in excess and also when limiting to plant growth: through improved storage, field water capacity and plant available water [16,17]. Limited research has evaluated cover crops for their potential to use water through evapotranspiration and how this varies between different species. Cover crops are also an effective way to add organic matter to soil and can help slow down the decline of carbon (C) stocks, which occurs during tillage and intensive crop production [6,18]. Cover crop biomass also affects overall C and N return and cycling [19]. Maximising this could offer many benefits. However, when the cover crops are destroyed the residue that is added to the soil can introduce additional variability in nutrient supply to the commercial crop, specifically N, with a possibility of immobilisation [20]. Nutrient mineralisation rates of residue are affected by factors including soil type, temperature, residue quality, which is species dependent, and other factors [3,21]. N immobilisation increases when the quantity of biomass is increased [22]. This means cover crops can negatively affect grain yields due to low N mineralisation from the residue [23], although species selection can overcome this to enhance N supply to the commercial crop and increase yields [24,25]. A legume cover crop of field beans (Vicia faba L.) in Switzerland managed to biologically fix an estimated maximum of 172 kg N/ha whereas chickpea (Cicer arietinum L.) fixed2 kg N/ha [26]. Therefore, the correct legume species is crucial to can enhance soil N. Cover crop species choice is influenced by site-specific soil and climatic conditions [7], making identification of suitable families and species critical.
Spring barley in Northern Ireland (NI) accounts for over 40% of the total cereal area of 33,500 ha. This results in a large proportion of land devoted to cereals lying fallow over-winter for nearly half the year. Other spring-sown cereals and vegetable crops also add to this fallow area [27]. This fallow land is at greater risk of degradation compared to land with a growing crop, with the risk predominantly caused by high rainfall, and lack of ground cover to protect the soil from erosion [28,29]. Additionally, the animal farming sector in NI) creates a vast quantity of organic manure estimated at 10 million tonnes annually [30]. This is a cost-effective source of nutrients essential for farming and environmental sustainability, the recycling of nutrients required for crop growth and to decrease dependence on inorganic fertiliser requirements [31]. The Department of Agriculture, Environment and Rural Affairs (DAERA) Nitrates Action Programme (NAP) restricts the spreading of manures over winter (“closed period” is 15th October–31st January) in NI [32]. The high capital cost required for storage, estimated at around 70–80 €/m3 [33], consequently means that these manures are often applied as late as possible to the “closed period” to reduce storage cost. Nitrogen (N) uptake in the subsequent crop following autumn applications is around 5–35% depending on type and rate of manure, whereas spring applications have higher efficiencies of 50–60% [34]. Autumn applications are applied to either stubble, preceding winter crops, or grassland where uptake and storage by the crop can be poor due to limited growth. The low efficiency is primarily due to leaching caused by excess rainfall, which washes nutrients below the rhizosphere [35]. Whilst this is a regional issue highlighted, it is not a localised problem, as Cambardella, Moorman [36] highlighted that over one billion tonnes of N is excreted from swine manure annually in the United States [37] and similar problems of N leaching and P loss are experienced. Cover crops have been found to reduce leaching on average by 43% and, on a clay soil, a cover crop of perennial ryegrass (Lolium perenne L.) reduced N leaching by 85 to 89% [7]. N immobilisation in cover crop biomass can directly reduce soil mineral N (SMN) which minimises the downward leaching of N [38]. Therefore, cover crops offer considerable potential to reduce N leaching in a high winter rainfall climate [39]. Studies on integrating organic manures and cover crops have shown increased biomass growth of the cover crops [40] and a subsequent increase in cover crop N uptake [40,41,42] and reduction in SMN over-winter [36,43]. However, these studies have shown that the selection of species that are best suited to region/climate to be critical [43].
The integration of cover crops and slurry requires research to find responsive species in terms of not only increased N uptake but also if there is a beneficial effect on commercial crop yield and N uptake/supply. Using a mesocosm trial to help understand the complex plant–soil–slurry interaction will help facilitate identifying species that provide benefits such weed suppression, increased N supply to the commercial crop to increase grain yield. This could lead to increased cover crop use by farmers, so indirectly implementing the many benefits they provide. Thus, an array of species from a range of families should be evaluated to find best-suited species to this practice along with the effects on N cycling and commercial crop yield. It is hypothesised that: (i) legumes will lead to increased spring barley yield over non-leguminous species due to greater N cycling (defined as total N offtake in the grain and straw), and (ii) slurry integrated with cover crops will be more beneficial than when applied to the control in terms of grain yield and overall N offtake.

2. Materials and Method

A pot experiment was conducted with 16 species of cover crop and a control (no cover crop) in response to an application of pig slurry. These species were evaluated for growth, effect on weeds, water usage, N and C accumulation as well as the effect on the grain and straw yield and N content of the subsequent crop of spring barley.

2.1. Experimental Design

The experimental design was a randomised, split plot, with four replicates of 17 treatments (16 species plus the control) with and without slurry. Species are listed in the Appendix Table A1 along with their suggested sowing rates recommended from literature and guides for Ireland and the UK [44]. Species were chosen from those that breeders and merchants in the UK are currently recommending. Of all species in this trial, a subset of the best performing species from different families was selected for further analysis of N determination of the spring barley grain and straw plus chaff (non-stem or grain proportions of the spring barley) fractions and also SMN. This subset was decided by selecting cover crops from a range of families that produced large/sufficient amounts of biomass and led to a high spring barley grain yield.

2.2. Mesocosm Set Up

Twenty two kilograms of soil (35.8% sand, 38.6% silt and 25.8% clay), which is relatively typical of NI arable soils) at 67.8% dry matter (DM), was added to large pots measuring 50 cm tall with a diameter of 22.5 cm, giving a soil volume of 17,137 cm−3 and a bulk density of 0.87 kg/l DM or 1.28 kg/l fresh weight. Soil nutrient analysis was conducted in accordance with standard ADAS methods [45] (Table 1). The mesocosms were designed to allow ample depth for sufficient root growth and the large diameter provided ample area to sow the cover crops at representative sowing rates.
One application of 180 mL of pig slurry (Table 2), representing a field application rate of 45.2 m3/ha (50 m3/ha NI legislative maximum individual application), was applied to half the pots, with the other half receiving 180 mL of tap water as a control. The top 5 cm of soil in all pots were then mixed using a trowel.
The species were sown according to their recommended seed rate (Table A1) at advised depths (based on available recommendations). To maintain a water-holding capacity (WHC) of 70%, the pots were weighed with water applied using sprinkler nozzles to simulate rainfall to bring the pots back up to the original weight. Total water usage for each species was the total weight of water applied during the 100 days of cover crop growth to maintain 70% WHC.

2.3. Greenhouse Heat and Light

The pots were kept in glass greenhouses for 102 days from 31 October 2017 (
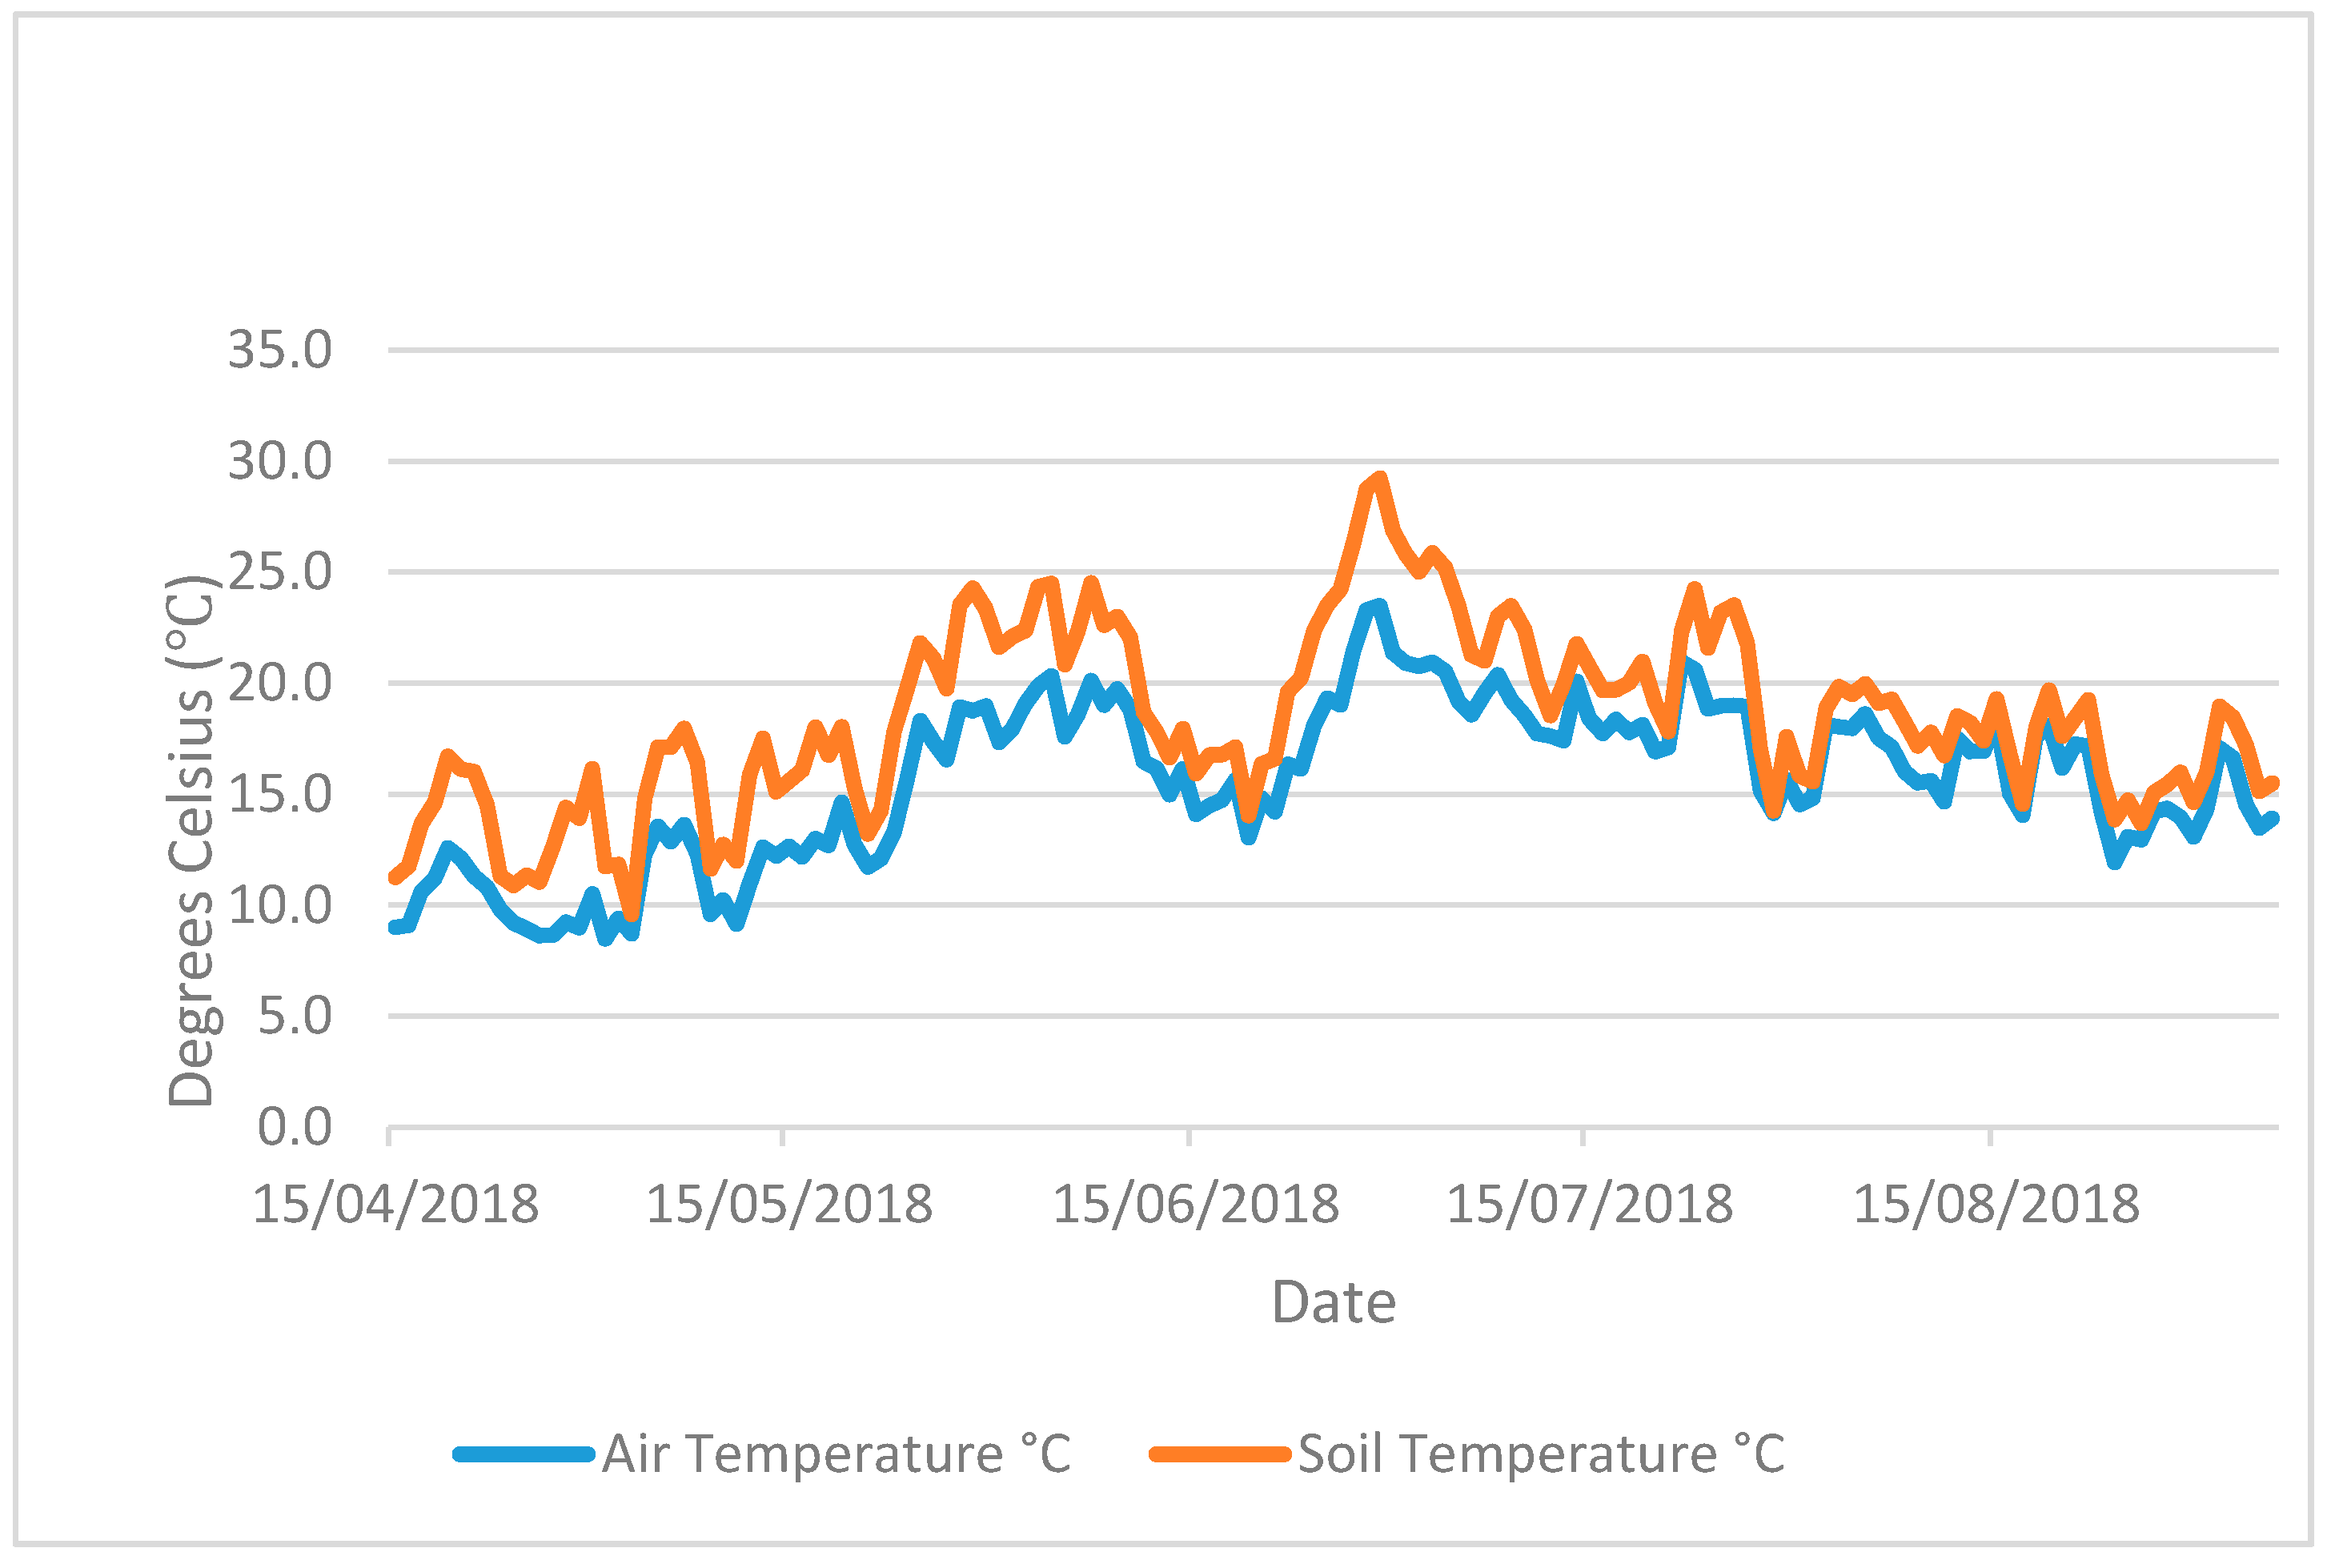
Figure A3). Soil and ambient air temperature (Figure A1 and Figure A2) were logged using a Tinytag Plus 2 TGP-4510 datalogger and a soil probe (PB-5001) measuring to a soil depth of 15 cm. Artificial lights provided an additional PAR (photosynthetically active radiation) of 175 µmol/m−2 s−1 above natural daylight during the hours of 4.30 pm to 8.30 am. The artificial light and heat provided were designed to represent a growing season of cover crops sown in early August and harvested/returned to soil in February–April and to prevent freezing.

2.4. Cover Crop Sampling

After 100 days of growth, the cover crops were cut at ground level and the biomass divided by hand into cover crops and weeds. The cover crop biomass was chopped to a maximum length of 3 cm, with a 50 g representative subsample removed and then dried at 60 °C for 48 h (i.e., until there was no further weight decrease). The remaining biomass was added back to its original pot and incorporated into the soil to a depth of 10 cm; the weeds were not reincorporated. The control, with its weeds, was treated as a cover crop hence it does not appear under weed biomass production in the tables/figures. Brassica cover crops had the taproots removed and weighed separately. These roots from the brassica species were not reincorporated into the soil and consequently would have removed minor amounts of N. The rationale was that brassicas produce larger root biomass, which is a considerable proportion of their overall biomass [3] compared to other cover crop species.

2.5. C and N Determination of Cover Crop Biomass

The dried biomass samples of aboveground shoots were milled to 1.0 mm by a Cyclotec 293 mill (FOSS, Warrington, Britain). N and C content were analysed using the Dumas dry combustion method with a Trumac CN analyser (Leco Corporation, St. Joseph, MI, USA) with a furnace temperature of 1350 °C. Quality controls included an in-house verified reference material run with every 20 samples. Accumulated N offtake was calculated as percentage N (% N) multiplied by cover crop biomass. Roots were not analysed for N accumulation due to many species not producing a sufficient sample for analysis after milling losses.

2.6. Energy Dispersive X-ray Fluorescence (EDXRF) Analysis

EDXRF was used to measure a broad-spectrum nutrient profile in a select list of the best performing cover crops. Quantities of 2.5–3.5 g (species depending) of milled biomass samples were loaded into sample-cups to a depth >4 mm. To create a pellet, 300 pounds per square inch (PSI) was applied for 20 s. A suitable certified reference material (mixed Polish herbs INCT-MPH-2) was used in each batch of sample allowing recoveries to be detected and coefficient of variation (CV) to be gauged. Only recoveries of 100 ± 20% with a maximum CV of 10% were used as parameters to accept the specific nutrients from the profile measured (Table 3.). Nutrient uptakes were calculated by multiplying cover crop biomass by production by its relative concentration. The nutrient accumulation of the weeds was not added onto the results shown.

2.7. Sowing of Spring Barley

The pots were moved out of the greenhouse on 16th February 2018 and left outside thereafter. They were sown on 15 April 2018 with spring barley cv. KWS Irina, a widely-used variety in the UK (Figure A4). Spring barley was planted at 2.5 cm soil depth at 15 seeds/pot (equivalent to 375 seeds/m2 assuming an establishment rate of 99%, and a thousand grain weight (TGW) of 44 g). A spray programme (Table A2) was used to keep weeds, aphids and disease to a minimum, with no additional inorganic fertiliser applied.

2.8. Spring Barley Harvest and N Offtake

The spring barley was harvested when ripe by cutting stems at 2–3 cm above the soil surface. Samples were dried at 60 °C for 48 h, then weighed. Ears were counted and separated from the straw and a Wintersteiger LD350 thresher was used to separate the grain from the chaff. The straw and chaff fractions were bulked together, and all samples were re-dried at 60 °C for 48 h and reweighed. Samples, grain and non-grain (straw + chaff), were milled to 1mm using a Foss Clyclotec CT293 mill and analysed for % N (using the same method described in 2.5 above). N uptake by the spring barley was calculated through multiplying dried grain yield by its relative % N and by adding the dried straw + chaff weight multiplied by its relative % N.

2.9. Soil Mineral Nitrogen (SMN)

Ten days post-harvest (13 September 2018), 60 g of fresh soil was sampled on three replicates of each treatment with a soil corer to a depth of 30 cm. A total of 40 g of soil were incubated at 20 °C for 24 h, sieved to 2 mm and extracted with 80 mL of 2M KCl. The mix of soil and KCl was shaken in an orbital shaker for 1 h at 200 RPM, then centrifuged at 2970× g for 4 min and the liquid fraction filtered through No. 40 Whatman filter paper. Two “blanks” were run with the extractions to determine and adjust for any contamination. Extracts were analysed using a calorimetric Skalar San Plus Auto Analyser (Skalar Analytical B.V., Breda, Netherlands) based on the cadmium reduction method for nitrate and nitrite and the Berthelot reaction for ammonia. Banked samples of soil taken prior to planting the cover crop were frozen and stored at −18 °C. Three subsamples were defrosted in a fridge for 16 h and analysed for SMN as described above. The result was quantified through multiplying the concentrations of nitrate, nitrite and ammonium by the relative dry weight of the soil in the pots then transformed to g/m2. SMN, prior to planting the cover crops, is estimated to be 6.46 g/m2.

2.10. Total Detectable N

Evaluating spring barley N uptake combined with SMN post-harvest allows between species evaluation to identify if the legumes fixed additional N and if the cover crop residue either mineralised or immobilised nitrogen. The SMN g/m2 was calculated by multiplying the total nitrate + nitrite + ammonium by the weight of the soil in the 30 cm profile sampled using the dry bulk density. Total detectable N was assumed to be the sum of the spring barley crop N added to SMN (30 cm soil depth) to provide an uptake per pot, which was then converted to g/m2. This is shown in Equation (1).
T o t a l   d e t e c t a b l e   N   =   S p r i n g   b a r l e y   N   o f f t a k e   +   S M N

2.11. Apparent N Recovery

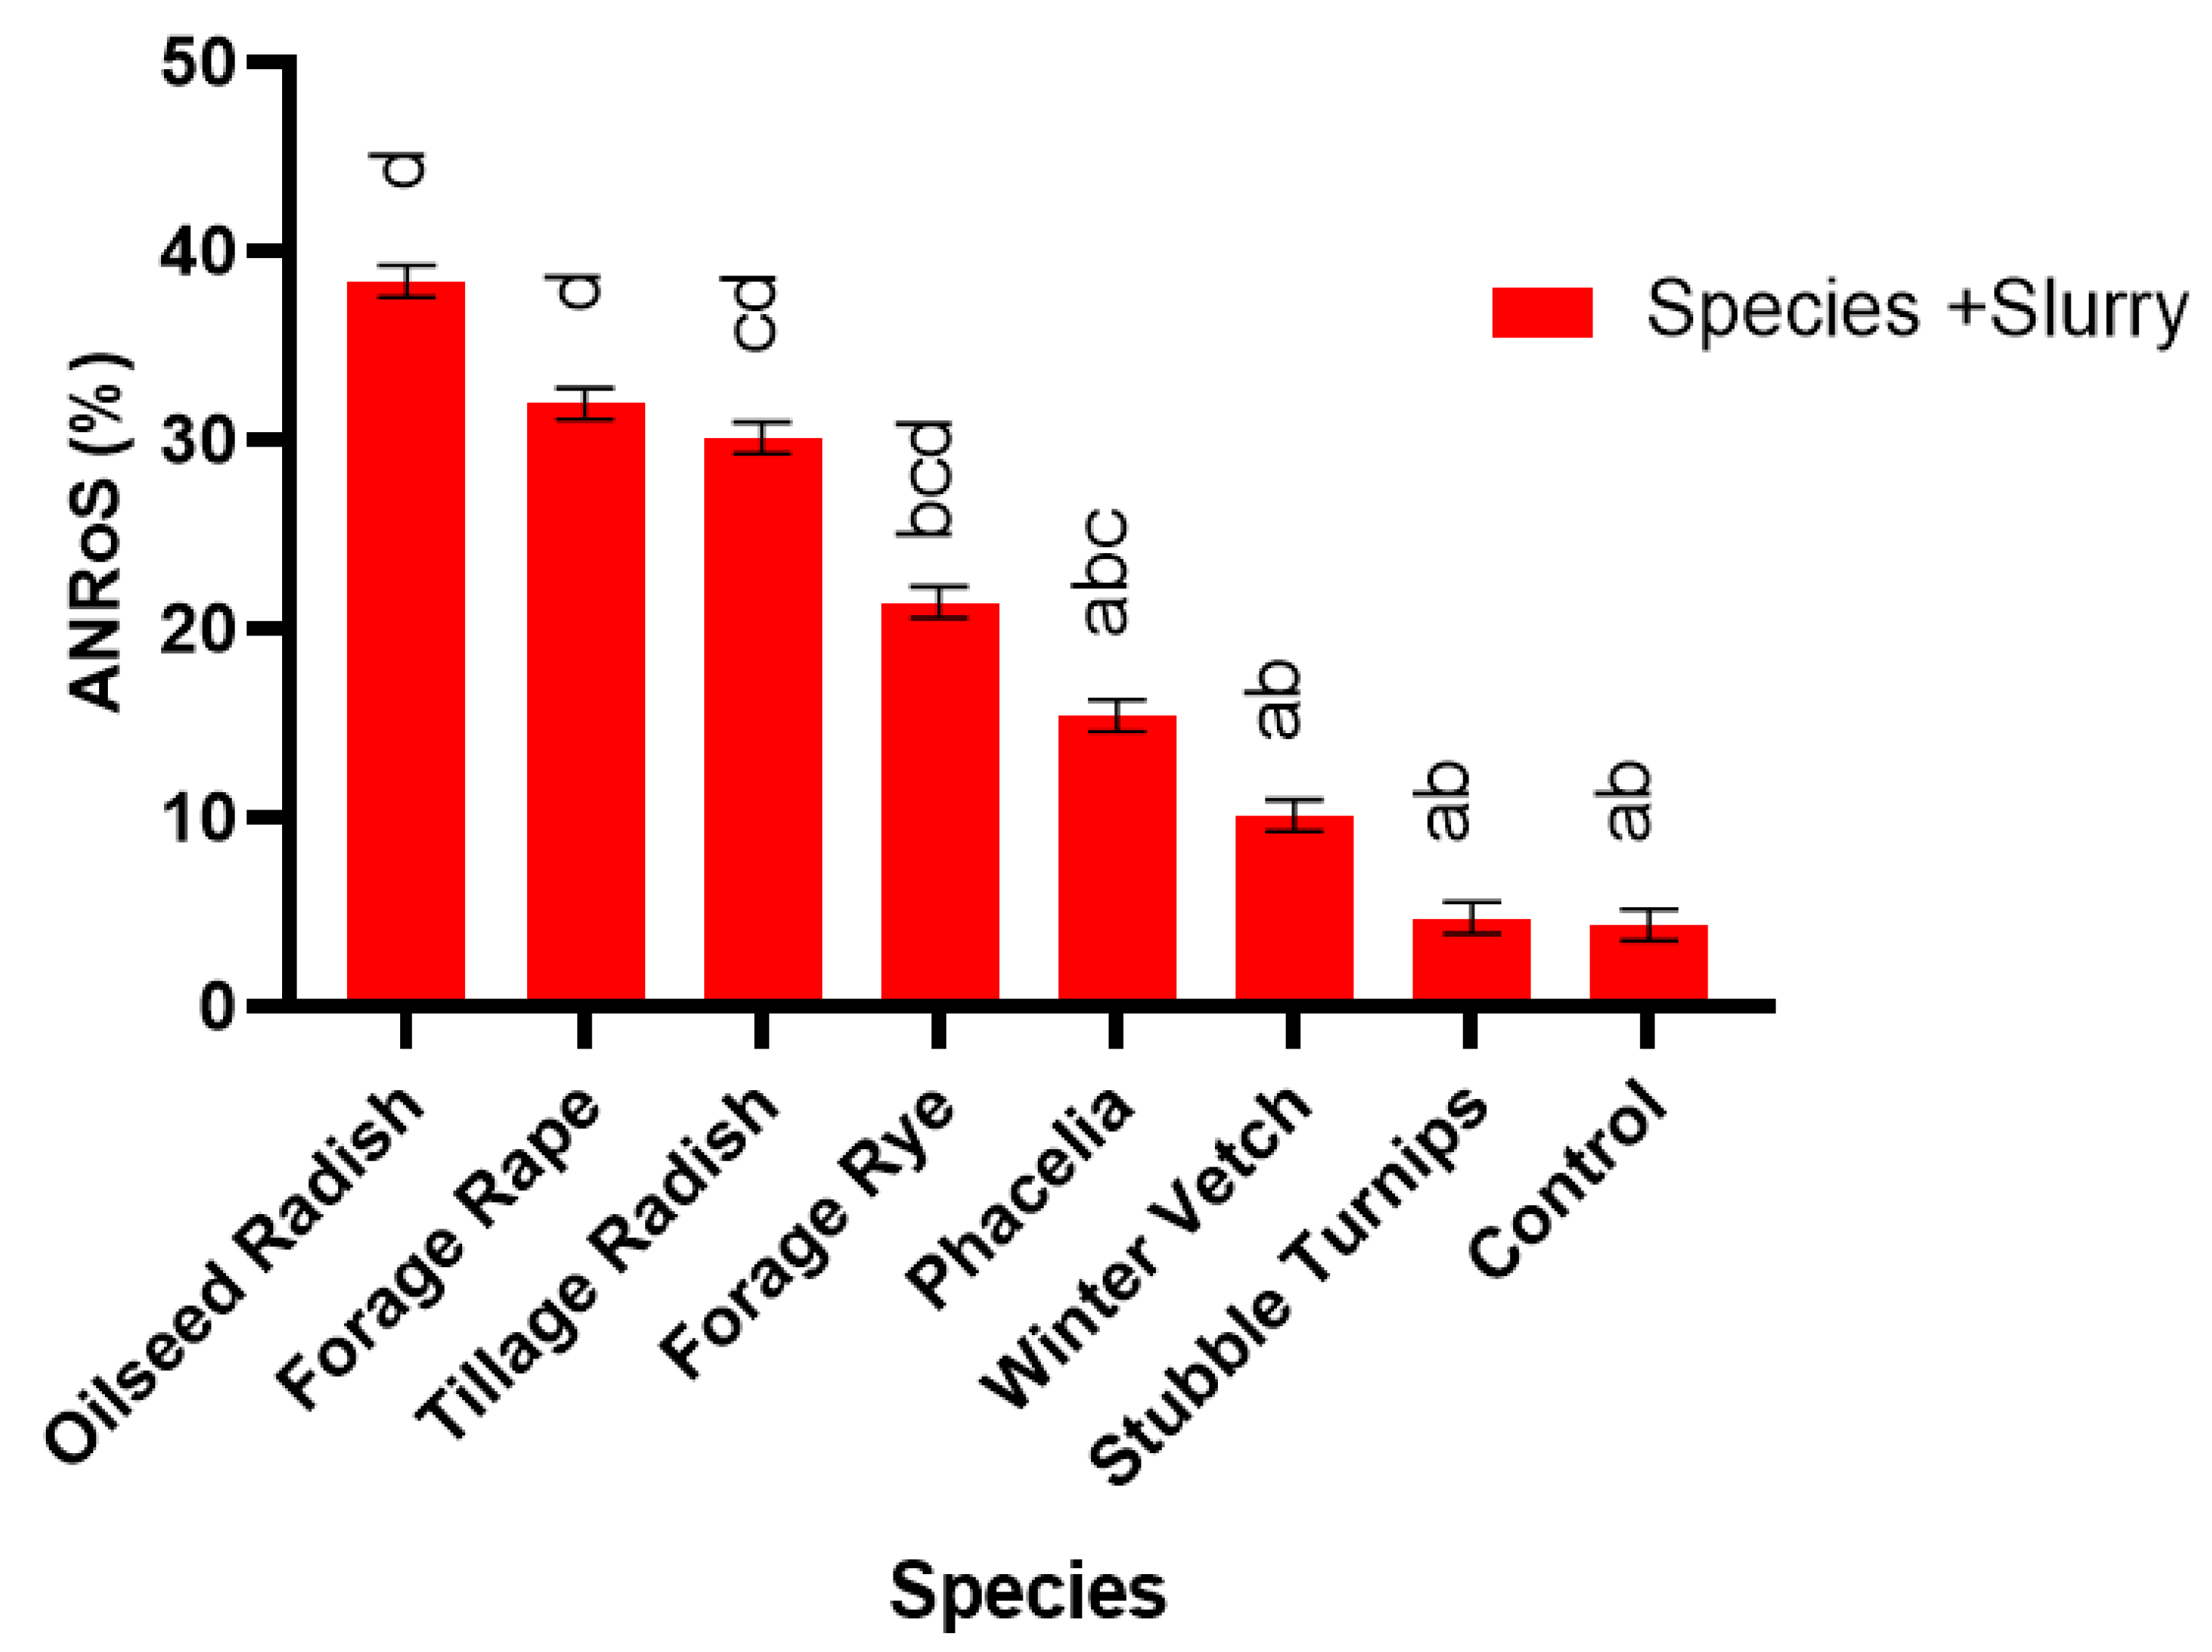
Total apparent N recovery (TANR) of the N applied was calculated in Equation (2) as described by Liu et al. [46]. The apparent N recovery in response to the treatment of slurry was calculated in Equation (3) as described by Cavalli et al. [47], for each species. This is denoted by ANRoS. Both equations assume slurry to have an availability of 50 % as directed by the AHDB RB209 [34] and the Nitrates Action Programme [32].
T A N R   =   ( T o t a l   d e t e c t a b l e   N T o t a l   N   a p p l i e d )   ×   100
Total N applied = Initial SMN + N applied in slurry.
A N R o S   =   ( T o t a l   d e t e c t a b l e   N S p e c i e s   m e a n   T o t a l   d e t e c t a b l e   N ( N o   S l u r r y ) N   a p p l i e d   f r o m   s l u r r y   )   ×   100

2.12. Statistical Analysis

Two-way analysis of variance (ANOVA) was used to identify significant differences between treatments in the response variables of crop growth, water usage, weed production and all aspects of spring barley yield, using Genstat (V18) [48]. Restricted maximum likelihood (REML) was applied to analyse the N accumulation due to the unequal number of observations. Fisher’s post-hoc analysis was applied to discriminate differences between means. Results are deemed significantly different at p < 0.05 and tendencies are regarded as less than 10% (p = 0.10).

3. Results

3.1. Cover Crop Growth

Biomass production was significantly different between species (p < 0.001), and was affected by the addition of slurry (p < 0.05). A significant interaction between slurry addition and cover crop species (p < 0.001) was exhibited (Table 4). Tillage radish (Raphanus sativus L.) and Oilseed radish (Raphanus sativus var. Oleiferus L.) produced the largest biomass of 1048 g/m2 and 895 g/m2, respectively, when slurry was applied. Winter vetch (Vicia villosa L.) produced the most biomass (134 g/m2) averaged across both slurry treatments within the legume family. Slurry led to significant increases in biomass of the forage rye (Secale cereale L.), oilseed radish, forage rape (Brassica napus L.), brown mustard (Brassica juncea L.) and the tillage radish by 106%, 83%, 82%, 65% and 35%, respectively (Table 5).

3.2. Weed Suppression

Slurry significantly reduced weed biomass (p < 0.05); species also had a significant effect (p < 0.001), but there was no interaction between the treatments (Table 4). The control produced 74 g/m2 of weeds, averaged across both slurry treatments, allowing for a comparison of effect of cover crops. The brassicas exhibited the greatest levels of weed suppression compared to the other families, with tillage radish giving the greatest suppression producing only 5.0 g/m2 (Table A3). Pots with legume species had greater levels of weeds compared to other species, with spring vetch (Vicia sativa L.) having increased weed biomass compared to all other species (p < 0.05).

3.3. Water Usage

Water usage was significantly affected by species (p < 0.001) (Table 4). The control that grew weeds used the lowest amount of water (Table 5). The brassicas all significantly increased water usage compared to the control (p < 0.05), with tillage radish requiring the most water to maintain 70% water holding capacity, followed by oilseed radish (Table A3).

3.4. N Accumulation in the Cover Crop

% N was affected by both slurry addition (p < 0.001), and species (p < 0.001), with a significant interaction (p < 0.05) between them. The species mean N concentration ranged from 2.7% in the tillage radish to 4.8% in brown mustard (p < 0.05). Slurry increased the % N by an average of 0.39% (p < 0.001) (Table A4). % N in stubble turnips (Brassica rapa oleifera L.), brown mustard, phacelia (Phacelia tanacetifolia L.), oilseed radish and westerwolds (Lolium multiflorum L.) was significantly increased by slurry (p < 0.05). When biomass was multiplied by % N, the winter vetch accumulated the least N compared to tillage radish (Figure 1). The effect of applying slurry significantly increased the N accumulation of many brassicas such as tillage radish, oilseed radish and brown mustard. The only other species to exhibit a significant increase in N accumulation was forage rye. Oilseed radish accumulated 139% more N when slurry was applied compared with no slurry. Tillage radish, accumulated a total of 33.9 g/m2 N with slurry compared to only 16.9 g/m2 N under no slurry. Forage rye exhibited the largest response in terms of percentage but its overall N accumulation (with slurry) was still relatively low in comparison to other species, and without slurry it produced low biomass compared to with slurry. The N accumulated in the weeds was not calculated, due to insufficient biomass produced to allow for a sample to be analysed. Thus it was assumed that weeds accumulated negligible amounts of N. For example if weeds had an assumed tissue N % of 3%, winter vetch would have had a weed N offtake of 0.53 g/m2 and 1.13 g/m2 for with and without slurry, respectively.

3.5. C Accumulation in Cover Crop

The percentage C (% C) was only significantly affected by species (p < 0.001). Total C accumulation, which is a product of biomass multiplied by % C, was affected by species (p < 0.001), slurry (p < 0.05) and their interaction (p < 0.01). Across all species, C accumulation ranged from 75.4 g/m2 in winter vetch to 380.9 g/m2 in tillage radish (Table A4). Slurry increased the average C accumulation across all species by 34%.

3.6. C:N Ratio

The C:N ratio was significantly affected by species (p < 0.001), slurry (p < 0.001) and their interaction (p < 0.01) (Table 6). Tillage radish had the highest C:N ratio and brown mustard the lowest. Slurry reduced the C:N ratio on average by 2.32 (p < 0.001) and exhibited a significant interaction (p < 0.01) with species. Tillage radish showed the highest numerical decrease in C:N ratio, by 35% in response to slurry.

3.7. Phosphorous (P), Potassium (K), Magnesium (Mg) and Sulphur (S) Accumulation

Due to natural differences in the species concentrations of P, K, Mg and S (p < 0.001) and variation in biomass produced, this meant that species had significantly (p < 0.001) different accumulations of these nutrients (Table 6). On average, slurry only increased P and S concentration but did not exhibit any significant interactions with species. K, Mg and S accumulation was significantly (p < 0.01) affected by the interaction between slurry and species where the effect of slurry increased accumulations for most species. Figure 2 displays the P, K, Mg and S accumulations for the selected species measured. Tillage radish led to the greatest accumulation of P, Mg and S (p < 0.05) compared to all other species. With slurry applied, oilseed radish led to the largest accumulation of K, which was similar to the tillage radish (slurry applied) and brown mustard (slurry applied) and also tillage radish without slurry applied. Without slurry applications, the tillage radish led to the greatest offtakes of P, K, Mg and S.

3.8. Spring Barley Grain Yield

The species of cover crop biofertilizers and slurry significantly affected subsequent spring barley grain yield (p < 0.05 and p < 0.01, respectively). Average grain yield increased from 444.8 g/m2 without slurry to 642.3 g/m2 with slurry (p < 0.05). Species that significantly increased grain yield compared to the control were all from the brassica family (Ethiopian mustard (Brassica carinata L.), stubble turnips, brown mustard, oilseed radish, forage rape and tillage radish) (p < 0.05). The residue/biofertilizer produced by the tillage radish produced the greatest yield, which was 50.9% higher than that of the control, as seen in Figure 3. Total number of ears/m2 was only significantly affected by species (p < 0.001), and straw and chaff biomass were significantly affected by slurry and species (p < 0.001). Considerable differences in grain yields were exhibited by species in response to slurry (Table A5), but this interaction was not significant.

3.9. Spring Barley N Accumulation

Cover crop species and slurry both had significant (p < 0.001) effects on total N accumulation. Post hoc analysis showed that spring barley planted after tillage radish led to a significantly (p < 0.05) greater N offtake in the spring barley, whereas the control of no cover crop led to the lowest N offtake. Spring barley following the brassicas (i.e., brown mustard, stubble turnips, forage rape, oilseed radish and tillage radish) had the greatest N offtake at 11.3, 11.4, 11.9, 12.3 and 12.7 g/m2, respectively (Figure 4). Grain % N was significantly affected by slurry (p < 0.05) and the interaction between species and slurry was significant (p < 0.05). Although there were no significant differences in straw % N, total straw N accumulation was significantly increased (p < 0.001) by slurry and species, with a significant interaction (p = 0.05). Grain N accumulation was significantly affected by species (p < 0.001) and increased by slurry (p < 0.05); there was no significant interaction.

3.10. SMN Plus Total Spring Barley N Offtake (Total Detectable N)

SMN analysis after harvest of the spring barley did not reveal significant differences in concentrations of ammonia, nitrite and nitrate in any of the treatments. When concentrations of SMN were multiplied by total soil in the sampled depth (30 cm), no differences in total pot N quantities were found between treatments. However, cover crop species exerted a significant (p < 0.001) effect when total SMN and spring barley crop N were pooled together, which will be referred to as “detectable N”. Slurry increased total detectable N (p < 0.001) and exhibited an interaction with species (p < 0.05). The legume winter vetch did not significantly increase detectable N in comparison to the control therefore it fixed negligible quantities of N.
Without slurry all species had similar total detectable N amounts. With slurry, seven species (stubble turnips, forage rye, phacelia, westerwolds, forage rape, tillage radish and oilseed radish, respectively) led to significant increases in detectable N over the control (Figure 5). The significantly increased detectable N (p < 0.05) when slurry was added to forage rye, westerwolds, forage rape, tillage radish and oilseed radish in comparison to sowing these species without slurry demonstrates the benefit of this management practice to increase N cycling and mineralisation of the cover crop biofertilizers to supply N to the spring barley and to increase SMN. Stubble turnips with no slurry applied was the only species that led to a significantly (p < 0.05) higher detectable N compared to the controls with and without slurry. This suggests that this species enhanced N cycling to the greatest extent in the absence of slurry.

3.11. TANR and ANRoS

The TANR demonstrates the recovery % of the total applied N and is shown in Table 7. TANR was much greater without slurry than with slurry (p < 0.001) and species led to significant effects (p < 0.01) but there was no significant interaction. Table 7 shows the Slurry × Species means of the ANR. It demonstrates that the control for both No Slurry and Slurry means had the lowest ANR. However, when species response to slurry is isolated through calculating ANRoS, the N recovery percentage of the extra N offtake due to slurry, is seen to have had a significant effect (p < 0.001) as did Species (p < 0.05) and there was a significant interaction (p < 0.05) (Figure 6). Oilseed radish, forage rape and tillage radish resulted in significantly higher (p < 0.05) ANRoS compared to the control. The ANRoS of the control in response to slurry only led to 4.3 % extra N being recovered, which is low.

4. Discussion

4.1. Spring Barley Yield

Environmentally sustainable farming seeks a greater output with less inputs [49]. Consequently, this study set out to investigate the effect of two sustainable and economically attractive practices, cover cropping and slurry application, on spring barley yield and N uptake. At present, the practice of leaving land fallow when in a cereal rotation has several negative consequences [28]. Sowing cover crops ameliorates problems associated with over-winter fallow and can increase grain yields. If slurry is applied to responsive cover crops that increase their biomass and N uptake, this could not only reduce nutrient loss but also provide a greater benefit to the commercial crop. This is a better management practice than applying slurry in the autumn to fallow land.
This study suggests that careful consideration must be applied when picking species to integrate into a rotation as cover crops. The brassica species increased grain yield by 30–51% compared to the control. Tillage radish increased grain yield by 2.39 t/ha, which would make the practice of cover cropping highly profitable if it was possible to replicate this greenhouse experiment under field conditions. However, the leguminous species used did not significantly increase the yield of the spring barley crop, meaning that hypothesis i, that this particular family would increase yield, is rejected. Stobart and Morris [50] reported a two year average wheat yield response of 0.11 t/ha and 0.22 t/ha following the inclusion of a radish and legume mix of cover crops, respectively, suggesting that legumes should typically have higher yields compared to brassicas due to legumes introducing additional N into the rhizosphere. In this study, the leguminous species exhibited low biomass growth and no significant effects on the spring barley yield, N offtake or total detectable N, therefore showing that very little additional N was available for the subsequent barley crop. This may be due to abiotic factors of the climate but also edaphic factors as legumes are more commonly grown on light soils to which they are better suited [51] whilst NI soils tend to be heavy soils. The brassica species may have contributed to increasing spring barley grain yield through their potential biofumigation effect on both pests and pathogens [4,52]. Brassica species contain glucosinolates that hydrolyse when cells are damaged (e.g., during incorporation) to produce various isocyanides that can be toxic to some pests like nematodes and pathogens, although effects are variable [53,54]. Furthermore, glucosinolate production and concentration have been found to be increased by N and sulphur (S) applications [55,56], both of which are high in slurry and could be desirable to maximise not only glucosinolate concentration but also the amount produced, which could maximise effects. Couëdel et al. [57] found that when brassicas were grown with legumes in a mixture that glucosinolate production did not decline, compared to monoculture of brassica cover crops. This was due to N supply from the legume to brassica, which increased its biomass and glucosinolate productions. However, in this trial, biomass production and the effect on nutrient cycling are the primary mechanisms of increased spring barley and spring barley N uptake.

4.2. Environmental Benefits

The use of cover crops and the addition of slurry led to an increase in C accumulation. It is important to return organic matter to soil, particularly in arable systems, where this also provides additional environmental benefits, namely C sequestration [58]. An alternative study found that cover crops and separate slurry applications were capable of alleviating C loss from soil under intensive tillage by ploughing [6]. Results from this pot experiment therefore suggest that the practice of cover cropping and slurry may return more C when integrated. Conversion of 1.0 g of C equates to 3.67 g of CO2 [59] meaning that 1397.7 g/m2 of CO2 have been taken up by the tillage radish, which converts to 13.97 tonnes CO2/ha. Whilst 60% of this CO2 will be released within around 6 weeks as the crop decomposes, 40% of the C from the residue will contribute, to some extent, to the long term SOM [60]. Cover crops receiving slurry can increase overall organic matter return, whilst the slurry itself also returns considerable amounts of organic matter. The interaction of slurry application to responsive species increased the cover crop biomass and C accumulation and demonstrates the value of this practice to maximise the effect of the cover crop.
Agriculture must adapt to climate change including the increasing prevalence of erratic weather of both droughts and excess rainfall [61]. This study provides evidence that the integration of the correct species of cover crops could positively contribute to mitigating against weather extremes. Tillage radish increased water usage by 224% compared with the control. This suggests clear benefits for climates with high rainfall such as NI. This could lead to reductions in leaching, soil erosion, nutrient run-off and potential denitrification because the cover crops help remove water from the soil profile. Agriculture is estimated to be responsible for 68% (18,709 tonnes) of nitrate leaching in NI annually where this amount is proportional to the amount of fertiliser and manure applied [62]. Cover crops that reduce leaching and reduce inorganic fertiliser requirement offer considerable potential to retain nutrients, reduce nutrient loss and protect waterways. In Sweden, total N leaching is estimated to be 49,000 tonnes/annum and cover crops are estimated to annually reduce nitrate leaching by 1554 tonnes [7].
In this greenhouse experiment weeds were not reincorporated, removing nutrients, and so the cover crop species suppressing weed biomass to the greatest extent were “rewarded” as less nutrients were removed from the mesocosms. This could partially explain effect on grain yield by the species. However, this is unlikely, if assuming weeds have a tissue N% of 3 the winter vetch would have had an N offtake of 0.53 and 1.13 g/m2 with and without slurry, respectively. Mechanisms of weed suppression by cover crops include root exudates causing allelopathy as found in rye and black oats [63]. In this study, it is speculated that the competition for light is the predominant method of weed suppression as the fast-growing brassica species outcompeted the weeds by creating a shading effect. Some species almost totally suppressed weeds but the legume species tested did not significantly affect weed biomass compared with the control. A separate study found that red clover (Trifolium pretense L.) grown as a monoculture did not reduce weed density or biomass [64]. Phacelia, in this study, reduced weed biomass by 83% compared with the control. Similarly, a separate study also found that phacelia led to a reduction in weeds by 77% and that oilseed radish, phacelia and buckwheat (Fagopyrum esculentum L.) offered consistent weed suppression across differing sites and years [2]. However, the data in this study show that buckwheat did not produce a significant reduction in weed pressure.

4.3. Cover Crop Growth, Response to Slurry and Nutrient Accumulation

The biomass response of forage rape (82% increase) and oilseed radish (83% increase) to slurry addition suggests that this combination maximises production and will enhance the cover crop effect. The slurry applied 33.0 g/m2 of N, and across all species the slurry led to an average increased N uptake of 8.7 g/m2, representing a utilisation of 26% of the total supplied. Not all of the N from slurry is considered to be available due to denitrification and ammonia losses, although the losses in this experiment were much lower than field conditions due to incorporation of slurry 3 days post-application and the twice-weekly watering, which eliminated leaching compared to more extreme rainfall events more typical in field conditions [65]. Initial SMN was estimated at 6.46 g/m2, which is low despite the soil being sourced from a field growing over-summer peas. This suggests that from the N accumulated in the cover crops, the majority of these cover crop species could be highly effective in both sequestering considerable amounts of N from soil reserves and could be beneficial by reducing leaching under field conditions. It is the mechanism of trapping N in the biomass that protects this nutrient from leaching [66]. Phacelia, which accumulated 15.45 g/m2 of N under no slurry, only increased N accumulation by 2.06 g/m2. This 13% increase with slurry indicates that phacelia is a valuable species to integrate when slurry is not being used, similarly [67] found no significant increase in phacelia biomass, shoot or root in response to N fertilisers. Parkin et al. [41], found that when three rates of pig slurry supplying 0, 7.5 and 19.5 g/m2 N were applied to a rye cover crop in a pot experiment, that N uptake within the biomass increased significantly (2.95 to 6.37 and 10.2 g/m2, respectively). This increase in N uptake significantly reduced leaching when compared to application of these manures to a bare fallow treatment. High N uptakes of the cover crops in response to the high rate of slurry in the study reported here suggests that rates could be tailored to the species being integrated, which could be discerned through future research. This would permit maximum biomass growth and increase N efficiency when using cover crops.
Labile soil S is subject to leaching [34], particularly over-winter whereby sequestration in cover crop biomass such as fodder rape and fodder radish has been found to increase S availability to the next crop of spring barley [68]. This was achieved through the reduction in S leachate during the fallow period, sufficient mineralisation rates of the cover crop biomass which allowed for greater commercial crop supply [69]. In this trial, slurry supplied 2.58 g/m2 of S and in response species such as tillage radish and brown mustard increased their accumulation significantly (4.5 g/m2 and 3.12 g/m2, respectively). Tillage radish was the greatest performing species in sequestering the macro-nutrients measured. Without slurry, tillage radish accumulated considerable amounts of all macro-nutrients, but, in particular, K, which could affect subsequent crop nutrition depending on mineralisation from the residue. The effect of slurry led to greater nutrient accumulations but may also help ensure that the commercial crop does not compete for nutrients where cover crops may have potential low mineralisation rates and thus decrease the synchronisation of commercial crop nutrient demand and supply. Despite the cover crops not resulting in a significantly greater accumulations of P in response to slurry, a maximum of 2.8 g/m2 sequestered in tillage radish could be beneficial to help reduce P loss. Additionally, as an effect of the living leaf canopy, soil that is better anchored by growing roots and evapotranspiration may aid the reduction in P loss in comparison to bare fallow, and therefore be a better way to ameliorate negative effects of both fallow and autumn applied manures. The reduction in P loss by cover crops was not found in a literature review focusing on southern Scandinavia and Finland [7] but a 54–94% reduction in P loss was reported by Kaspar and Singer [8].
The C:N ratio of tillage radish reduced from 20.1 to 12.9 in response to slurry due to an increased % N and subsequently increased the spring barley N offtake by over 50% in this treatment. The C:N ratio of the cover crop residue is critical for nutrient breakdown, where the lower the ratio, the faster the decomposition [3,20]. This study has found that the effect of slurry applied to cover crops increases the quality of the cover crop due to reduced C:N ratio and maximises biomass quantity of the cover crop through increased total N acquired. These two factors of total N acquired and N mineralisation rate, which are C:N dependent [3], are primary drivers of N supply to the subsequent crop [70]. This is an important finding, showing that C:N can be manipulated not only by species choice but also for the first time we show through application of slurry to certain species, if replicable under field conditions. Other strategies to reduce overall C:N ratio have been demonstrated, such as multispecies e.g., brassicas and legumes, with N mineralisation being found to be enhanced compared to using sole crops (single species) [3]. This alternative strategy is relatively similar to this study, which uses slurry to supply nutrients, whereas the legumes were a mechanism to supply N to brassicas [3].
In other studies, cereal rye with a high C:N ratio reduced corn yield due to immobilisation of soil inorganic N through sequestration by soil microbes due to it being low quality as they competed with the commercial crop roots for N [20,71,72]. In this experiment, grain yield of spring barley was not negatively affected by forage rye. A separate experiment found that rye had a C:N ratio of 37:1 at anthesis and around 26:1 during vegetative growth [73]. In this experiment, the rye was in the vegetative phase when incorporated and had a low C:N ratio of 11.0 (no slurry) and 10.3 (with slurry), which could have explained why no negative effect on grain yield was detected as there was sufficient mineralisation of N. The interaction whereby slurry decreases the C:N ratio provides the mechanism of the cover crops to help support: (1) high rates of N mineralisation to maintain high commercial crop yields; (2) the reduction in N fertiliser in the commercial crop.

4.4. Spring Barley—N Cycling

The control, i.e., no cover crop, had a total spring barley N offtake of 7.7 g/m2 without slurry and 8.9 g/m2 with slurry, which with 33.0 g N/m2 applied through the slurry, giving an efficiency of N supplied from the slurry of only 3.64%. This is low even when the N removed in the roots and weeds are taken into consideration. Leaching from the pots should not have occurred even though the pots were left outside from February onwards. To prevent this, the pots were placed in plastic bags to prevent loss of nutrients, in particular, nitrate and nitrite. However, nutrients such of N may have leached to lower profiles in the soil and depending on root proliferation of the spring barley may have been inaccessible to the commercial crop.
Interestingly, grain % N in the spring barley was very low, averaging 1.35%. Slurry was the only treatment with a significant effect (p < 0.05) and actually reduced grain % N on average across all species. High % N grain is desirable in animal feed due to its link with protein and therefore boosts its feed value. The low grain % N is due to the higher total biomass yield of straw + chaff and grain causing the dilution as found with wheat [74]. Slurry led to a greater spring barley N offtake due to the increase in the average spring barley grain yield and total biomass primarily due to the added N [75]. The effects of increased spring barley yield, spring barley N offtake and detectable N exhibited by the brassicas species is speculated to be due to a high mineralisation of N. This contrasts with an experiment which found that there was a net N immobilisation of −6 kg/ha for oilseed radish using the same variety as in this experiment [3]. However, in that experiment, many of the brassicas had much higher C:N ratios compared to this study [3], which explains the increased mineralisation of N in this study.
The legumes grew poorly and did not increase spring barley N uptake, leading to questions about their usefulness. One purpose of growing legumes is to add N back into the system through biological fixation where fixation is related to biomass growth [76,77]. However, legumes have been found to be less able to reduce leaching compared to non-legumes [7], suggesting that non-legumes are a better choice for a high over-winter precipitation climate such as NI. Favourable environmental conditions of both heat and light during growth should have been conducive to greater levels of growth by the legumes in comparison to [26]. Those authors grew predominantly legume cover crops at two different sites in Switzerland with mean temperatures of 15.8 °C and 13.9 °C, respectively. They found that after three months, hairy vetch was estimated to have biologically fixed 159 and 135 kg/ha N, and a biomass of 4.44 and 4.32 t/ha, respectively. Results from field experiments carried out by [78], showed that legume cover crops responded to additional N accumulation when slurry was applied (67 kg/ha N provided by the slurry) and were the only species to effectively supply N to the following commercial crop compared to forage rye and forage radish, which immobilised the N. In this study, the total N offtake in the spring barley with vetch as the cover crop was only 0.39 g/m2 higher than the control, suggesting it has little value as an over-winter cover crop as it fixed little additional N. This is a particular limitation as N is a major driver of crop productivity. Furthermore, the abundance of N within organic manure means additional N is not needed in some agricultural areas due to farm structure, i.e., livestock enterprises, if N from these sources can be better utilised and retained.

4.5. TANR and ANRoS

Slurry reduced the TANR due to additional losses of N, which will include volatilization [34] and potentially N being converted into other unavailable forms e.g., organic forms. Where no slurry was applied, a recovery of 149% was obtained in the control. The recoveries of species with no slurry applied in Table 7 demonstrate that considerable N mineralisation was occurring. All species, excluding winter vetch, led to a greater numerical TANR due to increased yield and thus total N offtake due to the species. Due to the fact that slurry increased grain yield, crop N offtake and total detectable N therefore warrant that the effect of slurry must be isolated to demonstrate the specific species response to slurry (ANRoS). Figure 6 shows that oilseed radish resulted in 38% more N being recovered when slurry was applied, whereas, by applying slurry to the control, only resulted in 4% of the N being recovered. It was found, in a separate study, that when poultry litter applied in the autumn it did not transfer N to the commercial crop unless it was integrated with cover crops [78], with those authors stating that leaching over-winter was the primary cause of N loss. However, in this trial leaching should not have been an issue. The species response to slurry would have been much larger if the levels of N mineralisation observed under the no slurry treatments were much lower. The fact that the ANRoS was relatively low, must mean that considerable quantities of N may have been transformed into soil organic nitrogen. A separate study found that cover crops increased stores of soil organic N compared to a fallow control [79]. Furthermore, it was found that high rates of excess inorganic N applied resulted in large increases in soil organic N but it also increased the rate of soil N mineralisation [80]. In addition, In’t Zandt et al. [67] found that when cover crops were supplemented with inorganic N, despite no increase in microbial biomass C, they did increase the amount of N immobilised in the microbial biomass, and concluded that this effect must be taken into account when assessing the effect of cover crops on residual N. Despite this potential immobilization of N into organic forms, slurry integrated with cover crops could positively enhance soil fertility to benefit future commercial crops.

4.6. SMN + Total Spring Barley Offtake (Detectable N)

Residual N post-spring barley was low, averaging 15.3 kg/ha across all treatments, in comparison to the nutrient management RB209 guide that estimates soil N supply following a range of cover crops [34], and shows that SMN had been effectively depleted in our study. This suggests that N was in undersupply during growth of the spring barley and supported by the fact that grain % N was low. Applying slurry to cover crops increased detectable N offtake and resulted in a beneficial interaction by increasing N availability compared to applying it to the control (representing fallow). Increased N offtake by the spring barley is desirable as it not only signals higher yields, but it also enhances the quality of the crop specifically when used as animal feeds. The interaction between slurry and cover crops is associated with the increased cover crop biomass and lower C:N ratio residue, which is conducive to the residue breaking down faster. This may also be in combination with increased biological activity in the soil as above ground biomass is associated with below ground microbial effect [81], resulting in greater N mineralisation rates of residue, although this was not investigated.
Replication of these responses to slurry would require agronomic practices to maximise cover crop growth potential, such as early sowing of post-harvest commercial crops. Whilst the limitations of this study are that it was a pot experiment, questions are identified for subsequent field experiments using the species selected to evaluate the effect on both N cycling and commercial crop yield, both integrating slurry and a reduced rate of inorganic N supplied to the following commercial crop. Such research could provide evidence to support cover crop adoption and use on-farm, which will be critical to help meet ambitious targets to reduce nutrient loss and pesticide use by 50% and reduce fertiliser use by 20% by 2030 [82].

5. Conclusions

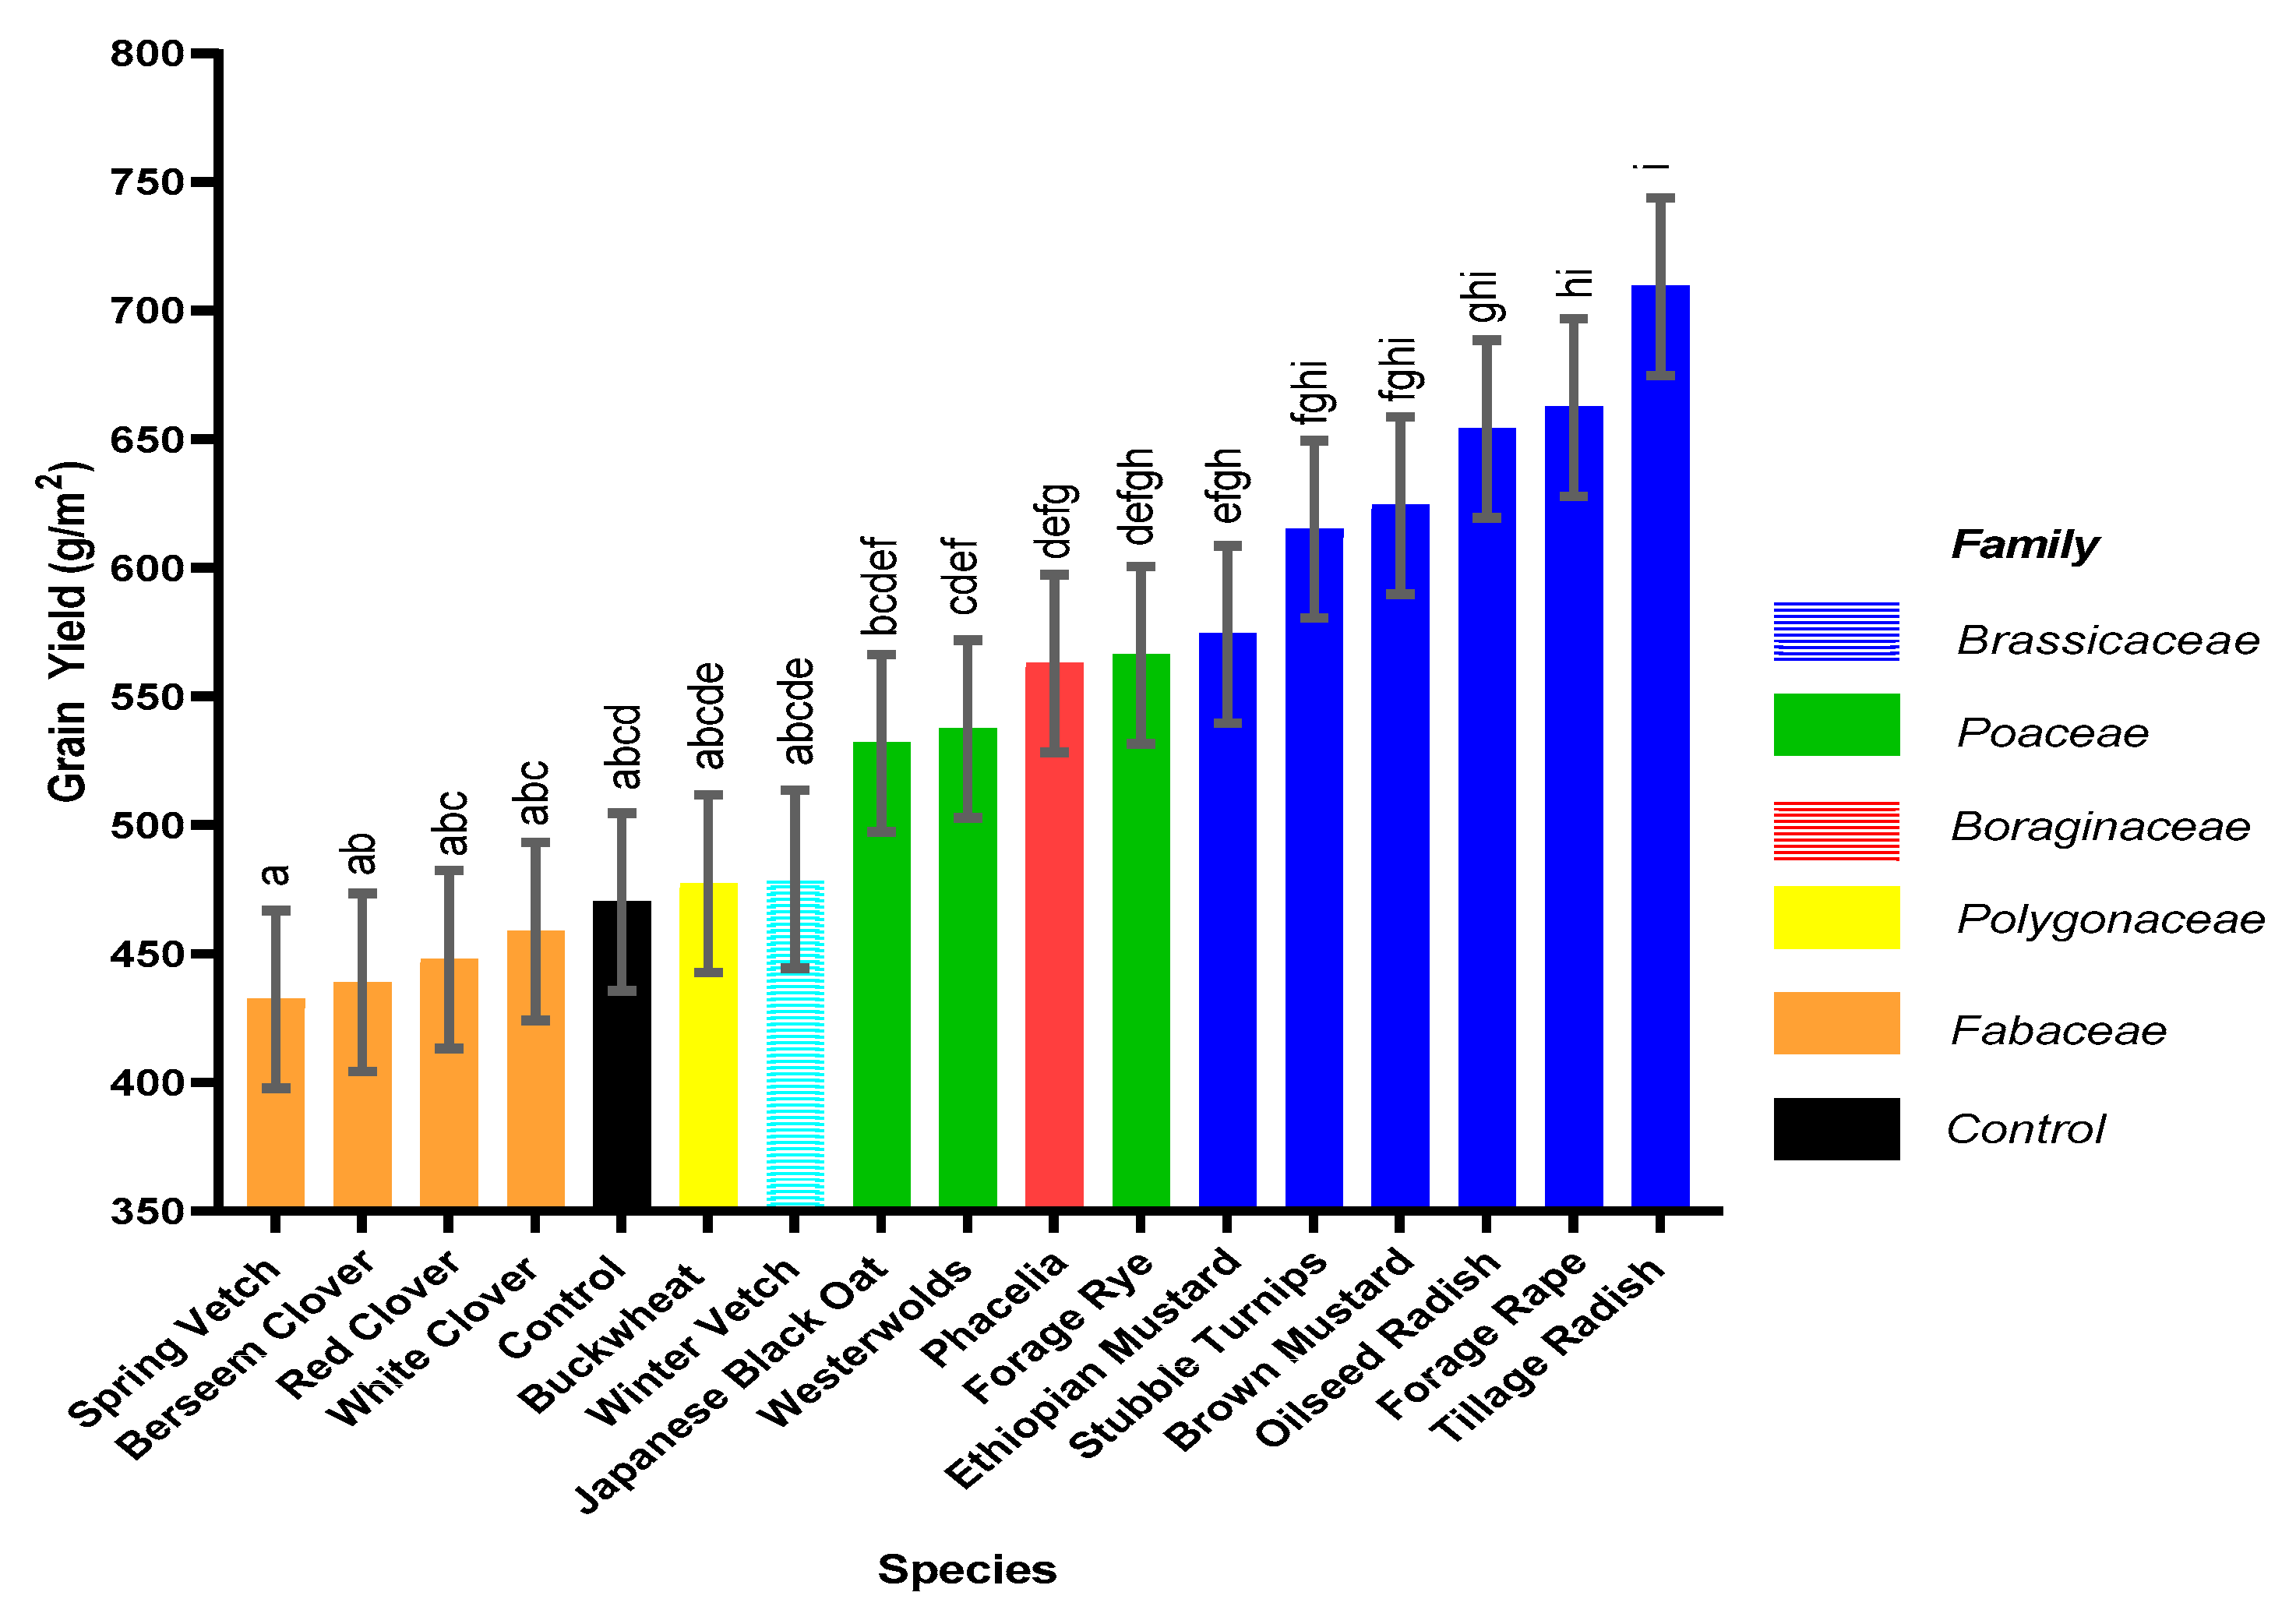
This pot experiment shows that replacing fallow land with cover crops offers a multitude of benefits for sustainable development when the best species are used. Benefits include weed suppression, increased water usage and addition of organic matter to the soil, increased N accumulation in the cover crop and increased N uptake in the subsequent spring barley crop with the potential to increase commercial crop yields. Furthermore, certain cover crop species, forage rye, brown mustard, oilseed radish and tillage radish, can respond synergistically to slurry addition, which acts as an effective sink for N. Thus, N could be sequestered during high risk leaching periods and be released to the growing crop through production of a higher quality residue (lower C:N ratio). In addition, greater mineralisation could occur when the cover crop is incorporated, thus increasing commercial crop yield, in comparison to leaving ground fallow. An increased grain yield was observed following Ethiopian mustard, stubble turnips, brown mustard, oilseed radish, forage rape and tillage radish, in comparison to the control.
This study demonstrates for the first time that applications of slurry to selected species of responsive cover crops can simultaneously produce a greater cover crop biomass of increased quality that is more beneficial for both spring barley yield and environmental benefits compared to applications of organic manures to fallow land, fostering sustainable intensification.

Author Contributions

Conceptualization, P.C., P.N.W., L.B. and E.W.; Investigation, P.C.; Writing—Original Draft, P.C.; Writing—Review and Editing, P.C., P.N.W., E.W. and L.B.; Visualization, P.C.; Resources, L.B. and E.W. Supervision, P.N.W., L.B. and E.W. All authors have read and agreed to the published version of the manuscript.

Funding

This research was supported and funded by AFBI (Agri-Food and Biosciences Institute) in conjunction with DAERA (Department of Agriculture, Environment and Rural Affairs). Thanks to AFBI Crossnacreevy for providing materials and a site to host the trial.

Acknowledgments

The authors would like to thank all AFBI staff involved in helping undertake this trial, in particular, Colin Garrett and Ashley Cathcart as well as all the farm staff who helped with setting up the pots, watering and planting. Thank you also to Rebecca Hall (Queens). Seed of the cover crop was kindly provided by RAGT Seeds and DSV. The authors are also grateful to the AFBI statistical analysis branch and acknowledge the guidance and analysis conducted by Michelle Allen (AFBI, Newforge), and likewise, Hugh McKeating and Alan Wright (AFBI, Newforge) of the soils branch for analysing soil and plant residue.

Conflicts of Interest

The authors would like to declare no conflict of interest.

Appendix A

Table A1. Species—Varieties.
SpeciesLatinC.V VarietyFamilyTGW * (g)Sowing Rate (kg/ha)
Stubble TurnipsBrassica rapa oleiferaMarcoBrassicaceae3.86.25
Tillage RadishRaphanus sativusDaikonBrassicaceae15.315
Forage RapeBrassica napus L.MosaBrassicaceae4.26
Brown MustardBrassica juncea L.BronsBrassicaceae2.15
Oilseed RadishRaphanus sativus var. OleiferusTerranovaBrassicaceae14.320
Ethiopian MustardBrassica carinataCarbonBrassicaceae3.95
Spring VetchVicia sativaAmeliaFabaceae61.350
Berseem CloverTrifolium alexandrinumMargemmaFabaceae2.915
Red CloverTrifolium pratenseLemmonFabaceae1.812.5
White cloverTrifolium repensBarbancaFabaceae0.710
Winter VetchVicia villosaNacreFabaceae55.650
BuckwheatFagopyrum esculentumLilejaPolygonaceae2570
PhaceliaPhacelia tanacetifoliaStalaBoraginaceae 6
Japanese Black OatAvena strigosaExcitoPoaceae19.96.5
Forage RyeSecale cereale L.BonfirePoaceae32.940
WesterwoldsLolium multiflorumLolium MultiflorumPoaceae3.135
Control
* Thousand grain weight. Source: [73,83,84].
Table A2. Crop protection program.
ProductsDateRateReason
Hussar +17 May 2018150 g/ha,Weeds,
Compitox +1 lt/ha,Weeds,
Warrior0.05 lt/haAphids
Siltra Xpro +5 June 20180.6 lt/ha,Disease,
Bravo 5001 lt/haDisease
Siltra Xpro +22 June 20180.6 lt/ha,Disease,
Bravo 5001 lt/haDisease
Table A3. Species mean values of weeds, water usage.
SpeciesWeedsWater Usage
(DM g/m2)(Litres/m2)
Stubble Turnips15.1ab126ef
Buckwheat40.2abcde88abc
Japanese Black Oat47.8bcde106bcde
Tillage Radish5a236h
Forage Rape25.2abcd113def
Forage Rye57.8cdef111cdef
Winter Vetch27.7abcd91abcd
Brown Mustard12.6ab123ef
Phacelia12.6ab128ef
Oilseed Radish7.6ab196g
Vetch62.9def75a
Berseem Clover80.5ef83ab
Red Clover72.9ef78a
White Clover93.1f75a
Westerwolds22.6abc133f
Ethiopian Mustard27.7abcd121ef
Control (nothing planted)-ef73a
SEM14.74 8.53
Fisher’s LSD41.2523.9
D.f.77
Means which share different letters are significantly (p < 0.05) different to each other.
Table A4. Treatment means of nitrogen and carbon concentration and accumulation including C:N ratio in response to slurry.
Nitrogen %Carbon %Total Carbon Accumulation (g/m2)C:N Ratio
TreatmentNS *S #NSSNSSNSS
Means3.414.0541.6241.38156.37210.112.710.4
SED0.0950.21912.170.36
Stubble Turnips3.244.6540.2539.90155.2162.412.58.7
Japanese Black Oat3.023.2343.3743.25138.8136.514.613.4
Tillage Radish2.183.2341.9841.60326.4435.320.112.9
Forage Rape3.914.2741.2340.88156.6214.210.79.6
Forage Rye3.934.1442.9542.6066.9170.211.010.3
Winter Vetch3.963.9843.7744.7382.268.69.59.3
Brown Mustard4.175.4339.7739.65130.4214.59.57.4
Phacelia3.674.3639.4538.13168.7167.410.88.9
Oilseed Radish2.603.4141.2741.85202.4375.916.112.4
Westerwolds3.153.8043.0542.10170.8219.713.811.2
Ethiopian Mustard3.704.0940.7040.53121.7146.811.510.4
LSD0.446-50.7561.69
SED0.2230.725625.2320.85
* No Slurry; # Slurry.
Table A5. Species grain yield in response to slurry.
Grain Yield/m2
TreatmentNil SlurrySlurry
Stubble Turnips578.7651
Buckwheat354.4599.9
Japanese Black Oat401.4662.2
Tillage Radish611.4807.2
Forage Rape514810.5
Forage Rye443.5688.5
Winter Vetch375.6582.2
Brown Mustard510738.5
Phacelia509616.5
Oilseed Radish512.3795.7
Spring Vetch387.3477
Berseem Clover294.9582.7
Red Clover349.9545.7
White Clover369.6547.8
Westerwolds449625.7
Ethiopian Mustard481.6666.6
Control418.8521.3
Mean444.8642.3
SED45.34
SEM32.1
Figure A1. Average daily air and soil temperatures (°C).
Agronomy 10 01760 g0a1
Figure A2. Temperature during growth of cover crops (°C).
Agronomy 10 01760 g0a2
Figure A3. Photo of cover crops emerging.
Agronomy 10 01760 g0a3
Figure A4. Photo of spring barley growing outside.
Agronomy 10 01760 g0a4

References

  1. FAO. Global Soil Partnership. Available online: http://www.fao.org/global-soil-partnership/about/why-the-partnership/en/ (accessed on 13 February 2020).
  2. Brust, J.; Claupein, W.; Gerhards, R. Growth and weed suppression ability of common and new cover crops in Germany. Crop Prot. 2014, 63, 1–8. [Google Scholar] [CrossRef]
  3. Couëdel, A.; Alletto, L.; Tribouillois, H.; Justes, É. Cover crop crucifer-legume mixtures provide effective nitrate catch crop and nitrogen green manure ecosystem services. Agric. Ecosyst. Environ. 2018, 254, 50–59. [Google Scholar] [CrossRef]
  4. Lord, J.S.; Lazzeri, L.; Atkinson, A.H.; Urwin, P.E. Biofumigation for control of pale potato cyst nematodes: Activity of Brassica leaf extracts and green manures on Globodera pallida in vitro and in soil. J. Agric. Food Chem. 2011, 59, 7882–7890. [Google Scholar] [CrossRef] [PubMed]
  5. White, C.A.; Holmes, H.F.; Morris, N.L.; Stobart, R.M. A Review of the Benefits, Optimal Crop Management Practices and Knowledge Gaps Associated with Different Cover Crop Species; Agriculture and Horticulture Development Board: Cambridge, UK, 2016. [Google Scholar]
  6. Sapkota, T.B.; Askegaard, M.; Lægdsmand, M.; Olesen, J.E. Effects of catch crop type and root depth on nitrogen leaching and yield of spring barley. Field Crop. Res. 2012, 125, 129–138. [Google Scholar] [CrossRef]
  7. Aronsson, H.; Hansen, E.; Thomsen, I.K.; Liu, J.; Øgaard, A.; Kankanen, H.; Ulén, B. The ability of cover crops to reduce nitrogen and phosphorus losses from arable land in southern Scandinavia and Finland. J. Soil Water Conserv. 2016, 71, 41–55. [Google Scholar] [CrossRef] [Green Version]
  8. Kaspar, T.; Singer, J.W. The Use of Cover Crops to Manage Soil. Am. Soc. Agron. Soil Sci. Soc. Am. 2011, 321–337. [Google Scholar] [CrossRef] [Green Version]
  9. Akbari, P.; Herbert, S.; Hashemi, M.; Barker, A.; Omid, R.; Zandvakili, O.; Emami Bistgani, Z. Winter Annual Rye Seeding Date Influence on Nitrogen Recovery and Ammonia Volatilization from Late Fall Surface-Applied Manure. Agronomy 2020, 10, 931. [Google Scholar] [CrossRef]
  10. Büchi, L.; Wendling, M.; Amossé, C.; Necpalova, M.; Charles, R. Importance of cover crops in alleviating negative effects of reduced soil tillage and promoting soil fertility in a winter wheat cropping system. Agric. Ecosyst. Environ. 2018, 256, 92–104. [Google Scholar] [CrossRef]
  11. Martens, J.R.T.; Hoeppner, J.W.; Entz, M. Legume cover crops with winter cereals in southern Manitoba: Establishment, productivity, and microclimate effects. Agron. J. 2001, 93, 1086–1096. [Google Scholar] [CrossRef] [Green Version]
  12. Karlen, D.L. Tilth. In Encyclopedia of Soils in the Environment; Hillel, D., Ed.; Elsevier: Oxford, UK, 2005; pp. 168–174. [Google Scholar] [CrossRef]
  13. Finney, D.; Buyer, J.S.; Kaye, J.P. Living cover crops have immediate impacts on soil microbial community structure and function. J. Soil Water Conserv. 2017, 72, 361–373. [Google Scholar] [CrossRef] [Green Version]
  14. Masilionyte, L.; Maiksteniene, S.; Kriauciuniene, Z.; Jablonskyte-Rasce, D.; Zou, L.; Sarauskis, E. Effect of cover crops in smothering weeds and volunteer plants in alternative farming systems. Crop Prot. 2017, 91, 74–81. [Google Scholar] [CrossRef]
  15. Adhikari, L.; Mohseni-Moghadam, M.; Missaoui, A. Allelopathic Effects of Cereal Rye on Weed Suppression and Forage Yield in Alfalfa. Am. J. Plant Sci. 2018, 09, 685–700. [Google Scholar] [CrossRef] [Green Version]
  16. Basche, A.D.; Kaspar, T.C.; Archontoulis, S.V.; Jaynes, D.B.; Sauer, T.J.; Parkin, T.B.; Miguez, F.E. Soil water improvements with the long-term use of a winter rye cover crop. Agric. Water Manag. 2016, 172, 40–50. [Google Scholar] [CrossRef] [Green Version]
  17. Meyer, N.; Bergez, J.-E.; Constantin, J.; Belleville, P.; Justes, E. Cover crops reduce drainage but not always soil water content due to interactions between rainfall distribution and management. Agric. Water Manag. 2020, 231, 105998. [Google Scholar] [CrossRef]
  18. Walmsley, D.C.; Siemens, J.; Kindler, R.; Kirwan, L.; Kaiser, K.; Saunders, M.; Kaupenjohann, M.; Osborne, B.A. Dissolved carbon leaching from an Irish cropland soil is increased by reduced tillage and cover cropping. Agric. Ecosyst. Environ. 2011, 142, 393–402. [Google Scholar] [CrossRef]
  19. Muhammad, I.; Sainju, U.M.; Zhao, F.; Khan, A.; Ghimire, R.; Fu, X.; Wang, J. Regulation of soil CO2 and N2O emissions by cover crops: A meta-analysis. Soil Tillage Res. 2019, 192, 103–112. [Google Scholar] [CrossRef]
  20. Justes, E.; Mary, B.; Nicolardot, B. Quantifying and modelling C and N mineralization kinetics ofcatch crop residues in soil: Parameterization of the residue decomposition module of STICSmodel for mature and non mature residues. Plant Soil 2009, 325, 171–185. [Google Scholar] [CrossRef]
  21. Thorup-Kristensen, K. The effect of nitrogen catch crop species on the nitrogen nutrition of succeeding crops. Fertil. Res. 1994, 37, 227–234. [Google Scholar] [CrossRef]
  22. Hunter, M.C.; Schipanski, M.E.; Burgess, M.H.; LaChance, J.C.; Bradley, B.A.; Barbercheck, M.E.; Kaye, J.P.; Mortensen, D.A. Cover Crop Mixture Effects on Maize, Soybean, and Wheat Yield in Rotation. Agric. Environ. Lett. 2019, 4, 180051. [Google Scholar] [CrossRef]
  23. Abdalla, M.; Hastings, A.; Cheng, K.; Yue, Q.; Chadwick, D.; Espenberg, M.; Truu, J.; Rees, B.; Smith, P. A critical review of the impacts of cover crops on nitrogen leaching, net greenhouse gas balance and crop productivity. Glob. Chang. Biol. 2019, 25. [Google Scholar] [CrossRef] [Green Version]
  24. Kaye, J.; Finney, D.; White, C.; Bradley, B.; Schipanski, M.; Alonso-Ayuso, M.; Hunter, M.; Burgess, M.; Mejia, C. Managing nitrogen through cover crop species selection in the U.S. mid-Atlantic. PLoS ONE 2019, 14, e0215448. [Google Scholar] [CrossRef] [PubMed]
  25. Marcillo, G.S.; Miguez, F.E. Corn yield response to winter cover crops: An updated meta-analysis. J. Soil Water Conserv. 2017, 72, 226–239. [Google Scholar] [CrossRef] [Green Version]
  26. Büchi, L.; Gebhard, C.; Liebisch, F.; Sinaj, S.; Ramseier, H.; Charles, R. Accumulation of biologically fixed nitrogen by legumes cultivated as cover crops in Switzerland. Plant Soil 2015, 393, 1–13. [Google Scholar] [CrossRef]
  27. DAERA. Statistical Review of Northern Ireland Agriculture; Department of Agriculture, Environment and Rural Affairs: Belfast, Northern Ireland, 2017.
  28. Dabney, S.M.; Delgado, J.A.; Reeves, D.W. Using winter cover crops to improve soil and water quality. Commun. Soil Sci. Plant Anal. 2001, 32, 1221–1250. [Google Scholar] [CrossRef]
  29. Tom, K. Cover Crops for Soil and Water Quality. Am. Soc. Agron. Soil Sci. Soc. Am. 2009. [Google Scholar] [CrossRef] [Green Version]
  30. Frost, J.P.; Bailey, J.S.; Stevens, R.J. Making Best On-Farm Use of Plant Nutrients in Livestock Manures; Agricultural Research Institute of Northern Ireland: Belfast, Northern Ireland, 2005. [Google Scholar]
  31. Jarvis, S.; Hutchings, N.; Brentrup, F.; Olesen, J.; Van der Hoek, K. Nitrogen Flows in Farming Systems Across Europe. In Nitrogen Flows in Farming Systems; Cambridge University: Cambridge, NY, USA, 2011; pp. 211–228. [Google Scholar]
  32. DAERA. Nitrates Action Programme 2015-2018 and Phosphorus Regulations Guidance Booklet; Department of Agriculture, Environment and Rural Affairs: Belfast, Northern Ireland, 2016.
  33. Fallon, T. Estimating Farm Building Costs. Available online: https://www.teagasc.ie/rural-economy/farm-management/farm-buildings/drawings--costs/ (accessed on 24 July 2019).
  34. AHDB. Nutrient Mangement Guide (RB209); AHDB: Warwickshire, UK, 2017. [Google Scholar]
  35. Liu, J.; Kleinman, P.J.A.; Aronsson, H.; Flaten, D.; McDowell, R.W.; Bechmann, M.; Beegle, D.B.; Robinson, T.P.; Bryant, R.B.; Liu, H.; et al. A review of regulations and guidelines related to winter manure application. Ambio 2018, 47, 657–670. [Google Scholar] [CrossRef] [PubMed]
  36. Cambardella, C.A.; Moorman, T.B.; Singer, J.W. Soil nitrogen response to coupling cover crops with manure injection. Nutr. Cycl. Agroecosyst. 2010, 87, 383–393. [Google Scholar] [CrossRef]
  37. NRCS. Manure Nutrients Relative to the Capacity of Cropland and Pastureland to Assimilate Nutrients Spatial and Temporal Trends for the United States; Natural Resources Conservation Service, USDA: Washington, DC, USA, 2020.
  38. Salmerón, M.; Isla, R.; Cavero, J. Effect of winter cover crop species and planting methods on maize yield and N availability under irrigated Mediterranean conditions. Field Crop. Res. 2011, 123, 89–99. [Google Scholar] [CrossRef] [Green Version]
  39. Thapa, R.; Mirsky, S.; Tully, K. Cover Crops Reduce Nitrate Leaching in Agroecosystems: A Global Meta-Analysis. J. Environ. Qual. 2018, 47. [Google Scholar] [CrossRef]
  40. Thilakarathna, M.; Serran, S.; Lauzon, J.; Janovicek, K.; Deen, B. Management of Manure Nitrogen Using Cover Crops. Agron. J. 2015. [Google Scholar] [CrossRef] [Green Version]
  41. Parkin, T.B.; Kaspar, T.; Singer, J.W. Cover crop effects on the fate of N following soil application of swine manure. Plant Soil 2006, 289. [Google Scholar] [CrossRef]
  42. Singer, J.W.; Cambardella, C.A.; Moorman, T.B. Enhancing Nutrient Cycling by Coupling Cover Crops with Manure Injection. Agron. J. 2008, 100. [Google Scholar] [CrossRef] [Green Version]
  43. Everett, L.; Wilson, M.; Pepin, R.; Coulter, J. Winter Rye Cover Crop with Liquid Manure Injection Reduces Spring Soil Nitrate but Not Maize Yield. Agronomy 2019, 9, 852. [Google Scholar] [CrossRef] [Green Version]
  44. Gleadell. Cover Crop Guide 2017–2018; Gleadell Agriculture Ltd.: Linconshire, UK, 2017. [Google Scholar]
  45. Jackson, E.; Farrington, D.S.; Henderson, K. The Analysis of Agricultural Materials: A Manual of the Analytical Methods Used by the Agricultural Development Board, 3rd ed.; ADAS, Ministry of Agriculture, Fisheries and Food: London, UK, 1986; p. 248. [Google Scholar]
  46. Liu, J.; Li, J.; Ma, Y.; Jia, Y.; Liang, Q. Apparent Accumulated Nitrogen Fertilizer Recovery in Long-Term Wheat–Maize Cropping Systems in China. Agronomy 2018, 8, 293. [Google Scholar] [CrossRef] [Green Version]
  47. Cavalli, D.; Cabassi, G.; Borrelli, L.; Fuccella, R.; Bechini, L.; Marino Gallina, P.; Degano, L. Nitrogen fertiliser value of digested dairy cow slurry, its liquid and solid fractions, and of dairy cow slurry. Ital. J. Agron. 2014, 9. [Google Scholar] [CrossRef]
  48. VSN International. Genstat for Windows 18th. VSN International 2015. Available online: https://www.vsni.co.uk/ (accessed on 13 February 2020).
  49. Wittwer, R.; Dorn, B.; Jossi, W.; Van der Heijden, M. Cover crops support ecological intensification of arable cropping systems. Sci. Rep. 2017, 7, 41911. [Google Scholar] [CrossRef] [PubMed] [Green Version]
  50. Stobart, M.R.; Morris, N.L. The impact of cover crops on yield and soils in the New Farming Systems programme. Asp. Appl. Biol. 2014, 127, 223–232. [Google Scholar]
  51. Storr, T.; Simmons, R.W.; Hannam, J.A. A UK survey of the use and management of cover crops. Ann. Appl. Biol. 2019, 174, 179–189. [Google Scholar] [CrossRef] [Green Version]
  52. Larkin, R.P.; Griffin, T.S. Control of soilborne potato diseases using Brassica green manures. Crop Prot. 2007, 26, 1067–1077. [Google Scholar] [CrossRef]
  53. Henderson, D.R.; Riga, E.; Ramirez, R.A.; Wilson, J.; Snyder, W.E. Mustard biofumigation disrupts biological control by Steinernema spp. nematodes in the soil. Biol. Control 2009, 48, 316–322. [Google Scholar] [CrossRef]
  54. Kirkegaard, J.A.; Sarwar, M.; Wong, P.T.W.; Mead, A.; Howe, G.; Newell, M. Field studies on the biofumigation of take-all by Brassica break crops. Aust. J. Agric. Res. 2000, 51, 445–456. [Google Scholar] [CrossRef]
  55. Falk, K.L.; Tokuhisa, J.G.; Gershenzon, J. The Effect of Sulfur Nutrition on Plant Glucosinolate Content: Physiology and Molecular Mechanisms. Plant Biol. 2007, 9, 573–581. [Google Scholar] [CrossRef] [PubMed]
  56. Chen, X.-J.; Zhu, Z.; Ni, X.-L.; Qian, Q.-Q. Effect of Nitrogen and Sulfur Supply on Glucosinolates in Brassica Campestris ssp. Chinensis. Agric. Sci. China 2006, 5, 603–608. [Google Scholar] [CrossRef]
  57. Couëdel, A.; Alletto, L.; Kirkegaard, J.; Justes, É. Crucifer glucosinolate production in legume-crucifer cover crop mixtures. Eur. J. Agron. 2018, 96, 22–33. [Google Scholar] [CrossRef]
  58. EPA. Greenhouse Gases Equivalencies Calculator—Calculations and References. Available online: https://www.epa.gov/energy/greenhouse-gases-equivalencies-calculator-calculations-and-references (accessed on 1 July 2019).
  59. Paustian, K.; Larson, E.; Kent, J.; Marx, E.; Swan, A. Soil C Sequestration as a Biological Negative Emission Strategy. Front. Clim. 2019, 1. [Google Scholar] [CrossRef]
  60. Sullivan, D.M.; Andrews, N.D. Estimating Plant-Available Nitrogen Release from Cover Crops; Oregeon State University: Corvallis, OR, USA, 2012. [Google Scholar]
  61. IPCC. Contribution of Working Group I to the Fifth Assessment Report of the Intergovernmental Panel on Climate Change; Cambridge University Press: New York, NY, USA, 2013; p. 1535. [Google Scholar]
  62. Jordan, C.; Smith, R.V. Methods to predict the agricultural contribution to catchment nitrate loads: Designation of nitrate vulnerable zones in Northern Ireland. J. Hydrol. 2005, 304, 316–329. [Google Scholar] [CrossRef]
  63. Bezuidenhout, S.R.; Reinhardt, C.F.; Whitwell, M.I. Cover crops of oats, stooling rye and three annual ryegrass cultivars influence maize and Cyperus esculentus growth. Weed Res. 2012, 52, 153–160. [Google Scholar] [CrossRef] [Green Version]
  64. Baraibar, B.; Hunter, M.; Schipanski, M.; Hamilton, A.; Mortensen, D. Weed Suppression in Cover Crop Monocultures and Mixtures. Weed Sci. 2017, 66, 1–13. [Google Scholar] [CrossRef]
  65. Jabloun, M.; Schelde, K.; Tao, F.; Olesen, J.E. Effect of temperature and precipitation on nitrate leaching from organic cereal cropping systems in Denmark. Eur. J. Agron. 2015, 62, 55–64. [Google Scholar] [CrossRef]
  66. Teixeira, E.I.; Johnstone, P.; Chakwizira, E.; Ruiter, J.D.; Malcolm, B.; Shaw, N.; Zyskowski, R.; Khaembah, E.; Sharp, J.; Meenken, E.; et al. Sources of variability in the effectiveness of winter cover crops for mitigating N leaching. Agric. Ecosyst. Environ. 2016, 220, 226–235. [Google Scholar] [CrossRef]
  67. Fritz, C.; Wichern, F. In the land of plenty: Catch crops trigger nitrogen uptake by soil microorganisms. Plant Soil 2017, 423, 1–14. [Google Scholar] [CrossRef]
  68. Eriksen, J.; Thorup-Kristensen, K. The effect of catch crops on sulphate leaching and availability of S in the succeeding crop on sandy loam soil in Denmark. Agric. Ecosyst. Environ. 2002, 90, 247–254. [Google Scholar] [CrossRef]
  69. Couëdel, A.; Alletto, L.; Justes, E. Crucifer-legume cover crop mixtures provide effective sulphate catch crop and sulphur green manure services. Plant Soil 2018. [Google Scholar] [CrossRef]
  70. White, C.M.; DuPont, S.T.; Hautau, M.; Hartman, D.; Finney, D.M.; Bradley, B.; LaChance, J.C.; Kaye, J.P. Managing the trade off between nitrogen supply and retention with cover crop mixtures. Agric. Ecosyst. Environ. 2017, 237, 121–133. [Google Scholar] [CrossRef] [Green Version]
  71. Nevins, C.J.; Nakatsu, C.; Armstrong, S. Characterization of microbial community response to cover crop residue decomposition. Soil Biol. Biochem. 2018, 127, 39–49. [Google Scholar] [CrossRef]
  72. Janusauskaite, D.; Arlauskienė, A.; Maikštėnienė, S. Soil mineral nitrogen and microbial parameters as influenced by catch crops and straw management. Zemdirb. Agric. 2013, 100, 9–18. [Google Scholar] [CrossRef] [Green Version]
  73. Clark, A. Managing Cover Crops Profitabily, 3rd ed.; Sustainable Agriculture, Research and Eductaion: University of Vermont (USA): Burlington, VT, USA, 2012. [Google Scholar]
  74. Zörb, C.; Ludewig, U.; Hawkesford, M.J. Perspective on Wheat Yield and Quality with Reduced Nitrogen Supply. Trends Plant Sci. 2018, 23, 1029–1037. [Google Scholar] [CrossRef] [Green Version]
  75. Olesen, J.; Askegaard, M.; Rasmussen, I. Winter cereal yields as affected by animal manure and green manure in organic arable farming. Eur. J. Agron. 2009, 30, 119–128. [Google Scholar] [CrossRef]
  76. Li, X.S.; Sørensen, P.; Li, F.; Petersen, S.O.; Olesen, J.E. Quantifying biological nitrogen fixation ofdifferent catch crops, and residual effects of roots and tops on nitrogen uptake in barley using in-situ 15N labelling. Plant Soil 2015, 395, 273–287. [Google Scholar] [CrossRef]
  77. Carlsson, G.; Huss-Danell, K. Nitrogen fixation in perennial forage legumes in the field. Plant Soil 2003, 253, 353–372. [Google Scholar] [CrossRef]
  78. Seman-Varner, R.; Varco, J.; O’Rourke, M. Nitrogen Benefits of Winter Cover Crop and Fall-Applied Poultry Litter to Corn. Agron. J. 2017, 109. [Google Scholar] [CrossRef]
  79. Restovich, S.B.; Andriulo, A.E.; Armas-Herrera, C.M.; Beribe, M.J.; Portela, S.I. Combining cover crops and low nitrogen fertilization improves soil supporting functions. Plant Soil 2019, 442, 401–417. [Google Scholar] [CrossRef]
  80. Glendining, M.; Powlson, D.S. The Effect of Long-term Applications of Inorganic Nitrogen Fertilizer on Soil Organic Nitrogen. J. Agric. Sci. 2003, 127, 329–338. [Google Scholar] [CrossRef]
  81. Chavarría, D.N.; Verdenelli, R.A.; Serri, D.L.; Restovich, S.B.; Andriulo, A.E.; Meriles, J.M.; Vargas-Gil, S. Effect of cover crops on microbial community structure and related enzyme activities and macronutrient availability. Eur. J. Soil Biol. 2016, 76, 74–82. [Google Scholar] [CrossRef]
  82. EC. From Farm to Fork: Our Food, Our Health, Our Planet, Our Future. In Moving Towards a More Healthy and Sustainable EU Food System, a Corner Stone of the European Green Deal; European Commission: Brussels, Belgium, 2020. [Google Scholar]
  83. Boston Seeds. All Cover Crop Species; Boston Seeds: Lincolnshire, UK, 2017. [Google Scholar]
  84. Hurrells Specialist Seeds. Catch Crop Seed (Mixtures & Straights); Hurrells Specialist Seeds: East Yorkshire, UK, 2017. [Google Scholar]
Figure 1. Species N accumulation in response to slurry (g/m2). The bars represent the species mean for both treatments of slurry (N = 4). Error bars represent Standard Error (SE). Letters represent significant differences between cover crops using Fisher’s post-hoc test 0.05 LSD = 3.69. Means that do not share the same letters are significantly (p < 0.05) different. Slurry supplied 33.0 g/m2 of total N.
Agronomy 10 01760 g001
Figure 2. Species accumulation of P, K, Mg and S in response to slurry (g/m2). N = 4 for each mean reported. Standard error of the mean (SEM) and the least significant difference using Fisher’s post-hoc test (0.05) (LSD) are shown below each heat map for treatments that were found to be significant.
Agronomy 10 01760 g002
Figure 3. Grain yield post cover crop as affected by cover crop species (g/m2). Bars represent species mean (N = 8) whilst the bar colour indicates the species family. Error bars represent Standard Error of the Mean (SEM). Letters represent significant differences between cover crops using Fisher’s Unprotected post-hoc test 0.05 LSD = 96.91. Means that do not share the same letters are significantly (p < 0.05) different. Typical farm yields in Northern Ireland are 500 g/m2, high 650 g/m2, low 400 g/m2.
Agronomy 10 01760 g003
Figure 4. Spring barley total N accumulation as affected by cover crop species (g/m2).The bars represent species mean (N = 6). Error bars represent the Standard Error (SE). Letters represent significant differences between cover crops using Fisher’s post-hoc test 0.05 LSD = 1.874. Means that do not share the same letters are significantly (p < 0.05) different.
Agronomy 10 01760 g004
Figure 5. Total detectable N for each cover crop species in response to slurry (g/m2). * Detectable N = Spring barley grain, straw + chaff N offtake + SMN. The bars represent the species mean for both treatments of slurry (N = 3). Error bars represent Standard Error (SE). Letters represent significant differences between cover crops using Fisher’s post-hoc test 0.05 LSD = 2.68. Means that do not share the same letters are significantly (p < 0.05) different.
Agronomy 10 01760 g005
Figure 6. Apparent Nitrogen Recovery (ANRoS) of the species in response to slurry (%). The bars represent the species mean ANRoS in response to slurry (N = 3). Error bars represent Standard Error of the Mean (SEM). Letters represent significant differences between cover crops using Fisher’s Unprotected post-hoc test 0.05 LSD = 16.27. Means that do not share the same letters are significantly (p < 0.05) different.
Agronomy 10 01760 g006
Table 1. Soil analysis.
pHPKMgSTNTCLOISMN
Mg/LMg/LMg/LMg/L%%%g/m2
6.6237.9 *3170 *2239 *46.39 *10.3243.419.636.46
* Numbers indicate nutrient index categorised by the Department for Environment, Food & Rural Affairs scale.
Table 2. Slurry analysis.
NutrientsConcentrationApplied/m2
(%)(g)
K *0.4922.1
P *0.114.87
S *0.062.58
Mg *0.062.85
NH4 *0.5123.2
Total % N0.7333.0
Dry matter applied
DM6.61299
* analysed on a fresh basis.
Table 3. Recovery of the certified reference material run with EDXRF analysis.
PKMgS
Certified (mg kg−1)250019,10029202410
Average recovery (mg kg−1)238216,69032382389
Standard deviation20.4137.0150.326.0
CV0.90.84.61.1
Recovery (%)95.387.4110.999.1
Table 4. ANOVA of treatments.
TreatmentBiomass Production (g/m2)Weed Production (g/pot)Water Usage (L)
Slurry<0.05<0.050.19
Species<0.001<0.001<0.001
Slurry × Species<0.0010.260.10
Table 5. Cover crop biomass, weed biomass and water usage for each treatment.
SpeciesTreatmentCover Crop Biomass (g/m2)Weed Biomass (g/m2)Water Usage (L/m2)
White Clover ¥Nil Slurry2a125.878.0
White Clover ¥Slurry4a60.472.9
Red Clover ¥Nil Slurry14ab83.072.9
Red Clover ¥Slurry15ab62.980.5
ControlSlurry52ab-65.4
Berseem Clover ¥Slurry53ab35.272.9
Berseem Clover ¥Nil Slurry55ab125.893.1
Spring Vetch ¥Slurry65ab93.175.5
Spring Vetch ¥Nil Slurry67ab35.275.5
Buckwheat Nil Slurry95ab42.872.9
ControlNil Slurry96ab-80.5
Winter Vetch ¥Slurry131abc17.690.5
Winter Vetch ¥Nil Slurry137abc37.788.0
Forage Rye αNil Slurry156abcd78.0100.6
Buckwheat Slurry163bcde37.7100.6
Forage Rape Nil Slurry288cdef15.198.1
Ethiopian Mustard Nil Slurry297def37.7115.7
Stubble Turnips Slurry309def22.6110.7
Japanese Black Oat αSlurry316def27.7108.1
Japanese Black Oat αNil Slurry320ef67.9103.1
Forage Rye αSlurry322f37.7123.2
Brown Mustard Nil Slurry327f12.6115.7
Ethiopian Mustard Slurry357fg17.6123.2
Stubble Turnips Nil Slurry385fgh7.5140.8
Westerwolds αNil Slurry396fgh37.7120.7
Phacelia ±Nil Slurry428fgh15.1123.2
Phacelia ±Slurry433fgh10.1133.3
Oilseed Radish Nil Slurry489gh15.1168.5
Westerwolds αSlurry521h5.0145.9
Forage Rape Slurry524h15.1128.1
Brown Mustard Slurry538h12.6133.3
Tillage Radish Nil Slurry777i5.0226.4
Oilseed Radish Slurry895ij2.5226.4
Tillage Radish Slurry1048j5.0249.0
SEM56.9 20.6312.37
LSD160.1
¥ Fabacea; Polygonaceae; α Poaceae; Brassicaceae; ± Borginaceae. SEM = standard error of the mean. LSD = least significant difference. Means which share different letters are significantly (p < 0.05) different to each other.
Table 6. ANOVA values for effect of treatments on macronutrient concentration and accumulation.
Macro-Nutrient Concentrations (mg/kg)Macro-Nutrient Accumulations (g/m2)
TreatmentPKMgSPKMgS
Slurry<0.050.320.06<0.050.06<0.050.060.06
Species<0.001<0.001<0.001<0.001<0.001<0.001<0.001<0.001
Slurry × Species0.720.50.970.480.07<0.01<0.01<0.01
Table 7. Total apparent N recovery (TANR) (%).
TreatmentNo SlurrySlurrySpecies Mean
Oilseed radish169.174.0121.5 c
Forage Rape172.671.6122.1 bc
Tillage Radish183.473.6128.5 bc
Forage Rye162.660.4111.5 abc
Phacelia178.962.2120.5 ab
Winter Vetch146.148.197.1 ab
Stubble Turnips197.559.3128.4 a
Control149.146.197.6 a
Mean169.961.9
SEMLSD
Slurry3.2319.12
Species3.1617.82
Slurry × Species2.8843.94
Means which do not share the same letter are significantly (p < 0.05) different to each other.
Publisher’s Note: MDPI stays neutral with regard to jurisdictional claims in published maps and institutional affiliations.

