Article

Data Mining Nitrogen-Responsive Gene Expression for Source–Sink Relations and Indicators of N Status in Potato

1
Department of Mathematics & Statistics, Dalhousie University, 6316 Coburg Rd., P. O. Box 15000, Halifax, NS B3H 4R2, Canada
2
Fredericton Research and Development Centre, Agriculture and Agri-Food Canada, 850 Lincoln Rd., P.O. Box 20280, Fredericton, NB E3B 4Z7, Canada
3
Quebec Research and Development Centre, Agriculture and Agri-Food Canada, 2560 Hochelaga Boulevard, Quebec, QC G1V 2J3, Canada
4
Normandin Experimental Farm, Agriculture and Agri-Food Canada, 1468, Saint-Cyrille, Normandin, QC G8M 4K3, Canada
5
Canada-Manitoba Crop Diversification Centre, P.O. Box 309, Carberry, MB R0K 0H0, Canada
6
Charlottetown Research and Development Centre, Agriculture and Agri-Food Canada, 440 University Ave., Charlottetown, PEI C1A 4N6, Canada
7
Department of Plant Science, McGill University, 21111 Lakeshore Rd., Ste-Anne-de-Bellevue, QC H9X 3V9, Canada
*
Author to whom correspondence should be addressed.
Agronomy 2020, 10(10), 1617; https://doi.org/10.3390/agronomy10101617
Submission received: 11 September 2020 / Revised: 17 October 2020 / Accepted: 19 October 2020 / Published: 21 October 2020
(This article belongs to the Section Soil and Plant Nutrition)

Abstract

:
Potato tuber yields depend on nitrogen (N) supply, which affects source–sink relations. Transcriptome sequencing of the foliar source using a single field trial identified gene expression responsive to 180 kg N ha−1. The expression of N-responsive genes was further analyzed in the next stage using a NanoString nCounter over an expanded number of foliar samples from seven field trials with varying N rates, sites, and cultivars. Least absolute shrinkage and selection operator (LASSO) regression models of gene expression predictive of yield, total plant N uptake, and tuber-specific gravity (proxy for dry matter) were built. Genes in the LASSO model for yield were associated with source–sink partitioning. A key gene regulating tuberization and senescence, StSP6A Flowering locus T, was found in the LASSO model predicting tuber yield, but not the other models. An aminotransferase involved in photorespiratory N assimilation and amino acid biosynthesis was found in all LASSO models. Other genes functioning in amino acid biosynthesis and integration of sulfur (S) and N metabolism were also found in the yield prediction model. The study provides insights on N responses in foliage of potato plants that affect source–sink partitioning. Additionally, N-responsive genes predictive of yield are candidate indicators of N status.

1. Introduction

Tubers are underground starch-storage extensions from the stem, which are used for vegetative propagation and are the major sink organ of the potato (Solanum tuberosum L.). Tuber yield is dependent on radiation intercepted by leaves and is responsive to N fertilization [1]. Increasing N supply increases plant canopy development, which then increases radiation reception leading to increases in photosynthates used for tuber production [2,3,4]. Sub-optimal N supply leads to growth retardation and low tuber yield and quality. However, application of N in excess of the plant’s N requirement can contribute to environmental pollution, particularly, nitrate leaching to groundwater and emissions of nitrous oxide, a greenhouse gas [5]. High N rates can also result in decreased tuber quality [6,7]. There are complex relationships between N supply and source–sink relations in tuber production. Under commercial potato production, roots take up N from soils via transporters mostly as nitrate but also in the form of ammonium [8]. These inorganic nitrogenous compounds are assimilated into organic compounds by a series of enzymatic processes occurring primarily in leaves resulting in synthesis of amino acids [9]. The foliar response to N contributing to source–sink relations in tuber production is not well-understood. Studies have shown that N supply affects leaf size and duration rather than photosynthetic efficiency [10,11,12,13]. To better understand source responses to N that affect sink development, the current study examined gene expression in source tissue (leaves of the potato vine) mid-season to find N-responsive biological processes associated with tuber yield. Gene expression associated with tuber dry matter (as measured using specific gravity as a proxy trait) and total plant N uptake were also compared. Knowledge of N-responsive processes contributing to tuber yield is needed to improve N use efficiency in potato plants and to develop indicators of crop N status to guide the optimization of N fertilizer application. Application rates of N are currently mainly guided using predictions of mineral N supply from the soil, which does not take into account in-season variation in growth conditions [5,14]. In-season monitoring of N status during crop growth can provide more precise determination of the N requirement needed to meet economic and environmental goals [15,16]. Development of a foliar diagnostic is advantageous as the tissue is above ground and accessible for sampling. Foliar gene expression responsive to N was identified in other studies and has potential application in monitoring crop N status [17,18,19,20,21,22]. In addition to N response, genes with functions associated with source–sink relations have even greater relevance to crop N status, and identification of these genes was the goal of the current study.
The current study used data from a single field trial to identify N-responsive gene expression in potato foliage. Two methods were used to identify differentially expressed genes with N supply—CuffDiff [17,23] and uncorrelated shrunken centroids [24]. The foliar expression of the N-responsive genes was then analyzed over seven field trials where samples used for analysis of gene expression were taken from the plants in the same plots used for collection of crop data—yield, total N uptake and specific gravity. Multiple field trials enabled yield to be determined across a range of soil and environmental conditions, which provided a more accurate picture of sink partitioning under N supply compared to greenhouse trials using potted plants. In the current study, transcriptome sequencing was used to identify genes differentially expressed with N supply using a single field trial [17]. These N-responsive genes were further analyzed using the NanoString nCounter platform [25]. This platform quantifies gene expression by direct counting of mRNA transcripts hybridized to probes labelled with fluorescent tags using an imaging system embedded in the instrument. The nCounter system does not require enzymatic steps, hence analysis of large numbers of samples can be done in shorter amounts of time with less laboratory handling compared to transcriptome sequencing and RT-PCR. The capacity for analysis of large sample numbers and relatively low cost of nCounter analysis makes it amenable as a diagnostic tool for gene expression compatible with in-season monitoring of N status in potato plants. The nCounter system was used to quantify gene expression for a large set of samples assembled from seven replicated field trials at four locations across Canada involving five cultivars of potato grown at varying N rates. A novel data mining approach with LASSO was used to analyze the nCounter data to find gene expression predictive of tuber yield, total plant N uptake, and tuber-specific gravity. Studies by others have demonstrated the effectiveness of LASSO in mining gene expression to find genes involved in seed coat mucilage and pectin metabolism in Arabidopsis thaliana [26]. LASSO both selects a subset of highly correlated genes and performs ridge regression to make predictions [27]. As such, genes selected in the LASSO analysis provided further insight into N-responsive molecular processes associated with yield, total plant N uptake, and tuber-specific gravity. This information was used to identify candidate indicators for N status.

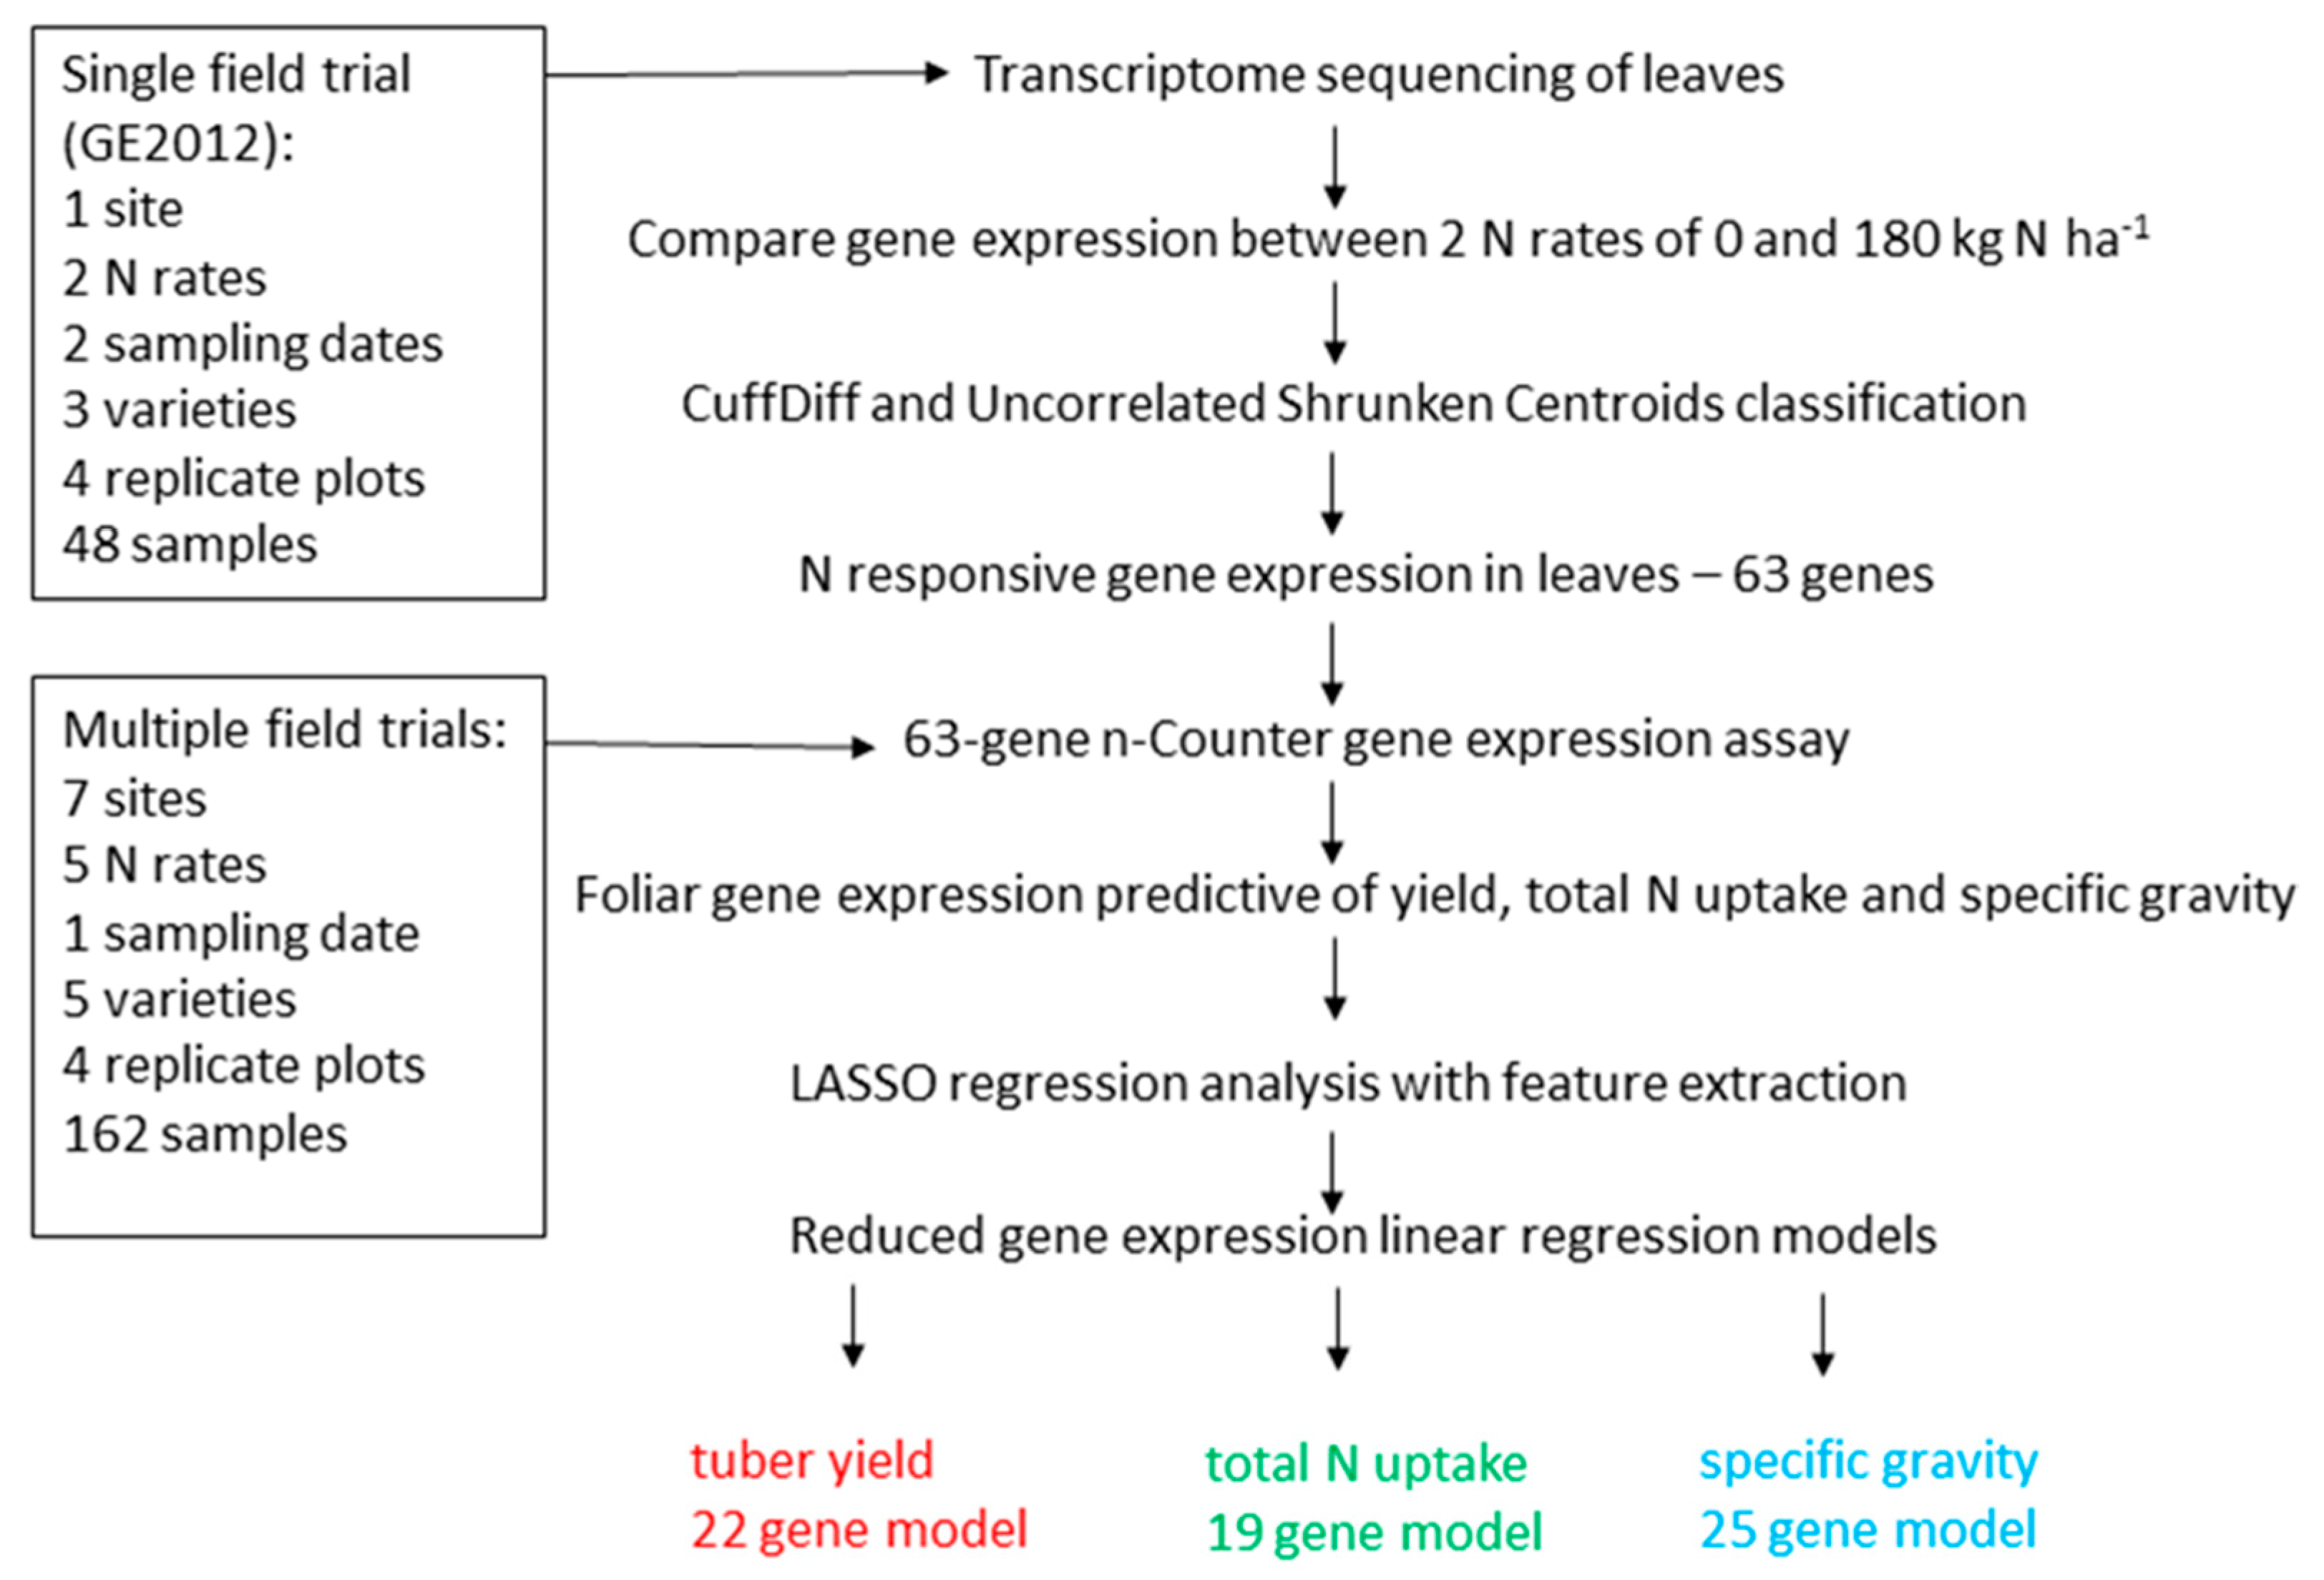
2. Materials and Methods
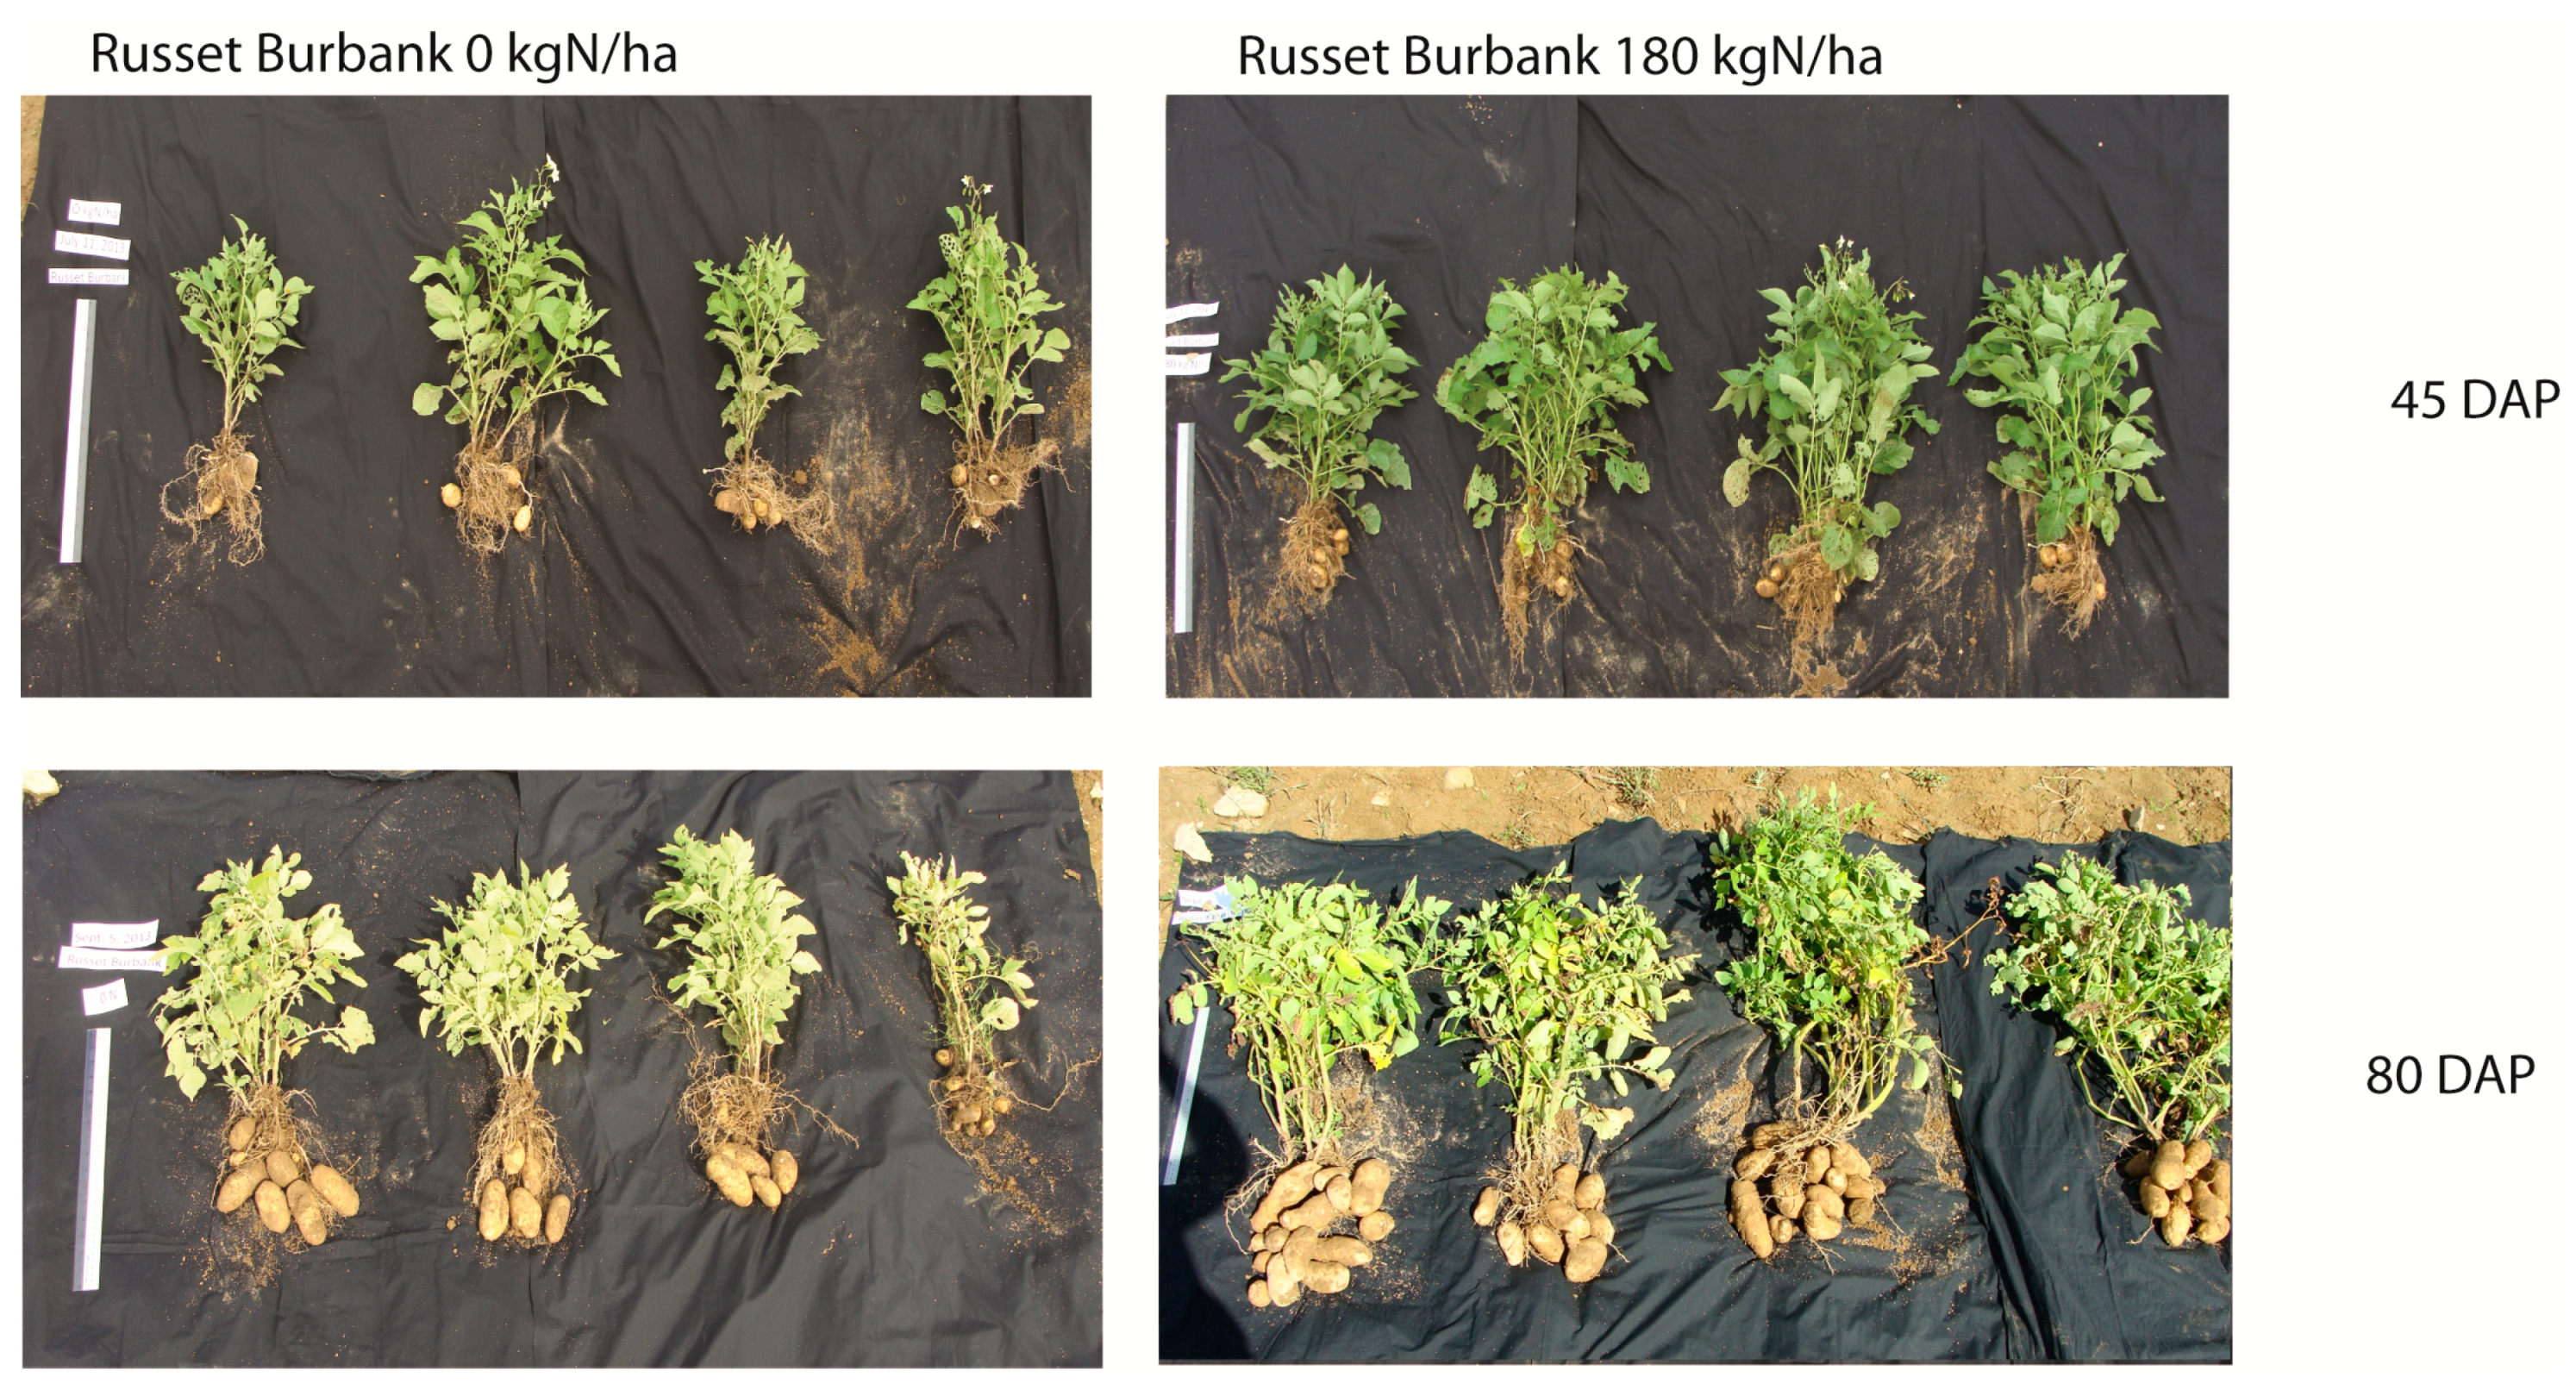
2.1. Field Trials

Tubers were planted at four locations in Canada (Carberry, MB; Péribonka, QC; Harrington, PE; and Fredericton, NB), in a total of seven field trials, to capture a range of soil and environmental conditions (Table 1 and Supplementary Table S1). The 30-year average mean temperature and precipitation during the growing season is presented in Table 1 to illustrate the variation in the sites. Leaves were sampled for gene expression between 42 and 50 days after planting (DAP) from the seven trials, which was coordinated with the timing of a second application of N in split N fertilization (Table 1) [6]. Cultivars planted at each site varied. In total there were five cultivars (Russet Burbank, Jemseg, Shepody, Atlantic, and Classic Russet). Each cultivar was planted in four replicate plots of 15 hills (plants) for each N treatment for each trial. Various rates and sources of mineral N fertilizer were applied depending on the site (see Supplementary Table S1 and S2). Nitrogen fertilizer was applied at planting at all sites and a second application of fertilizer was applied at dates indicated in Table 1 at three of the sites. For data analysis, the total N rate from both applications was used. Samples treated with total N rates of 106 and 120 kg N ha−1 were combined as a 106–120 treatment rather than as separate treatments, and similarly total N rates of 180 and 200 kg N ha−1 were combined as a 180–200 treatment. Combining samples for the treatment was supported by data that showed that there were no statistically significant differences in yield, specific gravity, or total N uptake response between the 106 and 120 kg N ha−1 treatments or between the 180 to 200 kg N ha−1 treatments (data not shown).
Total yield (tuber mass per hectare) was determined by weighing tubers in each plot that had a known area. Whole plant samples (4) were removed from each plot. Vines, stolons, and readily recoverable roots were washed, oven-dried, and weighed to determine dry matter yield. Dried plant tissue was ground and total N concentration was determined by dry combustion [28]. Tuber-specific gravity was used as a proxy for tuber dry matter [29]. Specific gravity was calculated on approximately 4.5 kg of tubers with marketable size categories from each plot using the weight in air minus weight in water method [30].

2.2. RNA Extraction

For each plot, the last fully expanded leaf from each of 15 hills (plants) from each plot was sampled using a hole punch 42–50 days after planting. The 15 leaf disk samples were pooled in a 2 mL screw cap tube with 750 µL of RNALater (Ambion, Austin, TX, USA). Leaf disks were stored at 4 ℃ for up to two weeks. RNALater was removed and leaves were rinsed twice in borate buffer (200 mM sodium borate decahydrate (Borax), pH 9.0, 30 mM ethylene glycol bis (β-aminoethyl ether)-N-N’-tetraacetic acid (EGTA), 1% (w/v) sodium dodecyl sulfate (SDS), and 10 mM dithiothreitol) plus 1% (w/v) sodium deoxycholate and 2% (w/v) polyvinylpyrrolidone (PVP) (Mr 40,000)) [31,32] at room temperature. The borate buffer was drained and the leaves were flash-frozen in liquid nitrogen. Leaf tissue was ground using two metal ball bearings in a FastPrep24 homogenizer (MP Biomedical, Solon, OH, USA). Samples were pre-extracted in 1 mL borate buffer. The lysate supernatant (200 μL) was used for RNA extraction with the Biomek NXP Laboratory Automation Workstation (Beckman Coulter, Mississauga, ON, Canada) using the RNAdvance Tissue Kit (Beckman Coulter, Mississauga, ON, Canada) according to the manufacturer’s instructions for liquid samples. The RNA concentration and quality were determined using a NanoDrop 1000 Spectrophotometer (Thermo Scientific, Dartmouth, NS, Canada) and 2100 Bioanalyzer (Aglient Technologies, Santa Clara, CA, USA), respectively. There was a total of 162 samples in the study.

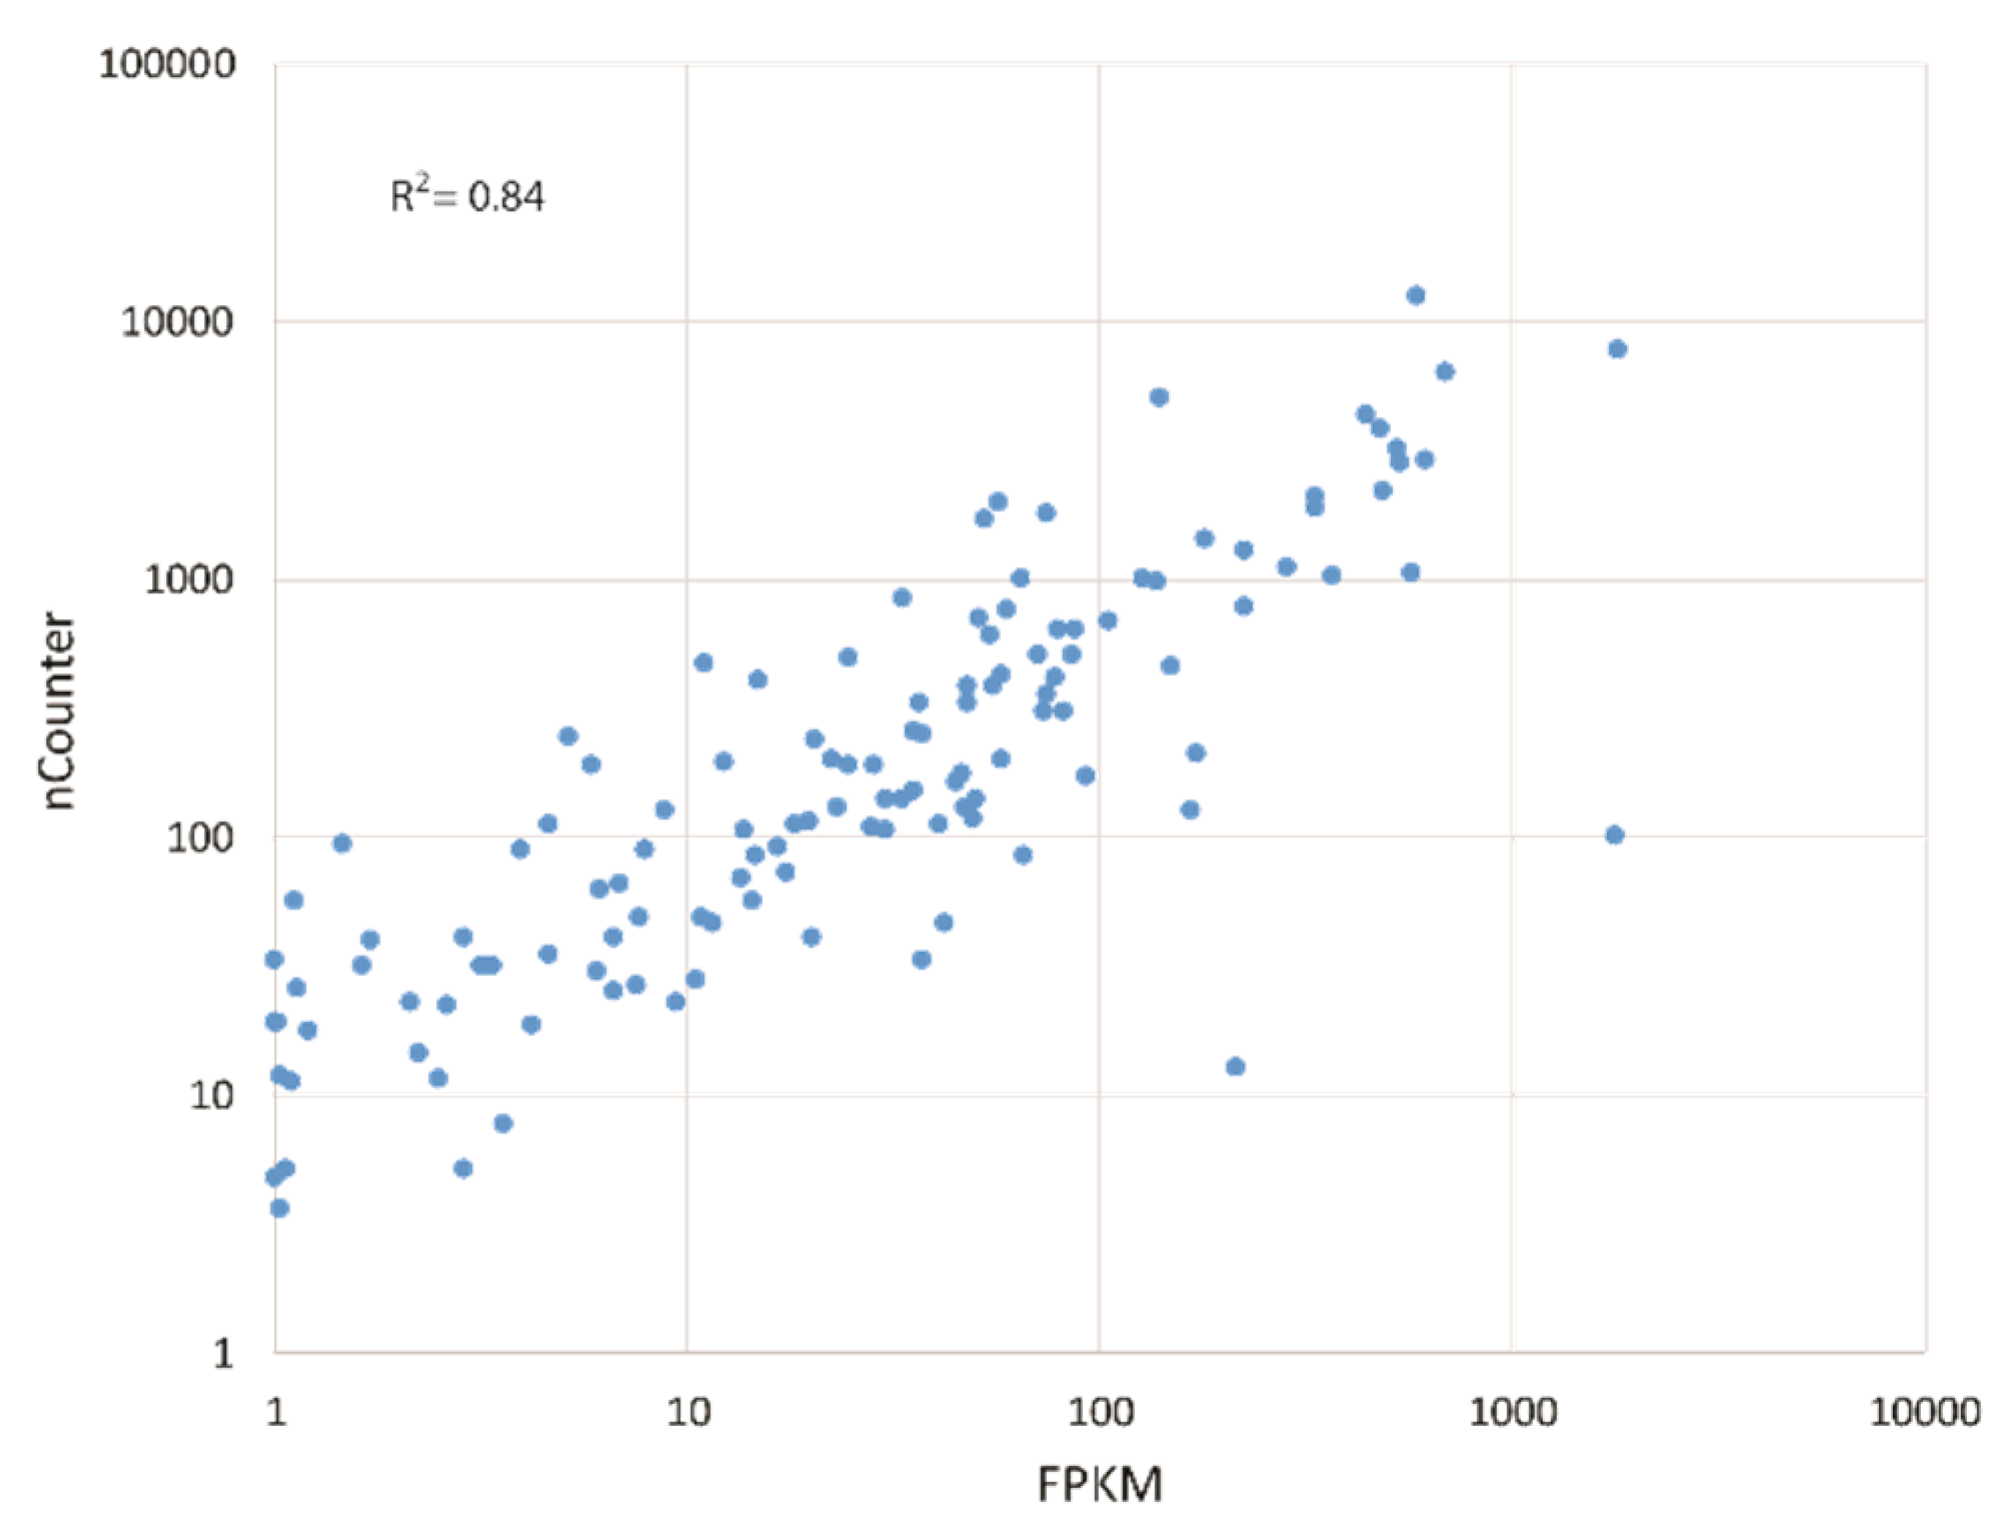
2.3. Transcriptome Sequencing Data Analysis

Genome-wide gene expression analysis was done using transcriptome sequencing data from a previous study [17] that used leaves from the GE2012 trial (Table 1, Figure 1). Briefly, leaves were sampled from the GE2012 trial from three cultivars (Russet Burbank, Atlantic, and Shepody) treated with two fertilizer N rates, 0 (control) and 180 kg N ha−1 (treated) in a randomized complete block design with four blocks. Sampling of leaves was done at two dates—25 July and 8 August 2012. Forty-eight samples from the GE2012 trial were used for the transcriptome analysis. National Centre for Biotechnology Information Gene Expression Omnibus (NCBI GEO) accession for the data is GSE75926. Differentially expressed genes between the control and treated samples were identified using the negative binomial t-test in CuffDiff for the three cultivars at two time points [17]. The fragments per kilobase of transcript per million mapped reads (FPKM) from the transcriptome sequencing data was further analyzed using another approach in the current study. FPKM was log2 transformed and analyzed using uncorrelated shrunken centroids (USC) [24] as implemented in Multi-experiment Viewer (MeV4.9) [33] with delta 2.5, #bins 20, and rho 0.9. USC is a supervised machine learning classification algorithm that was used to select genes that can classify samples into control and treatment groups based on gene expression. All of the differentially expressed genes from the previous and the current transcriptome sequencing data analyses were combined as the set of N-responsive foliar genes for further analysis using nCounter.

2.4. nCounter Gene Expression Analysis

Multiplex analysis of the expression of 68 genes was done using the nCounter Digital Analyzer (NanoString Technologies, Inc., Seattle, WA, USA). Details of nCounter multiplex gene expression analysis are described elsewhere [25]. The natural logarithm was used to transform data prior to analysis. The genes included five reference genes and 63 N-responsive experimental genes (Supplementary Table S1). The probe sequences used in the nCounter CodeSet were from the potato genome reference sequence [34] and are in Supplementary Table S3. Thirty-six of the experimental genes were identified using the USC analysis described above. Another 24 genes were identified using a negative binomial t-test from a previous study [17] and three were selected based on previous studies using nCounter [19,21]. There were four glutaredoxin genes identified using USC; however, the nCounter assay had a single probe for detecting Sotub04g010640 (glutaredoxin) due to the similarity in sequence between the glutaredoxin genes. This probe can detect all four genes, therefore expression for the Sotub04g010640 was representative of any and all the glutaredoxin genes. However, the transcriptome sequencing analysis indicated that only Sotub04g010640 showed differential expression with N supplementation. Unique probe sequences were found for all of the other genes. The five reference genes were adenine phosphoribosyl transferase (aprt), tubulin, cyclophilin [35,36], elongation factor 1-α(ef1α) [37], and COX1 [38]. The nCounter data was adjusted using the manufacturer-provided spiked positive and negative controls according to the manufacturer’s instructions. The geometric mean of the reference genes was calculated and used to normalize the experimental genes on a per sample basis [39,40]. The 48 samples from GE2012 used for transcriptome sequencing were analyzed using nCounter and Spearman rank correlation was performed using SYSTAT v. 13 (Systat Software, San Jose, USA) and used to compare expression data from nCounter and transcriptome sequencing. For the LASSO analysis 24 of the samples from GE2012 (from the first time point at 47 DAP) were used along with another 138 samples from the six other field trials for a total of 162 samples (Table 1, Figure 1). A heat map of the loge transformed nCounter gene expression data was generated using Multi-Experiment Viewer (version MeV4.9) [33].

2.5. Statistical Analysis

The nCounter data for 63 N-responsive genes from 162 samples in the seven field trials (Figure 1) were used for analysis. Selection of genes was done using LASSO, a regularization method, to fit a regression on the nCounter gene expression data against yield, total N uptake, and specific gravity. Coefficients for the model are calculated using the following criteria [27].
β ^ l a s s o = a r g m i n { i = 1 N ( y i β 0 j = 1 p x i j β j ) 2 + λ j = 1 p | β j | } = a r g m i n { R S S + λ j = 1 p | β j | }
where xij is the observation i for the variable j, yi is the response for observation i, and RSS is the residual sum of squares. By adding the penalty term λ j = 1 p | β j | , small coefficients will shrink to zero, as regulated by the tuning parameter λ . In the current analysis λ was chosen through ten-fold cross validation via the glmnet package in the R statistical computing software (https://www.R-project.org/) [41]. The data were separated into training and testing sets and evaluated through a ten-fold cross validation. Outliers were removed.
For each fold of the cross-validation, 100 bootstrapped samples of the training data were analyzed using the LASSO model. A reduced model was determined for each fold by selecting variables that were included over the bootstrapped samples more than 50% of the time for that particular fold. That is, if a variable’s coefficient was greater than zero more than 50 times across the 100 bootstraps within a given fold in cross-validation, it was selected to be included in the regression model. Then, genes that were common across all ten folds were selected for the final set of variables (LASSO10).
The model using the LASSO10 reduced set of genes was then fitted to the training data using linear regression and evaluated using the test data. Cross-validated test mean squared error (MSE) and adjusted R-squared results on training data were both calculated. These results were compared to cross-validated MSE and adjusted R-squared results from a linear model including all genes for assessing improvement of the fit with the reduced LASSO10 models.
SpudDB—http://solanaceae.plantbiology.msu.edu/index.shtml [42]—was used to identify Arabidopsis thaliana genes that aligned with genes in the LASSO reduced models. The Arabidopsis Information Resource—www.arabidopsis.org [43]—was used to search further information on gene function.

3. Results

3.1. Identification of N-Responsive Genes Using Transcriptome Sequencing

Transcriptome sequence data from a single field trial (GE2012, Table 1) were mined for genes showing differential expression between 0 (control) and 180 kg N ha−1 (treated) treatments to find N-responsive genes (Figure 1). A previous study used the negative binomial t-test in CuffDiff to identify differential expression for each of the three cultivars—Atlantic, Shepody, and Russet Burbank—in the GE2012 trial at two time points [17]. There were 39 genes showing differential expression across the cultivars and time points. In the current study, USC was used to filter a set of genes that can classify samples as control (0 N) and treated (supplemented with 180 kg N ha−1) using the same data as Gálvez et al. [17]. Forty-one genes were found to classify samples as control and treated (Table 2). Eighteen of these genes overlapped with the differentially expressed genes in the CuffDiff analysis from Galvez et al. [17]. There were 23 genes in the USC classifier that did not show differential expression with CuffDiff. Many of the genes unique to USC analysis included those with low expression levels. The differences between the CuffDiff and USC analyses indicate that each method has biases, and there are advantages to identification of N-responsive genes using more than one analytical method. The differentially expressed genes from Galvez et al. [17] and the USC classifier genes were combined to generate a 63-gene nCounter assay for gene expression analysis (Table 2, Supplementary Tables S1 and S3). The nCounter assay had decreased sample processing and was less expensive to run over large numbers of samples. This made nCounter suited to analysis of a larger number of samples collected in multiple field trials. A Spearman rank correlation analysis was done to compare gene expression from transcriptome sequencing (FPKM) and nCounter (Figure 2). The results indicate that the R2 is 0.84, which provided validation for gene expression from these two platforms.

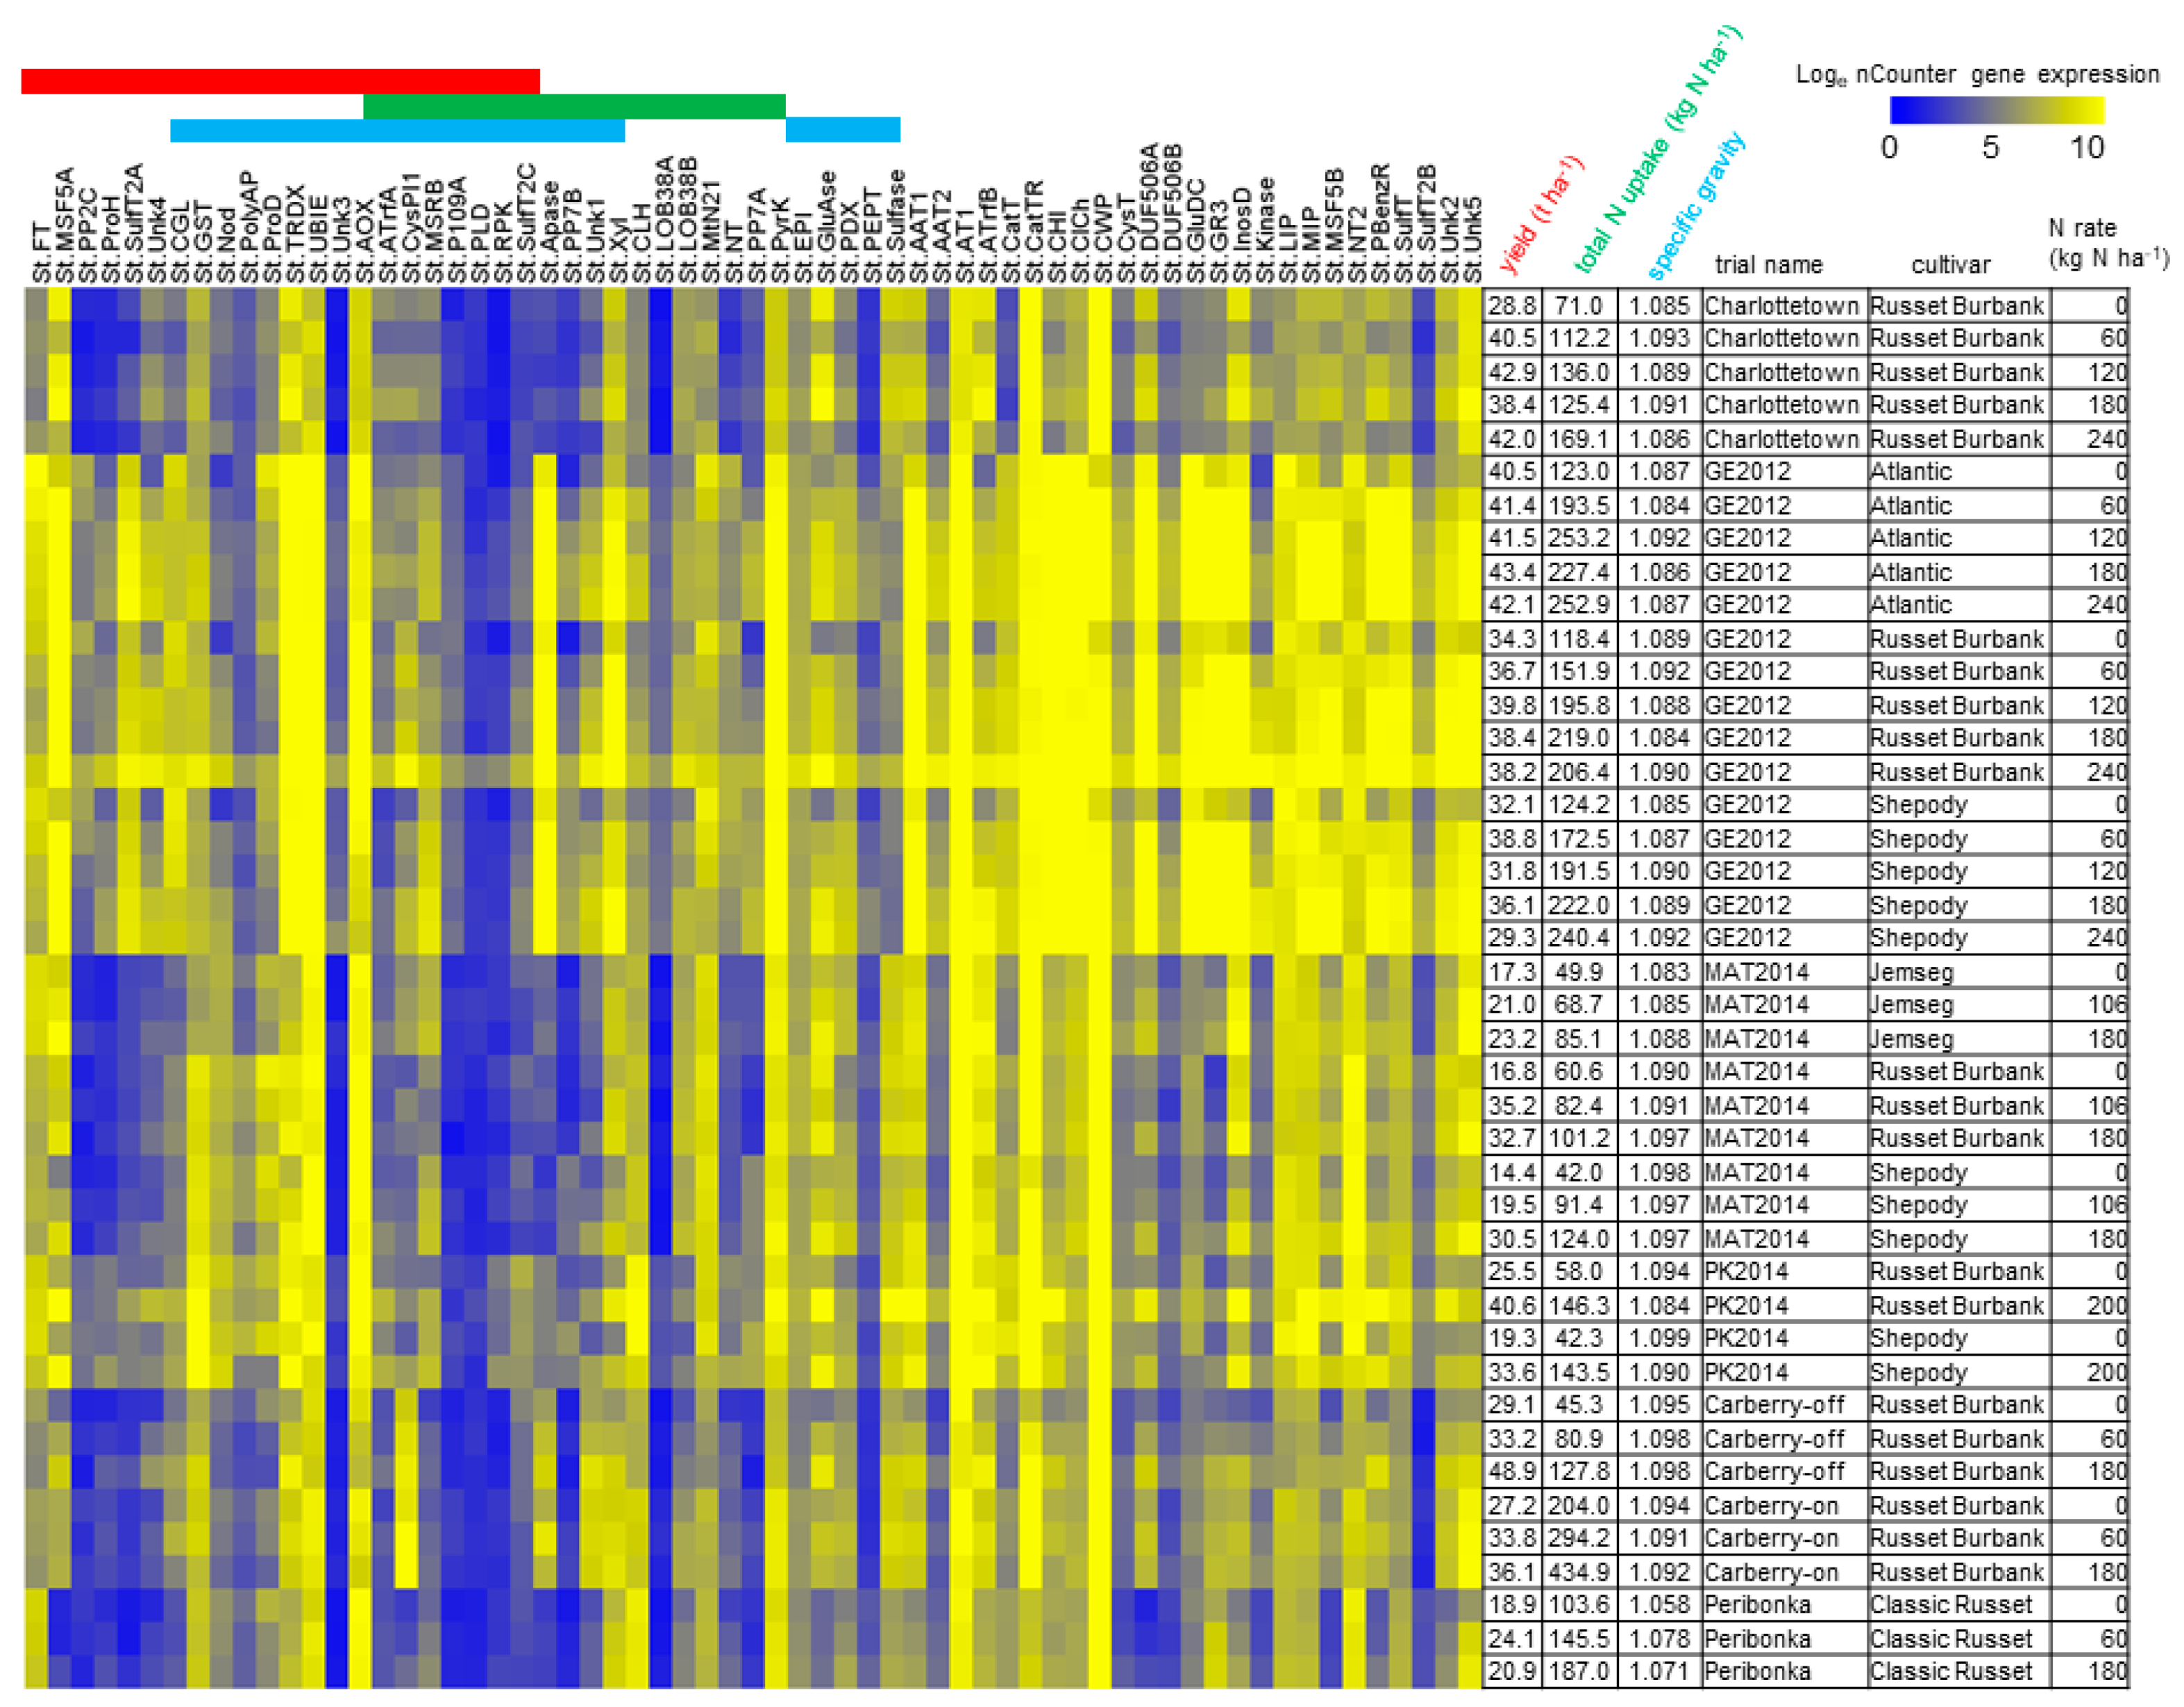
3.2. N-Responsive Gene Expression Predictive of Yield, Total N Uptake and Specific Gravity

The N-responsive genes identified from transcriptome sequencing were further analyzed in seven field trials (Table 1) using nCounter. Supplementary Table S3a–c summarizes the cultivars and N rate treatments for each of the plots at the seven field trial sites. In each of the field trials, the foliar tissue used for gene expression analysis was sampled from plants in same plots used to collect crop data. Figure 3 shows a representative photo of potato plants, cultivar Russet Burbank, at 0 N (control) and 180 kg N ha−1 (treated) at 45 and 80 DAP to demonstrate crop response to N supply. N fertilizer is typically applied at one time and rate at planting. Alternatively, split N-fertilization practices involve a reduction in applied N at planting followed by a second application of N. Information on a crop’s N status at the timing of the second application is needed to optimize the N rate. Hence, gene expression analysis was done on plants between 42–50 DAP to coordinate with the timing of a second application in split N fertilization. Figure 4 is a heat map of the average loge-transformed nCounter gene expression for each of the plots from the seven field trials. The average yield, total N uptake, and specific gravity for each plot in each of the field trials is shown on the right side of the heat map. Yield, specific gravity, and total N uptake data are also presented as box plots in Supplementary Figures S1–S3. The raw data for yield, total N uptake and specific gravity is in Supplementary Table S1. The N rate was observed to affect yield and total N uptake, but specific gravity had low levels of variation between applied N rates.
The goal of the study was to associate foliar N-responsive gene expression with yield, total N uptake, and specific gravity. LASSO regression analysis was used for this purpose. Regression models were built to predict the response variables yield, specific gravity, and total N uptake using gene expression, N rate, and the non-numerical categorical variables (factors). The factors in the analysis were site and cultivar. The full LASSO model was built with factors, N rate, and gene expression for all 63 genes. A model was also built using just factors and another with just the 63 genes (all genes). Additionally, subsets of genes identified from the feature selection process as part of LASSO were used to build reduced-gene models (Table 2 and Figure 4). The predicted yield, specific gravity, and total N uptake from each of the LASSO models were fitted to the actual crop data and the adjusted R2 and MSE from the analysis are shown in Table 3. The factors-only model had the best fit of all the models. These results demonstrate that variations due to site and cultivar have significant effects on the response variables and need to be considered in development of diagnostic tools for N status monitoring. The all-genes and LASSO 10 reduced-gene models also predicted yield with reasonable accuracies, with the LASSO10 reduced-gene models having better predictive accuracies than the all-genes model, due to the reduced model variance. These results confirm that genes eliminated in the selection process did not contribute greatly to the prediction of the response variables and that LASSO selection identified key genes for predicting yield, specific gravity, and total N uptake. The adjusted R2 value for the LASSO10 reduced model for yield was 0.57, and total N uptake was 0.58 compared to specific gravity, which had a lower value of 0.35 (Table 3). The genes selected in the LASSO10 reduced-genes models for predicting yield, total N uptake, and specific gravity are indicated in Table 2.

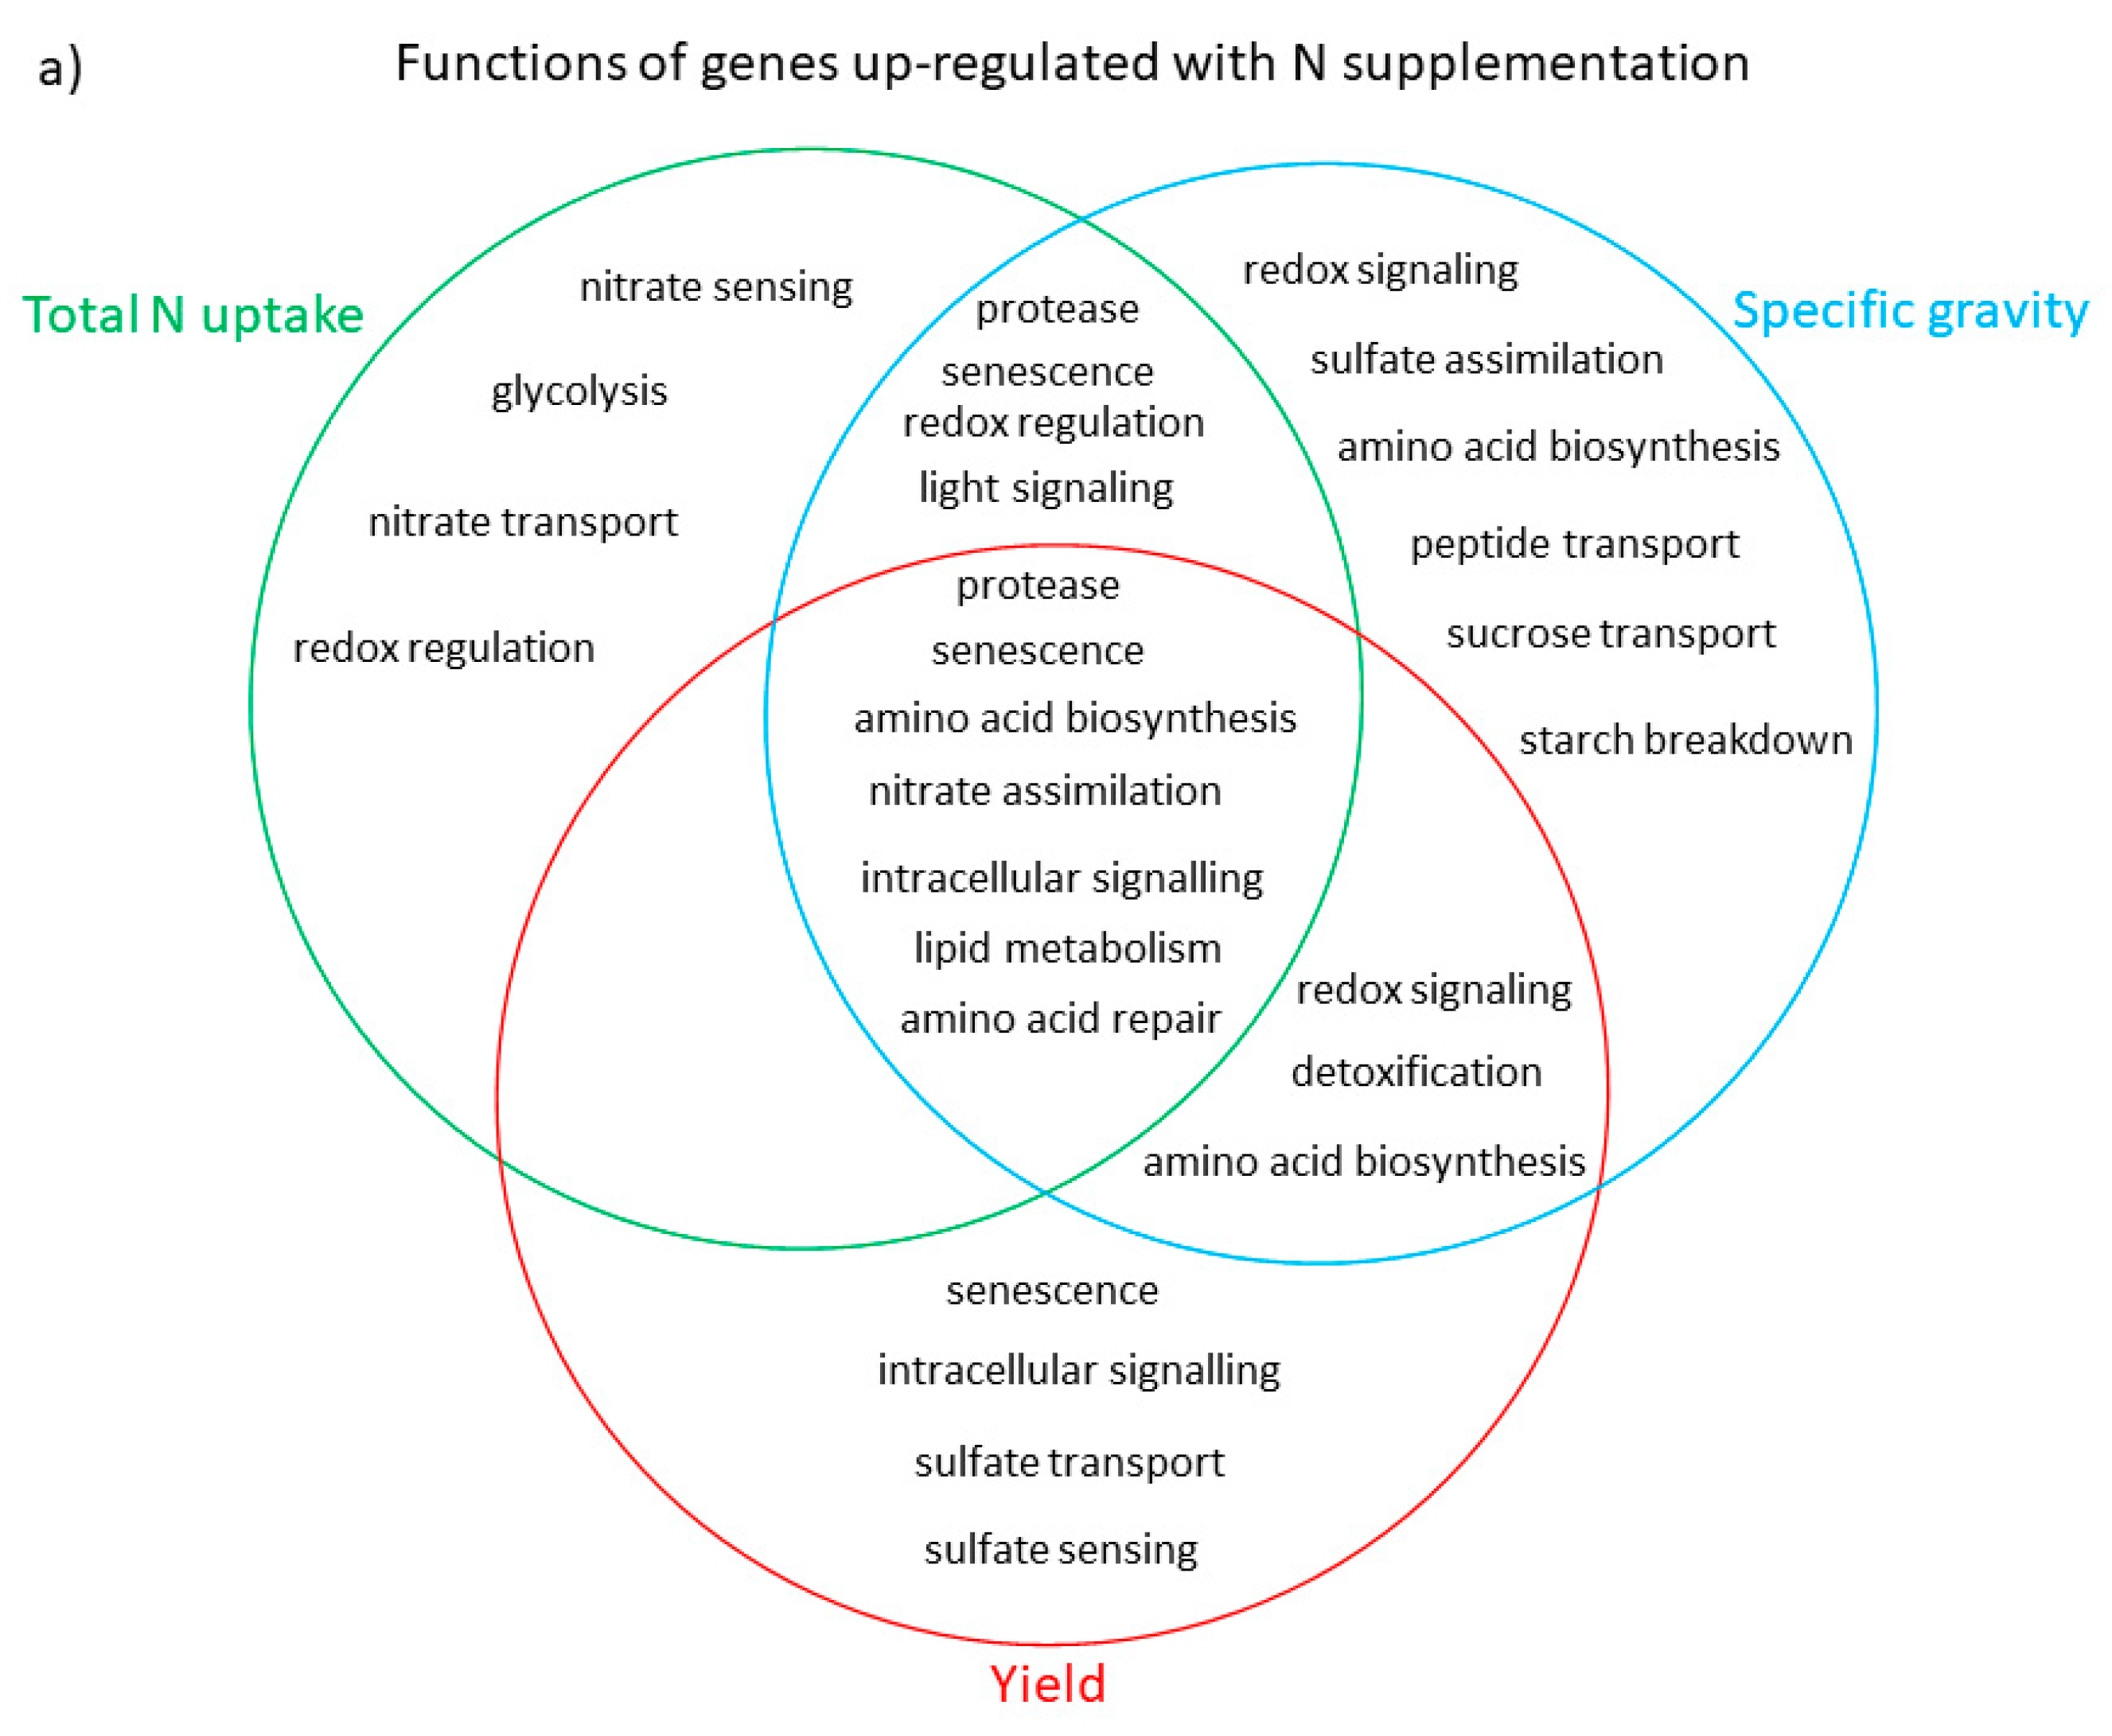
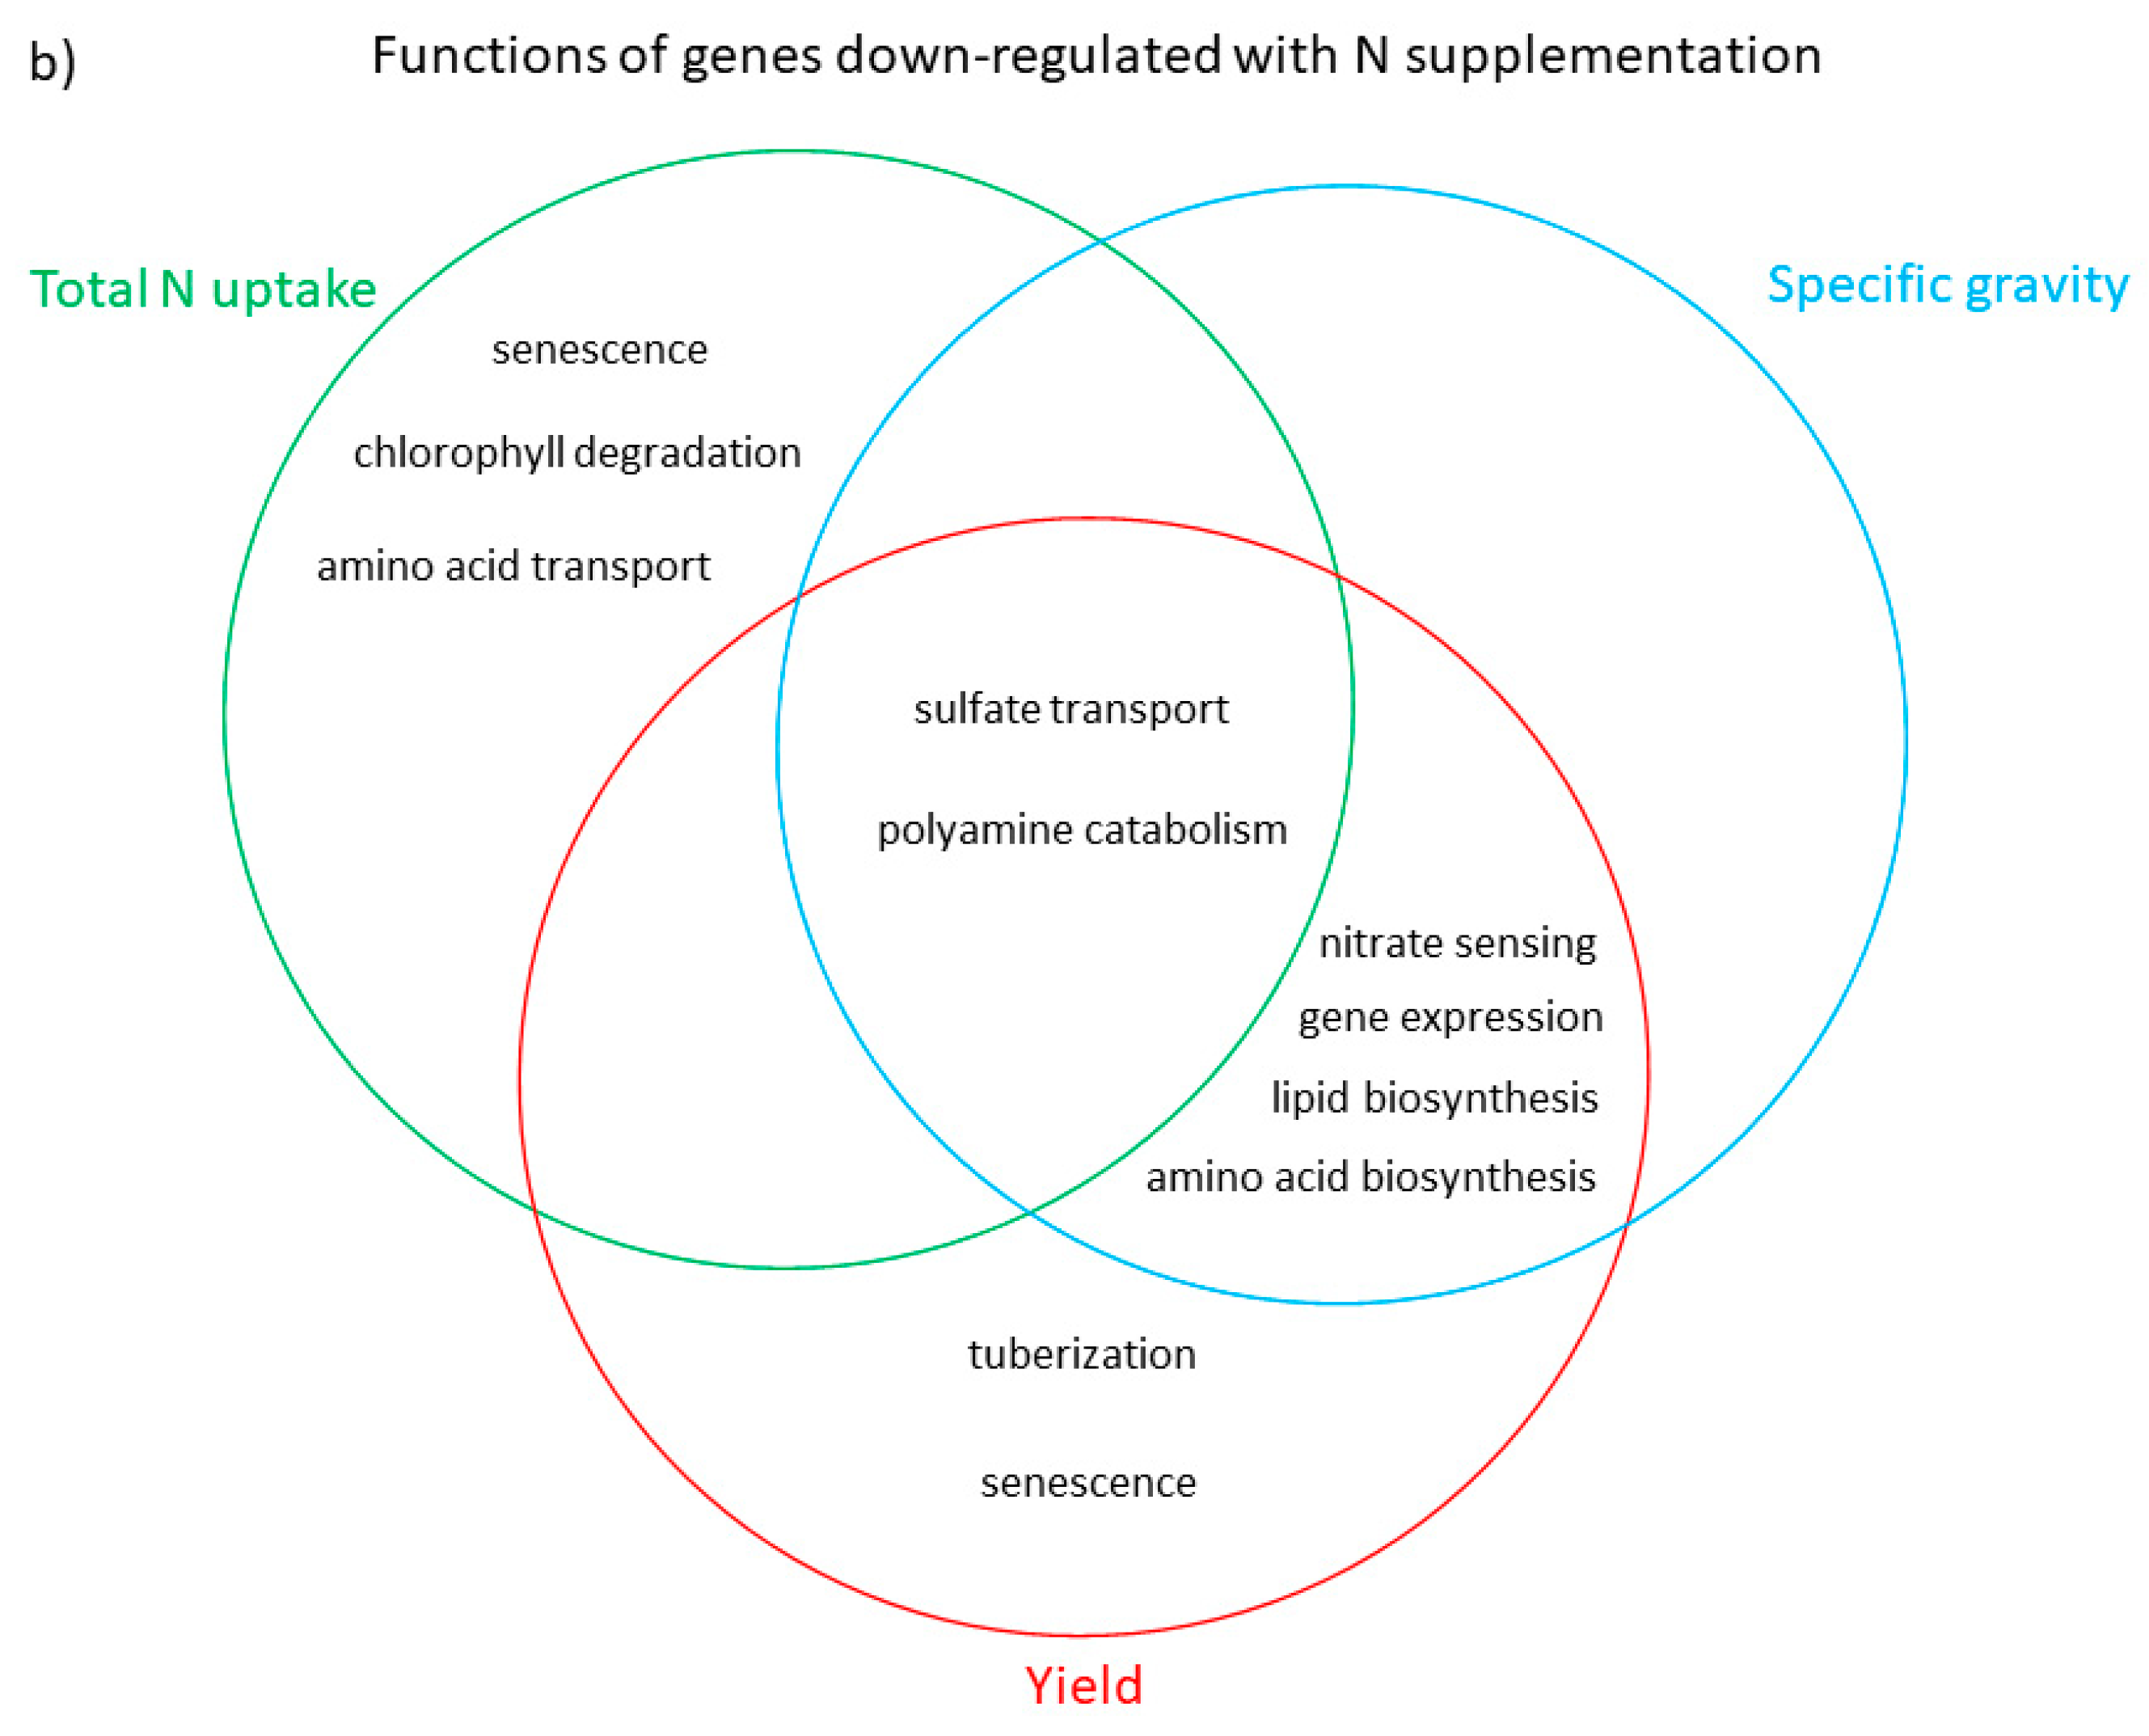
3.3. Functional Analysis of Genes in the LASSO10 Reduced Models

Analysis of the functions for N-responsive genes in the LASSO10 reduced models predictive of yield, total N uptake, and specific gravity were analyzed using SpudDB [42] and literature searching (Supplementary File S1). This information was used to categorize the genes into functional groupings. There were some functional groups that were found to be unique to each LASSO10 model and several that were shared between models (Figure 4 and Figure 5).
The most important crop parameter responding to N is yield. There were 22 genes in the reduced LASSO10 model for yield. The model included 15 genes that were upregulated and seven downregulated with N supplementation (Table 2, Figure 4, Supplementary File S1). The upregulated genes functioned in senescence, protein degradation, amino acid biosynthesis and repair, nitrate assimilation, intracellular signaling, sulfate transport and sensing, redox signaling, and detoxification (Figure 5). The downregulated genes had functions in tuberization, senescence, sulfate transport, polyamine catabolism, nitrate sensing, gene expression regulation, lipid biosynthesis, and amino acid biosynthesis (Figure 5). The genes in the LASSO10 yield model are associated with source–sink partitioning and their expression has potential application as indicators of crop N status.
N uptake from the soil is important to plant growth and development. Foliar processes responsive to N supplementation associated with total plant N uptake were examined. The LASSO10 reduced model for total N uptake had 19 genes of which 15 were upregulated and four were downregulated with N supplementation (Table 2, Figure 4, Supplementary File S1). The upregulated genes had functions in nitrate sensing, transport and assimilation, amino acid biosynthesis and repair, senescence, protein degradation, redox regulation, light signaling, glycolysis, redox regulation and lipid metabolism (Figure 5). The downregulated genes had functions in senescence, chlorophyll degradation, amino transport, sulfate transport and polyamine catabolism (Figure 5).
Examination of genes in the LASSO10 model for yield that overlap with the reduced-gene model for total N uptake provided insight into biological processes connecting total N uptake and yield. There were eight genes present in both of the LASSO10 models (Table 2, Figure 4, Supplementary File S1). These genes were also in the LASSO10 model for specific gravity. The N supplementation upregulated genes functioned in nitrate assimilation, senescence and protein degradation, amino acid biosynthesis and repair, intracellular signaling and lipid metabolism (Figure 5). The downregulated genes functioned in sulfate transport and polyamine catabolism (Figure 5). The gene showing the greatest differential expression with N supplementation was Sotub10g018540 aminotransferase like protein, which functions in nitrate assimilation in photorespiration (Table 2, Figure 4 and Supplementary File S1), was present in all three LASSO10 models.
N-responsive biological processes associated with source–sink partitioning but not N uptake were also of interest. Differences in the LASSO10 reduced-gene model for yield and the total N uptake model provided a way to examine these processes. Genes in the yield model but not total N uptake included N-responsive upregulated genes with functions in senescence, intracellular signaling, sulfate sensing and transport, redox signaling, detoxification, and amino acid biosynthesis (Figure 5). The downregulated genes had functions in tuberization, senescence, nitrate sensing, regulation of gene expression, lipid biosynthesis, and amino acid biosynthesis (Figure 5). A key gene in the yield model but not in the other models was Sotub05g028860 flowering locus T protein, which functions in signaling for tuberization and senescence in potato (Supplementary File S1).
Additionally, genes in the LASSO10 total N uptake model but not the yield model were also examined. The N supplementation upregulated genes had functions in glycolysis and nitrate sensing, transport and regulation, senescence, protein degradation, redox regulation, and light signaling (Figure 5). The downregulated genes functioned in senescence, chlorophyll degradation, and amino acid transport (Figure 5).
N rate was not found to have a significant effect on specific gravity, a proxy for dry matter, in the current study (Supplementary Figure S3). The variation in specific gravity in the field trials was mostly due to site and cultivar variation. A LASSO10 reduced model for specific gravity was built and it had 25 genes of which 19 were upregulated and six were downregulated with N. The upregulated genes had functions in sucrose transport, peptide transport, starch breakdown, amino acid biosynthesis and repair, redox signaling and regulation, nitrate and sulfate assimilation, detoxification, light signaling, intracellular signaling, and lipid metabolism (Figure 5). The downregulated genes had functions in sulfate transport, polyamine catabolism, nitrate sensing, gene expression, lipid biosynthesis, and amino acid biosynthesis (Figure 5). The results suggest that biological processes responding to N in foliage were associated with dry matter accumulation in tubers, however, site and cultivar variation confounded the effect of the N rate. Genes unique to the specific gravity model were of interest as these genes provided insight into foliar functions associated with production of dry matter that were not associated with yield and total N uptake. Genes unique to the specific gravity model had functions in sucrose transport, starch breakdown, peptide transport, amino acid biosynthesis, sulfate assimilation, and redox signaling (Figure 5).

4. Discussion

Nitrogen in soils is an environmental cue initiated in roots that triggers molecular responses in plants to enable them to capitalize on nutrient abundance or adjust to nutrient depletion. The current study examines N supplementation, which is a condition of nutrient abundance that many crops are under in agricultural production systems. In potato, N taken up through roots induces responses in leaves (source) that impact development of tuber sink tissues. N is a key nutrient for potato to reach optimal yield and quality; however, over-application results in nitrate leaching to groundwater and greenhouse gas emissions [5]. A goal of the study was to integrate N responses in source tissues (leaves) with sink partitioning to foster a better understanding of N use efficiency in potato. N-responsive gene expression in source tissues also has potential application to in-season monitoring of N status [17,18,19,20,21,22], which is key to optimizing N fertilization to achieve maximal yields and quality [44]. N-responsive genes associated with source–sink partitioning that have a functional connection to N status and are of particular interest as diagnostic indicators.
A major sink tissue for potato is the tuber, which was quantified as yield (mass/area) in field plots. Specific gravity, a proxy for tuber dry matter, is an indicator for tuber quality that was also quantified. Total plant N included both source and sink tissues and was a measure of the capacity of the crop to respond to N supply. The strategy was to first identify genes with expression in leaves responding to N supply, then find which of these genes are associated with tuber yield using multiple field trials and data mining with LASSO. The functions of these genes were then examined to find N-responsive molecular processes associated with source–sink partitioning. LASSO regression models for total plant N uptake and tuber-specific gravity were also built and compared to the yield model. The study demonstrated the effectiveness of LASSO for selecting genes and fitting regressions involving their expression.
Tuber yields increase with N supply to a plateau where additional N does not stimulate further increases in yield [45,46], as was observed in the current study. N is both a plant nutrient and signaling molecule for growth and developmental phase changes [47,48], and in potato increased N supply delays tuberization [49,50,51]. Studies also reported that increased N supply increases leaf size and duration rather than photosynthetic efficiency in potato [10,11,12,13]. The signal for tuberization and vine senescence involves inducing expression of the potato homolog of Flowering locus T, StSP6A, which is transcribed and translated in leaves and transported via phloem to stolons as a peptide [52]. In Arabidopsis thaliana Flowering locus T interacts with a b-ZIP transcription factor FD and functions in the regulation of gene expression [53]. In potato stolons, StSP6A was also found to bind and block sucrose transporter SWEET11 to reduce leakage of sucrose to the apoplastic phloem in coordination with increased symplastic loading during tuberization [54,55]. These findings demonstrate that StSP6A functions as a tuberigen and inducer of senescence in leaves, and a regulator of source–sink partitioning in stolons. The decreased expression of StSP6A in leaves observed with N supplementation in the current study concurred with other studies [17,20], and is thought to underlie the delay in tuberization and vine senescence under high N rates. The gene expression profile showed that several genes associated with senescence were decreased in expression under N supplementation in coordination with StSP6A. Increased leaf area and duration under increased N supply means greater production of photosynthates and increased resources for N remobilization to sink tissues during subsequent senescence [56,57]. Hence, delaying tuberization and vine senescence under abundant N supply in potato allows the plant to maximize resources for partitioning to tuber production later in the growing season.
Infection by the fungal pathogen Verticillium dahliae induced early senescence and lowered tuber yields [58], which has parallels with low N rates. A quantitative trait loci (QTL) for V. dahliae disease resistance was mapped to the St.CDF1 locus [59]. The St.CDF1 gene encodes a transcriptional regulator that functions in the pathway controlling expression of StSP6A [52,60]. These results support a role for St.CDF1-StSP6A regulatory pathway for tuberization in source–sink partitioning and in V. dahliae resistance in potato. Heat stress also induces a delay in tuberization [61]. Repression of StSP6A gene expression was also found with heat stress and involved post-transcriptional regulation mediated by miRNA [62]. In contrast to N supplementation and resistance to V. dahliae, the delay in tuberization with heat stress reduced partitioning from source to sink in potato [63,64,65]. Where N supply increased leaf area, heat stress was demonstrated to decrease leaf size [66] and reduce photosynthetic efficiency [67,68]. These studies suggest that increasing the amount of source tissue in coordination with delaying tuberization, was important in increasing sink potential.
Increasing leaf life span and area increases photosynthesis and other foliar metabolic processes including photorespiratory N assimilation [69]. Photorespiration requires Rubisco binding to O2 as opposed to CO2 in the light-independent reactions of photosynthesis. The photorespiratory pathway coordinates enzymatic steps in the mitochondria, cytosol, peroxisome, and chloroplast in leaves and results in the uptake of N in the form of nitrate and the biosynthesis of amino acids [9]. The results showed that a gene encoding a peroxisomal enzyme, alanine-glyoxylate aminotransferase, which functions in the photorespiratory pathway, increased in expression with N supplementation and was included in LASSO10 reduced models for yield, total N uptake, and specific gravity. This enzyme catalyzes the conversion of alanine and glyoxylate to glycine and pyruvate [70]. Other genes involved in amino acid biosynthesis were also included in the gene models. These results provide evidence that photorespiratory N assimilation and amino acid biosynthesis are associated with N-responsive source–sink partitioning. The results concur with other studies showing that N supplementation increased foliar amino acids in potato [71].
The analysis of the effects of N supplementation on foliar gene expression associated with yield was of greatest relevance to understanding source–sink partitioning. Total N uptake and specific gravity were also analyzed in comparison provided insight on biological processes that contribute to N assimilation and sink partitioning. Of interest were differences between the genes in the total N uptake and yield models. The total N uptake model included genes involved in amino acid and nitrate transport that were not present in the yield model. These results suggest that these transport activities were associated with N uptake—more so than sink partitioning. The yield model included genes involved in sulfur sensing and transport. These results suggest integration of N and S metabolism is associated with N-responsive source–sink partitioning. Other studies also reported findings that sulfur assimilation was responsive to N nutrition in plants [72]. Increases in amino acid biosynthesis under N supplementation require S as well as N since all proteins contain sulfur amino acids. Integration of S transport and assimilation with N supplementation was observed in the current study. These results also demonstrated the importance of maintaining S sufficiency under N supplementation for optimizing tuber yield in potato.
Specific gravity is a proxy for tuber dry matter [29], which is an important fry-processing quality trait for potato. Nitrogen was reported to have varying effects on specific gravity at lower N rates [73]. However, decreases in specific gravity occur when N is applied in excess [3,46,73]. In the current study, increasing N rates did not have a significant effect on specific gravity. The variation in specific gravity in the study was relatively limited in magnitude, and was due to other factors, including site and cultivar. The specific gravity model was found to have an adjusted R2 of 0.35 which was the lowest of the three models. These results indicate that the N-responsive genes were not as strongly associated with specific gravity as yield and total N uptake. Among the genes included in the specific gravity model but not the others were a gene encoding a sucrose transporter and another encoding alpha-glucosidase, a gene involved in starch breakdown. These results demonstrate association of foliar molecular processes controlling carbohydrate metabolism and sucrose transport with dry matter accumulation in tubers.
The connection between N supplementation response and biological functions in source–sink partitioning makes genes in the LASSO10 reduced model for yield are good candidate indicators for in-season crop N status monitoring. Monitoring crop N status is important for split N fertilizer application, which enables optimization of N to plant demand [44]. For these reasons, our study targeted the timing of the second application of N for gene expression analysis to enable development of a N status indicator compatible with split fertilizer application. The findings of the study also indicate that site and cultivar variation affect yield and the other crop parameters. This means that LASSO gene expression prediction models for yield can vary with site and cultivar. In this case, gene expression indicators for monitoring crop N status may need to be calibrated specifically for each cultivar and site.

5. Conclusions

The LASSO10 gene expression analysis was effective in making novel association of biological processes in foliar source tissues with N-responsive sink development. The findings provided a connection between foliar gene expression and N-responsive source–sink partitioning, including roles for foliar signaling of tuberization, senescence, photorespiratory N assimilation, amino acid biosynthesis, and integration of S metabolism with N supply. The functional connection of the expression of a gene with source–sink partitioning supports selection of the gene as a candidate indicator of crop N status for potato.

Supplementary Materials

The following are available online at https://www.mdpi.com/2073-4395/10/10/1617/s1, Supplementary Table S1—nCounter gene expression data; Supplementary Table S2a–c—Summary of plots in field trials; Supplementary Table S3—nCounter probes; Supplementary File S1—Functional annotation analysis; Figure S1 Boxplots of (a) yield, (b) specific gravity, and (c) total N uptake for the different field trials; Figure S2 Boxplots of (a) yield, (b) specific gravity, and (c) total N uptake for the different varieties; Figure S3 Boxplots of (a) yield, (b) specific gravity, and (c) total N uptake for the different total applied N rates.

Author Contributions

Conceptualization, H.H.T., B.J.Z.; Methodology, M.T.P., H.G., H.H.T., C.D., B.J.Z., M.L., A.N.C., J.H.G., M.V.S.; Software, M.T.P., H.G., M.L., J.H.G., M.V.S.; Validation, M.T.P., H.G., H.H.T. Formal Analysis, M.T.P., H.G., H.H.T., M.L., J.H.G., M.V.S.; Investigation, M.T.P., H.G., B.J.Z., A.N.C., J.L., A.N., J.N., C.D., M.L., J.H.G., M.V.S., and H.H.T.; Resources, H.G., B.J.Z., A.N.C., A.N., J.N., C.D., M.V.S., and H.H.T.; Data Curation, H.H.T., M.L.; Writing—Original Draft Preparation, M.T.P., H.H.T.; Writing—Review & Editing, M.T.P., H.G., B.J.Z., A.N.C., J.N., M.V.S., and H.H.T.; Visualization, M.T.P., H.G., H.H.T.; Supervision, H.G., H.H.T., M.V.S.; Project Administration, H.H.T., B.J.Z.; Funding Acquisition, H.H.T., B.J.Z., M.V.S. All authors have read and agreed to the published version of the manuscript.

Funding

This work was supported by AAFC funding from the Agricultural Innovation Program and by the Mexican National Council of Science and Technology (Consejo Nacional de Ciencia y Tecnología; CONACYT) (Scholarship No. 381158) to J.H.G.; and by the McGill Department of Plant Science Graduate Excellence Fund.

Acknowledgments

The authors also acknowledge Centre SÈVE for funding. Technical support at AAFC-FRDC was provided by Woojong Rho, Lana Nolan, Jeffrey Retallick, Jaclyn Retallick and Karen Terry, technical support at CRDC was provided by Irene Power, Barbara Enman, Dorothy Gregory and Danielle Murnaghan and at AAFC-QRDC by Sarah-Maude Parent and Denis Bourgault.

Conflicts of Interest

The authors declare no conflict of interest.

References

  1. Millard, P.; Marshall, B. Growth, nitrogen uptake and partitioning within the potato (Solatium tuberosum L.) crop, in relation to nitrogen application. J. Agric. Sci. 1986, 107, 421–429. [Google Scholar] [CrossRef]
  2. De la Morena, I.; Guillen, A.; del Moral, L.G. Yield development in potatoes as influenced by cultivar and the timing and level of nitrogen fertilization. Am. Potato J. 1994, 71, 165–173. [Google Scholar] [CrossRef]
  3. Belanger, G.; Walsh, J.; Richards, J.; Milburn, P.; Ziadi, N. Nitrogen fertilization and irrigation affects tuber characteristics of two potato cultivars. Am. J. Potato Res. 2002, 79, 269–279. [Google Scholar] [CrossRef]
  4. Mäck, G.; Schjoerring, J.K. Effect of no3- supply on n metabolism of potato plants (Solanum tuberosum L.) with special focus on the tubers. Plant Cell Environ. 2002, 25, 999–1009. [Google Scholar] [CrossRef]
  5. Zebarth, B.J.; Rosen, C.J. Research perspective on nitrogen bmp development for potato. Am. J. Potato Res. 2007, 84, 3–18. [Google Scholar] [CrossRef]
  6. Zebarth, B.J.; Bélanger, G.; Cambouris, A.N.; Ziadi, N. Nitrogen fertilization strategies in relation to potato tuber yield, quality, and crop n recovery. In Sustainable Potato Production: Global Case Studies; He, Z., Larkin, R., Honeycutt, W., Eds.; Springer: Dordrecht, The Netherlands, 2012; pp. 165–186. [Google Scholar]
  7. Essah, S.Y.C.; Delgado, J.A. Nitrogen management for maximum potato yield, tuber quality, and environmental conservation. In Appropriate Technologies for Environmental Protection in the Developing World; Yanful, E.K., Ed.; Selected papers from ertep 2007, 17–19 July 2007, Ghana, Africa; Springer: Dordrecht, The Netherlands, 2009; pp. 307–315. [Google Scholar]
  8. Tegeder, M.; Masclaux-Daubresse, C. Source and sink mechanisms of nitrogen transport and use. New Phytol. 2018, 217, 35–53. [Google Scholar] [CrossRef] [PubMed] [Green Version]
  9. Foyer, C.H.; Bloom, A.J.; Queval, G.; Noctor, G. Photorespiratory metabolism: Genes, mutants, energetics, and redox signaling. Annu. Rev. of Plant Biol. 2009, 60, 455–484. [Google Scholar] [CrossRef] [PubMed]
  10. Vos, J. The effects of nitrogen supply and stem density on leaf attributes and stem branching in potato (Solanum tuberosum L.). Potato Res. 1995, 38, 271–279. [Google Scholar] [CrossRef]
  11. Vos, J.; Biemond, H. Effects of nitrogen on the development and growth of the potato plant. 1. Leaf appearance, expansion growth, life spans of leaves and stem branching. Ann. Bot. 1992, 70, 27–35. [Google Scholar] [CrossRef]
  12. Vos, J.; van der Putten, P.E.L. Effect of nitrogen supply on leaf growth, leaf nitrogen economy and photosynthetic capacity in potato. Field Crop. Res. 1998, 59, 63–72. [Google Scholar] [CrossRef]
  13. Firman, D.M.; Allen, E.J. Field measurements of the photosynthetic rate of potatoes grown with different amounts of nitrogen fertilizer. J. Agric. Sci. 1988, 111, 85–90. [Google Scholar] [CrossRef]
  14. Goffart, J.P.; Olivier, M.; Frankinet, M. Potato crop nitrogen status assessment to improve n fertilization management and efficiency: Past–present–future. Potato Res. 2008, 51, 355–383. [Google Scholar] [CrossRef]
  15. Olfs, H.-W.; Blankenau, K.; Brentrup, F.; Jasper, J.; Link, A.; Lammel, J. Soil- and plant-based nitrogen-fertilizer recommendations in arable farming. J. Plant Nutr. Soil Sci. 2005, 168, 414–431. [Google Scholar] [CrossRef]
  16. Ziadi, N.; Zebarth, B.J.; Bélanger, G.; Cambouris, A.N. Soil and plant tests to optimize fertilizer n management of potatoes. In Sustainable Potato Production: Global Case Studies; He, Z., Larkin, R.P., Honeycutt, C.W., Eds.; Springer: New York, NY, USA, 2012; pp. 187–207. [Google Scholar]
  17. Gálvez, J.H.; Tai, H.H.; Lagüe, M.; Zebarth, B.J.; Strömvik, M.V. The nitrogen responsive transcriptome in potato (Solanum tuberosum L.) reveals significant gene regulatory motifs. Sci. Rep. 2016, 6, 26090. [Google Scholar] [CrossRef] [Green Version]
  18. Li, X.-Q.; Sveshnikov, D.; Zebarth, B.; Tai, H.; de Koeyer, D.; Millard, P.; Haroon, M.; Singh, M. Detection of nitrogen sufficiency in potato plants using gene expression markers. Am. J. Potato Res. 2010, 87, 50–59. [Google Scholar] [CrossRef]
  19. Tai, H.H.; Zebarth, B.J. Effect of time of day of sampling on potato foliar gene expression used to assess crop nitrogen status. Am. J. Potato Res. 2015, 92, 284–293. [Google Scholar] [CrossRef]
  20. Tiwari, J.K.; Buckseth, T.; Zinta, R.; Saraswati, A.; Singh, R.K.; Rawat, S.; Dua, V.K.; Chakrabarti, S.K. Transcriptome analysis of potato shoots, roots and stolons under nitrogen stress. Sci. Rep. 2020, 10, 1152. [Google Scholar] [CrossRef] [Green Version]
  21. Zebarth, B.J.; Tai, H.; Luo, S.; Millard, P.; De Koeyer, D.; Li, X.-Q.; Xiong, X. Differential gene expression as an indicator of nitrogen sufficiency in field-grown potato plants. Plant Soil 2011, 345, 387–400. [Google Scholar] [CrossRef]
  22. Zebarth, B.J.; Tai, H.; Luo, S.; Millard, P.; De Koeyer, D.; Li, X.-Q.; Xiong, X. Effect of nitrogen form on gene expression in leaf tissue of greenhouse grown potatoes during three stages of growth. Am. J. Potato Res. 2012, 89, 315–327. [Google Scholar] [CrossRef]
  23. Trapnell, C.; Roberts, A.; Goff, L.; Pertea, G.; Kim, D.; Kelley, D.R.; Pimentel, H.; Salzberg, S.L.; Rinn, J.L.; Pachter, L. Differential gene and transcript expression analysis of rna-seq experiments with tophat and cufflinks. Nat. Protoc. 2012, 7, 562–578. [Google Scholar] [CrossRef] [Green Version]
  24. Tibshirani, R.; Hastie, T.; Narasimhan, B.; Chu, G. Diagnosis of multiple cancer types by shrunken centroids of gene expression. Proc. Natl. Acad. Sci. USA 2002, 99, 6567–6572. [Google Scholar] [CrossRef] [PubMed] [Green Version]
  25. Geiss, G.K.; Bumgarner, R.E.; Birditt, B.; Dahl, T.; Dowidar, N.; Dunaway, D.L.; Fell, H.P.; Ferree, S.; George, R.D.; Grogan, T. Direct multiplexed measurement of gene expression with color-coded probe pairs. Nat. Biotechnol. 2008, 26, 317–325. [Google Scholar] [CrossRef] [PubMed]
  26. Vasilevski, A.; Giorgi, F.M.; Bertinetti, L.; Usadel, B. Lasso modeling of the arabidopsis thaliana seed/seedling transcriptome: A model case for detection of novel mucilage and pectin metabolism genes. Mol. Biosyst. 2012, 8, 2566–2574. [Google Scholar] [CrossRef] [PubMed] [Green Version]
  27. Tibshirani, R. Regression shrinkage and selection via the lasso. J. R. Stat. Society. Ser. B (Methodol.) 1996, 58, 267–288. [Google Scholar] [CrossRef]
  28. McGill, W.B.; Figueiredo, C.T. Total nitrogen. In Soil Sampling and Methods of Analysis; Gregorich, E.G., Carter, M.R., Eds.; Canadian Society of Soil Science/Lewis Publishers: Boca Raton, FL, USA, 1993; pp. 201–211. [Google Scholar]
  29. Simmonds, N.W. Relations between specific gravity, dry matter content and starch content of potatoes. Potato Res. 1977, 20, 137–140. [Google Scholar] [CrossRef]
  30. Edgar, A.D. Determining the specific gravity of individual potatoes. Am. Potato J. 1951, 28, 729–731. [Google Scholar] [CrossRef]
  31. Wan, C.Y.; Wilkins, T.A. A modified hot borate method significantly enhances the yield of high-quality rna from cotton (Gossypium hirsutum L.). Anal. Biochem. 1994, 223, 7–12. [Google Scholar] [CrossRef]
  32. Luo, S.; Tai, H.; Zebarth, B.; Li, X.-Q.; Millard, P.; De Koeyer, D.; Xiong, X. Sample collection protocol effects on quantification of gene expression in potato leaf tissue. Plant Mol. Biol. Report. 2010, 29, 369–378. [Google Scholar] [CrossRef]
  33. Saeed, A.I.; Sharov, V.; White, J.; Li, J.; Liang, W.; Bhagabati, N.; Braisted, J.; Klapa, M.; Currier, T.; Thiagarajan, M.; et al. Tm4: A free, open-source system for microarray data management and analysis. BioTechniques 2003, 34, 374–378. [Google Scholar] [CrossRef] [Green Version]
  34. The Potato Genome Sequencing Consortium; Xu, X.; Pan, S.; Cheng, S.; Zhang, B.; Mu, D.; Ni, P.; Zhang, G.; Yang, S.; Li, R.; et al. Genome sequence and analysis of the tuber crop potato. Nature 2011, 475, 189–195. [Google Scholar] [CrossRef] [Green Version]
  35. Nicot, N.; Hausman, J.-F.; Hoffmann, L.; Evers, D. Housekeeping gene selection for real-time rt-pcr normalization in potato during biotic and abiotic stress. J. Exp. Bot. 2005, 56, 2907–2914. [Google Scholar] [CrossRef] [PubMed]
  36. Tai, H.; Conn, G.; Davidson, C.; Platt, H. Arbitrary multi-gene reference for normalization of real-time pcr gene expression data. Plant Mol. Biol. Report. 2009, 27, 315–320. [Google Scholar] [CrossRef]
  37. Nakane, E.; Kawakita, K.; Doke, N.; Yoshioka, H. Elicitation of primary and secondary metabolism during defense in the potato. J. Gen. Plant Pathol. 2003, 69, 378–384. [Google Scholar] [CrossRef]
  38. Quinones, V.; Zanlungo, S.; Holuigue, L.; Litvak, S.; Jordana, X. The cox1 initiation codon is created by rna editing in potato mitochondria. Plant Physiol. 1995, 108, 1327–1328. [Google Scholar] [CrossRef] [PubMed] [Green Version]
  39. De Almeida, M.R.; de Bastiani, D.; Gaeta, M.L.; de Araujo Mariath, J.E.; de Costa, F.; Retallick, J.; Nolan, L.; Tai, H.H.; Stromvik, M.V.; Fett-Neto, A.G. Comparative transcriptional analysis provides new insights into the molecular basis of adventitious rooting recalcitrance in eucalyptus. Plant Sci. Int. J. Exp. Plant Biol. 2015, 239, 155–165. [Google Scholar] [CrossRef]
  40. Vandesompele, J.; De Preter, K.; Pattyn, F.; Poppe, B.; Van Roy, N.; de Paepe, A.; Speleman, F. Accurate normalization of real-time quantitative RT-PCR data by geometric averaging of multiple internal control genes. Genome Biol. 2002, 3, research0034-1. [Google Scholar] [CrossRef] [Green Version]
  41. R Core Team. R: A Language and Environment for Statistical Computing; R Foundation for Statistical Computing: Vienna, Austria, 2020. [Google Scholar]
  42. Hirsch, C.D.; Hamilton, J.P.; Childs, K.L.; Cepela, J.; Crisovan, E.; Vaillancourt, B.; Hirsch, C.N.; Habermann, M.; Neal, B.; Buell, C.R. Spud db: A resource for mining sequences, genotypes, and phenotypes to accelerate potato breeding. Plant Genome 2014, 7, 1–12. [Google Scholar] [CrossRef] [Green Version]
  43. Huala, E.; Dickerman, A.W.; Garcia-Hernandez, M.; Weems, D.; Reiser, L.; LaFond, F.; Hanley, D.; Kiphart, D.; Zhuang, M.; Huang, W.; et al. The arabidopsis information resource (tair): A comprehensive database and web-based information retrieval, analysis, and visualization system for a model plant. Nucleic Acids Res. 2001, 29, 102–105. [Google Scholar] [CrossRef] [Green Version]
  44. Zebarth, B.; Drury, C.; Tremblay, N.; Cambouris, A. Opportunities for improved fertilizer nitrogen management in production of arable crops in eastern Canada: A review. Can. J. Soil Sci. 2009, 89, 113–132. [Google Scholar] [CrossRef]
  45. Bélanger, G.; Walsh, J.R.; Richards, J.E.; Milburn, P.H.; Ziadi, N. Critical nitrogen curve and nitrogen nutrition index for potato in eastern Canada. Am. J. Potato Res. 2001, 78, 355–364. [Google Scholar] [CrossRef]
  46. Zebarth, B.J.; Leclerc, Y.; Moreau, G.; Botha, E. Rate and timing of nitrogen fertilization of russet burbank potato: Yield and processing quality. Can. J. Plant Sci. 2004, 84, 855–863. [Google Scholar] [CrossRef]
  47. Crawford, N.M. Nitrate: Nutrient and signal for plant growth. Plant Cell 1995, 7, 859–868. [Google Scholar] [PubMed] [Green Version]
  48. Canales, J.; Moyano, T.C.; Gutiérrez, R.A.; Vidal, E.A. Nitrogen control of developmental phase transitions in arabidopsis thaliana. J. Exp. Bot. 2014, 65, 5611–5618. [Google Scholar]
  49. Ewing, E.E.; Struik, P.C. Tuber formation in potato: Induction, initiation, and growth. Hortic. Rev. 1992, 14, 89. [Google Scholar]
  50. Rodriguez-Falcon, M.; Bou, J.; Prat, S. Seasonal control of tuberization in potato: Conserved elements with the flowering response. Annu. Rev. Plant Biol. 2006, 57, 151–180. [Google Scholar] [CrossRef]
  51. Zheng, H.; Wang, Y.; Zhao, J.; Shi, X.; Ma, Z.; Fan, M. Tuber formation as influenced by the c: N ratio in potato plants. J. Plant Nutr. Soil Sci. 2018, 181, 686–693. [Google Scholar] [CrossRef]
  52. Navarro, C.; Abelenda, J.A.; Cruz-Oro, E.; Cuellar, C.A.; Tamaki, S.; Silva, J.; Shimamoto, K.; Prat, S. Control of flowering and storage organ formation in potato by flowering locus t. Nature 2011, 478, 119–122. [Google Scholar] [CrossRef]
  53. Abe, M.; Kobayashi, Y.; Yamamoto, S.; Daimon, Y.; Yamaguchi, A.; Ikeda, Y.; Ichinoki, H.; Notaguchi, M.; Goto, K.; Araki, T. Fd, a bzip protein mediating signals from the floral pathway integrator ft at the shoot apex. Science 2005, 309, 1052–1056. [Google Scholar] [CrossRef]
  54. Abelenda, J.A.; Bergonzi, S.; Oortwijn, M.; Sonnewald, S.; Du, M.; Visser, R.G.F.; Sonnewald, U.; Bachem, C.W.B. Source-sink regulation is mediated by interaction of an ft homolog with a sweet protein in potato. Curr. Biol. 2019, 29, 1178–1186.e6. [Google Scholar] [CrossRef] [Green Version]
  55. Viola, R.; Roberts, A.G.; Haupt, S.; Gazzani, S.; Hancock, R.D.; Marmiroli, N.; Machray, G.C.; Oparka, K. Tuberization in potato involves a switch from apoplastic to symplastic phloem unloading. Plant Cell 2001, 13, 385–398. [Google Scholar] [CrossRef] [Green Version]
  56. Thomas, H. Senescence, ageing and death of the whole plant. New Phytol. 2013, 197, 696–711. [Google Scholar] [CrossRef] [PubMed]
  57. Chang, T.-G.; Zhu, X.-G. Source–sink interaction: A century old concept under the light of modern molecular systems biology. J. Exp. Bot. 2017, 68, 4417–4431. [Google Scholar] [CrossRef] [PubMed]
  58. Bowden, R.L.; Rouse, D.I.; Sharkey, T.D. Mechanism of photosynthesis decrease by verticillium dahliae in potato. Plant Physiol. 1990, 94, 1048–1055. [Google Scholar] [CrossRef] [PubMed] [Green Version]
  59. Tai, H.H.; de Koeyer, D.; Sønderkær, M.; Hedegaard, S.; Lagüe, M.; Goyer, C.; Nolan, L.; Davidson, C.; Gardner, K.; Neilson, J.; et al. Verticillium dahliae disease resistance and the regulatory pathway for maturity and tuberization in potato. Plant Genome 2018, 11, 1–5. [Google Scholar] [CrossRef] [Green Version]
  60. Kloosterman, B.; Abelenda, J.A.; Gomez, M.d.M.C.; Oortwijn, M.; de Boer, J.M.; Kowitwanich, K.; Horvath, B.M.; van Eck, H.J.; Smaczniak, C.; Prat, S.; et al. Naturally occurring allele diversity allows potato cultivation in northern latitudes. Nature 2013, 495, 246. [Google Scholar] [CrossRef]
  61. Ewing, E.E. Heat stress and the tuberization stimulus. Am. Potato J. 1981, 58, 31. [Google Scholar] [CrossRef]
  62. Lehretz, G.G.; Sonnewald, S.; Hornyik, C.; Corral, J.M.; Sonnewald, U. Post-transcriptional regulation of flowering locus t modulates heat-dependent source-sink development in potato. Curr. Biol. 2019, 29, 1614–1624.e3. [Google Scholar] [CrossRef]
  63. Hancock, R.D.; Morris, W.L.; Ducreux, L.J.M.; Morris, J.A.; Usman, M.; Verrall, S.R.; Fuller, J.; Simpson, C.G.; Zhang, R.; Hedley, P.E.; et al. Physiological, biochemical and molecular responses of the potato (Solanum tuberosum L.) plant to moderately elevated temperature. Plant Cell Environ. 2014, 37, 439–450. [Google Scholar]
  64. Hastilestari, B.R.; Lorenz, J.; Reid, S.; Hofmann, J.; Pscheidt, D.; Sonnewald, U.; Sonnewald, S. Deciphering source and sink responses of potato plants (Solanum tuberosum L.) to elevated temperatures. Plant Cell Environ. 2018, 41, 2600–2616. [Google Scholar] [CrossRef]
  65. Sonnewald, S.; van Harsselaar, J.; Ott, K.; Lorenz, J.; Sonnewald, U. How potato plants take the heat? Procedia Environ. Sci. 2015, 29, 97. [Google Scholar] [CrossRef] [Green Version]
  66. Tang, R.; Niu, S.; Zhang, G.; Chen, G.; Haroon, M.; Yang, Q.; Rajora, O.P.; Li, X.-Q. Physiological and growth responses of potato cultivars to heat stress. Botany 2018, 96, 897–912. [Google Scholar] [CrossRef]
  67. Reynolds, M.P.; Ewing, E.E.; Owens, T.G. Photosynthesis at high temperature in tuber-bearing solanum species: A comparison between accessions of contrasting heat tolerance. Plant Physiol. 1990, 93, 791–797. [Google Scholar] [CrossRef] [Green Version]
  68. Dahal, K.; Li, X.-Q.; Tai, H.; Creelman, A.; Bizimungu, B. Improving potato stress tolerance and tuber yield under a climate change scenario—A current overview. Front. Plant Sci. 2019, 10, 563. [Google Scholar] [CrossRef] [PubMed]
  69. Bloom, A. Photorespiration and nitrate assimilation: A major intersection between plant carbon and nitrogen. Photosynth Res. 2015, 123, 117–128. [Google Scholar] [CrossRef] [PubMed] [Green Version]
  70. Liepman, A.H.; Olsen, L.J. Peroxisomal alanine: Glyoxylate aminotransferase (agt1) is a photorespiratory enzyme with multiple substrates in arabidopsis thaliana. Plant J. 2001, 25, 487–498. [Google Scholar] [CrossRef] [PubMed]
  71. Wen, G.; Cambouris, A.N.; Ziadi, N.; Bertrand, A.; Khelifi, M. Nitrogen fertilization effects on the composition of foliar amino acids of russet burbank potato. Am. J. Potato Res. 2019, 96, 541–551. [Google Scholar] [CrossRef]
  72. Brunold, C.; Suter, M. Regulation of sulfate assimilation by nitrogen nutrition in the duckweed Lemna minor L. Plant Physiol. 1984, 76, 579–583. [Google Scholar] [CrossRef] [Green Version]
  73. Laboski, C.A.; Kelling, K.A. Influence of fertilizer management and soil fertility on tuber specific gravity: A review. Am. J. Potato Res. 2007, 84, 283–290. [Google Scholar] [CrossRef]
Figure 1. Data collection and analysis of gene expression.
Agronomy 10 01617 g001
Figure 2. Correlation between nCounter and FPKM from transcriptome sequencing. The same RNA samples were used for analysis for nCounter and FPKM values. Values for each of the samples were graphed. The R2 is from Spearman rank correlation.
Agronomy 10 01617 g002
Figure 3. Effect of N supplementation on potato cultivar group Russet Burbank. Plants were harvested at 45 and 80 DAP from plots with 0 and 180 kg N ha−1 and photographed. The white vertical bar on the right side is 30 cm.
Agronomy 10 01617 g003
Figure 4. Heat map of nCounter gene expression. The loge gene expression quantified using nCounter and averaged over the four replicates is represented by a blue–yellow gradient where yellow is the highest expression and blue is the lowest. The nCounter gene ID for the 63 genes is indicated at the top of the heat map. The colored bars over the nCounter gene IDs indicate which genes were included in the LASSO10 reduced-gene model: red for yield, green for total N uptake, and light blue for specific gravity. The genes without a colored bar over them were not included in any of the LASSO10 reduced-gene models. The average yield, total N uptake, and specific gravity for each of the plots where the leaf samples were taken is indicated in the table adjacent to the heat map. The trial name, cultivar, and N rate treatment for each sample is also indicated in the table.
Agronomy 10 01617 g004
Figure 5. Venn diagrams of N-responsive gene functions in the three LASSO10 models. Gene functions were searched from the published literature and listed in Supplementary File S1. The red circle encloses genes found in the LASSO10 model for yield, green is total N uptake, and blue is specific gravity. (a) Functions for genes found upregulated and (b) functions for genes found downregulated with N supplementation.
Agronomy 10 01617 g005aAgronomy 10 01617 g005b
Table 1. Field trials. The locations of the trial are followed by the latitude and longitude coordinates in decimal degrees in brackets. Fertilizer was applied at planting and at a second application for three of the sites. The planting, second application, and harvest dates are indicated as month/day/year (m/d/y). Second application and harvest dates are followed by days after planting (DAP). The soil type, the 30-year average temperature of the growing season from May to October (Avg ℃), and average precipitation in mm from May to October (precipitation (mm)) are presented.
Trial NameLocation (Decimal Degrees)Planting Date
m/d/y
Second Application
m/d/y (DAP)
Harvest Date m/d/y (DAP)Soil TypeAvg ℃Precipitation
(mm)
Carberry-OffCarberry, MB (49.932–99.388)5/16/20146/25/2014 (40)9/19/2014 (126)loamy fine sand13.7337
Carberry-OnCarberry, MB (49.904–99.353)5/15/20146/24/2014 (40)9/22/2014 (130)clay loam13.7337
PeribonkaPéribonka, QC (48.766–72.053)6/11/20147/21/2014 (45)9/24/2014 (106)silty loam12.0500
CharlottetownHarrington, PE (46.352–63.154)5/21/2014N/A10/6/2014 (138)sandy loam15.0461
MAT2014Fredericton, NB (45.923–66.616)5/25/2014N/A9/29/2014 (127)loam14.6549
GE2012Fredericton, NB (45.925–66.612)5/23/2012N/A10/3/2012 (105)loam14.6549
PK2014Fredericton, NB (45.925 -66.615)2/6/2014N/A9/30/2014 (120)loam14.6549
Table 2. Differentially expressed genes from transcriptome sequencing analysis of leaves from the GE2012 trial. Foliar samples from the GE2012 were used for transcriptome sequencing [17]. Genes in gray and white boxes were found to be differentially expressed in Gálvez et al. [17] using CuffDiff. The same transcriptome sequencing data was re-analyzed in the current study using uncorrelated shrunken centroids (USC) for classifying control and treated samples to identify differentially expressed genes. Genes in gray boxes show differential expression in both CuffDiff and USC analyses. Genes showing differential expression for just USC (blue boxes) and CuffDiff (white boxes) are shown. Genes in green boxes were examined in previous studies [19,21], but were not found to be differentially expressed in the transcriptome sequencing analysis. The fragments per kilobase of transcript per million mapped reads (FPKM) were averaged for control (0 N) and treated (180 kg N ha−1) samples over the three cultivars and two time points from the GE2012 trial. The iTAG ID for the genes is from Potato Genome Ssequencing Consoritum (PGSC) v4.03. The nCounter ID are the labels for the genes in the nCounter assay (Supplementary Table S1). Letters on the right indicate the LASSO10 model that included the gene. Y = LASSO10 yield model, N = LASSO10 total N uptake model, S = LASSO10 specific gravity model.
iTAGnCounterDescriptionFPKM ControlFPKM TreatednCounter ControlnCounter TreatedLASSO
Sotub05g028860St.FTFlowering locus T protein56.7623.52431.5188.6Y
Sotub06g008080St.MSF5AMale sterility 5 family protein (Fragment)90.98617.84173.382920.28Y
Sotub10g020080St.PP2CProtein phosphatase 2C0.020.210.8716.74Y
Sotub10g025870St.ProHDUF584 domain containing protein; S40 senescence regulator1.136.6122.2348.45Y
Sotub04g027100St.SulfT2AHigh affinity sulfate transporter 22.3518.6631.03114.11Y
Sotub12g011840St.Unk4Hypothetical gene of unknown function213.131771.2611.82101.41Y
Sotub08g027190St.CGLCystathionine gamma-synthase6.4421.925.82128.98Y, S
Sotub10g024560St.GSTGlutathione S-transferase76.76331.91419.041913.08Y, S
Sotub01g049920St.NodNodule inception protein; RWP-RK domain-containing protein29.2612.47140.6768.78Y, S
Sotub12g031130St.PolyAPPoly(A) polymerase5.071.6162.2621.28Y, S
Sotub02g033320St.ProDProline dehydrogenase35.8812.61252.32105.8Y, S
Sotub12g027600St.TRDXDSBA-like thioredoxin domain containing protein53.79478.31390.793815.08Y, S
Sotub12g020880St.UBIEPhosphoethanolamine N-methyltransferase281.83125.141108.191014.9Y, S
Sotub04g006310St.Unk3Unknown Protein02.1418.5230.83Y, S
Sotub08g025870St.AOXPrimary amine oxidase72.6532.271795.55843.27Y, N, S
Sotub10g018540St.ATrfAAminotransferase like protein; alanine-glyoxylate aminotransferase2.2356.5130.74202.64Y, N, S
Sotub03g016050St.CysPI1Cysteine protease inhibitor 10.110.4556.4494.26Y, N, S
Sotub01g022620St.MSRBPeptide methionine sulfoxide reductase msrB36.19164.7732.43128.18Y, N, S
Sotub03g011570St.P109ADUF607 domain containing protein/Ca2+ uniporter00.6932.6638.72Y, N, S
Sotub10g013730St.PLDPhospholipase D00.073.844.25Y, N, S
Sotub08g007230St.RPKReceptor-like protein kinase; ATP binding protein0.021.872.694.23Y, N, S
Sotub09g023510St.SulfT2CSulfate/bicarbonate/oxalate exchanger and transporter sat-1; group 3 sulfate transporter5.781.8565.7740.66Y, N, S
Sotub12g007850St.ApaseCytosol aminopeptidase family protein; leucine aminopeptidase9.4441.0726.8845.69N, S
Sotub03g018710St.PP7BSerine/threonine-protein phosphatase 7 long form homolog0.092.9310.4188.73N, S
Sotub04g023170St.Unk1Phytochrome-interacting factor 3.13.6153.3734.04607.97N, S
Sotub01g023000St.XylAspartic peptidase21.1369.85198.5515.82N, S
Sotub06g016810St.CLHChlorophyllase58.6149.38770.14703.2N
Sotub04g031010St.LOB38ALOB domain protein 380.120.6325.4530.7N
Sotub02g031040St.LOB38BLOB domain protein 3813.5931.983.58141.23N
Sotub05g012720St.MtN21Nodulin MtN21 family protein84.9627.2508.49192.39N
Sotub08g005390St.NTNitrate transporter1.489.7210.6547.64N
Sotub09g012260St.PP7ASerine/threonine-protein phosphatase 7 long form homolog0.024.8218.1192.28N
Sotub11g010490St.PyrKPyruvate kinase104.48223.18686.651302.26N
Sotub02g033060St.EPIPQ-loop repeat family protein / transmembrane family protein; sucrose transporter6.8348.1488.05118.25S
Sotub03g018720St.GluAseAlpha-glucosidase-like45.81523.27129.693215.26S
Sotub04g026530St.PDXPeroxidase16.2343.5572.72164.05S
Sotub07g009860St.PEPTPeptide transporter2.5918.96.740.64S
Sotub09g024290St.SulfaseSulfate adenylyltransferase170.6566.95210.071051.94S
Sotub05g024960St.AAT1Amino acid transporter46.46177.1335.531427.92
Sotub11g012150St.AAT2Transmembrane amino acid transporter5.5739.6324.62112.82
Sotub04g019200St.AT1Ammonium transporter 1, member 2 (LeAMT1;2)683.45443.326349.834392.36
Sotub12g011100St.ATrfBGamma aminobutyrate transaminase isoform373.48532.05354.922851.1
Sotub09g009440St.CatTCation/H+ antiporter13.854.16402.58245.55
Sotub08g007240St.CatTRCation transport regulator-like protein 2; gamma-glutamylclyclotransferase364.051806.561044.627793.81
Sotub08g014020St.CHIChalcone isomerase11.1763.56196.461021.25
Sotub02g014150St.ClChVoltage-gated chloride channel; CLC-Nt2 protein34.3371.91150.63306.12
Sotub09g029950St.CWPCell wall protein586.33138.6612701.215091.67
Sotub02g036900St.CysTLysosomal Cystine Transporter family protein4.9817.1829.55112.29
Sotub11g007090St.DUF506ADUF506 domain containing protein7.7356.04128.441994.76
Sotub11g007110St.DUF506BDUF506 domain containing protein8.3364.6421.9583.52
Sotub01g005580St.GluDCGlutamate decarboxylase isozyme 310.426.8745.43110.42
Sotub04g010640St.GR3Glutaredoxin3.5823.35112.2495.13
Sotub08g024220St.InosDOxidoreductase28.88329.76105.22087.67
Sotub01g049270St.KinaseProtein kinase3.244.8917.8178.44
Sotub12g012740St.LIPChloroplast lipocalin77.3935.31641.61329.74
Sotub08g028270St.MIPMethanol inducible protein80.14221.33306.61791.64
Sotub09g018850St.MSF5BMale sterility 5 family protein; Pollenless313.37135.356984.12
Sotub08g024820St.NT2Low-affinity nitrate transporter46.8434.42385.18257.99
Sotub10g014450St.PBenzRIsoflavone reductase homolog15.41487.5890.582220.52
Sotub04g021910St.SulfTPlasma membrane sulfate transporter19.2685.77238.24645.07
Sotub10g013960St.SulfT2BHigh affinity sulfate transporter type 11.245.613.6340.54
Sotub03g017290St.Unk2UP-9A; Response to low sulfur 1 protein49.28148.11139.56465.3
Sotub10g017020St.Unk5Unknown Protein9.9251.13478.091714.8
Table 3. Summary statistics for least absolute shrinkage and selection operator (LASSO) analysis. Adjusted R2 and mean squared error (MSE) from fitting the linear regression model for each of the crop parameters of yield, specific gravity, and total N uptake to the test data are presented. The factors were site and cultivar. All genes were the entire set of 63 genes in the nCounter analysis. LASSO10 genes were the genes selected from the 63 genes in the reduced regression models. The full model included N rates, expression of all genes and factors for prediction of each of the crop parameters of yield, specific gravity, and total N uptake. The factors model included just the factors, and the all-genes model was just the 63 genes. The LASSO10 genes model included just the selected genes from Table 2 for predicting each of the crop parameters with a reduced set of genes.
LASSO Regression ModelYieldSpecific GravityTotal N Uptake
Adjusted R2MSEAdjusted R2MSEAdjusted R2MSE
Full0.3065.24−0.086.68 × 10−50.522825.11
Factors0.6334.490.334.18 × 10−50.711693.08
All genes0.3561.400.085.70 × 10−50.353858.10
LASSO10 genes0.5740.580.354.06 × 10−50.582489.55
Publisher’s Note: MDPI stays neutral with regard to jurisdictional claims in published maps and institutional affiliations.

