Article

Aegilops tauschii Introgressions Improve Physio-Biochemical Traits and Metabolite Plasticity in Bread Wheat under Drought Stress

1
United Graduate School of Agricultural Sciences, Tottori University, Tottori 680-8553, Japan
2
Arid Land Research Center, Tottori University, Tottori 680-0001, Japan
3
Botany Department, Faculty of Science, Aswan University, Aswan 81528, Egypt
4
Graduate School of Sciences and Technology for Innovation, Yamaguchi University, Yamaguchi 753-8511, Japan
5
Wheat Research Program, Agricultural Research Corporation, Wad Medani P.O. Box 126, Sudan
6
Faculty of Agriculture, Tottori University, Tottori 680-8553, Japan
*
Author to whom correspondence should be addressed.
Agronomy 2020, 10(10), 1588; https://doi.org/10.3390/agronomy10101588
Submission received: 24 August 2020 / Revised: 2 October 2020 / Accepted: 15 October 2020 / Published: 16 October 2020
(This article belongs to the Section Crop Breeding and Genetics)

Abstract

:
With the aim of providing genetic materials for breeding drought-resistant wheat varieties, the physiological and metabolic plasticity of three drought-resistant wheat multiple synthetic derivative lines (MSDLs) and their backcross parent “Norin 61” (N61) were evaluated in response to drought stress. The results indicated that the D-genome introgressions from Aegilops tauschii into the MDSLs improved their drought-adaptive traits. Specifically, MNH5 and MSD345 showed higher photosynthesis rates and triose phosphate utilization than N61 under control conditions, resulting in greater accumulation of glucose and sucrose in the shoots. However, under drought stress, MNH5 and MSD345 had higher intrinsic water use efficiency than MSD53 and N61. The total antioxidant capacity and superoxide dismutase activity increased in all three MSDLs, whereas no significant changes were found in N61 in response to drought stress. Metabolome analysis identified six common drought-induced metabolites in all of the investigated genotypes. However, four metabolites (adenine, gamma aminobutyric acid, histidine, and putrescine) each specifically accumulated in an MSDL in response to drought stress, suggesting that these metabolites are important for MSDL drought resistance. In conclusion, MNH5 and MSD345 showed better adaptive responses to drought stress than MSD53 and N61, suggesting that these two MSDLs could be explored for breeding drought-resistant wheat lines.

1. Introduction

Persistent droughts and reductions in the quantity and quality of water resources are considered major environmental constraints affecting global wheat (Triticum aestivum) production [1]. Drought episodes are not limited to dryland regions, but are also increasingly impacting European farmlands due to the current climate change scenario [2]. Therefore, to maintain sustainable wheat productivity under water-deficit conditions, it is imperative to improve wheat drought resistance. Drought resistance has been categorized into four mechanisms: escape, avoidance, tolerance, and recovery [3,4]. Drought escape involves the reprogramming of plant phenology, resulting in a short lifecycle or increased developmental plasticity [5]. Drought avoidance comprises physiological and morphological responses such as stomatal closure and root elongation, which maintain high water status by improving water uptake or reducing water loss under dry conditions [4]. In contrast, drought tolerance refers to the capacity of plants to maintain cellular function under water-deficit conditions by improving the osmotic adjustment, antioxidant capacity, and metabolic homeostasis [3]. Finally, drought recovery refers to the plant’s capability to resume growth and produce seeds after exposure to severe drought stress [4].
Drought avoidance and drought tolerance are the two most important mechanisms for crop improvement [5]. Drought-avoidant and drought-tolerant plants regulate key physiological, biochemical, and metabolic processes that help to avoid, reduce, or repair the damage from drought stress [6,7]. These physiological and biochemical processes include regulation of the transpiration rate (E) and stomatal conductance (gsw) to improve water use efficiency (WUE), and increases in the activity of antioxidant enzymes, such as superoxide dismutase (SOD) and catalase, in order to maintain reactive oxygen species (ROS) balance [8]. The metabolic processes involve accumulation of osmolytes, which enable osmotic adjustment; reprogramming of carbohydrate metabolism and the tricarboxylic acid cycle, which control energy flux; and induction of non-enzymatic antioxidants (polyphenols, Pro, serotonin, betaine, allantoin [All], ascorbic acid, and glutathione), which are involved in ROS homeostasis [7,9,10,11]. These processes often affect normal plant functions, especially photosynthesis, as a trade-off for survival, leading to yield losses [12]. Despite these challenges, drought-resistant wheat genotypes with high yield under drought stress are necessary to meet increasing global wheat demands. Such wheat genotypes are not readily available within the narrow gene pool of elite bread wheat cultivars [13]. Therefore, wild relatives of wheat, such as Aegilops tauschii obtained from dryland regions, have been used for broadening the gene pool of elite bread wheat, resulting in improved resistance to various biotic and abiotic stresses [14,15,16]. Recently, a multiple synthetic derivatives (MSD) population harboring the genetic diversity of 43 Ae. tauschii accessions—representing the entire species range—has been developed and proposed as an effective platform to utilize Ae. tauschii genetic diversity for wheat breeding [14]. However, the mechanisms of stress resistance and the actual impacts of Ae. tauschii introgressions into bread wheat have not been fully understood.
The aim of this study was to evaluate the impact of D-genome introgressions from Ae. tauschii on the physiological, biochemical, and metabolic plasticity of three wheat multiple synthetic derivative lines (MSDLs) under prolonged drought stress. The selected MSDLs had previously shown yield stability in various Sudanese fields under heat stress conditions [16,17] and under post-anthesis drought stress. For comparison, the backcross parent of the MSDLs, the Japanese wheat cultivar “Norin 61” (N61), was also investigated.

2. Materials and Methods

2.1. Plant Materials

Three wheat MSDLs (MNH5, MSD53, and MSD345) and their backcross parent, N61, were used in this study. The MSDLs were developed previously by crossing tetraploid durum wheat (AABB) with D-genome donor Ae. tauschii (DD) to produce synthetic hexaploids. Forty-three synthetic hexaploid lines were crossed and backcrossed with N61 (AABBDD) to produce the MSD population that has been proposed as a platform to harness and utilize the genetic diversity of Ae. tauschii for wheat breeding [14,18]. The backcross parent of the MSDLs, N61, has a representative wheat genome adopted in the 10+wheat genome project (www.10wheatgenomes.com).

2.2. Experimental Design and Drought Treatment

The field experiment was designed in alpha lattice with two replications in Wad Medani, Sudan, during the 2018–2019 growing season. The greenhouse experiment was also designed in alpha lattice with three replications in the same season. To control insect pests, seeds were treated with the insecticide Gaucho (imidacloprid, 35% WP, Bayer Crop Science, St. Louis, MO, USA) at 1 g kg–1 before sowing. Weed control by hand-weeding was done twice. Drought stress was imposed by withholding water supply at 50% anthesis, while the well-watered condition was regularly irrigated until maturity. Grain yield was obtained as the average grain weight per genotype.

2.3. Seed Sowing and Growth Conditions

Prior to sowing, seeds were kept at 4 °C for 5 d to break dormancy and then transferred to room temperature (22 ± 2 °C) for 24 h. Germinated seeds from each genotype were sown in plastic trays (internal diameter = 44.3 × 33 × 16 cm3) filled with compost and sand dune regosol (1:1, v:v) collected from the Arid Land Research Center, Tottori, Japan. Plants (24 per tray; 6 replicates per genotype) were grown in a completely randomized design with an 8 × 9 cm2 spacing between plants. All genotypes were grown in a growth chamber (Espec, Japan) at an optimum temperature (25/19 °C day/night) and light period (14/10-h light/dark), with a photosynthetic photon flux density of 950 µmol m−2 s−1 and controlled relative humidity level (40/50% light/dark). The soil water potential was monitored every 1 h using sensors (Teros21; Decagon Devices, Pullman, WA, USA) and data loggers (Em50; Decagon Devices, Pullman, WA, USA).

2.4. Drought Treatment and Sampling

All seedlings from each genotype were grown for 21 d before imposing drought by withholding water from the drought trays, while the control trays were maintained at 100% field capacity. Samples were collected at the 5th leaf stage (Zadoks stage 15; [19]) when the soil water potential had decreased to −1000 kPa in the drought condition (Figure S1). Whole shoots were harvested, snap-frozen in liquid nitrogen, and stored at −80 °C for physiological, biochemical, and metabolome analyses.

2.5. Physiological Analysis

2.5.1. Determination of Relative Water Content (RWC)

The RWC of leaf samples from each genotype was determined from the middle section of fully expanded leaves collected from control and drought-treated plants. The leaves were cut into 2 cm segments, and three segments per leaf were collected. RWC [20] was determined using the following equation:
R W C   % = F W D W T W D W   × 100 ,
where FW, TW, and DW are the leaf fresh weight, turgid weight, and dry weight, respectively.

2.5.2. Measurement of Photosynthetic CO2 Response

The photosynthetic CO2 response was measured on fully expanded leaves using a LI-COR 6800 Portable Photosynthesis System (LI-COR Biosciences, Lincoln, NE, USA). A photosynthetic curve was developed using different ambient CO2 concentrations (Ca): 0, 50, 100, 200, 400, 500, 800, 1000, 1500, and 2000 µmol mol−1. Light intensity, leaf temperature, and relative humidity settings were similar to the growth chamber conditions mentioned above. The CO2 assimilation rate (A), intercellular CO2 concentration (Ci), gsw, and E were obtained directly from the Portable Photosynthesis System, while the maximum ribulose 1,5-bisphosphate carboxylase/oxygenase (Rubisco) carboxylation rate (Vcmax), photosynthetic electron transport rate (J), triose phosphate utilization rate (TPU), and leaf day respiration (Rd) were calculated using curve-fitting equations [21,22]. The intrinsic water use efficiency (iWUE) was calculated as the ratio of A to gsw at 400 µmol mol−1 CO2 [23].

2.6. Biochemical Analysis

2.6.1. Determination of Total Phenolic Content (TPC)

TPC was determined by the Folin–Ciocalteu method [24] using gallic acid as the standard. Freeze-dried leaf powder was accurately weighed and placed in 1.5 µL centrifuge tubes. Samples were extracted with 500 µL of 50% methanol for 30 min using a sonicator (AS ONE, Shanghai, China) and centrifuged at 6000× g for 6 min at 22 ± 2 °C, then the supernatant was collected for further analysis. TPC was measured spectrophotometrically at 765 nm using a microplate reader (SH-9000; Corona Electronic, Ibaraki, Japan) and was expressed as gallic acid equivalents per sample dry weight (µg GAE mg−1 DW).

2.6.2. Determination of Trolox Equivalent Antioxidant Capacity (TEAC)

TAC was measured using the DPPH radical assay described by Shimamura et al. [25]. Homogenized frozen leaf samples were extracted with 1 mL of 80% ethanol. Next, 25 μL extract aliquots were transferred into 96-well microplates and 80 μL of 0.1 M Tris-HCl buffer (pH 7.4) was added, followed by 100 μL of 0.1 mM freshly prepared DPPH solution. In addition, freshly prepared Trolox solutions (0, 20, 40, 60, and 80 mg L−1) were treated in the same way as the samples. The absorbances of samples and standard were measured at 517 nm using a microplate reader (SH-9000). The percentage inhibition of the DPPH radical was calculated using the following equation:
%   i n h i b i t i o n = A c o n t r o l A s a m p l e A c o n t r o l A b l a n k × 100
where Acontrol = absorbance of ethanol + Tris-HCl buffer + DPPH solution; Asample = absorbance of sample or standard + Tris-HCl buffer + DPPH solution; and Ablank = absorbance of ethanol + Tris-HCl buffer solution.
The sample or standard concentration that caused a 50% reduction in the original concentration of the DPPH radical (defined as IC50) was calculated from the percentage inhibition. Finally, the antioxidant capacity of the samples was calculated as IC50 Trolox/IC50 sample and expressed as TEAC. Trolox was purchased from Merck KGaA (Darmstadt, Germany) and 2,2-diphenyl-1-picrylhydrazyl (DPPH) was purchased from Tokyo Chemical Industries (Tokyo, Japan). All other reagents and solvents were purchased from Wako Pure Chemical Industries (Osaka, Japan).

2.6.3. Superoxide Dismutase (SOD) Assay

The SOD activity in the plant extracts was measured using an SOD Assay Kit-WST (lot# LG854; Dojindo, Kumamoto, Japan) following the manufacturer’s instructions. The kit uses xanthine or xanthine oxidase to generate superoxide, which reduces WST-1 to a yellow formazan dye. SOD inhibits this reduction by scavenging the superoxide. To generate an SOD inhibition curve, serial dilutions of samples were made in the range of 1/5 to 1/55. Absorbance was measured at 450 nm using a microplate reader (SH-9000) and SOD activity was calculated from the absorbances of blanks and samples.

2.7. Metabolite Analysis

2.7.1. Analysis of Amino Acids, Organic Acids, and Nucleotides

The metabolite sample preparation and analysis were conducted following the tandem liquid chromatography–mass spectrometric (LC-MS/MS) method described by Itam et al. [26]. Briefly, 4 mg of freeze-dried sample was extracted with 500 µL of 50% methanol and centrifuged at 15,000× g for 5 min at 4 °C. Then, 450 µL of the supernatant was mixed with an equal volume of chloroform, vortexed, and centrifuged at 15,000× g for 5 min at 4 °C. Next, 400 µL of the supernatant was filtered through a membrane (Amicon Ultra-0.5 mL, 3-kDa cutoff; Millipore, Billerica, MA, USA) and centrifuged. The filtrate was dried in a SpeedVac concentrator (Thermo Fisher Scientific, Waltham, MA, USA) at 45 °C for 6 h. The dry extract was redissolved in 200 µL of 50% methanol, and an aliquot was diluted in 50% methanol by 10-fold for metabolite quantification. Metabolites were quantified using a triple quadrupole system (Agilent 6420; Agilent, Santa Clara, CA, USA) with a Discovery HS-F5 column (2.1 × 250 mm, 5 μm; Sigma-Aldrich, St. Louis, MO, USA). The metabolites were identified by multiple reaction monitoring analysis. Quantification results were normalized by sample dry weight, and a quality control reference was developed using metabolite authentic standard mixtures of different concentrations (0, 0.4, 2, and 10 ppm). All the solvents and reagents used were LC-MS grade. The detailed information regarding LC-MS/MS is summarized in Tables S1 and S2.

2.7.2. Analysis of Glucose and Sucrose

The concentrations of glucose and sucrose were determined using HPLC (Prominence, Shimadzu, Kyoto, Japan), as described by Murata et al. [27]. This method is based on the fluorometric detection of reducing sugars using L-arginine as a detection agent [28]. Briefly, an aliquot of the resuspended dry extract was diluted 10-fold in ddH20. The solution was eluted with a gradient of 0.1 and 0.4 M potassium borate buffer (pH 8.0 and pH 9.0, respectively) for 90 min and heated at 150 °C under pressure with 1% L-arginine and 3% borate. Fluorescence was detected using a fluorescence detector (RF-10AXL, Shimadzu) set at 320 nm excitation and 430 nm emission wavelengths.

2.8. Statistical Analysis

Microsoft Excel 2019 was used for the ANOVA, Student’s t-tests, and Z-transformations of metabolic and physiological data. The R program version 3.5.2 63 [29] was used for principal components analysis (PCA). The Mass Profiler Professional software (MPP version 2.5; Agilent Technologies) was used for clustering analysis. Genotype-genotype comparisons were conducted according to Tukey’s honestly significant difference (HSD) test.

3. Results

3.1. Yield performance of the Three MSDLs under Post-Anthesis Drought Stress

The average yield stability (drought tolerance efficiency) for all investigated genotypes was 59.75%. The three MSDLs showed higher drought tolerance efficiency than N61 under post-anthesis drought stress (Table 1). Under field conditions, MSD53 had high yield under control and drought conditions compared with N61, a local Sudanese cultivar (Imam), and MSD345. However, MSD53 had low drought tolerance efficiency compared with MSD345. Interestingly, N61 which had low yield under control and drought conditions, also had low drought tolerance efficiency compared with the three MSDLs (Table 1). Accordingly, these MSDLs were selected as drought-tolerant candidates.

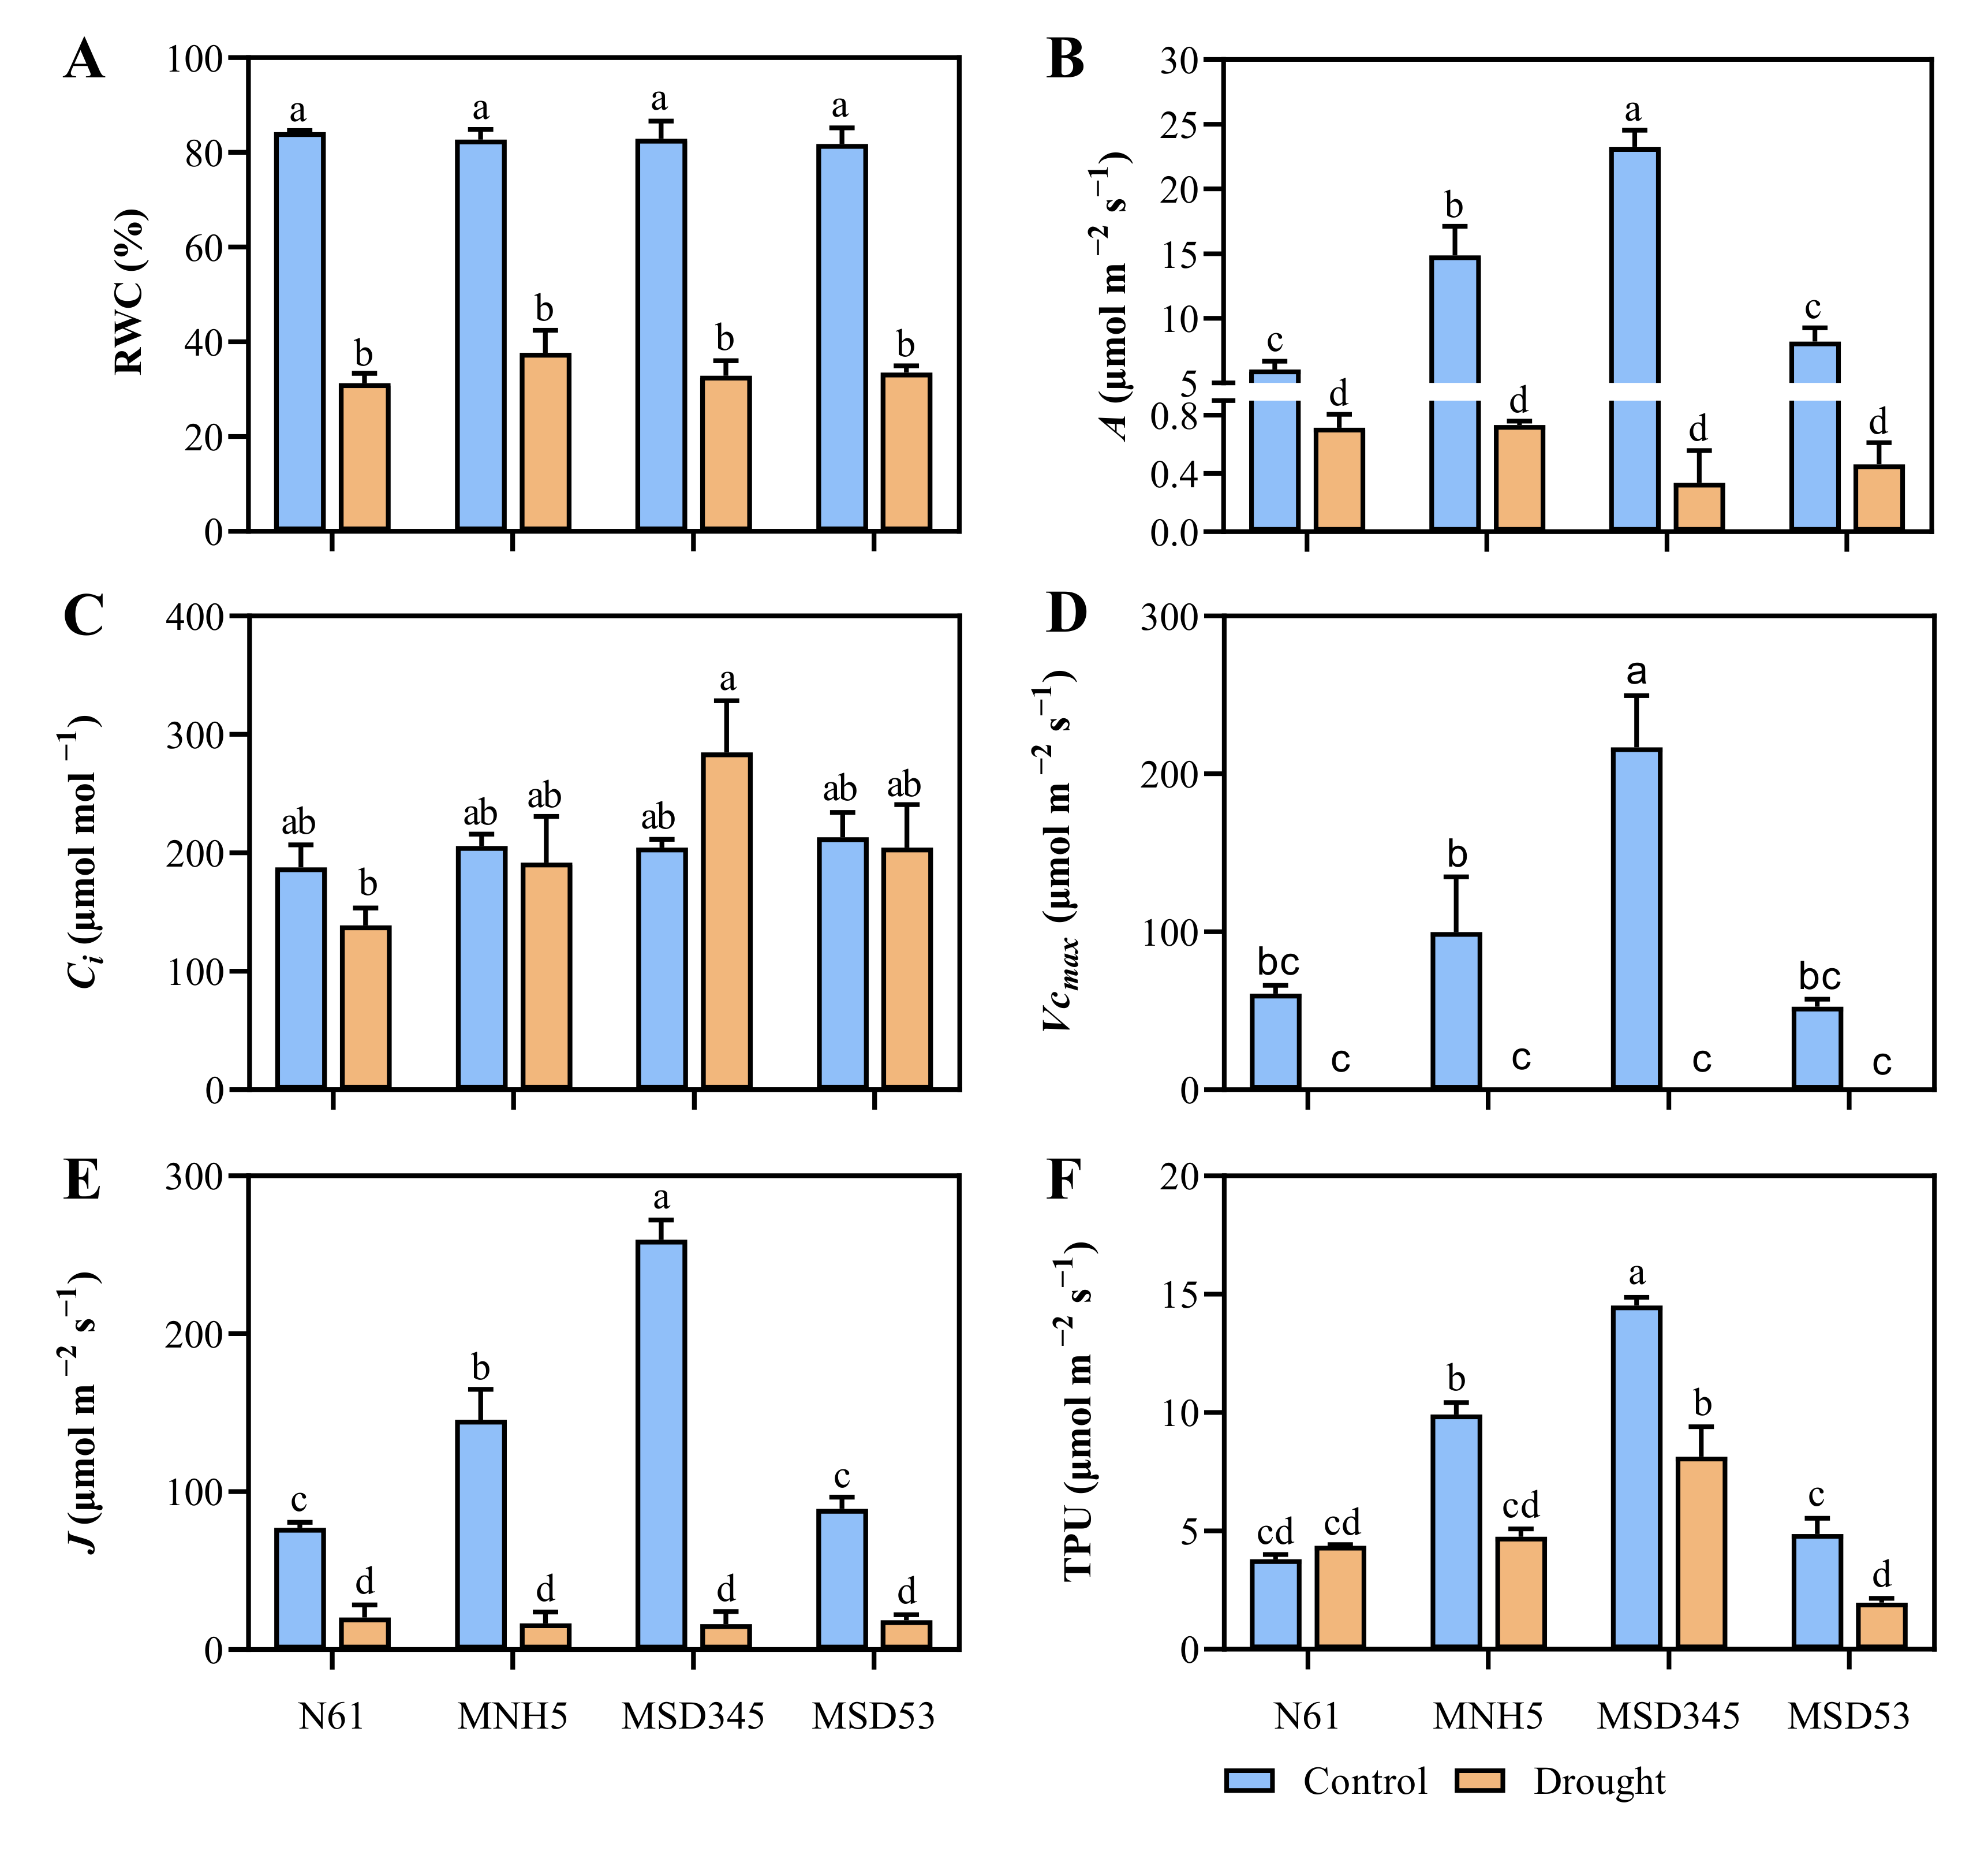
3.2. Genotypic Variation in Photosynthetic Parameters and Leaf Relative Water Content of MSDLs and N61 under Drought Stress

To investigate the impact of D-genome introgressions from Ae. tauschii on physiological adaptation to drought stress, the photosynthetic changes and leaf RWCs of the three selected MSDLs and N61 were evaluated. Leaf RWC did not show any significant differences between the three MSDLs and N61 in response to drought stress, and the mean RWC of all investigated genotypes decreased by ~60% relative to the control conditions (Figure 1A). On the other hand, the plot of A against Ci indicated that the three MSDLs exhibited higher photosynthesis rates than N61 under control conditions (Figure S2). In particular, MNH5 and MSD345 showed significantly higher As than MSD53 and N61 (Figure S2). However, under drought stress, A significantly decreased in all investigated genotypes, and there were no significant differences between the MSDLs and N61 (Figure 1B). Although A was comparable among the MSDLs and N61 under drought stress, Ci showed an increasing trend in the MSDLs and was significantly higher in MSD345 than in N61, suggesting that MSDLs are able to maintain higher diffusion of CO2 into the substomatal cavity under drought stress than N61 (Figure 1C).
Next, we applied the data obtained from the photosynthetic CO2 response to photosynthesis models [21,22] to identify the processes affecting leaf photosynthesis in the investigated genotypes in response to drought stress. MNH5 and MSD345 showed higher Vcmax values than MSD53 and N61 under control conditions, with MSD345 showing significantly higher values (Figure 1D). However, Vcmax decreased to zero in all investigated genotypes under drought stress (Figure 1D). Similarly, MNH5 and MSD345 showed significantly higher J than MSD53 and N61 under control conditions, whereas drought stress significantly decreased J in all four genotypes, with no significant differences among the drought-stressed genotypes (Figure 1E). Consistently, the MSDLs showed higher TPU (ranging from 4.87 to 14.52 μmol m−2 s−1) than N61 (3.80 μmol m−2 s−1) under control conditions, particularly MNH5 and MSD345, whereas under drought stress, the TPU decreased (ranging from 1.97 to 8.14 μmol m−2 s−1) in the MSDLs, but remained unchanged in N61 (Figure 1F). Although TPU significantly decreased in the MSDLs under drought stress, the level of TPU in drought-stressed MSD345 was higher than that in N61 (Figure 1F). Similarly, Rd was higher in MNH5 and MSD345 than in MSD53 and N61 under control conditions, but significantly reduced in all genotypes under drought stress (Figure S3). The above results indicated that Ae. tauschii introgressions in the MSDLs improved several photosynthesis traits, including A, Vcmax, J, and TPU under control conditions compared with N61. Under drought stress, however, the values for these traits decreased in both MSDLs and N61, except for TPU in N61, which did not decrease under drought stress. Nevertheless, values for some photosynthesis traits such as Ci and TPU under drought conditions were higher in the MSDLs, especially MSD345, than in N61.
The ECa and gswCa curves showed higher E and gsw in MNH5 and MSD345 than in MSD53 and N61 under control conditions (Figure S4, Figure 2A,B). On the other hand, drought stress reduced E and gsw in all investigated genotypes (particularly in the MSDLs) relative to control conditions (Figure 2A,B). Although E and gsw decreased under drought stress in all four genotypes, the three MSDLs tended to have lower E and gsw than N61 under drought stress, suggesting that these MSDLs could reduce water loss under water-deficit conditions (Figure S4). The ability of the MSDLs to reduce water loss under drought conditions was also evident in the improved intrinsic water use efficiency (iWUE) in the MSDLs compared with N61 in response to drought stress. The iWUE of N61 was 151.3 µmol CO2 mol H2O−1 under control conditions, which was higher than that of the MSDLs (from 83.1 to 101.0 µmol CO2 mol H2O−1; Figure 2C). However, under drought stress, MNH5 and MSD345 showed increases in iWUE of 1.52- and 1.57-fold relative to control conditions, whereas the iWUE values of MSD53 and N61 did not show any significant changes (Figure 2C). This result provided additional evidence of the important contributions of Ae. tauschii introgressions in improving WUE for drought adaptation in the MSDLs.

3.3. Genotypic Variation in TPC and TEAC of MSDLs and N61 under Drought Stress

Under control conditions, MNH5 and N61 exhibited significantly higher TPC than MSD53. However, under drought stress, all three MSDLs showed an increasing trend in TPC, whereas N61 showed a decreasing trend (Table 2). The effects of genotype (G), water regime (E), and G × E interaction were all significant for TPC.
In contrast, no significant differences were found in TEAC among the four genotypes under control conditions (Table 2). However, under drought stress, TEAC (ranging from 493.86 to 495.61 µg Trolox mg−1 FW) values increased significantly in all three MSDLs (significantly in MNH5 and MSD345) but not in N61 (Table 2). The effects of the genotype (G), water regime (E), and G × E interaction were all significant for TEAC (Table 2). As with TEAC, the SOD activity was similar among the MSDLs and N61 under control conditions. However, under drought stress, SOD activity significantly increased in the three MSDLs but not in N61 (Table 2).

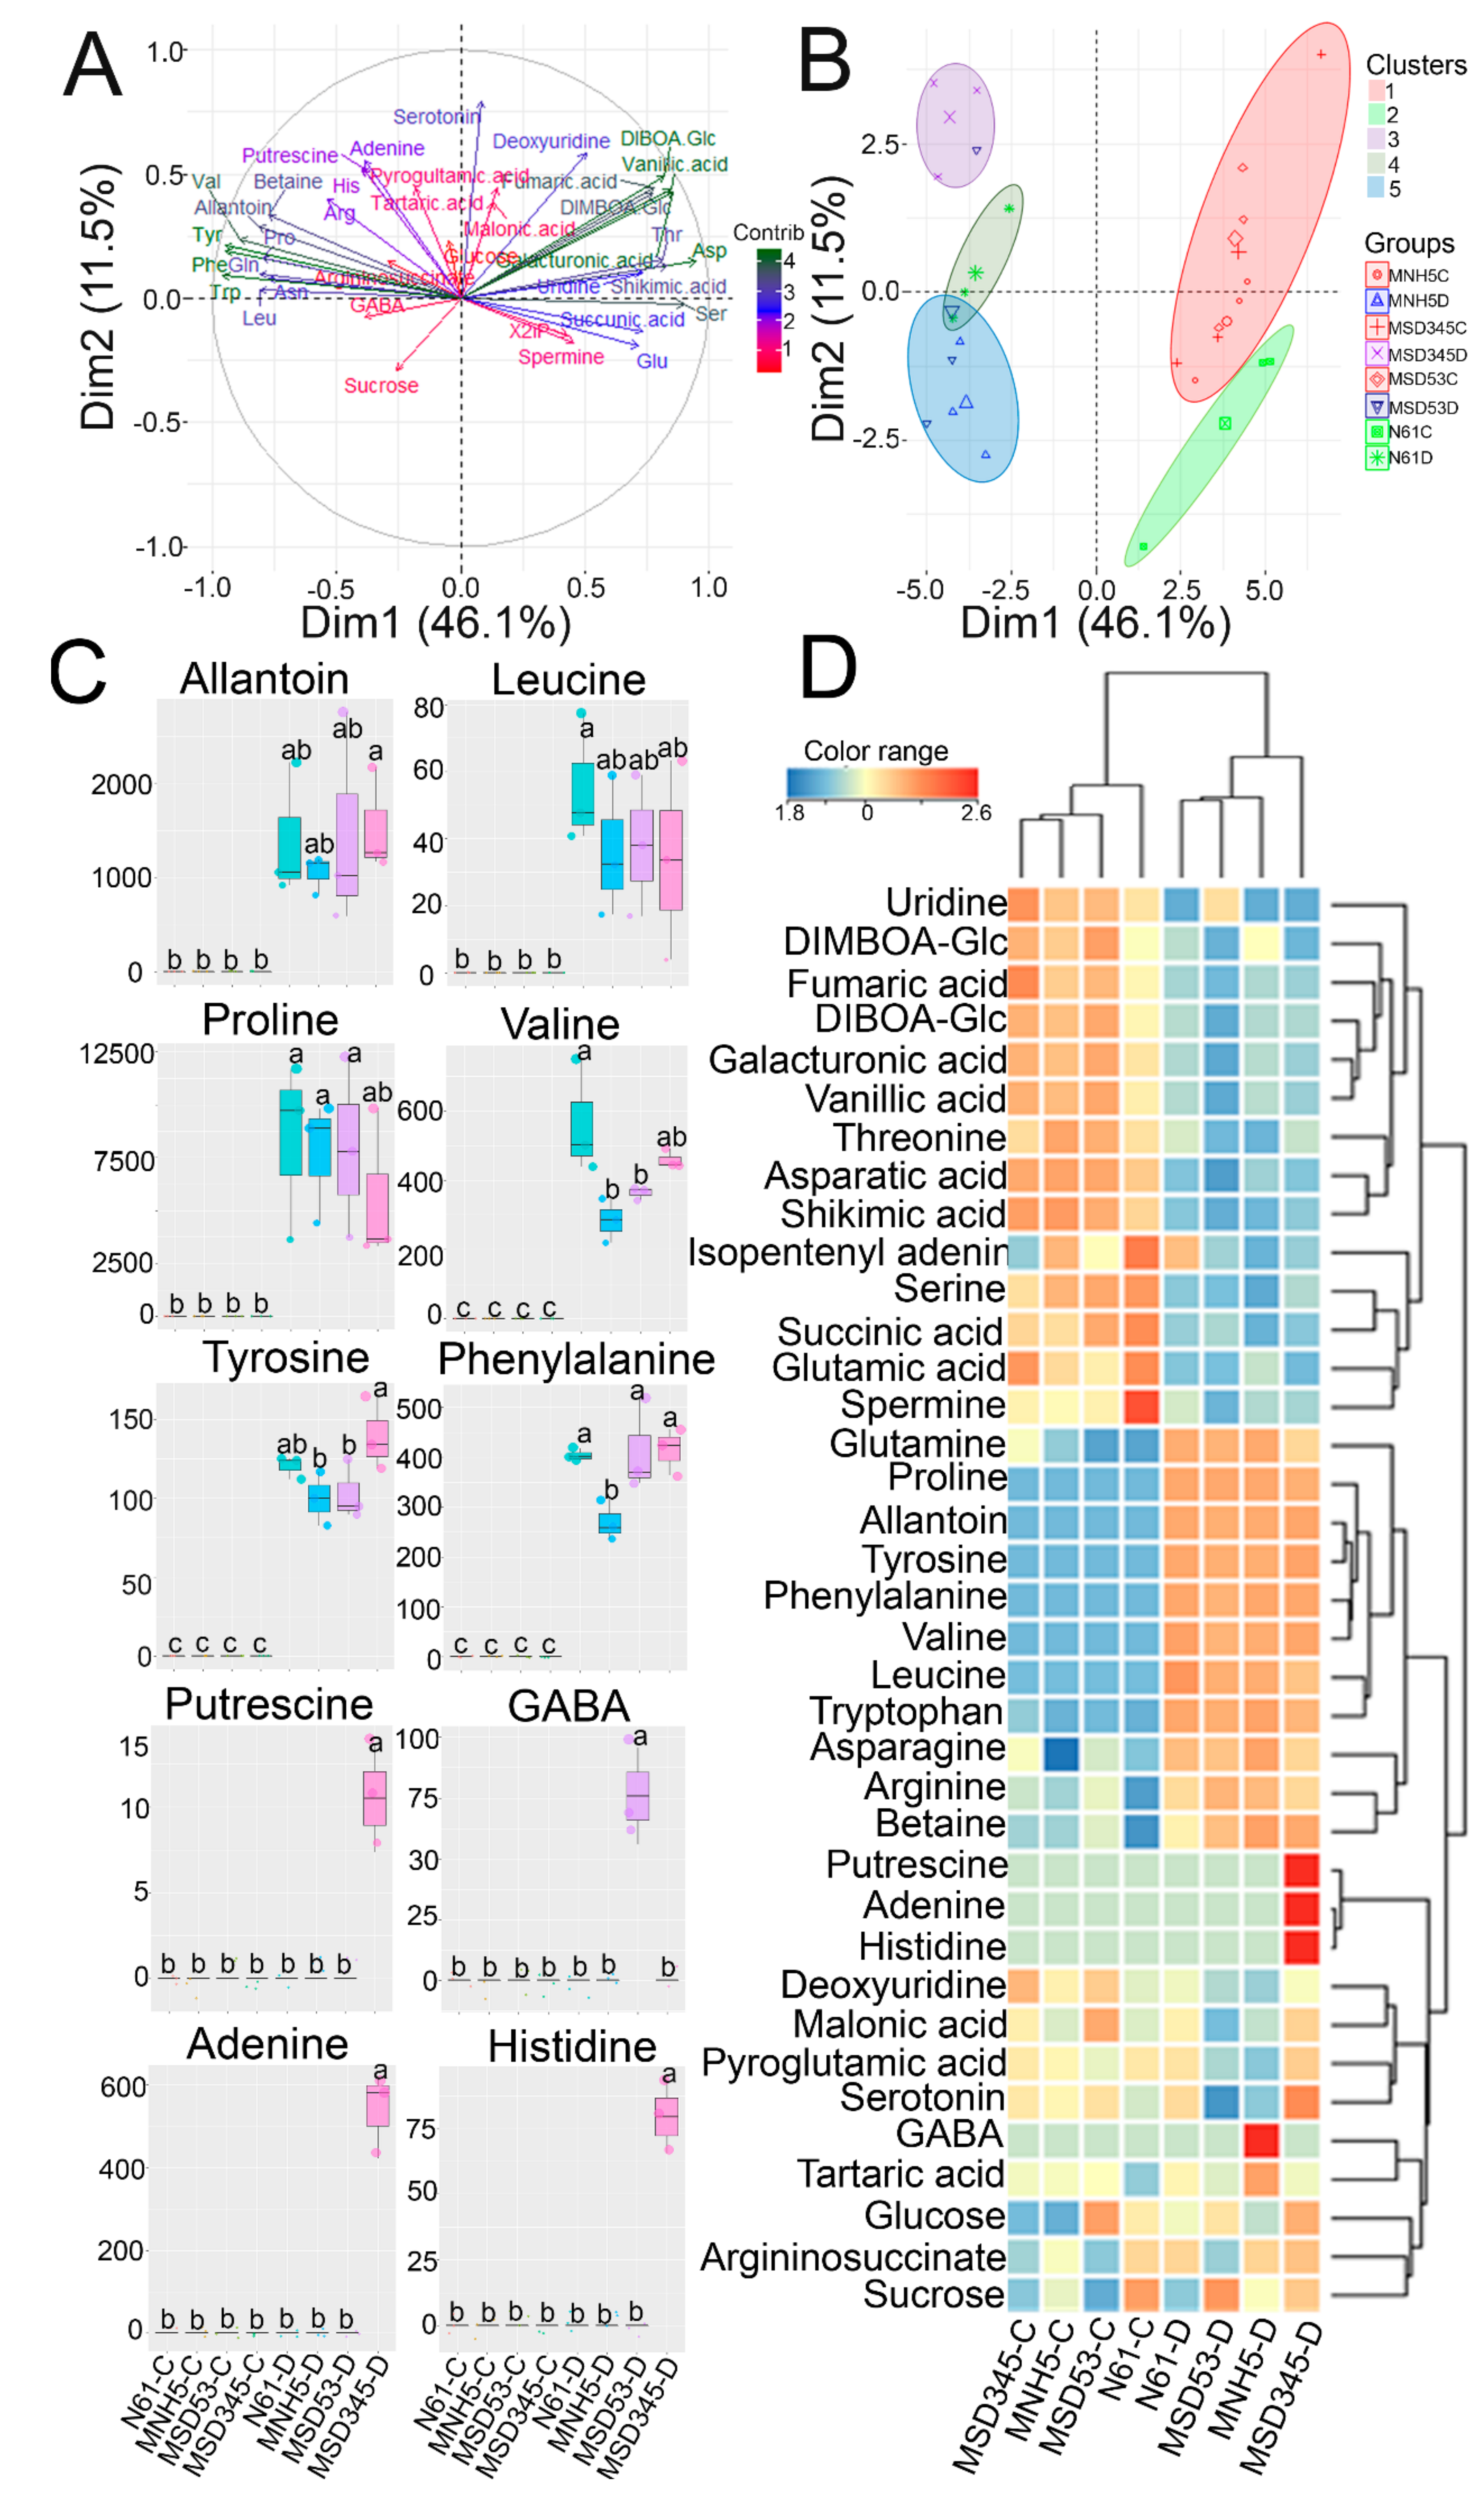
3.4. Metabolite Changes in Response to Drought Stress

To evaluate metabolite homeostasis in response to drought stress, a targeted metabolomic analysis was conducted using LC-MS/MS and HPLC. A total of 37 metabolites were identified in the MSDLs and N61, which were analyzed by principal component analysis (PCA) to determine the interrelated effects of drought stress on the four genotypes (Figure 3A,B). PC1 and PC2 explained 46.1% and 11.5%, respectively, of the total variation. PC1 separated the investigated genotypes based on drought or control conditions, while PC2 captured the genotypic variability (Figure 3A,B). The PCA separated all investigated genotypes into five clusters: clusters 1 and 2 contained MSDLs and N61, respectively, under control conditions, indicating that the metabolite profiles of the MSDLs were different from that of N61 even under control conditions (Figure 3A,B); cluster 3 primarily contained MSD345, cluster 5 primarily contained both MNH5 and MSD53, while cluster 4 primarily contained N61, all under drought stress (Figure 3A,B). The PCA results indicated that the MSDLs exhibited distinct metabolic profiles under both control and drought conditions compared with N61, which may be due to the Ae. tauschii introgressions in the MSDLs.
Under drought conditions, 16 of the 37 metabolites showed a decreasing trend, while 17 showed an increasing trend in all investigated genotypes. Among the 17 increased metabolites, six metabolites, namely All, Leu, Phe, Pro, Tyr, and Val, were observed only under drought conditions in both MSDLs and N61 (Figure 3C). Four metabolites (adenine, γ-aminobutyric acid (GABA), His, and the polyamine putrescine) each specifically accumulated in an MSDL, but not in N61, in response to drought stress (Figure 3C). Similar to the PCA results, the clustered heat map divided the investigated genotypes into two main clusters, one containing all genotypes grown under control conditions and the other containing all genotypes grown under drought stress (Figure 3D). The metabolite variables were also divided into two main clusters: one contained metabolites exhibiting a decreasing trend in the MSDLs and N61 under drought conditions, while the other contained metabolites that increased in the MSDLs or N61 under drought conditions (Figure 3D). Interestingly, the drought-specific metabolites clustered together, while three out of four MSDL-specific metabolites also clustered together. These three metabolites are those found specifically in MSD345, whereas the non-clustered one (GABA) was specific to MSD53 (Figure 3D). In addition, most of the detected amino acids showed an increasing trend in all four genotypes under drought stress, while organic acids showed a decreasing trend. Glucose and sucrose levels increased in MNH5 and MSD345 under drought stress, but decreased in N61. Also, glucose had a decreasing trend in MSD53 (Figure 3D).

4. Discussion

Due to the polygenic nature of drought resistance and the genetic complexity of wheat, less progress has been made in developing drought-resistant varieties of wheat than of maize (Zea mays) or rice (Oryza sativa) [30]. Wild relatives of wheat harbor many useful genes and have the potential to survive well under climatic extremes. However, utilization of these wild relatives is hindered mainly by ploidy level differences and chromosomal barriers between cultivated and wild species. Careful selection is often needed to avoid cross-incompatibility and minimize linkage drag while maintaining high yield under drought stress [15]. The introgression of wild alleles from Ae. tauschii into common wheat is one of the most efficient methods for increasing wheat genetic diversity and introducing desirable agronomic traits into elite germplasms [14,31]. The MSDLs had been developed using Ae. tauschii accessions through the “synthetic derivative” approach [14,18].
In the present study, the effects of drought stress on the biochemical, physiological, and metabolic plasticity of the MSDLs compared with N61 were investigated at the seedling stage. The MSDLs were developed in the background of N61 and are, therefore, comparable with N61 in this study. The “same-tray” method ensured that all investigated genotypes were exposed to the same level of drought stress as indicated by the decrease in soil water potential (Figure S1). Moreover, the reduction of RWC in the tested lines under drought stress compared to the control conditions indicated that all investigated genotypes were exposed to severe drought stress (Figure 1A). Photosynthetic parameters such as A, Vcmax, J, TPU, and Rd were significantly higher in MSDLs, especially MNH5 and MSD345, than in N61 under control conditions (Figure 1B,D–F, Figure S2), indicating that the D-genome introgressions from wild Ae. tauschii improved the photosynthetic capacity of the MSDLs under optimal conditions. On the other hand, the high TPU values observed in MNH5 and MSD345 compared with MSD53 and N61 under drought stress (Figure 1F) indicated that MNH5 and MSD345 were able to maintain the conversion of triose phosphates to sugars [32]. These high TPU levels were consistent with high glucose and sucrose contents in those genotypes, whereas the low TPU levels in MSD53 and N61 were consistent with the relatively low glucose and sucrose contents in the respective genotypes (Figure 3D).
In general, drought-tolerant plants are known to maintain high TPU values compared with drought-sensitive plants [33]. A similar increase in TPU under drought stress was reported in a wheat line containing introgressions from wild emmer wheat (Triticum turgidum ssp. dicoccoides), resulting in greater drought resilience and high yield components [34]. High TPU under water-deficit conditions increases the level of inorganic phosphate concentration and ribulose 1,5-bisphosphate regeneration in the Calvin cycle, ultimately increasing photosynthesis [32,35]. Additionally, TPU regulates the conversion of triose phosphates into sugars, which act as protective osmolytes and signaling molecules under drought and osmotic stresses [36,37]. MNH5 and MSD345 showed higher iWUE values (Figure 2C) as a common adaptive mechanism in drought-resistant wheat [8]. WUE at the leaf level is directly related to the physiological processes controlling the amount of carbon assimilated as biomass or grain produced per unit of water used by the plant [38]. Thus, iWUE as a consequence of reduced E or gsw and a concomitant increase in A can boost wheat productivity during water-deficit conditions [39].
One of the mechanisms that enables plants to avoid oxidative-stress-induced damage is the production of phenolic compounds [40]. The TPCs of wheat have been reported to increase in response to drought stress [41]. Consistently, the TPCs of the MSDLs tended to increase in response to drought stress; however, the TPC levels were comparable between the MSDLs and N61 (Table 2), suggesting that there are no major genotypic differences between the MSDLs and N61 in terms of TPC. On the other hand, the TEAC values of all three MSDLs showed higher trends than that of N61 under drought stress (Table 2). In addition, SOD, which catalyzes the dismutation of the superoxide anion into hydrogen peroxide and molecular oxygen [42], was significantly higher under drought stress in the MSDLs than in N61 (Table 2). Both TEAC and SOD activity suggested that the selected MSDLs were able to maintain ROS homeostasis and subsequently reduced oxidative-stress–induced damage under water-deficient conditions compared with N61.
The four metabolites (adenine, GABA, His, and putrescine) that specifically accumulated only in MSDLs (Figure 3C) play important roles in stress response, antioxidant activities, osmoprotection, and nucleotide protection [43,44,45,46,47]. Adenine, a purine nucleotide, has been reported to accumulate in drought-tolerant wheat under drought stress, indicating the activation of drought tolerance mechanisms to protect nucleic acid metabolism [43,44]. The improvements in nucleic acid metabolism were highly coordinated with the increase in the proteinogenic amino acid His, which is synthesized from 5-phosphoribosyl-1-pyrophosphate and tightly linked to nucleotide metabolism [46]. Due to purine–His cross-pathway regulation [45], it has been suggested that His accumulation may be involved in nucleotide synthesis and protection under drought stress [26]. Additionally, the polyamine putrescine is a β-alanine precursor and an antioxidant reported in plants under abiotic stresses [47,48]. Similarly, GABA accumulation has been associated with carbon–nitrogen balance and ROS scavenging [49,50]. We, therefore, conclude that the MSDL-specific metabolites may play important roles in drought resistance in the MSDLs and may be linked to contributions from Ae. tauschii. Additionally, the six metabolites that accumulated in all genotypes only under drought stress (All, Leu, Phe, Pro, Tyr, and Val; Figure 3C,D) were identified as potential biomarkers for drought response. All are nitrogen-rich intermediates of purine catabolism, which stimulates abscisic acid production, jasmonic acid homeostasis, nitrogen recycling, and ROS scavenging in Arabidopsis under stress conditions [11,51,52]. Additionally, Leu and Val are possible energy sources in drought-stressed wheat [53], while Phe and Tyr are targets of oxidation and have protective functions against ROS [54].
This study validates the initial selection of MNH5, MSD53, and MSD345 based on agronomic performance under field conditions [16,17] (Table 1). Our data suggest that MNH5 and MSD345 have isohydric (water-saving) traits; that is, they have the capacity to maintain low E and gsw under drought conditions. This is evident in the low yield (but higher yield stability) and the relatively higher iWUE values observed under drought stress (Table 1, Figure 2C). In contrast, MSD53 has anisohydric (water-spending) traits, which are evident in its high yield and the low (and unchanged) iWUE under drought stress (Table 1, Figure 2C). This further suggests that MSD53 may have mechanisms for avoiding drought stress in the field, enabling it to maintain high yield. Such drought avoidance mechanisms may be related to the root system. In a preliminary study on the root phenotypes of the MSDLs, MSD53 was found to have a wider root angle than MNH5 and MSD345, suggesting a higher capacity to absorb more water from a wide radius. This trait may have contributed to its high yield under field conditions in Wad Medani, Sudan (Table 1), and suggests adaptation to a specific type of drought environment, which may prove useful in drought breeding programs. Furthermore, an auxin-responsive transcription factor in the LATERAL ORGAN BOUNDARIES domain family, i.e., MORE ROOT from the D-genome of wheat (TaMOR-D), is conserved in Ae. tauschii, and has been reported to improve the root system architecture, increase the panicle length in rice, and increase the yield in rice and Arabidopsis [55]. This transcription factor, among other favorable genes, may have been transferred into MSD53 from the Ae. tauschii accession used in the cross, which is adapted to the dry conditions of northern Iran. Future analysis of the root phenotypic plasticity and transcriptomics in the MSDLs under drought stress will further advance our knowledge of the role of Ae. tauschii accessions in conferring drought resistance to bread wheat, and will create a platform for marker-assisted selection for drought-resistant genotypes. In summary, this study has shown the contributions of Ae. tauschii introgression to the drought stress resistance of bread wheat through physiological, biochemical, and metabolite analysis. Our findings support the idea that actual drought adaptation can be assessed only when the whole system is considered in terms of yield potential, drought resistance, and WUE [56]. In line with this, we propose a diversity breeding scheme (Figure 4) adapted from Tsujimoto et al. [18] to effectively utilize the diversity in Ae. tauschii for drought resistance breeding.

5. Conclusions

The gains from Ae. tauschii introgression include high photosynthetic activity, SOD activity, and improved metabolite homeostasis in response to drought stress. Our analysis suggests that MNH5 and MSD345 have water-saving traits, while MSD53 may be water-spending but drought-avoiding. The use of these genotypes for further breeding will depend on the target area and purpose of breeding. For example, the water-saving genotypes (MNH5 and MSD345) may be more useful in drylands with limited or non-reachable groundwater, such as the savannah regions of sub-Saharan Africa. In contrast, MSD53 will be potentially useful for drought avoidance breeding in areas with high groundwater content reachable with a robust root architecture, such as the Mediterranean region.

Supplementary Materials

The following are available online at https://www.mdpi.com/2073-4395/10/10/1588/s1, Figure S1. Decreasing soil water potential after withholding water. Data was recorded every 2 h during drought treatment. Figure S2. CO2response curve of the multiple synthetic derivative lines and their backcross parent, Norin 61 (N61) under control conditions. Data represent mean of three biological replicates. Error bars represent standard deviation. Figure S3. Leaf day respiration (Rd) of the multiple synthetic derivative lines and their backcross parent, Norin 61 (N61) under control and drought stress conditions. Data represent mean of three biological replicates at 400 µmol mol-1 CO2 concentration. Error bars represent standard deviation. Values marked with the same letter are not significantly different (p < 0.05) between genotypes and conditions according to the Tukey HSD test. Figure S4. The transpiration rate (E) – ambient CO2 concentration (Ca) curves, and stomatal conductance (gsw) – Ca curves of multiple synthetic derivative lines (MSDLs) and their backcross parent, Norin 61 (N61) under control and drought stress conditions. (A-B) E under control (A) and drought stress (B). (C-D) gsw under control (C) and drought stress (D). Data represent mean of three independent biological replicates. Error bars represent standard deviation. Table S1. Metabolite analysis method. Table S2. Gradient condition for LC-MS-MS analysis.

Author Contributions

M.I. and M.A. conceptualized the study and performed physiological experiments. H.T. provided wheat materials and acquired funding. M.I. performed biochemical and metabolite analysis. M.I analyzed the data and wrote the manuscript with input from M.A., M.I., and M.A. prepared the figures. Y.Y., R.M., and Y.G. revised the manuscript. H.T. and K.A. supervised the research. All authors have read and agreed to the published version of the manuscript.

Funding

This study was partly funded by Science and Technology Research Partnership for Sustainable Development (SATREPS, JPMJSA1805) by JST, Kakenhi (18H02179), and the Marginal Region Agriculture Project of Tottori University.

Acknowledgments

The authors are thankful to Y. Kano, S. Okida, and R. Kuramasu (Arid Land Research Center, Tottori University) for technical assistance.

Conflicts of Interest

The authors declare no conflict of interest.

References

  1. Elliott, J.; Deryng, D.; Müller, C.; Frieler, K.; Konzmann, M.; Gerten, D.; Glotter, M.; Flörke, M.; Wada, Y.; Best, N.; et al. Constraints and potentials of future irrigation water availability on agricultural production under climate change. Proc. Natl. Acad. Sci. USA 2014, 111, 3239–3244. [Google Scholar] [CrossRef] [PubMed] [Green Version]
  2. Estrella, N.; Menzel, A. Recent and future climate extremes arising from changes to the bivariate distribution of temperature and precipitation in Bavaria, Germany. Int. J. Clim. 2012, 33, 1687–1695. [Google Scholar] [CrossRef]
  3. Templer, S.E.; Ammon, A.; Pscheidt, D.; Ciobotea, O.; Schuy, C.; McCollum, C.; Sonnewald, U.; Hanemann, A.; Förster, J.; Ordon, F.; et al. Metabolite profiling of barley flag leaves under drought and combined heat and drought stress reveals metabolic QTLs for metabolites associated with antioxidant defense. J. Exp. Bot. 2017, 68, 1697–1713. [Google Scholar] [CrossRef] [PubMed] [Green Version]
  4. Luo, L.J. Breeding for water-saving and drought-resistance rice (WDR) in China. J. Exp. Bot. 2010, 61, 3509–3517. [Google Scholar] [CrossRef] [PubMed] [Green Version]
  5. Yue, B.; Xue, W.; Xiong, L.; Yu, X.; Luo, L.; Cui, K.; Jin, D.; Xing, Y.; Zhang, Q. Genetic basis of drought resistance at reproductive stage in rice: Separation of drought tolerance from drought avoidance. Genetics 2006, 172, 1213–1228. [Google Scholar] [CrossRef] [PubMed] [Green Version]
  6. Guo, R.; Shi, L.; Jiao, Y.; Li, M.; Zhong, X.; Gu, F.; Liu, Q.; Xia, X.; Li, H. Metabolic responses to drought stress in the tissues of drought-tolerant and drought-sensitive wheat genotype seedlings. AoB Plants 2018, 10, 1–13. [Google Scholar] [CrossRef] [PubMed] [Green Version]
  7. Guo, X.; Xin, Z.; Yang, T.; Ma, X.; Zhang, Y.; Wang, Z.; Ren, Y.; Lin, T. Metabolomics response for drought stress tolerance in chinese wheat genotypes (Triticum aestivum). Plants 2020, 9, 520. [Google Scholar] [CrossRef] [Green Version]
  8. Li, Y.; Li, H.; Li, Y.; Zhang, S. Improving water-use efficiency by decreasing stomatal conductance and transpiration rate to maintain higher ear photosynthetic rate in drought-resistant wheat. Crop J. 2017, 5, 231–239. [Google Scholar] [CrossRef]
  9. Banu, M.N.A.; Hoque, M.A.; Watanabe-Sugimoto, M.; Matsuoka, K.; Nakamura, Y.; Shimoishi, Y.; Murata, Y. Proline and glycinebetaine induce antioxidant defense gene expression and suppress cell death in cultured tobacco cells under salt stress. J. Plant Physiol. 2009, 166, 146–156. [Google Scholar] [CrossRef]
  10. Kaur, H.; Mukherjee, S.; Baluska, F.; Bhatla, S.C. Regulatory roles of serotonin and melatonin in abiotic stress tolerance in plants. Plant Signal. Behav. 2015, 10. [Google Scholar] [CrossRef] [Green Version]
  11. Nourimand, M.; Todd, C.D. Allantoin increases cadmium tolerance in Arabidopsis via activation of antioxidant mechanisms. Plant Cell Physiol. 2016, 57, 2485–2496. [Google Scholar] [CrossRef] [PubMed] [Green Version]
  12. Robredo, A.; Pérez-López, U.; Lacuesta, M.; Mena-Petite, A.; Muñoz-Rueda, A. Influence of water stress on photosynthetic characteristics in barley plants under ambient and elevated co2 concentrations. Biol. Plant. 2010, 54, 285–292. [Google Scholar] [CrossRef]
  13. Ogbonnaya, F.C.; Abdalla, O.; Mujeeb-Kazi, A.; Kazi, A.G.; Xu, S.S.; Gosman, N.; Lagudah, E.S.; Bonnett, D.; Sorrells, M.E.; Tsujimoto, H. Synthetic hexaploids: Harnessing species of the primary gene pool for wheat improvement. Plant Breed. Rev. 2013, 37, 35–122. [Google Scholar] [CrossRef]
  14. Gorafi, Y.S.A.; Kim, J.S.; Elbashir, A.A.E.; Tsujimoto, H. A population of wheat multiple synthetic derivatives: An effective platform to explore, harness and utilize genetic diversity of Aegilops tauschii for wheat improvement. Theor. Appl. Genet. 2018, 131, 1615–1626. [Google Scholar] [CrossRef]
  15. Kishii, M. An update of recent use of Aegilops species in wheat breeding. Front. Plant Sci. 2019, 10, 585. [Google Scholar] [CrossRef] [Green Version]
  16. Elbashir, A.A.E.; Gorafi, Y.S.A.; Tahir, I.S.A.; Elhashimi, A.M.A.; Abdalla, M.G.A.; Tsujimoto, H. Genetic variation in heat tolerance-related traits in a population of wheat multiple synthetic derivatives. Breed. Sci. 2017, 67, 483–492. [Google Scholar] [CrossRef] [Green Version]
  17. Elbashir, A.A.E.; Gorafi, Y.S.A.; Tahir, I.S.A.; Kim, J.S.; Tsujimoto, H. Wheat multiple synthetic derivatives: A new source for heat stress tolerance adaptive traits. Breed. Sci. 2017, 67, 248–256. [Google Scholar] [CrossRef] [Green Version]
  18. Tsujimoto, H.; Sohail, Q.; Matsuoka, Y. Broadening the genetic diversity of common and durum wheat for abiotic stress tolerance breeding. In Advances in Wheat Genetics: From Genome to Field; Springer Japan: Tokyo, Japan, 2015; pp. 233–238. [Google Scholar]
  19. Zadoks, J.C.; Chang, T.T.; Konzak, C.F. A decimal code for the growth stages of cereals. Weed Res. 1974, 14, 415–421. [Google Scholar] [CrossRef]
  20. Barrs, H.; Weatherley, P. A Re-examination of the relative turgidity technique for estimating water deficits in leaves. Aust. J. Biol. Sci. 1962, 15, 413. [Google Scholar] [CrossRef] [Green Version]
  21. Sharkey, T.D.; Bernacchi, C.J.; Farquhar, G.D.; Singsaas, E.L. Fitting photosynthetic carbon dioxide response curves for C3 leaves. Plant, Cell Environ. 2007, 30, 1035–1040. [Google Scholar] [CrossRef]
  22. Bellasio, C.; Beerling, D.J.; Griffiths, H. An Excel tool for deriving key photosynthetic parameters from combined gas exchange and chlorophyll fluorescence: Theory and practice. Plant Cell Environ. 2016, 39, 1180–1197. [Google Scholar] [CrossRef]
  23. Bacon, M.A. Water Use Efficiency in Plant Biology; Blackwell Publishing: Oxford, UK, 2004; ISBN 9781405149990. [Google Scholar]
  24. Slinkard, K.; Singleton, V.L. Total phenol analysis: Automation and comparison with manual methods. Am. J. Enol. Vitic. 1977, 28, 49–55. [Google Scholar]
  25. Shimamura, T.; Sumikura, Y.; Yamazaki, T.; Tada, A.; Kashiwagi, T.; Ishikawa, H.; Matsui, T.; Sugimoto, N.; Akiyama, H.; Ukeda, H. Applicability of the DPPH assay for evaluating the antioxidant capacity of food additives—inter-laboratory evaluation study. Anal. Sci. 2014, 30, 717–721. [Google Scholar] [CrossRef] [Green Version]
  26. Itam, M.O.; Mega, R.; Tadano, S.; Abdelrahman, M.; Matsunaga, S.; Yamasaki, Y.; Akashi, K.; Tsujimoto, H. Metabolic and physiological responses to progressive drought stress in bread wheat. Sci. Rep. 2020, 10, 17189. [Google Scholar] [CrossRef]
  27. Murata, N.; Iwanaga, F.; Maimaiti, A.; Imada, S.; Mori, N.; Tanaka, K.; Yamanaka, N. Significant improvement of salt tolerance with 2-day acclimatization treatment in Elaeagnus oxycarpa seedlings. Environ. Exp. Bot. 2012, 77, 170–174. [Google Scholar] [CrossRef]
  28. Mikami, H.; Ishida, Y. Post-column fluorometric detection of reducing sugars in high performance liquid chromatography using arginine. Bunseki Kagaku 1983, 32, E207–E210. [Google Scholar] [CrossRef] [Green Version]
  29. R Core Team R: A Language and Environment for Statistical Computing; R Foundation for Statistical Computing: Vienna, Austria, 2018; Available online: https://www.R-project.org/ (accessed on 16 October 2020).
  30. Khan, S.; Anwar, S.; Yu, S.; Sun, M.; Yang, Z.; Gao, Z.Q. Development of drought-tolerant transgenic wheat: Achievements and limitations. Int. J. Mol. Sci. 2019, 20. [Google Scholar] [CrossRef] [Green Version]
  31. Cox, T.S.; Wu, J.; Wang, S.; Cai, J.; Zhong, Q.; Fu, B. Comparing two approaches for introgression of germplasm from Aegilops tauschii into common wheat. Crop J. 2017, 5, 355–362. [Google Scholar] [CrossRef]
  32. Sharkey, T.D. O 2 -Insensitive Photosynthesis in C 3 Plants. Plant Physiol. 1985, 78, 71–75. [Google Scholar] [CrossRef] [Green Version]
  33. Killi, D.; Bussotti, F.; Raschi, A.; Haworth, M. Adaptation to high temperature mitigates the impact of water deficit during combined heat and drought stress in C3 sunflower and C4 maize varieties with contrasting drought tolerance. Physiol. Plant. 2017, 159, 130–147. [Google Scholar] [CrossRef]
  34. Merchuk-Ovnat, L.; Fahima, T.; Krugman, T.; Saranga, Y. Ancestral QTL alleles from wild emmer wheat improve grain yield, biomass and photosynthesis across enviroinments in modern wheat. Plant Sci. 2016, 251, 23–34. [Google Scholar] [CrossRef] [PubMed]
  35. Fabre, D.; Yin, X.; Dingkuhn, M.; Clément-Vidal, A.; Roques, S.; Rouan, L.; Soutiras, A.; Luquet, D. Role of Triose Phosphate Utilization in photosynthetic response of rice to variable carbon dioxide levels and plant source-sink relations. bioRxiv 2019, 633016. [Google Scholar] [CrossRef]
  36. Darko, E.; Végh, B.; Khalil, R.; Marček, T.; Szalai, G.; Pál, M.; Janda, T. Metabolic responses of wheat seedlings to osmotic stress induced by various osmolytes under iso-osmotic conditions. PLoS ONE 2019, 14, e0226151. [Google Scholar] [CrossRef] [PubMed]
  37. Sharma, A.; Shahzad, B.; Kumar, V.; Kohli, S.K.; Sidhu, G.P.S.; Bali, A.S.; Handa, N.; Kapoor, D.; Bhardwaj, R.; Zheng, B. Phytohormones regulate accumulation of osmolytes under abiotic stress. Biomolecules 2019, 9. [Google Scholar] [CrossRef] [Green Version]
  38. Hatfield, J.L.; Dold, C. Water-use efficiency: Advances and challenges in a changing climate. Front. Plant Sci. 2019, 10, 103. [Google Scholar] [CrossRef] [Green Version]
  39. Mega, R.; Abe, F.; Kim, J.S.; Tsuboi, Y.; Tanaka, K.; Kobayashi, H.; Sakata, Y.; Hanada, K.; Tsujimoto, H.; Kikuchi, J.; et al. Tuning water-use efficiency and drought tolerance in wheat using abscisic acid receptors. Nat. Plants 2019, 5, 153–159. [Google Scholar] [CrossRef]
  40. Varela, M.C.; Arslan, I.; Reginato, M.A.; Cenzano, A.M.; Luna, M.V. Phenolic compounds as indicators of drought resistance in shrubs from Patagonian shrublands (Argentina). Plant Physiol. Biochem. 2016, 104, 81–91. [Google Scholar] [CrossRef]
  41. Ma, D.; Sun, D.; Wang, C.; Li, Y.; Guo, T. Expression of flavonoid biosynthesis genes and accumulation of flavonoid in wheat leaves in response to drought stress. Plant Physiol. Biochem. 2014, 80, 60–66. [Google Scholar] [CrossRef]
  42. Alscher, R.G.; Erturk, N.; Heath, L.S. Role of superoxide dismutases (SODs) in controlling oxidative stress in plants. J. Exp. Bot. 2002, 53, 1331–1341. [Google Scholar] [CrossRef]
  43. Michaletti, A.; Naghavi, M.R.; Toorchi, M.; Zolla, L.; Rinalducci, S. Metabolomics and proteomics reveal drought-stress responses of leaf tissues from spring-wheat. Sci. Rep. 2018, 8, 5710. [Google Scholar] [CrossRef] [Green Version]
  44. Das, A.; Rushton, P.; Rohila, J. Metabolomic Profiling of Soybeans (Glycine max L.) Reveals the Importance of sugar and nitrogen metabolism under drought and heat stress. Plants 2017, 6, 21. [Google Scholar] [CrossRef] [PubMed] [Green Version]
  45. Rébora, K.; Laloo, B.; Daignan-Fornier, B. Revisiting purine-histidine cross-pathway regulation in Saccharomyces cerevisiae: A central role for a small molecule. Genetics 2005, 170, 61–70. [Google Scholar] [CrossRef] [PubMed] [Green Version]
  46. Ohta, D.; Fujimori, K.; Mizutani, M.; Nakayama, Y.; Kunpaisal-Hashimoto, R.; Münzer, S.; Kozaki, A. Molecular cloning and characterization of ATP-phosphoribosyl transferase from Arabidopsis, a key enzyme in the histidine biosynthetic pathway. Plant Physiol. 2000, 122, 907–914. [Google Scholar] [CrossRef] [PubMed] [Green Version]
  47. Borrell, A.; Carbonell, L.; Farràs, R.; Puig-Parellada, P.; Tiburcio, A.F. Polyamines inhibit lipid peroxidation in senescing oat leaves. Physiol. Plant. 1997, 99, 385–390. [Google Scholar] [CrossRef]
  48. Gill, S.S.; Tuteja, N. Polyamines and abiotic stress tolerance in plants. Plant Signal. Behav. 2010, 5, 26–33. [Google Scholar] [CrossRef] [Green Version]
  49. Bouché, N.; Fromm, H. GABA in plants: Just a metabolite? Trends Plant Sci. 2004, 9, 110–115. [Google Scholar] [CrossRef]
  50. Song, H.; Xu, X.; Wang, H.; Wang, H.; Tao, Y. Exogenous γ -aminobutyric acid alleviates oxidative damage caused by aluminium and proton stresses on barley seedlings. J. Sci. Food Agric. 2010, 90, 1410–1416. [Google Scholar] [CrossRef]
  51. Watanabe, S.; Matsumoto, M.; Hakomori, Y.; Takagi, H.; Shimada, H.; Sakamoto, A. The purine metabolite allantoin enhances abiotic stress tolerance through synergistic activation of abscisic acid metabolism. Plant Cell Environ. 2014, 37, 1022–1036. [Google Scholar] [CrossRef] [Green Version]
  52. Takagi, H.; Ishiga, Y.; Watanabe, S.; Konishi, T.; Egusa, M.; Akiyoshi, N.; Matsuura, T.; Mori, I.C.; Hirayama, T.; Kaminaka, H.; et al. Allantoin, a stress-related purine metabolite, can activate jasmonate signaling in a MYC2-regulated and abscisic acid-dependent manner. J. Exp. Bot. 2016, 67, 2519–2532. [Google Scholar] [CrossRef]
  53. Bowne, J.B.; Erwin, T.A.; Juttner, J.; Schnurbusch, T.; Langridge, P.; Bacic, A.; Roessner, U. Drought responses of leaf tissues from wheat cultivars of differing drought tolerance at the metabolite level. Mol. Plant 2012, 5, 418–429. [Google Scholar] [CrossRef] [Green Version]
  54. Dubouzet, J.G.; Ishihara, A.; Matsuda, F.; Miyagawa, H.; Iwata, H.; Wakasa, K. Integrated metabolomic and transcriptomic analyses of high-tryptophan rice expressing a mutant anthranilate synthase alpha subunit. J. Exp. Bot. 2007, 58, 3309–3321. [Google Scholar] [CrossRef] [PubMed] [Green Version]
  55. Li, B.; Liu, D.; Li, Q.; Mao, X.; Li, A.; Wang, J.; Chang, X.; Jing, R. Overexpression of wheat gene TaMOR improves root system architecture and grain yield in Oryza sativa. J. Exp. Bot. 2016, 67, 4155–4167. [Google Scholar] [CrossRef] [PubMed] [Green Version]
  56. Blum, A. Drought resistance, water-use efficiency, and yield potential—Are they compatible, dissonant, or mutually exclusive? Aust. J. Agric. Res. 2005, 56, 1159–1168. [Google Scholar] [CrossRef]
Figure 1. Comparative analyses of relative water content (RWC) and photosynthetic parameters of three multiple synthetic derivative lines and their backcross parent, “Norin 61” (N61), under control and drought stress conditions: (A) RWC, (B) CO2 assimilation rate (A), (C) intercellular CO2 concentration (Ci), (D) maximum rubisco carboxylation rate (Vcmax), (E) electron transport rate (J), and (F) triose phosphate utilization (TPU). Data represent mean of three independent biological replicates at 400 µmol mol−1 CO2 concentration. Error bars represent standard deviation. Values marked with the same letter are not significantly different (p < 0.05) between genotypes and conditions according to Tukey’s HSD test.
Agronomy 10 01588 g001
Figure 2. Changes in the transpiration rate (E), stomatal conductance (gsw), and intrinsic water use efficiency (iWUE) of three multiple synthetic derivative lines (MSDLs) and their backcross parent, “Norin 61” (N61), under control and drought stress conditions: (A) E, (B) gsw, (C) iWUE. Data represent mean of three independent biological replicates at 400 µmol mol−1 CO2 concentration. Error bars represent standard deviation. Values marked with the same letter are not significantly different (p < 0.05) between genotypes and conditions according to the Tukey HSD test.
Agronomy 10 01588 g002
Figure 3. Principal component analysis (PCA) and accumulation of specific metabolites in the three multiple synthetic derivative lines (MSDLs) and their backcross parent, “Norin 61” (N61), under control and drought stress conditions. Dim1 and Dim2 refer to PC1 and PC2, respectively. (A) Loading plot of the metabolite variables showing increasing metabolite contributions from red to green. (B) Score plot showing conditional and genotypic separation due to differences in metabolite profiles. (C) Drought-specific and MSDL-specific metabolite accumulations. Values marked with the same letter are not significantly different (p < 0.05) between genotypes and conditions according to Tukey’s HSD test. (D) Clustered heatmap of metabolite levels in the MSDLs and N61 under control and drought conditions. The Z-score transformations of the mean metabolite concentrations were used to construct the heatmap. Accumulation rate: red, high; yellow, low; blue, very low. Data represent the mean ± standard deviation of three biological replicates.
Agronomy 10 01588 g003
Figure 4. Schematic diagram of a diversity breeding scheme showing wide hybridization, selection, and characterization for drought resistance in wheat (adapted from Tsujimoto et al. [18]). BC, backcross; WUE, water use efficiency.
Agronomy 10 01588 g004
Table 1. Pedigrees of the three multiple synthetic derivative lines (MSDLs) and their yield performance under control and drought stress conditions compared with their backcross parent, “Norin 61” (N61), and a Sudanese cultivar, “Imam”.
GenotypePedigreeOrigin of Ae. Tauschii AccessionGY_control (kg ha−1)GY_drought (kg ha−1)GY_DTE (%)
GreenhouseMNH5T. durum cv. Langdon × Ae. tauschii IG126387//N61Turkmenistan1646132480.43
N61 2785141750.88
FieldMSD345T. durum cv. Langdon × Ae. tauschii KU2829A//N61Georgia2031165681.53
MSD53T. durum cv. Langdon × Ae. tauschii KU2156//N61Iran5094337566.25
N61 2626137552.36
Imam 3594177549.38
GY, grain yield; GY_DTE, grain yield-based drought tolerance efficiency (GY_drought/GY_control × 100). Data were obtained from a post-anthesis drought stress field experiment in Wad Medani, Sudan, and from a greenhouse experiment in Tottori, Japan.
Table 2. Total phenolic content (TPC), Trolox-equivalent antioxidant capacity (TEAC), and superoxide dismutase (SOD) activity in the three multiple synthetic derivative lines (MSDLs) and their backcross parent, “Norin 61” (N61), under control and drought stress conditions.
Water Regime (E)Genotype (G)TPC (µg GAE mg−1 DW)TEAC (µg Trolox eq. mg−1 FW)SOD Activity (% Inhibition)
MNH510.58 ± 0.23b486.63 ± 1.30d46.84 ± 2.35x
ControlMSD3458.03 ± 1.14ab488.76 ± 1.85de38.89 ± 5.42x
MSD536.82 ± 2.67a488.51 ± 1.68de42.00 ± 4.38x
N6111.18 ± 1.40b488.38 ± 3.57d46.58 ± 2.78x
MNH510.97 ± 0.04b494.80 ± 0.99f72.34 ± 0.85y
DroughtMSD34510.04 ± 0.38ab495.61 ± 1.92f71.04 ± 4.2y
MSD5310.65 ± 0.28b493.86 ± 2.05ef75.72 ± 0.69y
N6110.50 ± 0.17b487.12 ± 0.56d48.25 ± 5.52x
G<0.05<0.05<0.01
p-value*E<0.05<0.01<0.01
G×E<0.05<0.01<0.01
GAE mg−1 DW, gallic acid equivalent; * Statistical significance for genotype (G), water regime (E), and their interaction (G × E). Within each column, values followed by the same letter were not significantly different (p < 0.05) according to Tukey’s honestly significant difference (HSD) test.
Publisher’s Note: MDPI stays neutral with regard to jurisdictional claims in published maps and institutional affiliations.

