Article

Farmers’ Attitudes towards Risk—An Empirical Study from Poland

1
Institute of Economics and Finances, Warsaw University of Life Sciences—SGGW, 02-787 Warsaw, Poland
2
Agricultural Institute, Warsaw University of Life Sciences—SGGW, 02-787 Warsaw, Poland
*
Author to whom correspondence should be addressed.
Agronomy 2020, 10(10), 1555; https://doi.org/10.3390/agronomy10101555
Submission received: 25 August 2020 / Revised: 2 October 2020 / Accepted: 6 October 2020 / Published: 13 October 2020
(This article belongs to the Special Issue Farmers’ Adoption of Agricultural Innovations and Their Impact)

Abstract

:
Risk aversion is an important research area in the field of agricultural economics in the last years. Creating effective and efficient risk management tools in an increasingly volatile economic and natural environment requires proper recognition of farmers’ behavior and attitudes towards risk. In this context, the main aim of the paper was to estimate farmers’ attitudes towards risk and identification of farm’s and farmer’s characteristics in dependency on risk aversion level. The assessment of farmers’ preferences towards risk was based on hypothetical games in a representative sample of 600 Polish farms—participants of Farm Accountancy Data Network (FADN). Based on the interviews with farmers, a relative risk aversion coefficient has been estimated. Results revealed that on average Polish farmers have quite a strong risk aversion. Their attitudes towards risk are strongly linked with their self-assessment regarding their way of making decisions under risk. Some relations between farmers’ risk aversion and perception of selected risk factors could also be observed. The results revealed that the application of specified risk management tools by farmers and their potential reaction to a significant income drop are related to risk aversion level.

1. Introduction

The problem of risk aversion has been one of the critical research areas in the field of agricultural economics in the last years [1,2]. Recognition of risk perception and farmers’ response to risk is a crucial factor in understanding their decisions in uncertain situations [3,4]. As emphasized by many researchers [5,6,7], knowledge of farmers’ preferences towards risk is essential for farmers themselves, for advisory services, industry (providing production and food processing agents), and policymakers. By knowing their own risk preferences, farmers can better manage their farms. The policymakers can pursue an agricultural policy that increases the efficiency of the sector through better spending of public funds. For the industry providing production resources (fertilizers, plant protection chemicals, machinery, financial services), being aware of farmers’ risk attitudes can allow them to offer innovative products and services better suited to the needs of farmers. The processing industry can better anticipate fluctuations in the supply of agricultural raw materials.
As Kumbhakar [8] noticed, producers’ attitudes toward risk are substantial in input allocation decisions. Hence, it is desirable to consider a model that includes not only production risk but also producers’ attitudes towards risk. Consequently, all components of technology are also affected by the presence of risk. Many years ago, Feder [9] emphasized that risk-averse farmers were using a lower amount of inputs than optimal, which could lead to decreasing potential of the farm’s efficiency. Ullah et al. [4] point out that “farmers’ risk attitude and risk perceptions are crucial factors that affect their farm production, investment and management decisions.” Understanding the mechanisms of making production decisions by farmers under uncertainty has become more and more substantial due to the declining stability of production and economic conditions in agriculture in recent years. It results from increasing climate change [10,11,12], progressive liberalization of the conditions of international trade in agricultural products [13,14], as well as changes in agricultural policy [15,16,17]. The growing instability of farming conditions in agriculture, manifested by increasing volatility of crops, prices and agricultural income, poses a long-term threat to the stability of the entire agricultural sector and food supply. It prompts policymakers to seek and offer farmers adequate mechanisms by supporting risk management in the current situation [7,15,16,18,19,20,21,22]. Identifying farmers’ preferences towards risk can be considered an essential element in creating effective and efficient risk management mechanisms [23]. In recent years, there have been many studies on risk aversion and the factors shaping it. As emphasized by Iyer [7] (pp.12) after a detailed review of literature on this subject, “to date this (…) topic remains under-investigated although the developments in other methodological approaches seem to help addressing this research question.” Moreover, Picazo-Tadeao and Wall [24] emphasize that research on the factors shaping risk aversion nowadays focuses mainly on developing countries, and relatively few analyses concerned European countries. The issue of risk management has been an area of particular interest in the Common Agricultural Policy for several years [19,25,26,27]. However, the latest Common Agricultural Policy (CAP) reforms and the growing instability due to climate changes justify updating previous studies.
This issue is particularly important in countries where the problem of risk has been rarely studied so far, and the knowledge of management methods among farmers is relatively low. One of such countries is Poland, which is also one of the largest EU food producers [28] and a significant beneficiary of the EU agricultural budget [29]. Contrary to many other large European and non-European food producers [20,21,30], experience in providing Polish farmers with system solutions in the field of risk management is relatively small [31,32]. The basic mechanism supporting risk management in agriculture is the Crop and Farm Animal Insurance Act of 7 July 2005 with subsequent amendments [33], introducing financial support for insurance premiums. Despite multiple amendments, the Act did not meet the expectations as the farmers complained about too high premiums prices [34], while insurance companies still reported losses [32,35]. Insurances, in the case of agricultural production, still play a relatively small role in effective risk management as less than 10% of farmers are buying corp insurances [32,34]. The Ministry of Agriculture is still looking for a way to build an effective and efficient risk management support system in agriculture [36]. At the same time, unlike many other countries, Poland did not take advantage of the possibility of implementing the Income Stabilization Tool [19] under the Rural Development Programme (RDP) 2014–2020 [37], allowing allocation of CAP funds to the development of modern risk management tools such as mutual funds [38,39]. As a result, Polish farmers have at their disposal an ineffective system of subsidized agricultural insurance [32,35] or can undertake individual initiatives at the farm level. The second, however, requires an active approach and appropriate knowledge and skills, while the available research indicates that farmers adopt relatively passive attitudes towards risk management [40].
Relatively little is also known about the attitudes of Polish farmers towards risk, especially in the context of the changing conditions of farming in recent years. However, the design of an effective risk management system should be based, among other things, on the right diagnosis of the attitudes of farmers [41]. In this context, the article aims to estimate risk aversion of farmers and compare the estimates with the characteristics of farms and the opinions of farmers. The research covered a representative sample of 600 farms participating in the FADN (Farm Accountancy Data Network) system. The farmer’s attitude to risk was estimated using a hypothetical lottery approach [42]. The level of risk aversion was then compared with farm characteristics, farmers’ self-assessment, their perception of risk factors, and applied risk management practices. The remainder of the paper is organized as follows. In Section 2, we present the theoretical framework and literature review on risk aversion measurement and farmers’ attitudes towards risk. Section 3 explains our methods and empirical strategy. Section 4 describes the obtained results, and finally, Section 5 includes discussion and conclusions.

2. Farmers’ Risk Preferences—Theoretical Framework and Empirical Approaches

2.1. Risk Aversion and Methods of Eliciting Risk Preferences

Recognizing the available options and selecting the appropriate method to elicit risk aversion is a crucial step for researchers investigating decision-making processes under uncertainty. Risk aversion means an attitude of reluctance to take risky decisions, which, however, cannot be avoided in any economic activity, including agriculture. The issue of farmers’ choices under risk has been a subject of interest of agricultural economics from years [43]. Risk in agriculture is usually defined in the category of the distribution of outcomes (variance, standard deviation). In a more general approach, measures of dispersion are linked to an expected value, and risk can be reflected in the coefficient of variation [44]. Probabilities applied in risk analysis can be elicited based on the objective or subjective perspective [45,46]. However, risk measures based only on probability distribution and the expected value of outcomes do not fully reflect the approach of decision-makers representing different attitudes towards risk. The risk aversion might be considered in absolute and relative terms. The most straightforward measure of absolute risk aversion is expressed by the function named Arrow-Prat risk aversion coefficient and described by the formula (Equation (1)) [47,48,49]:
R a =   U ( X ) U ( X )
where U(X)’ represent the first and U(X)’’ the second derivative of the utility function U(X). It is necessary to remember that absolute risk aversion is not a simple indicator but a function reflecting the impact of changes in wealth on risk aversion. It is expressed in monetary units, which can be a source of difficulties during farms comparisons. Hardaker [49] indicates that a better measure of risk aversion may be “relative risk aversion coefficient,” which can be calculated according to the formula (Equation (2)):
R r =   R a X
where Ra is Arrow-Pratt absolute risk aversion coefficient, and X is an argument of the utility function (e.g., the value of agricultural production).
According to Hardaker [49], the relative risk aversion coefficient is a pure number that can be used even in an international comparison of risk aversion. What is more, some authors concluded that R r is much more constant than R a as wealth changes [48,49,50,51]. Anderson and Dillon [43] suggested assigning levels of relative risk aversion coefficient R r in dependence on generally observed farmers’ risk aversion (very low or no risk aversion R r = 0.5; average (normal) risk aversion R r = 1; rather clear risk aversion R r = 2; strong risk aversion R r = 3; very strong risk (extremely) aversion R r = 4).
Charness et al. [52] (pp. 43) emphasize that “assessing and measuring the risk preferences of individuals is critical for economic analysis and policy prescriptions.” Science has developed an intuitively understandable theoretical model presenting the significance and place of risk aversion in the decision-making process. In practice, so far, no fully effective tools (methods) for eliciting and assessing decision makers’ risk aversion have been acquired.
Methods of eliciting individual risk preferences can be divided into two primary groups [7], i.e.,:
  • based on observed economic behaviour from secondary data, including econometric and mathematical methods. The underlying assumption of these methods is to estimate risk preferences based on “observed behaviour of agricultural producers with respect to input and output choices to behaviour predicted by theoretical models incorporating risk and risk preferences” Iyer et al. [7] (pp.6). Examples of such an approach to determine risk aversion can be found in numerous studies [53,54,55,56,57,58],
  • based on elicited preferences from primary data, including multi-item scales and lottery-choices tasks. The methods based on multi-item scales specify the attitude towards risk by obtaining an answer to a series of multi-item and scale-based questions. This type of research takes the form of various types of surveys and questionnaires. It is aimed at identifying actual decisions (preferences) and actions taken by decision-makers [59,60] and presented by many researchers [3,38,61,62,63,64].
As an alternative approach to the assessment of risk preferences based on primary data, experiments in which decision-makers select one option among the available hypothetical alternatives or lotteries have been used [52,65,66,67,68,69,70,71]. Such an approach allows to determine the type of utility function, and thus, allows for the estimation of risk aversion [72]. Such an approach usually seeks the point where the decision maker is indifferent between the guaranteed amount (lower than the expected value) and taking a risky game to gain more than the guaranteed amount [73]. Holt and Laury [71] drew attention to the issue of differences between risk aversion in the case of large and small payouts, stating that the differentiation of decisions at small potential payouts is more remarkable than with the big ones, although the “average decision” does not change.
In this study, we attempted to assess farmers risk attitudes elicited from hypothetical lotteries in the context of socioeconomic characteristics of farm and farmers.

2.2. Farmers Risk Aversion

The theme of risk aversion was also taken up in many economic and agricultural studies, and is associated with a particular role of risk in agriculture [74]. Most of the analyses carried out concerning farmers showed that they are usually characterized by an attitude of high risk aversion [4,7,31,61,71,75,76,77]. Some studies indicate a decreasing absolute risk aversion, which means that farmers are willing to risk a higher value of their property as wealth increases [78,79]. However, the issue of the nature of risk aversion is not unequivocally settled [80]. Some authors question the correctness of research on the nature of risk aversion, emphasizing that most analyses focused on the “optimal value function” rather than the actual parameters of the utility function [1].
Moreover, some studies have shown that decision-makers may be characterized by both risk aversion and risk-seeking concerning various spheres of activity, suggesting that the attitude towards risk may result from the context in which the decision-maker is found [81]. One of the areas of empirical research on risk aversion is the search for relationships between attitudes towards risk, such as the level of education or wealth [82], as well as various parameters of farm and farmer characteristics [4,31,61,83,84]. As emphasized by Picazo-Tadeao and Wall [24], research on the relationship between various factors of the socioeconomic characteristics of farmers and farms and preferences focuses mainly on developing countries [85,86,87,88]; a more extensive review of such studies can be found, for example, in the study by Ullah et al. [4]. Less frequently, this issue is raised concerning agriculture in highly developed countries, including European ones, where studies focus more on the farmers’ risk preferences study itself, using various methodological approaches. A comprehensive review of studies on framers risk preferences can be found in the study by Iyer et al. [7]. However, also in these geographical areas, one can find studies addressing the issue of the relationship between risk preferences and the socioeconomic characteristics of farms [24,31,61,83,84,89,90,91]. Authors studying the phenomenon of risk aversion among farmers indicated its relationship with socio-demographic characteristics of farmers, such as age of farmer, level of education, experience in running a farm or after heir sitting, and farm features such as farm size, income, non-farm income or technological character [4,8,24,31,84,92,93]. From an economic point of view, a particularly interesting issue is the impact of the level of risk aversion on the level of production indicators of a farm and, consequently, on the aggregate food supply. Concerning the agricultural sector, an attempt to analyze the impact of farmers’ attitudes towards risk on the formation of aggregate supply was undertaken in the 1990s by Chavas and Holt and Moschini [94,95]. Earlier, Sandmo [96] based on measures of risk aversion proposed by Arrow, argued that the greater the level of risk aversion displayed by producers, the lower their propensity to increase production. In this context, Hennessy [97] noted that supporting agriculture (through direct payments) favors increasing production by individual farmers and, consequently, increasing the supply of agricultural products. According to the mentioned author, payments to farmers increase the level of their wealth, which, assuming a decreasing absolute risk aversion, means that a wealthier farmer is willing to risk more, and this translates into an increase in production (and consequently an increase in food supply).

3. Materials and Methods

3.1. Case Study Area—Background Information on Polish Agriculture

Poland is the seventh-largest agricultural producer in the European Union [28] (Figure 1). Polish farms constitute 1/8 of all farms in the European Union and therefore have a significant impact on the European market of agricultural products, as well as on the natural environment [98].
Family farms with a small area dominate in Poland. The average size of a farm in Poland is 10.3 ha [99]. The largest share (31.5%) of farms are those with an area of 2 to 5 ha and 73.5% of farms are between 1 and 10 ha. However, due to the strong polarization of farm structure in Poland [100], commercial farms have a prevalent share regarding the agricultural area, the number of livestock and the value of production.
Farms are most often passed down from generation to generation. According to the Central Statistical Office [99], about 45% of farm owners have agricultural education, but only 3% have higher education, and 17% are people who completed agricultural training.
In Poland, mixed production farms predominate (44%), and almost a quarter of farms specialize in field crops. The third place is occupied by dairy farms (15%). The remaining categories of farms do not constitute more than 5%.
Polish farmers struggle with many risk factors. Research to date by various authors [31,37,64,101] shows that the most substantial risk factor is drought and, to a lesser extent, other atmospheric factors such as frost or hail. Due to the high frequency of occurrence of drought, in contrast to other natural factors, drought remains practically uninsurable in Poland [102]. The reports of IUNG (Institute of Soil Science and Plant Cultivation) [103] also indicate the objective importance of drought in Poland. Other risk factors indicated by Polish farmers include animal disease, price volatility, marketing difficulties, prices of inputs, political measures and technological processes [31,64,104].

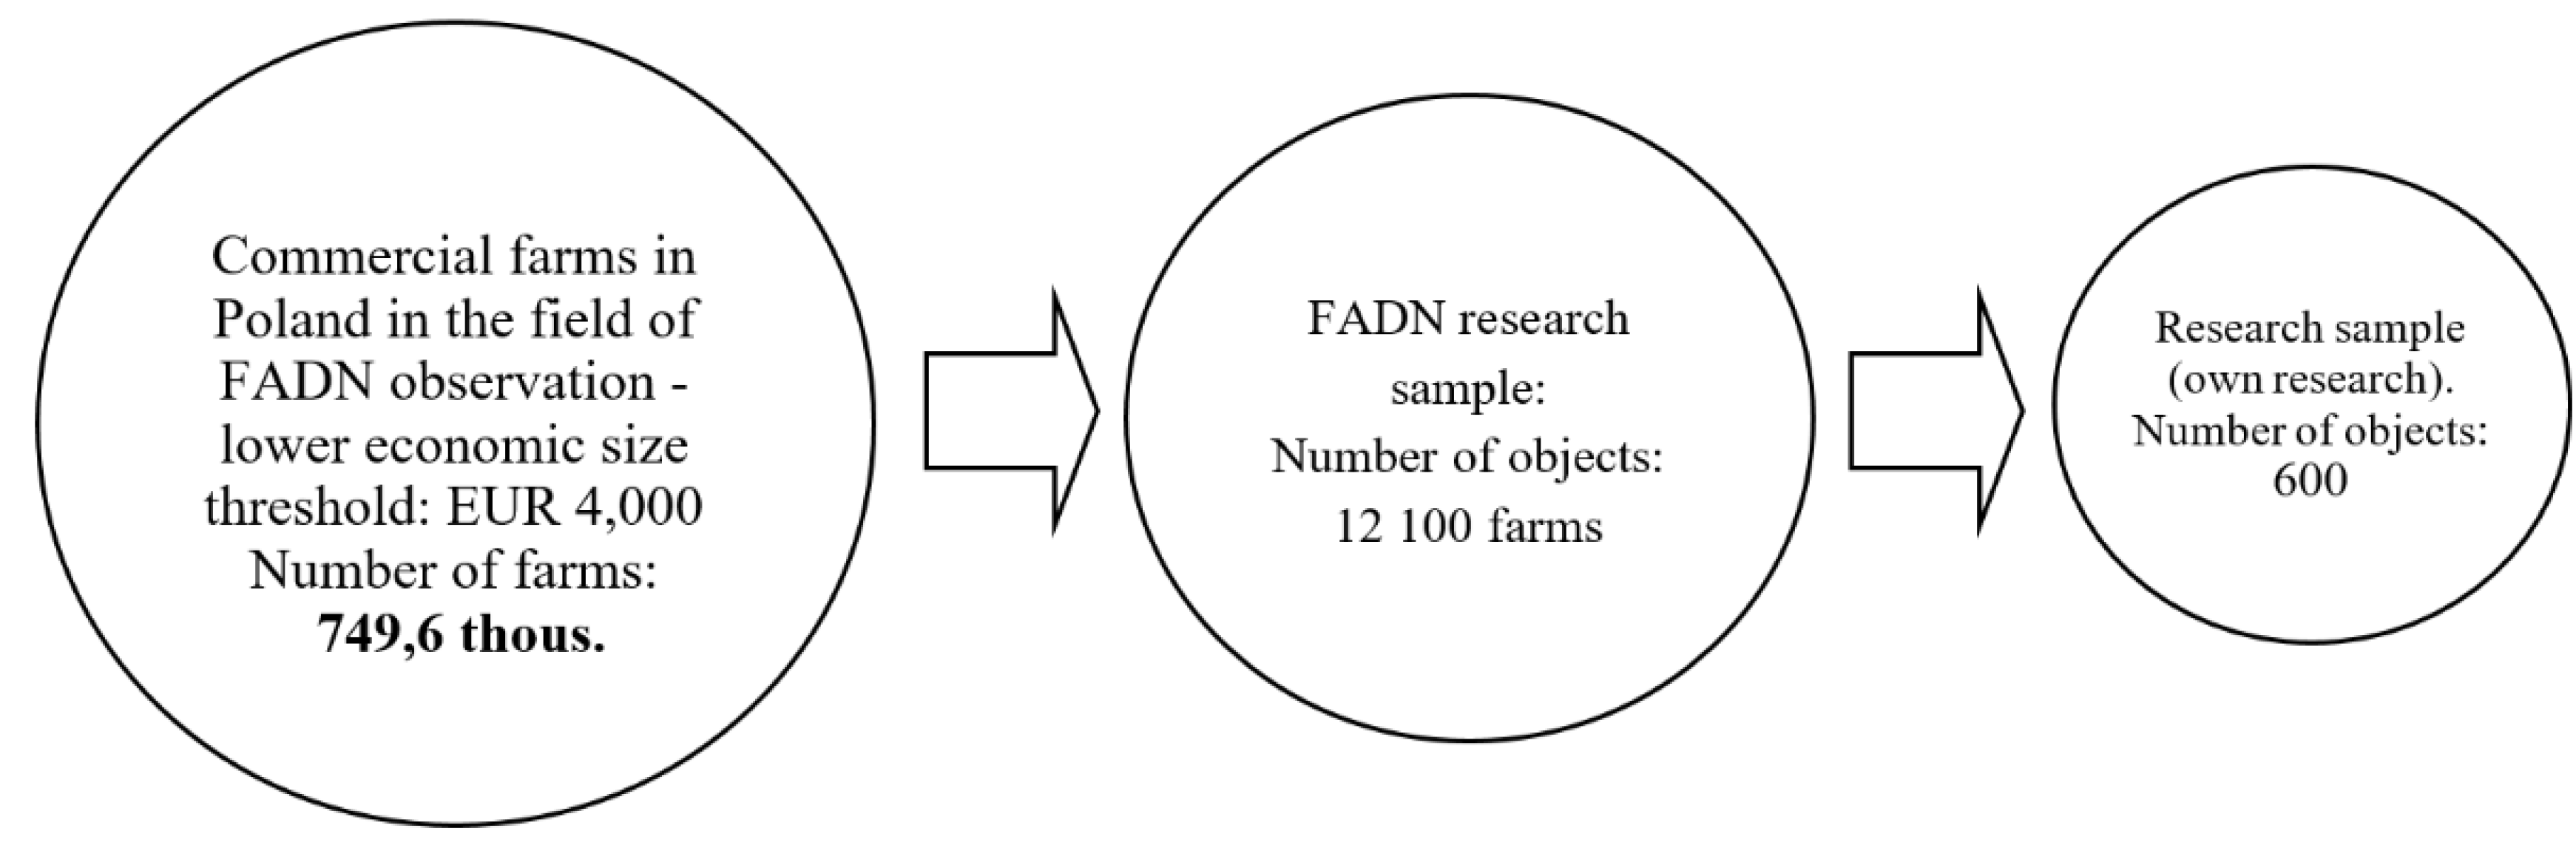
3.2. Data Collection

The study covered the population of farms in the field of observation of the FADN [105] system. This system covers farms with a standard output of more than four thousand Euro. The farms included in the FADN database are representative of the most significant farms in terms of area and production. Farms represented in FADN produce 93% of the total agricultural production in Poland, occupy an area of 85% of the agricultural land, almost 97% of livestock and about 2/3 of the employed people work on farms covered by FADN (Table 1).
The farm sample providing data to the FADN in Poland includes 12 thousand farms. The research covered a sample of 600 FADN farms in which an additional survey was carried out. Farms selected for survey covered about 5% of the FADN sample. The number of surveyed farms was determined, taking into account a compromise between the possible precision of the analysis and the inputs necessary to conduct a reliable survey throughout the country. The general principle of the construction of the test sample is shown in Figure 2.
The sample of 600 surveyed farms was selected using the stratified random selection procedure, which included:
  • 4 layers due to the specialization criterion,
  • 3 layers due to the economic size criterion measured by the standard output (below 25, between 25 and 100, and above 100 thousand EUR),
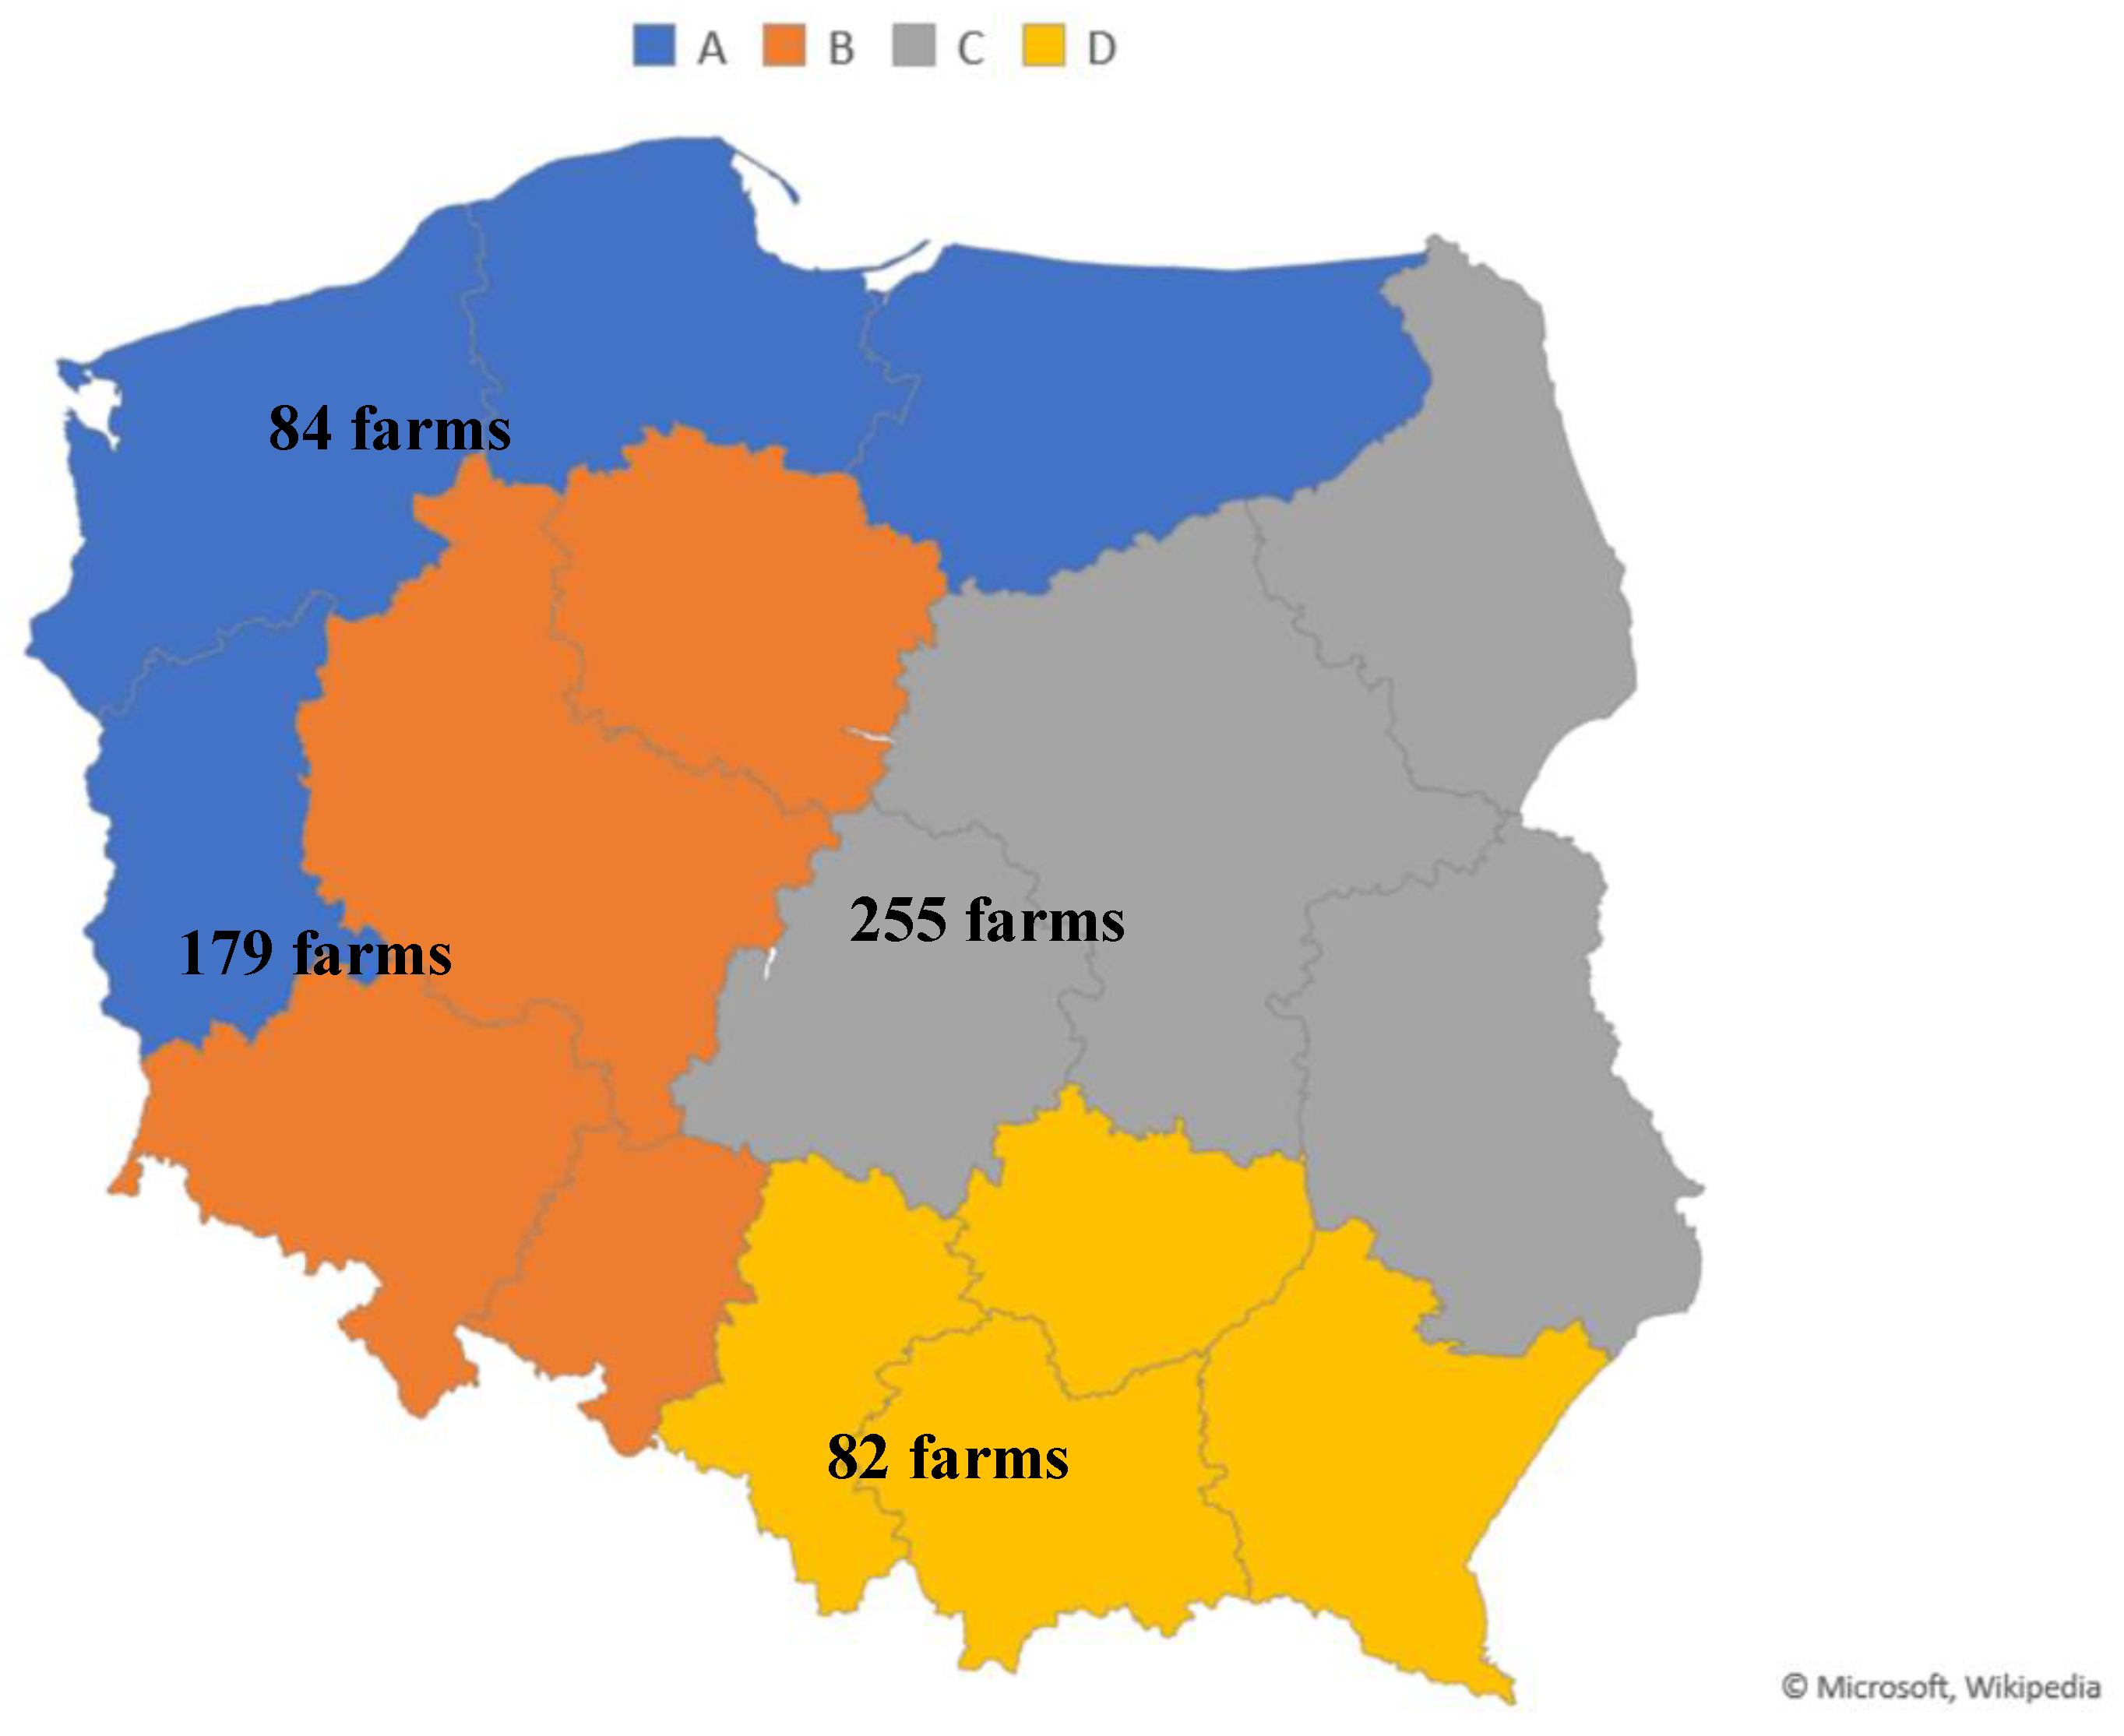
  • 4 layers due to the localization within the FADN regions (see Figure 3).
Strata of farms distinguished based on the typology used to select the FADN sample [106] (pp.15), due to the specialization criterion, included the following production types:
  • crop production farms—this includes farms specializing in field crops (TF1), horticultural crops (TF2), permanent crops (TF4);
  • cattle farms—this includes farms specializing in rearing dairy cows (TF5) and herbivorous animals (TF6);
  • pig farms—this includes units specializing in rearing animals fed with concentrated feed (mainly pigs TF 71 and poultry TF 72);
  • mixed farms—this includes mixed farms (TF8).
The number of researched farms in each stratum was determined using the Neyman method [107,108] in a manner analogous to the method used to determine the size of the FADN sample (Equation (3)):
n h   =   n   N h σ h k = 1 L N k σ k
where: nh—sample size in stratum h,
n—sample size,
Nh—population size in stratum h,
σh—standard deviation of standard output in the h stratum,
L—number of strata.
In each of the distinguished stratum, the number of farms to be surveyed was calculated with Neyman’s method (Equation (3)), and then randomly selected from all FADN farms belonging to this stratum. In case the farmer, due to any reason, refused to take part in the survey, another farm from the selected stratum was drawn. Due to the applied methodology of selecting farms, the sample structure corresponded to the structure of the entire FADN population. The distribution of the studied sample in terms of the criterion of economic size groups and groups separated by type of production is presented in Table 2.
To fulfil regulations on the protection of the identity of farmers participating in the FADN system, the agricultural extension officers, who regularly collect FADN data, performed the interview. The completed questionnaires were anonymized and passed on to the national FADN office, where answers were joined to the accountancy records of surveyed farmers.
Regarding the economic size, the surveyed population was dominated by farms with an economic size in the range from 25 to 100 thousand EUR and the smallest farms with standard production up to 25 thousand EUR. The smallest group was the largest farm, which reflects the structure of farms in Poland. In terms of the criterion of the type of farming, the most numerous group were crop farms and mixed farms, and the least numerous were farms of the granivores.

3.3. Methods

The conducted analysis covers two stages: the first is the assessment of farmers’ preferences towards risk carried out with the use of hypothetical games, while the second part covers the analysis of selected farm and farmer characteristics depending on the level of risk aversion identified in the first part.
The basis of the developed set of questions was the literature on the subject concerning the empirical research of risk in agriculture, including in particular such studies as Meuwissen et al. [64], Handschke et al. [104] and Berg et al. [26]. The questionnaire was designed to assess farmers’ perception of risk factors, used risk management tools and hypothetical games to estimate their aversion to risk. After designing the initial version of the questionnaire, a pilot study was carried out, including the preparation of several dozen sample questionnaires, which enabled the introduction of the necessary corrections to the original version of the interview questionnaire and the development of the final version of the questionnaire, which was handed over to interviewers for field research. The risk-ratio assessment was carried out based on hypothetical lotteries. Two variants were adopted: the small wins variant and the big wins variant [68]. The approach proposed by Eckel and Grossman [42] was used to estimate the level of risk aversion in the variant with small wins. To assess the risk aversion coefficient in the case of large wins, the proposed by Dohmen et al. [109] simplified hypothetical investment problem. In both cases, the size of the winnings was modified to some extent, adjusting them to the Polish realities.
During the interview, farmers were presented with two hypothetical situations. In the first one, they were offered participation in a hypothetical game of tossing a fair coin, in which participation requires an initial fee of 2000 PLN (~540 USD), which was about the minimal monthly salary in Poland at the moment of surveying farmers. The respondents were to indicate the most preferred variant of the game. The least risky game was the payment of the risked amount regardless of the outcome of the coin toss (the farmer gained nothing and lost nothing). In the extreme case, it was possible to gain an additional PLN 3100 (~840 USD) or lose PLN 1700 (~460 USD). In the second situation, farmers were asked to indicate what part of the lottery winnings of 1 mln PLN, which is equal to the mainprize of the most popular state lottery (~270 thousand USD), and corresponds to the value of an average commercial farm, they would be willing to invest in a project in which they could double the amount invested or lose half of the funds. It was tested with two different probabilities of investment success (variant 50/50 and 80/20). The purpose of examining these two situations with diametrically different levels of possible gains and losses was to identify farmers’ attitude to risk with a relatively low and high level of losses. The analysis of hypothetical lotteries resulted in assigning individual farmers to one of the three levels of risk aversion, i.e., low, medium and high. The group of low-risk aversion consisted of farmers presenting a risky attitude, at least in one of the games and not indicating strong risk aversion in any of the games. The high-risk aversion group consisted of farmers who strongly avoided risk in all game variants. Other cases were classified to the medium-risk aversion group. The remaining part of the article describes the characteristics of farms with different levels of risk aversion of their owners.

4. Results

4.1. Farmers’ Risk Aversion and Farms’ Economic Size and Production Type

In the first stage, farmers were divided into three groups regarding their risk aversion coefficient calculated based on the results of the hypothetical game from the survey. The low-risk aversion group had an average relative risk aversion coefficient of (Rr) 0.04, medium of 0.87 and high of 1.44.
In general, it might be concluded that farmers are relatively risk-averse; however, some differences between farm types and economic size could be noticed. The results of the risk aversion assessment for the analyzed farm population are presented in Table 3.
Overall, slightly more than half of the surveyed farmers were classified as a medium risk level. On average, an almost identical percentage of farmers were classified as having low- and high-risk aversion. The smallest number of risky farmers was in a group of mixed farms. At the same time, in this group there was the highest percentage of farms with high-risk aversion. It can be observed that a slightly higher percentage of farmers with low-risk aversion were recorded in the group of the largest farms and cattle type.

4.2. Farmers’ Risk Aversion and Their Attitudes Toward Specified Risky Situations

To determine the consistency of farmers’ attitudes determined based on hypothetical lotteries, they were compared with the declared farmers’ statements concerning selected decisions in the farm operation. Table 4 shows the distribution of farmers’ responses to selected statements reflecting the self-assessment of the respondents.
This comparison shows that in the group of farmers with high-risk aversion, the percentage of farmers identifying with the statement “I sometimes make risky decisions on a farm” is lower than in the other groups (23.1% against 46.4% in the group with low aversion). At the same time, in the group with high-risk aversion, the share of radicals who do not agree with this statement is higher than in the group with low-risk aversion (55.9% compared to 36.2%). The obtained distribution of responses indicates that farmers with high-risk aversion avoid making risky decisions. The differences were statistically significant at 0.05.
Another aspect of the analysis concerned the propensity to take out loans, which can be treated as a symptom of the attitude towards risk. The conducted research shows that in the group with high-risk aversion there were more such farmers (almost 62.9%) avoiding taking loans than in the group with low-risk aversion (48.6%). This difference was also significant at level 0.05.
One of the manifestations of risk acceptance is the tendency to implement new, innovative solutions. Such situations are usually associated with high uncertainty as to the possible effects of the introduced solutions. Hence it can be expected that people with a high level of risk aversion may be more reluctant to introduce changes, e.g., applying innovative technologies. The results generally confirm this assumption, as a higher percentage of farmers likely to adopt new solutions was observed in the group with low-risk aversion (73.2%) than in the group with high risk aversion (62.9%). This difference was also statistically significant at 0.05. It should be emphasized that the number of farmers willing to implement new technologies was relatively high in all groups. Probably this results from the fact that Polish agriculture is continuously undergoing a process of transformation, hence the contact with new solutions for many farmers is quite common.
Diversification is one of the primary risk reduction strategies. Concerning the farm operation, it means the production of various categories of agricultural products, which, in the event of poor production conditions or low prices for one product, leaves a chance for positive economic results. Diversification reduces the overall risk of a farm, but requires skills and equipment for different types of production, increasing the total operating costs. However, the condition for the effectiveness of such a strategy is a low (or even negative) correlation between yields and prices for different products, which is often difficult to achieve in agriculture. In the surveyed group of farmers, over 1/3 of the respondents were willing to accept narrow specialization, and the percentage of such people was higher in the group with low risk aversion: 41.3% compared to 29.4% in the group with high-risk aversion; however, this difference was not significant at 0.05.

4.3. Farmers’ Risk Aversion and Perception of Production Risk Factors

It can be assumed that farmers with a high-risk aversion assess individual risk factors as more often and more threatening to the farm than farmers with low-risk aversion. Table 5 shows the percentage of farmers who perceived the indicated phenomena as frequent and highly threatening to the farm. The study focuses on climate risk factors, which in the context of increasing climate change constitute the main challenge for risk management in Polish agriculture because the frequency of losses caused is already significant and will probably increase. Considered factors are listed in the Crop and Farm Animal Insurance Act [33], thus are substantial for the functioning of the current support system insurance. Those factors constitute an area of particular interest for public authorities, as opposed to other categories of risk factors that can be limited by the market (e.g., price risk) or other insurance systems (e.g., national social security farmers scheme).
The comparison shows that farmers with high-risk aversion slightly more often than others indicated the occurrence of such threats as drought, frosts, hail and poor overwintering. However, differences regarding the drought and frosts were significant at 0.05. On average, in the entire population, the factor indicated as the most common was a drought (on average, frequent occurrence was indicated by over 80% of respondents, and pests and diseases of plants and animals came second (61.3% of respondents)). The least frequent was a storm (4.1% of respondents). Farmers with lower risk aversion perceived droughts as less frequent and less threatening for their activities. A similar pattern could also be observed in the case of spring frosts and winter damages.

4.4. Farmers’ Risk Aversion and Preferred Risk Management Tools

In the context of the high level of threats perceived by farmers related to the presence of various risk factors, the critical challenge is the skillful use of adequate strategies and risk management tools. The first step in this process is to build farmers’ awareness of possible actions to counteract the risk. Table 6 contains information on the percentage of farmers noticing the usefulness of the risk management methods mentioned above, depending on the level of risk aversion.
In general, relatively small and statistically insignificant differences were observed in this case. The highest percentage of people positively responded to activities such as improving qualifications (84% of respondents), making contracts with product recipients (66.2%), cooperation with other farmers (65.5%), technology improvements to reduce the effects of risk (64.5%) and plant insurance (68%). The farmers noticed the least usefulness in undertaking non-agricultural farming skills (28.7% of respondents). However, only differences in the case of cooperation between farmers were statistically significant at 0.1.
Although farmers’ declarations regarding the assessment of the usefulness of various strategies or risk management methods may constitute a source of information about their actual needs or preferences regarding the choice of particular tools in the future, it is worth supplementing this knowledge with an analysis of activities undertaken in the past. The results in Table 7 show the share of farms where selected risk management methods were implemented in the last five years.
It is visible that the share of farmers undertaking actions is smaller than the share of farmers who indicated the usefulness of various risk management methods. On average, the most frequently implemented measure to reduce the risk in the surveyed farms was improvements in plant protection methods (this was indicated by almost 70% of the respondents). On average, there were more such farmers in the high-risk aversion group, which may suggest that fear of risk prompts them to introduce changes, which may also be associated with additional uncertainty. However, the results are not unequivocal. The crop irrigation was more often implemented on farms of farmers with low-risk aversion, as it is a relatively large investment which generates additional financial risk and is more challenging to implement than changes to the crop protection technology. Some of the measures under consideration were, on average, more often implemented by farmers with average risk aversion (e.g., installations protecting perennial plantations), which, however, should probably be associated with the production structure. Moreover, most of the differences were statistically insignificant, which did not allow for a clear statement that the differences in attitudes towards risk translate into the observed actions.
Looking for the relationship between farmers’ attitude towards risk and their behavior, we additionally attempted to identify possible actions of farmers in the event of a significant deterioration of financial results. Table 8 presents the share of farmers who, in response to a hypothetical drop in income by over 20%, declared that they would take the selected adjustment measures.
These activities are not specific risk management tools but indicate the general direction of possible adjustments at the farm level. On average, the most common answer was cutting down investment expenditures (66.7% of respondents). Limiting capital expenditure in a crisis can be considered a reasonably natural action, as it enables the transfer of funds to cover current liabilities, which improves the current financial liquidity and reduces the risk of a more severe financial outbreak. The highest share of reduction of investments was observed in the group with high-risk aversion. It can also be observed that farmers with a low aversion to risk were most inclined to increase the size of their activities to compensate for the decline in income. In both cases, the differences were statistically significant at 0.05.
The second choice was changing the production structure (56.8% of respondents), which should be considered a reasonably understandable choice, provided that such a shift would be preceded by a proper market analysis. Regarding the frequency of indications of this solution, there are quite clear differences between individual groups of farms (significant at 0.1). Farmers with low-risk aversion seemed more likely to take more radical actions such as abandoning farming, which confirms their lower fear of the “unknown.”

5. Discussion and Conclusions

The results of analyses showed that most farmers exhibit at least a medium or high level of risk aversion. This is consistent with many other research results which indicated that farmers, as a rule, show risk aversion, although not necessarily too strongly [20,31,61,110]. Farmers characterized by low-risk aversion were more likely to belong to the group of the largest farms, i.e., with standard production above EUR 100,000. That was already noticed many years ago by Sandmo [96], and it is still consistent with other studies [9,30,31,111]. Our analyses also show that among all the identified groups of farmers with high-risk aversion, the highest percentage was recorded in the mixed farms, which can also be considered as expected—a high level of risk aversion prompts the diversification of activities. This is one of the typical risk management strategies, which is explained in detail by Markovitz’s portfolio (concerning financial assets) [112]. Similarly, in agriculture, carrying out various activities reduces the risk. Hence farmers with a greater aversion to risk more often choose diversified activities. More specialized activities require a higher degree of risk acceptance [30], hence in specialized farms, a higher percentage of farmers with low-risk aversion can be observed. Most are in cattle, where the production cycle is long and the most complicated.
The classification of farmers to three levels of risk aversion, carried out in our study, was confronted with a survey of opinions indicating the actual behavior of farmers. This study shows that the actual behavior of farmers, declared during the interviews, in many cases indicates that the results are consistent. It was found among others that farmers who declared frequent risky decisions more often also belonged to the group with low-risk aversion. Similarly, farmers who declared greater fear of taking loans also mostly belonged to the group with high-risk aversion. Similar relationships also occurred in the case of other activities illustrating the attitude towards risk, which indicates that the results obtained are consistent with the hypothetical lottery method and the method of direct behavior and attitude research. However, these issues in the subject literature are not unequivocally resolved [113]. For example, Dohmen et al. [114] indicated that the results obtained with different methods (for the non-agricultural population) were consistent.
Similarly, Pennings and Garcia [72] pointed to the convergence of different results. In contrast, Bard and Barry [5] and Fausti and Gillespie [115] emphasized the discrepancies between the assessment of risk aversion obtained by various methods. In turn, Meuwissen et al. [61] showed that risk aversion assessed based on contextualized business questions specific to farming was correlated with risk management choices. The results showed that farmers who differ in their risk aversion perceive individual risk factors in a slightly different way, which suggests differences in the perception of risk depending on their attitude (aversion), e.g., frequency of droughts or spring frosts. This issue has rarely been the subject of comprehensive empirical analyses, although the phenomena of perception and risk aversion have been analyzed by various authors [38,64,116]. However, it is challenging to formulate unambiguous conclusions as to the direction of and the strength of dependency. Meraner and Finger [117], referring to the results of analyses of such authors as Flaten et al. [3], Meuwissen et al. [116] and van Winsen [41] (pp.338) emphasize that “so far, the empirical relationship between perceived sources of risks and responses has been ambiguous.” Menapace et al. [110] indicated that “farmers who are more (less) risk averse tend to perceived greater (smaller) probabilities of farm losses occurring,” which, at least in the case of the most important risk factors, was confirmed in our research. Our research shows that the surveyed farmers perceive drought as the most significant risk factor, which was also observed in other analyses carried out in various countries [64,118,119,120]. A comparison of the perception of this phenomenon between the selected groups shows that farmers with high-risk aversion more often indicate the occurrence of drought and a greater scale of threats resulting from this factor. Similar relationships were also observed concerning the remaining risk factors included in the study, although only in some cases were the differences statistically significant. Thus, it supports the thesis that the perception of the strength of the impact of risk factors depends, among others, on the degree of risk aversion. It is in line with Meraner and Finger’s [117] (pp.7) observation, indicating that “risk perception varies between individuals depending on the objective risk they are exposed to and the subjective interpretation of risks.”
There were also some differences in the scope of actions taken to cope with the risk. However, the obtained results do not allow for a clear conclusion that a higher level of risk aversion is conducive to a sturdier determination of farmers in seeking a way to reduce the risk. As emphasized by Newbery and Stiglitz [44], farmers focus on income volatility and its impact on the consumption possibilities of the agricultural family, rather than on prices or crops. On the other hand, recent studies among Polish farmers suggest that in small family farms price fluctuation is perceived as one of the main economic risk factors. The farmers in small farms have difficulties in estimating the exact value of income, as agricultural production and household expenditure are difficult to separate [121]. However, taking into account that the FADN sample covers commercial farms, we decided to investigate the potential vulnerability of farmers regarding income deterioration, assuming that farmers who are taking part in the collection of accountancy data are conscious of their income.
However, only in the case of a few methods of risk reduction, it turned out that there are significant differences between farmers with different attitudes towards risk. The studies of other authors also indicate that there are some differences among farmers with different levels of risk aversion concerning the selected methods and strategies of risk reduction. However, it is difficult to indicate a specific pattern of behavior here [110,122,123]. For example, Akcaoz et al. showed that “growing more than one crop was the most important risk strategy for both risk averse and risk-seeking groups of farmers, while the spreading sales was the most important strategy for risk neutral groups of farmers.” Our research shows that decisions regarding the choice of risk management methods and the scale of activities to a small extent depend on the degree of the risk aversion. Van Winsen et al. [124] concluded that the risk attitude does have a significant impact on the intention of applying any of the risk strategies.
Nevertheless, in our study, it turned out that farmers with higher risk aversion more often declared changes in plant protection methods in recent years, as well as entered into contract crops with product recipients. This indicates that in conditions of declining stability they consider undertaking actions to reduce the variability of financial results. It was also observed that in the case of a further significant drop in income, farmers with higher risk aversion would be less likely to increase the scale of production or develop non-agricultural activities. This observation is partially consistent with the results of the Meraner and Finger’s [117] study, which showed that farmers with higher risk aversion are likely to prioritize on-farm risk management over off-farm strategies.
In conclusion, we can say Polish farmers are on average quite risk averse. Their attitude towards risk is strongly linked with their self-assessment regarding their way of making decisions in the farm management process. It is also possible to notice links between farmers’ risk aversion and their assessment regarding frequency and threats of selected risk factors and also with farm type and economic size. Farmers’ risk aversion has little relation to the perception and application of risk management methods. However, farmers’ declared reactions to a potential significant income drop are differentiated regarding farmers’ risk aversion.
When interpreting the presented research results, one should take into account the limitations resulting from the research methodology used. Assessing risk aversion using hypothetical lotteries is a well-known approach. It is essential that as long as the decision-maker is not at risk of losing real money, declared decisions might not reflect the actual attitude towards risk. In this situation, it is worth enriching the results of hypothetical lotteries with other methods of evaluation. In this study, we attempted to use the self-assessment of risk perception, but the obtained results were inconclusive. This issue requires further research using still other methods based on an indirect approach to risk assessment (e.g., observation of production decisions).

Author Contributions

Conceptualization, A.W. and P.S.; methodology, A.W. and P.S.; formal analysis, P.S. and K.P.; investigation, P.S., A.W. and P.K.; resources, A.W. and P.K.; data curation, P.K. and A.W.; writing—original draft preparation, P.S. and K.P.; writing—review and editing, A.W., P.S., T.S. and M.S.; supervision, A.W.; project administration, A.W.; funding acquisition, A.W., T.S. All authors have read and agreed to the published version of the manuscript.

Funding

This research was funded by The National Centre for Research and Development, grant number Gospostrateg1/390422/25/NCBR/2019 and The APC was funded by the National Centre for Research and Development, grant number Gospostrateg1/390422/25/NCBR/2019.

Conflicts of Interest

The authors declare no conflict of interest. The funders had no role in the design of the study; in the collection, analyses, or interpretation of data; in the writing of the manuscript, or in the decision to publish the results.

References

  1. Cao, R.; Carpentier, A.; Gohin, A. Measuring Farmers’ Risk Aversion: The Unknown Properties of the Value Function. In Proceedings of the 13th EAAE Congress Change and Uncertainty Challenges for Agriculture, Food and Natural Resources, Zurich, Switzerland, 30 August–2 September 2011; p. 13. [Google Scholar]
  2. Pope, R.D. Expected profit, price change, and risk aversion. Am. J. Agric. Econ. 1982, 64, 581–584. [Google Scholar] [CrossRef]
  3. Flaten, O.; Lien, G.; Koesling, M.; Valle, P.S.; Ebbesvik, M. Comparing risk perceptions and risk management in organic and conventional dairy farming: Empirical results from Norway. Livest. Prod. Sci. 2005, 95, 11–25. [Google Scholar] [CrossRef] [Green Version]
  4. Ullah, R.; Shivakoti, G.P.; Ali, G. Factors effecting farmers’ risk attitude and risk perceptions: The case of Khyber Pakhtunkhwa, Pakistan. Int. J. Disaster Risk Reduct. 2015, 13, 151–157. [Google Scholar] [CrossRef]
  5. Bard, S.; Barry, P. Assessing farmers’ attitudes toward risk using the “closing-in” method. J. Agric. Resour. Econ. 2001, 26, 248–260. [Google Scholar]
  6. Vollmer, E.; Hermann, D.; Musshoff, O. Is the risk attitude measured with the Holt and Laury task reflected in farmers’ production risk? Eur. Rev. Agric. Econ. 2017, 44, 399–424. [Google Scholar] [CrossRef]
  7. Iyer, P.; Bozzola, M.; Hirsch, S.; Meraner, M.; Finger, R. Measuring farmer risk preferences in Europe: A systematic review. J. Agric. Econ. 2020, 71, 3–26. [Google Scholar] [CrossRef] [Green Version]
  8. Kumbhakar, S.C. Risk preference and productivity measurement under output price uncertainty. Empir. Econ. 2002, 27, 461–472. [Google Scholar] [CrossRef]
  9. Feder, G. Farm size, risk aversion and the adoption of new technology under uncertainty. Oxf. Econ. Pap. 1980, 32, 263–283. [Google Scholar] [CrossRef]
  10. Alcamo, J.; Moreno, J.M.; Nováky, B.; Bindi, M.; Corobov, R.; Devoy, R.; Giannakopoulos, C.; Martin, E.; Olesen, J.E.; Shvidenko, A. Europe. In Climate Change 2007: Impacts, Adaptation and Vulnerability. Contribution of Working Group II to the Fourth Assessment Report of the Intergovernmental Panel on Climate Change; Parry, M.L., Canziani, O.F., Palutikof, J.P., van der Linden, P.J., Hanson, C.E., Eds.; Cambridge University Press: Cambridge, UK, 2007; pp. 541–580. [Google Scholar]
  11. Selvaraju, R. Climate risk assessment and management in agriculture. In Building Resilience for Adaptation to Climate Change in the Agriculture Sector. Proceedings of the Joint FAO/OECD Workshop; Meybeck, A., Lankoski, J., Redfern, S., Azzu, N., Gitz, V., Eds.; OECD: Rome, Italy, 2012; pp. 71–90. [Google Scholar]
  12. Asfaw, S.; Lipper, L. Managing Climate Risk Using Climate-Smart Agriculture; FAOUN: Rome, Italy, 2016. [Google Scholar]
  13. Bureau, J.C.; Jean, S.; Matthews, A. The consequences of agricultural trade liberalization for developing countries: Distinguishing between genuine benefits and false hopes. World Trade Rev. 2006, 5, 225–249. [Google Scholar] [CrossRef] [Green Version]
  14. Bureau, J.-C.; Guimbard, H.; Jean, S. Agricultural trade liberalisation in the 21st century: Has it done the business? J. Agric. Econ. 2019, 70, 3–25. [Google Scholar] [CrossRef]
  15. European Commission. Common Agricultural Policy Post-2020: Simplification and Modernisation; European Commission: Brussels, Belgium, 2018. [Google Scholar]
  16. Meuwissen, M.P.; De Mey, Y.; Van Asseldonk, M. Prospects for agricultural insurance in Europe. Agric. Financ. Rev. 2018, 78, 174–182. [Google Scholar] [CrossRef]
  17. Vrolijk, H.C.J.; De Bont, K.C.J.A.M.; van der Veen, H.B.; Wisman, J.H.; Poppe, K.J. Volatility of Farm Incomes, Prices and Yields in the European Union; LEI Wageningen: The Hague, The Netherlands, 2009. [Google Scholar]
  18. European Commission. Risk Management Tools for EU Agriculture (with a Special Focus on Insurance); European Commission: Brussels, Belgium, 2001. [Google Scholar]
  19. European Parliament. Regulation (EU) No 1305/2013 of the European Parliament and of the Council of 17 December 2013 on Support for Rural Development by the European Agricultural Fund for Rural Development (EAFRD) and Repealing Council Regulation (EC) No 1698/2005; European Parliament: Brussels, Belgium, 2013. [Google Scholar]
  20. OECD. Managing Risk in Agriculture: A Holistic Approach; OECD Publishing: Paris, France, 2009. [Google Scholar]
  21. OECD. Managing Risk in Agriculture: Policy Assessment and Design; OECD Publishing: Paris, France, 2011. [Google Scholar]
  22. Capitanio, F.; De Pin, A. Measures of efficiency of agricultural insurance in Italy, economic evaluations. Risks 2018, 6, 126. [Google Scholar] [CrossRef] [Green Version]
  23. Komarek, A.M.; de Pinto, A.; Smith, V.H. A review of types of risks in agriculture: What we know and what we need to know. Agric. Syst. 2020, 178, 102738. [Google Scholar] [CrossRef]
  24. Picazo-Tadeo, A.J.; Wall, A. Production risk, risk aversion and the determination of risk attitudes among Spanish rice producers. Agric. Econ. 2011, 42, 451–464. [Google Scholar] [CrossRef]
  25. Matthews, A. Use of Risk Management Tools in the CAP. Available online: http://capreform.eu/use-of-risk-management-tools-in-the-cap/ (accessed on 28 July 2020).
  26. Berg, E.; Huirne, R.B.M.; Majewski, E.; Meuwissen, M.P.M. Income Stabilization in a Changing Agricultural World: Policy and Tools; Editorial House Wies Jutra, Limited: Warsaw, Poland, 2009. [Google Scholar]
  27. Mateos-Ronco, A.; Server Izquierdo, R.J. Risk management tools for sustainable agriculture: A model for calculating the average price for the season in revenue insurance for citrus fruit. Agronomy 2020, 10, 198. [Google Scholar] [CrossRef] [Green Version]
  28. Lang, V.; Pop, C.; Woidich, A. Economic Accounts for Agriculture. Total Agricultural Output in the EU up by 0.6% in 2018; Eurostat Press Office: Luxemoburg, 2019. [Google Scholar]
  29. EU Expenditure and Revenue 2014–2020|European Commission. Available online: https://ec.europa.eu/budget/graphs/revenue_expediture.html (accessed on 18 September 2020).
  30. Santeramo, F. Study on Risk Management in EU Agriculture Annex 2-Case Study 2 How to Enhance the Participation of Small-Scale and Non-Specialised Farms in Crop Insurance Schemes; European Commission: Brussels, Belgium, 2017. [Google Scholar]
  31. Sulewski, P.; Kłoczko-Gajewska, A. Farmers’ risk perception, risk aversion and strategies to cope with production risk: An empirical study from Poland. Stud. Agric. Econ. 2014, 116, 140–147. [Google Scholar] [CrossRef] [Green Version]
  32. Pawłowska-Tyszko, J.; Gorzelak, A.; Kopa, J.H.; Kulawik, J.; Osuch, D.; Pawłowska, J.; Skarzyńska, A. Ocena Funkcjonowania Ubezpieczeń Upraw i Zwierząt Gospodarskich w Polskim Rolnictwie; Pawłowska-Tyszko, J., Ed.; Instytut Ekonomiki Rolnictwa i Gospodarki Zywnosciowej Panstwowy Instytut Badawczy: Warsaw, Poland, 2017. [Google Scholar]
  33. Crop and Farm Animal Insurance Act of 7 July 2005; Polish Parliament: Warsaw, Poland, 2019; p. 10.
  34. Wąs, A.; Kobus, P. Factors differentiating the level of crop insurance at Polish farms. Agric. Financ. Rev. 2018, 78, 209–222. [Google Scholar] [CrossRef]
  35. Janowicz-Lomott, M.; Łyskawa, K. Funkcjonowanie Dotowanych Ubezpieczeń Upraw w Polsce; Polska Izba Ubezpieczen: Warsaw, Poland, 2016. [Google Scholar]
  36. Ministry of Agriculture and Rural Development Economic Insurance in Holistic Risk Management in Sustainable Agriculture, Implementation of Innovation and Technology, and Counteracting Climate Change (Research Project). 2019. Available online: https://www.gov.pl/documents/912055/913531/UBROL_prezentacja.pdf/a6232043-c6ca-6227-c340-2fe76aabe96a (accessed on 1 October 2020).
  37. Milionis, N.; Jereb, S.; Henderson, K.; Vrabić, J.; Viegas, H.F.; Ollier, C.; Oliveira, P.; Stasia, A.; Huth, J.; Lanzutti, M.; et al. Special Report 23/2019: Farmers’ Income Stabilisation; European Court of Auditors: Luxembourg, 2019. [Google Scholar]
  38. Sulewski, P.; Majewski, E.; Meuwissen, M. Mutual insurance fund as a form of risk mitigation in agriculture. Probl. Agric. Econ. 2014, 2, 127–144. [Google Scholar]
  39. Cordier, J.; Santeramo, F. Mutual funds and the income stabilisation tool in the EU: Retrospect and prospects. EuroChoices 2020, 19, 53–58. [Google Scholar] [CrossRef]
  40. Sulewski, P. Farmers’ attitudes towards risk and strategies of risk reduction. Rocz. Nauk. Ekon. Rol. Rozw. Obsz. Wiej. Rozw. Obsz. Wiej. 2014, 101, 116–126. [Google Scholar]
  41. Van Winsen, F. Rethinking Farmers’ Intended Risk Behaviour: The Role of Risk Perception, Risk Attitude and Decision Context. Ph.D. Thesis, Ghent University, Ghent, Belgium, 2014. [Google Scholar]
  42. Eckel, C.C.; Grossman, P.J. Forecasting risk attitudes: An experimental study using actual and forecast gamble choices. J. Econ. Behav. Organ. 2008, 68, 1–17. [Google Scholar] [CrossRef]
  43. Anderson, J.R.; Dillon, J.L. Risk analysis in dryland farming systems. Farm Syst. Manag. Ser. 1992, 2, 1–109. [Google Scholar]
  44. Newbery, D.M.; Stiglitz, J.E. The Theory of Commodity Prices Stabilization; Oxford University Press: Oxford, UK, 1981. [Google Scholar]
  45. Karni, E. Savage’s subjective expected utility model. In The New Palgrave Dictionary of Economics; Palgrave Macmillan: London, UK, 2008; pp. 1–5. [Google Scholar]
  46. Hammond, P. Handbook of Utility Theory; Barbera, S., Hammond, P., Seidl, C., Eds.; Springer: New York, NY, USA, 1989. [Google Scholar]
  47. Pratt, J.W. Risk aversion in the small and in the large. Econometrica 1964, 32, 122. [Google Scholar] [CrossRef]
  48. Arrow, K.J. Aspects of The Theory of Risk-Bearing; Yrjo Jahnssonin Saatio: Helsinki, Finland, 1965. [Google Scholar]
  49. Hardaker, J.B. Some issues in dealing with risk in agriculture. Work. Pap. Ser. Agric. Resour. Econ. 2000, 3, 1–18. [Google Scholar]
  50. Eeckhoudt, L.; Gollier, C. Risk: Evaluation, Management and Sharing; Harvester Wheatsheaf: London, UK, 1995. [Google Scholar]
  51. Hamal, K.B.; Anderson, J.R. A note on decreasing absolute risk aversion among farmers in Nepal. Aust. J. Agric. Econ. 1982, 26, 220–225. [Google Scholar] [CrossRef] [Green Version]
  52. Charness, G.; Gneezy, U.; Imas, A. Experimental methods: Eliciting risk preferences. J. Econ. Behav. Organ. 2013, 87, 43–51. [Google Scholar] [CrossRef]
  53. Antle, J.M. Infrastructure and aggregate agricultural productivity: International evidence. Econ. Dev. Cult. Change 1983, 31, 609–619. [Google Scholar] [CrossRef]
  54. Antle, J.M. Econometric estimation of producers’ risk attitudes. Am. J. Agric. Econ. 1987, 69, 509–522. [Google Scholar] [CrossRef]
  55. Chavas, J.-P.; Holt, M.T. Economic behavior under uncertainty: A joint analysis of risk preferences and technology. Rev. Econ. Stat. 1996, 78, 329–335. [Google Scholar] [CrossRef]
  56. Wolff, H.; Heckelei, T. Estimation of constrained optimisation models for agricultural supply analysis based on generalised maximum entropy in European. Eur. Rev. Agric. Econ. 2003, 30, 27–50. [Google Scholar]
  57. Arata, L.; Donati, M.; Sckokai, P.; Arfini, F. Incorporating risk in a positive mathematical programming framework: A dual approach. Aust. J. Agric. Resour. Econ. 2017, 61, 265–284. [Google Scholar] [CrossRef] [Green Version]
  58. Kobus, P.; Wąs, A. Changes in Polish farmers’ attitudes toward risk after Poland’s accession to the EU. J. Food Prod. Mark. 2017, 23, 357–366. [Google Scholar] [CrossRef]
  59. Damodaran, A. Strategic Risk Taking: A Framework for Risk Management; FT Press: Upper Saddle River, NJ, USA, 2007. [Google Scholar]
  60. Weber, E.U.; Blais, A.R.; Betz, N.E. A domain-specific risk-attitude scale: Measuring risk perceptions and risk behaviors. J. Behav. Decis. Mak. 2002, 15, 263–290. [Google Scholar] [CrossRef]
  61. Meuwissen, M.; Hardaker, J.B.; Huirne, R.B.M.; Dijkhuizen, A.A. Sharing risks in agriculture; principles and empirical results. NJAS Wagening. J. Life Sci. 2001, 49, 343–356. [Google Scholar] [CrossRef] [Green Version]
  62. Sauter, P.; Hermann, D.; Mußhoff, O. Risk attitudes of foresters, farmers and students: An experimental multimethod comparison. Diskussionbeitrag 2015, 1514, 1–42. [Google Scholar]
  63. Howley, P.; Dillon, E.; Heanue, K.; Meredith, D. Worth the risk? The behavioural path to well-being. J. Agric. Econ. 2017, 68, 534–552. [Google Scholar] [CrossRef] [Green Version]
  64. Meuwissen, M.P.M.; van Asseldonk, M.A.P.M.; Huirne, R.B.M. Income Stabilisation in European Agriculture: Design and Economic Impact of Risk Management tools; Wageningen Academic Publishers: Wageningen, The Netherlands, 2008; ISBN 978-90-8686-079-1. [Google Scholar]
  65. Halter, A.N.; Mason, R. Utility measurement for those who need to know. West. J. Agric. Econ. 1978, 3, 99–110. [Google Scholar]
  66. Lin, W.; Dean, G.W.; Moore, C.V. An empirical test of utility vs. profit maximization in agricultural production. Am. J. Agric. Econ. 1974, 56, 497–508. [Google Scholar] [CrossRef]
  67. Dillon, J.L.; Scandizzo, P.L. Risk attitudes of subsistence farmers in Northeast Brazil: A sampling approach. Am. J. Agric. Econ. 1978, 60, 425–435. [Google Scholar] [CrossRef]
  68. Kobus, P. Wielowymiarowe Modelowanie Ryzyka Dochodowego w Rolnictwie; Wydawnictwo SGGW: Warsaw, Poland, 2019. [Google Scholar]
  69. Rommel, J.; Hermann, D.; Müller, M.; Mußhoff, O. Contextual framing and monetary incentives in field experiments on risk preferences: Evidence from German farmers. J. Agric. Econ. 2018, 70, 408–425. [Google Scholar] [CrossRef]
  70. Schaak, H.; Buchholz, M.; Hermann, D.; Holst, G.S.; Musshoff, O. The predictive power of experimental risk attitude measures for farm diversification. Eur. Rev. Agric. Econ. 2013, 40, 807–833. [Google Scholar]
  71. Holt, C.A.; Laury, S.K. Risk aversion and incentive effects. Am. Econ. Rev. 2002, 92, 1644–1655. [Google Scholar] [CrossRef] [Green Version]
  72. Pennings, J.M.E.; Garcia, P. Measuring producers’ risk preferences: A global risk-attitude construct. Am. J. Agric. Econ. 2001, 83, 993–1009. [Google Scholar] [CrossRef]
  73. Lins, D.A.; Gabriel, S.C.; Sonka, S.T. An analysis of the risk aversion of farm operators: An asset portfolio approach. West. J. Agric. Econ. 1981, 6, 1–16. [Google Scholar]
  74. Roe, T. Empirical estimation and use of risk preference: discussion. Am. J. Agric. Econ. 1982, 64, 394–396. [Google Scholar] [CrossRef]
  75. Antle, J.M. Nonstructural risk attitude estimation. Am. J. Agric. Econ. 1989, 71, 774–784. [Google Scholar] [CrossRef]
  76. Binswanger, H.P. Attitudes toward risk: experimental measurement in rural India. Am. J. Agric. Econ. 1980, 62, 395–407. [Google Scholar] [CrossRef] [Green Version]
  77. Shee, A.; Azzarri, C.; Haile, B. Farmers’ willingness to pay for improved agricultural technologies: Evidence from a field experiment in Tanzania. Sustainability 2019, 12, 216. [Google Scholar] [CrossRef] [Green Version]
  78. Saha, A.; Shumway, C.R.; Talpaz, H. Joint estimation of risk preference structure and technology using expo-power utility. Am. J. Agric. Econ. 1994, 76, 173–184. [Google Scholar] [CrossRef]
  79. Love, H.A.; Buccola, S.T. Joint risk preference-technology estimation with a primal system. Am. J. Agric. Econ. 1991, 73, 765–774. [Google Scholar] [CrossRef]
  80. Saha, A. Expo-power utility: A ’flexible ’ form for absolute and relative risk aversion. Am. J. Agric. Econ. 1993, 75, 905–913. [Google Scholar] [CrossRef]
  81. Pennings, J.M.E.; Smidts, A. Assessing the construct validity of risk attitude. SSRN Electron. J. 2000, 46, 1337–1348. [Google Scholar] [CrossRef] [Green Version]
  82. Lybbert, T.J.; Just, D.R. Is risk aversion really correlated with wealth? How estimated probabilities introduce spurious correlation. Am. J. Agric. Econ. 2007, 89, 964–979. [Google Scholar] [CrossRef]
  83. Meuwissen, M.; Hardaker, J.B.; Huirne, R.B.M. Perceptions of risk and risk management strategies: An analysis of Dutch livestock farmers. Am. J. Agric. Econ. 1999, 81, 1284. [Google Scholar] [CrossRef]
  84. Harrison, G.W.; Lau, M.I.; Rutström, E.E. Estimating risk attitudes in Denmark: A field experiment. Scand. J. Econ. 2007, 109, 341–368. [Google Scholar] [CrossRef] [Green Version]
  85. Lucas, M.P.; Pabuayon, I.M. Risk perceptions, attitudes, and influential factors of rainfed lowland rice farmers in Ilocos Norte, Philippines. Asian J. Agric. Dev. 2011, 8, 1–17. [Google Scholar]
  86. Kisaka-Lwayo, M.; Obi, A. Risk perceptions and management strategies by smallholder farmers in KwaZulu-Natal Province, South Africa. Int. J. Agric. Manag. 2012, 1, 1–12. [Google Scholar]
  87. Tanaka, T.; Camerer, C.F.; Nguyen, Q. Risk and time preferences: Linking experimental and household survey data from Vietnam. Am. Econ. Rev. 2010, 100, 557–571. [Google Scholar] [CrossRef] [Green Version]
  88. Ayinde, O.E. Effect of socio-economic factors on risk behaviour of farming households: An empirical evidence of small-scale crop producers in Kwara State, Nigeria. Agric. J. 2008, 3, 447–453. [Google Scholar]
  89. Sherrick, B.J.; Barry, P.J.; Ellinger, P.N.; Schnitkey, G.D. Factors influencing farmers crop insurance decisions. Am. J. Agric. Econ. 2004, 86, 103–114. [Google Scholar] [CrossRef]
  90. Koundouri, P.; Nauges, C.; Tzouvelekas, V. Technology adoption under production uncertainty: Theory and application to irrigation technology. Am. J. Agric. Econ. 2006, 88, 657–670. [Google Scholar] [CrossRef] [Green Version]
  91. Monjardino, M.; Hochman, Z.; Horan, H. Yield potential determines Australian wheat growers’ capacity to close yield gaps while mitigating economic risk. Agron. Sustain. Dev. 2019, 39. [Google Scholar] [CrossRef]
  92. Abdulkadri, A.O.; Langemeier, M.R.; Featherstone, A.M. Estimating risk aversion coefficients for dry land wheat, irrigated corn and dairy producers in Kansas. Appl. Econ. 2003, 35, 825–834. [Google Scholar] [CrossRef]
  93. Serra, T.; Zilberman, D.; Gil, J.M. Differential uncertainties and risk attitudes between conventional and organic producers: The case of Spanish arable crop farmers. Agric. Econ. 2008, 39, 219–229. [Google Scholar] [CrossRef] [Green Version]
  94. Chavas, J.; Holt, M.T. Acreage decisions under risk: The case of corn and soybeans. Am. J. Agric. Econ. 1990, 72, 529–538. [Google Scholar] [CrossRef] [Green Version]
  95. Holt, M.; Moschini, G. Alternative measures of risk in commodity supply models: An analysis of sow farrowing decisions in the United States. J. Agric. Resour. Econ. 1992, 17, 1–12. [Google Scholar]
  96. Sandmo, A. Agnar on the theory of the competitive firm under price uncertainty. Am. Econ. Rev. 1971, 61, 65–73. [Google Scholar]
  97. Hennessy, D.A. The production effects of agricultural income support policies under uncertainty. Am. J. Agric. Econ. 1998, 80, 46–57. [Google Scholar] [CrossRef]
  98. GUS. Rolnictwo w 2017r.; CSO: Warsaw, Poland, 2018. [Google Scholar]
  99. Central Statistical Office. Charakterystyka Gospdoarstw Rolnych w 2016 r.; Central Statistical Office: Warsaw, Poland, 2017. [Google Scholar]
  100. Wąs, A. Modelowanie Przemian Strukturalnych Polskiego Rolnictwa; Wydawnictwo SGGW: Warsaw, Poland, 2013. [Google Scholar]
  101. Smiglak-Krajewska, M. Sposoby ograniczania ryzyka w gospodarstwach rolnych z terenu województwa kujawsko-pomorskiego. Rocz. Nauk. Ekon. Rol. Rozw. Obsz. Wiej. 2014, 101, 136–143. [Google Scholar]
  102. Kaczała, M.; Łyskawa, K. Ubezpieczenie indeksowe suszy. Wiadomości Ubezpieczeniowe 2012, 4, 40. [Google Scholar]
  103. Doroszewski, A.; Jóźwicki, T.; Wróblewska, E.; Kozyra, J. Susza Rolnicza w Polsce w Latach 1961–2010; IUNG: Pulawy, Poland, 2014. [Google Scholar]
  104. Handschke, J.; Kaczała, M.; Łyskawa, K. Koncepcja Polis Indeksowych i Możliwość ich Zastosowania w Systemie Obowiązkowych Dotowanych Ubezpieczeń Upraw w Polsce; Polska Izba Ubezpieczeń: Warsaw, Poland, 2015. [Google Scholar]
  105. FADN FADN—Farm Accountancy Data Network. Available online: https://ec.europa.eu/agriculture/rica/ (accessed on 26 August 2020).
  106. Floriańczyk, Z.; Osuch, D.; Bocian, M.; Malachowska, B.; Cholewa, I. Plan Wyboru Próby Gospodarstw Rolnych Polskiego FADN od Roku Obrachunkowego 2019 Wersja z dn. 25.10.2018 Roku; FADN: Warsaw, Poland, 2019. [Google Scholar]
  107. FADN. Plan Wyboru Próby Gospodarstw Rolnych Polskiego FADN (Plan of Sampling for Polish FADN); FADN: Warsaw, Poland, 2008. [Google Scholar]
  108. Neyman, J. On the two different aspects of the representative method: The method of stratified sampling and the method of purposive selection. J. R. Stat. Soc. 1934, 97, 558–625. [Google Scholar] [CrossRef]
  109. Dohmen, T.; Falk, A.; Huffman, D.; Sunde, U.; Schupp, J.; Wagner, G.G. Individual risk attitudes: Measurement, determinants, and behavioral consequences. J. Eur. Econ. Assoc. 2011, 9, 522–550. [Google Scholar] [CrossRef] [Green Version]
  110. Menapace, L.; Colson, G.; Raffaelli, R. Risk aversion, subjective beliefs, and farmer risk management strategies. Am. J. Agric. Econ. 2013, 95, 384–389. [Google Scholar] [CrossRef]
  111. Kavcic, S.; Žgajnar, J. IndIrect estImatIon of farm’s rIsk aversIon: mathematIcal programmIng approach. Bulg. J. Agric. Sci. 2011, 17, 218–231. [Google Scholar]
  112. Markowitz, H. Portfolio Selection; Wiley Publishing: Hoboken, NJ, USA, 1952; Volume 7. [Google Scholar]
  113. Franken, J.R.V.; Pennings, J.M.E.; Garcia, P. Measuring the effect of risk attitude on marketing behavior. Agric. Econ. 2014, 45, 525–535. [Google Scholar] [CrossRef]
  114. Dohmen, T.; Falk, A.; Huffman, D.; Sunde, U.; Schupp, J.; Wagner, G.G. Individual risk attitudes: New evidence from a large, representative, experimentally-validated survey. IZA DP 2005, 1730, 1–59. [Google Scholar]
  115. Fausti, S.; Gillespie, J.M. Measuring risk attitude of agricultural producers using a mail survey: How consistent are the methods? Aust. J. Agric. Resour. Econ. 2006, 50, 171–188. [Google Scholar] [CrossRef] [Green Version]
  116. Meuwissen, M.P.M.; Huirne, R.B.M.; Hardaker, J.B. Risk and risk management: An empirical analysis of Dutch livestock farmers. Livest. Prod. Sci. 2001, 69, 43–53. [Google Scholar] [CrossRef]
  117. Meraner, M.; Finger, R. Data on German farmers risk preference, perception and management strategies. Data Brief 2017, 15, 102–105. [Google Scholar] [CrossRef]
  118. Greiner, R.; Patterson, L.; Miller, O. Motivations, risk perceptions and adoption of conservation practices by farmers. Agric. Syst. 2009, 99, 86–104. [Google Scholar] [CrossRef]
  119. Udmale, P.; Ichikawa, Y.; Manandhar, S.; Ishidaira, H.; Kiem, A.S. Farmers’ perception of drought impacts, local adaptation and administrative mitigation measures in Maharashtra State, India. Int. J. Disaster Risk Reduct. 2014, 10, 250–269. [Google Scholar] [CrossRef] [Green Version]
  120. Eitzinger, A.; Binder, C.R.; Meyer, M.A. Risk perception and decision-making: Do farmers consider risks from climate change? Clim. Change 2018, 151, 507–524. [Google Scholar] [CrossRef] [Green Version]
  121. Stepien, S.; Polcyn, J. Risk Management in Small Family Farms in Poland. In Proceedings of the 20th International Scientific Conference Economic Science for Rural Development, Jeglava, Latvia, 9–10 May 2019; Volume 50, pp. 382–388. [Google Scholar]
  122. Akcaoz, H.; Ozkan, B. Determining risk sources and strategies among farmers of contrasting risk awareness: A case study for Cukurova region of Turkey. J. Arid Environ. 2005, 62, 661–675. [Google Scholar] [CrossRef]
  123. Asravor, R.K. Livelihood diversification strategies to climate change among smallholder farmers in Northern Ghana. J. Int. Dev. 2018, 30, 1318–1338. [Google Scholar] [CrossRef]
  124. Van Winsen, F.; de Mey, Y.; Lauwers, L.; van Passel, S.; Vancauteren, M.; Wauters, E. Determinants of risk behaviour: Effects of perceived risks and risk attitude on farmers adoption of risk management strategies. J. Risk Res. 2016, 19, 56–78. [Google Scholar] [CrossRef]
Figure 1. Poland on the map of Europe. Source: own research.
Agronomy 10 01555 g001
Figure 2. The general principle of the research sample construction. Source: own research.
Agronomy 10 01555 g002
Figure 3. The distribution of surveyed farms within FADN regions in Poland. Source: own research.
Agronomy 10 01555 g003
Table 1. The characteristic of the Farm Accountancy Data Network (FADN) sample in relation to the general population of Polish farms.
CategoryUnitsFarm Population in PolandFADN Field of ObservationFADN Field of Observation in Farm Population
Standard productionmln PLN *73,69968,56393.0%
UAA areath. ha14,44712,29185.1%
Number of livestockLU **10,377,50610,055,99596.9%
Labour resourcesAWU ***2,811,6221,868,52766.5%
Source: [106] * ex.rate PLN/USD~3.7 ** LU–livestock unit, *** AWU–Annual Work Unit (2120 h).
Table 2. Number of farms in test sample regarding economic size and type of farming.
Economic Farm Size
Type of Farming
Standard Output [Thousand EUR]Total
Below 2525 < 100Above 100
Crop production13311123267
Granivores (pigs & poultry)0102232
Cattle38938139
Mixed696429162
Total24027882600
Source: own elaboration.
Table 3. Share of farmers according to their risk aversion.
Grouping Criterion and Farm ClassesRisk Aversion
LowMediumHigh
Share of Farmers [%]
Economic size
[th. EUR SO]
below 2520.857.821.5
25–10024.947.727.4
above 10026.851.821.4
Farm typeCattle29.954.915.3
Mixed16.452.730.9
Crop23.752.623.7
Pig21.152.626.3
Total23.053.223.8
Source: own research.
Table 4. Farmer self-assessment concerning deciding their risk aversion.
Type of StatementRisk AversionThe Farmer’s Self-Assessment of the Degree of Compliance with a Given StatementChi2p-Value
Definitely Not or Probably NotNeither Yes nor NoRather Yes or Definitely Yes
Share of Answers [%]
“I sometimes make risky decisions on the farm.”low36.217.446.417.2460.0017
medium48.020.729.8
high55.919.623.1
total47.219.732.0
“I have concerns about taking loans.”low34.816.748.68.4520.0763
medium28.514.756.7
high20.316.162.9
total28.015.556.3
“I implement new technologies and plant varieties.”low21.05.873.210.9610.0270
medium22.615.062.4
high18.217.562.9
total21.213.565.0
“I accept a narrow production specialization on the farm.”low47.810.941.37.4120.1156
medium48.917.633.2
high56.613.329.4
total50.515.034.2
Source: own research.
Table 5. Percentage of farmers who perceive the indicated risk factors as frequent and severe.
Farmer Risk AversionRisk Factors
DroughtCrop Pest and DiseasesSpring FrostsHailPoor OverwinteringStorm
share of farmers indicating a frequent occurrence of the risks factors [%]
low72.560.136.521.214.85.4
medium82.464.249.423.024.33.7
high83.256.054.929.624.34.0
total80.361.347.724.122.14.1
Chi27.0623.200110.2493.1535.4340.7471
p-value0.02920.20180.00590.20660.06600.6882
share of farmers indicating a substantial threat resulting from a given risk factor [%]
low86.261.667.452.249.361.6
medium94.061.163.953.057.161.1
high94.460.167.157.360.860.1
total92.361.065.553.856.261.0
Chi29.443.0671.726.9554.0311.113
p-value0.015390.966970.695450.62020.133190.57318
Source: own research.
Table 6. Assessment of the usefulness of the selected risk management methods regarding the level of farmers’ risk aversion.
Farmer Risk AversionRisk Management Method
Improvement of Crop Protection PracticesDiversification of Production StructurePlanning the Production Based on Market InformationTechnology Improvements to limit The Effects of Adverse Weather Using Crop InsuranceRaising Qualifications, Acquiring New KnowledgeCooperation with
Other Farmers
Crop Sales
Contracts
Taking Off-fArm EmploymentDeveloping Off-Farm Business
share of farmers confirming the usefulness of given risk management methods [%]
low61.651.453.665.967.489.173.270.355.831.2
medium62.454.252.067.167.782.163.966.159.628.5
high61.555.946.257.369.283.261.562.261.526.6
total62.054.051.064.568.084.065.566.259.228.7
Chi20.0420.5851.8614.2550.1353.5964.9422.0341.0024.249
p-value0.97900.7460.39420.11910.9350.16550.08440.36160.6060.1194
Source: own research.
Table 7. The percentage of farmers who implemented the selected risk management methods in the last five years regarding their level of risk aversion.
Farmer Risk AversionRisk Management Method
Crop Irrigation Improvement of Crop Protection Practices Developing Infrastructure Protecting Multi-Perennial CropsNew Crop Cultivation Technologies Developing of a Crop Storage FacilityCrop Sales Contracts Developing New Sales Channels
share of farmers who introduced specified risk management method in the last five years [%]
low12.959.48.833.326.238.118.8
medium12.471.812.638.024.136.520.7
high6.074.87.037.223.541.314.4
total11.069.710.636.724.438.018.8
Chi24.5629.1142.0710.8500.29000.9222.367
p-value0.10210.01040.35490.65370.86500.63050.3061
Source: own research.
Table 8. Share of farmers declaring the implementation of the indicated adjustment measures in the event of a decrease in agricultural income by over 20%.
Farmer Risk AversionPossible Adaptation Measures
Increasing the Scale of ProductionGiving Up Commercial FarmingContinue Present Strategy Without ChangesTaking Off-Farm EmploymentAdjusting Farm Production StructureDeveloping Off-Farm BusinessDecreasing Investment ExpendituresDecreasing On-Farm Employment
% of farmers
low39.129.728.338.448.639.160.95.1
medium27.323.235.743.659.236.764.98.2
high25.921.028.738.559.432.276.210.5
total29.724.232.341.256.836.266.78.0
Chi27.7853.2703.6111.6295.0131.5518.4172.820
p-value0.02030.19490.16430.44270.08150.46030.01480.2440
Source: own research.

