Interpretation and Evaluation of Electrical Lighting in Plant Factories with Ray-Tracing Simulation and 3D Plant Modeling
Abstract
1. Introduction
2. Materials and Methods
2.1. Plant Material and Growth Environment
2.2. Measurements of Light Intensity and Canopy Photosynthesis
2.3. Construction of 3D-Scanned Plant Models
2.4. Ray-Tracing Simulation
2.5. Calculation of Photosynthetic Rate from Simulation Results
2.6. Scenarios
2.7. Statistical Analysis
3. Results and Discussion
3.1. D-scanned Plant Model
3.2. Evaluation of Ray-Tracing Simulation and Photosynthesis Estimation
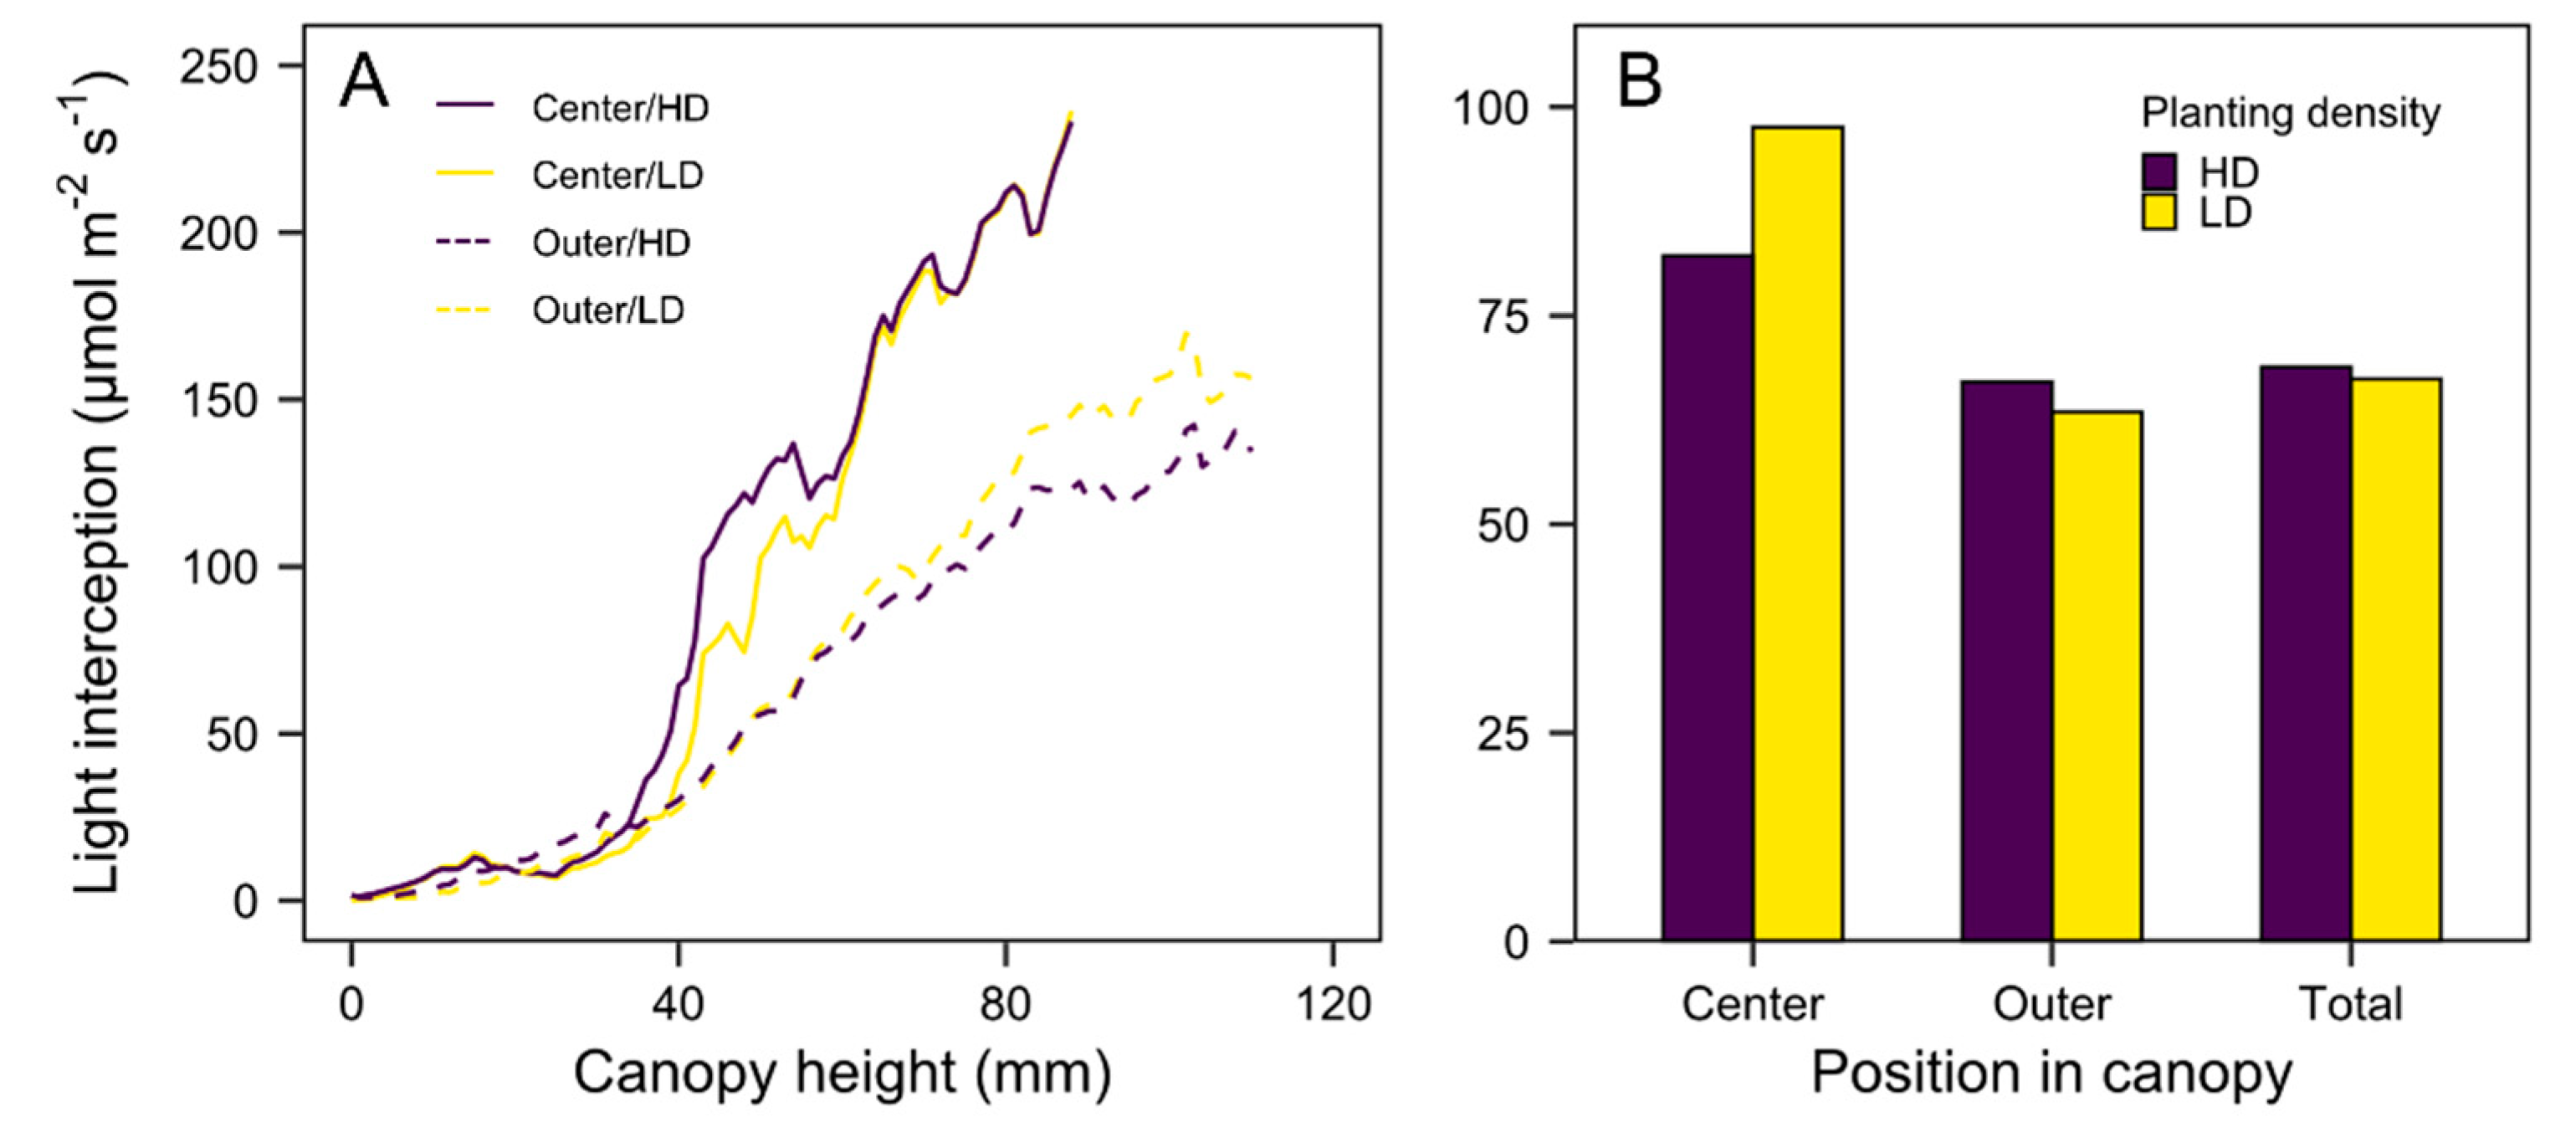
3.3. Quantification of Light Interception in the Growth Chamber Environment
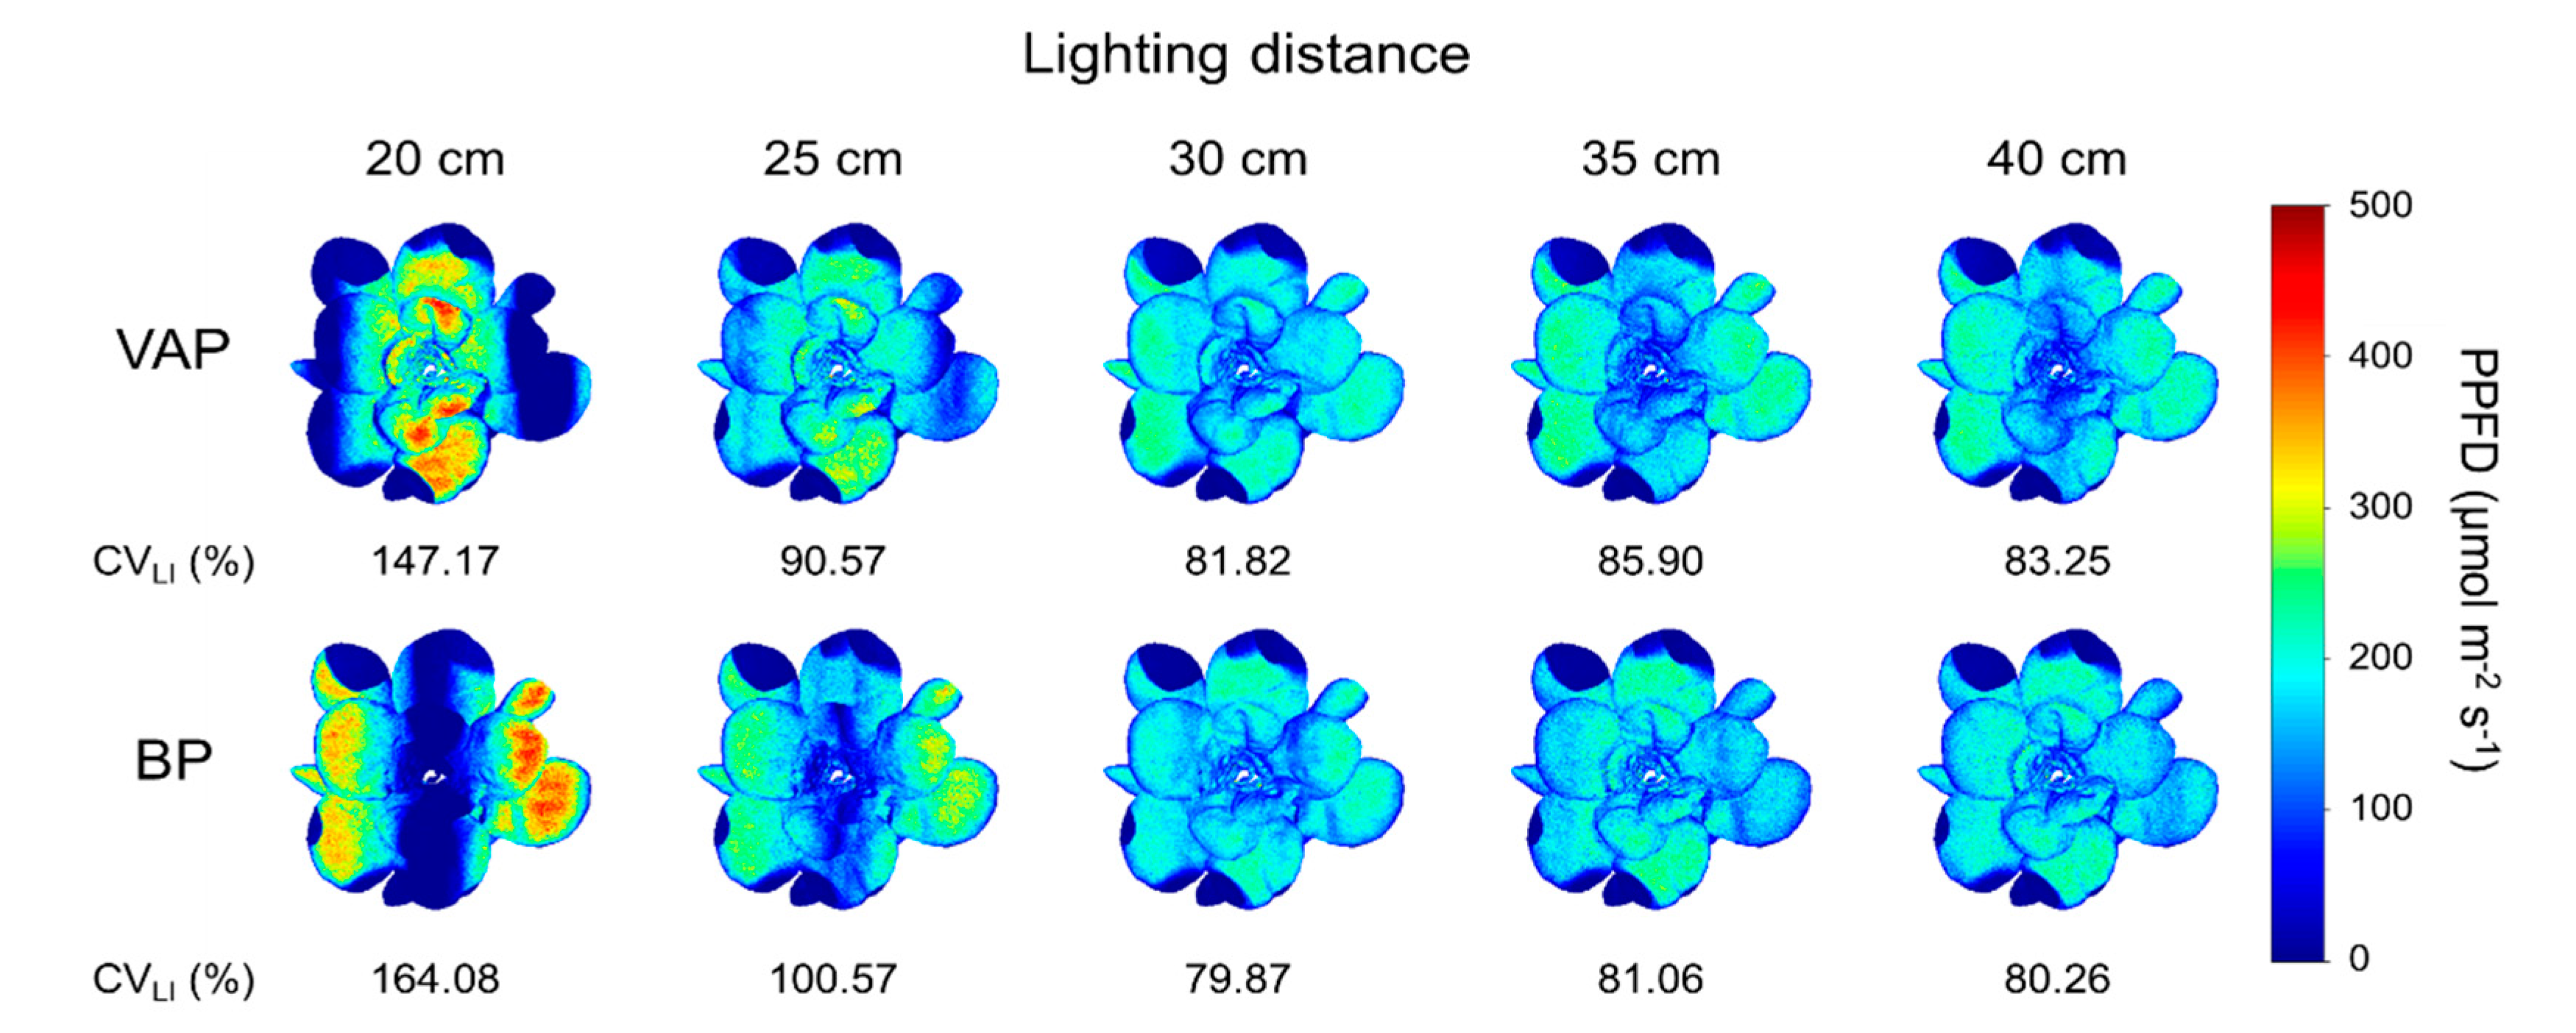
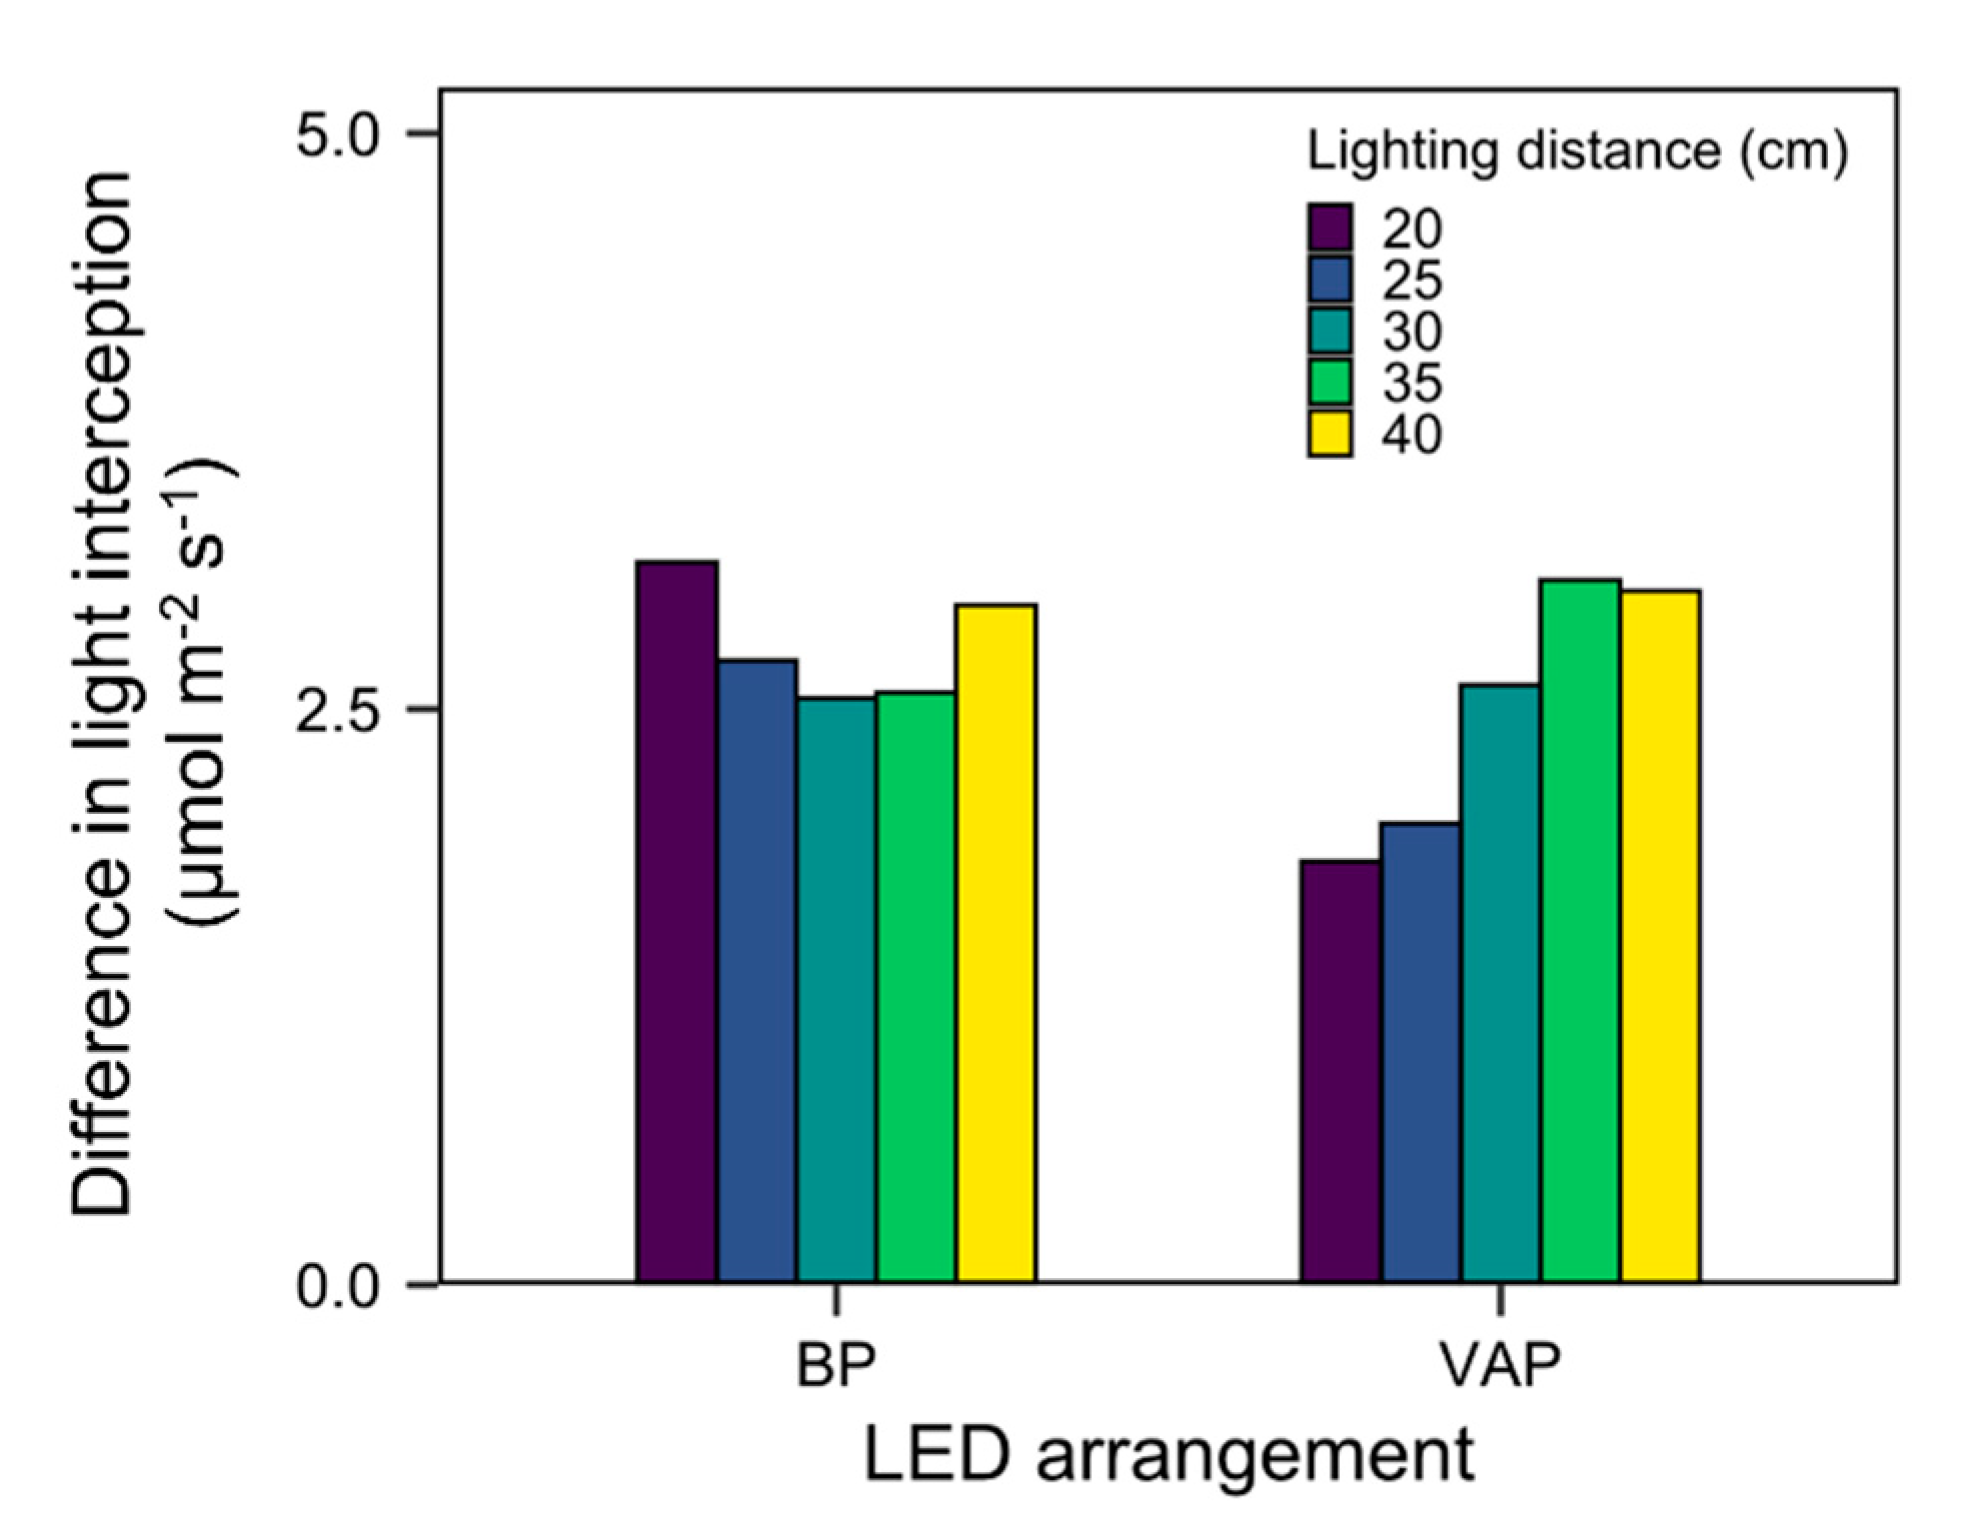
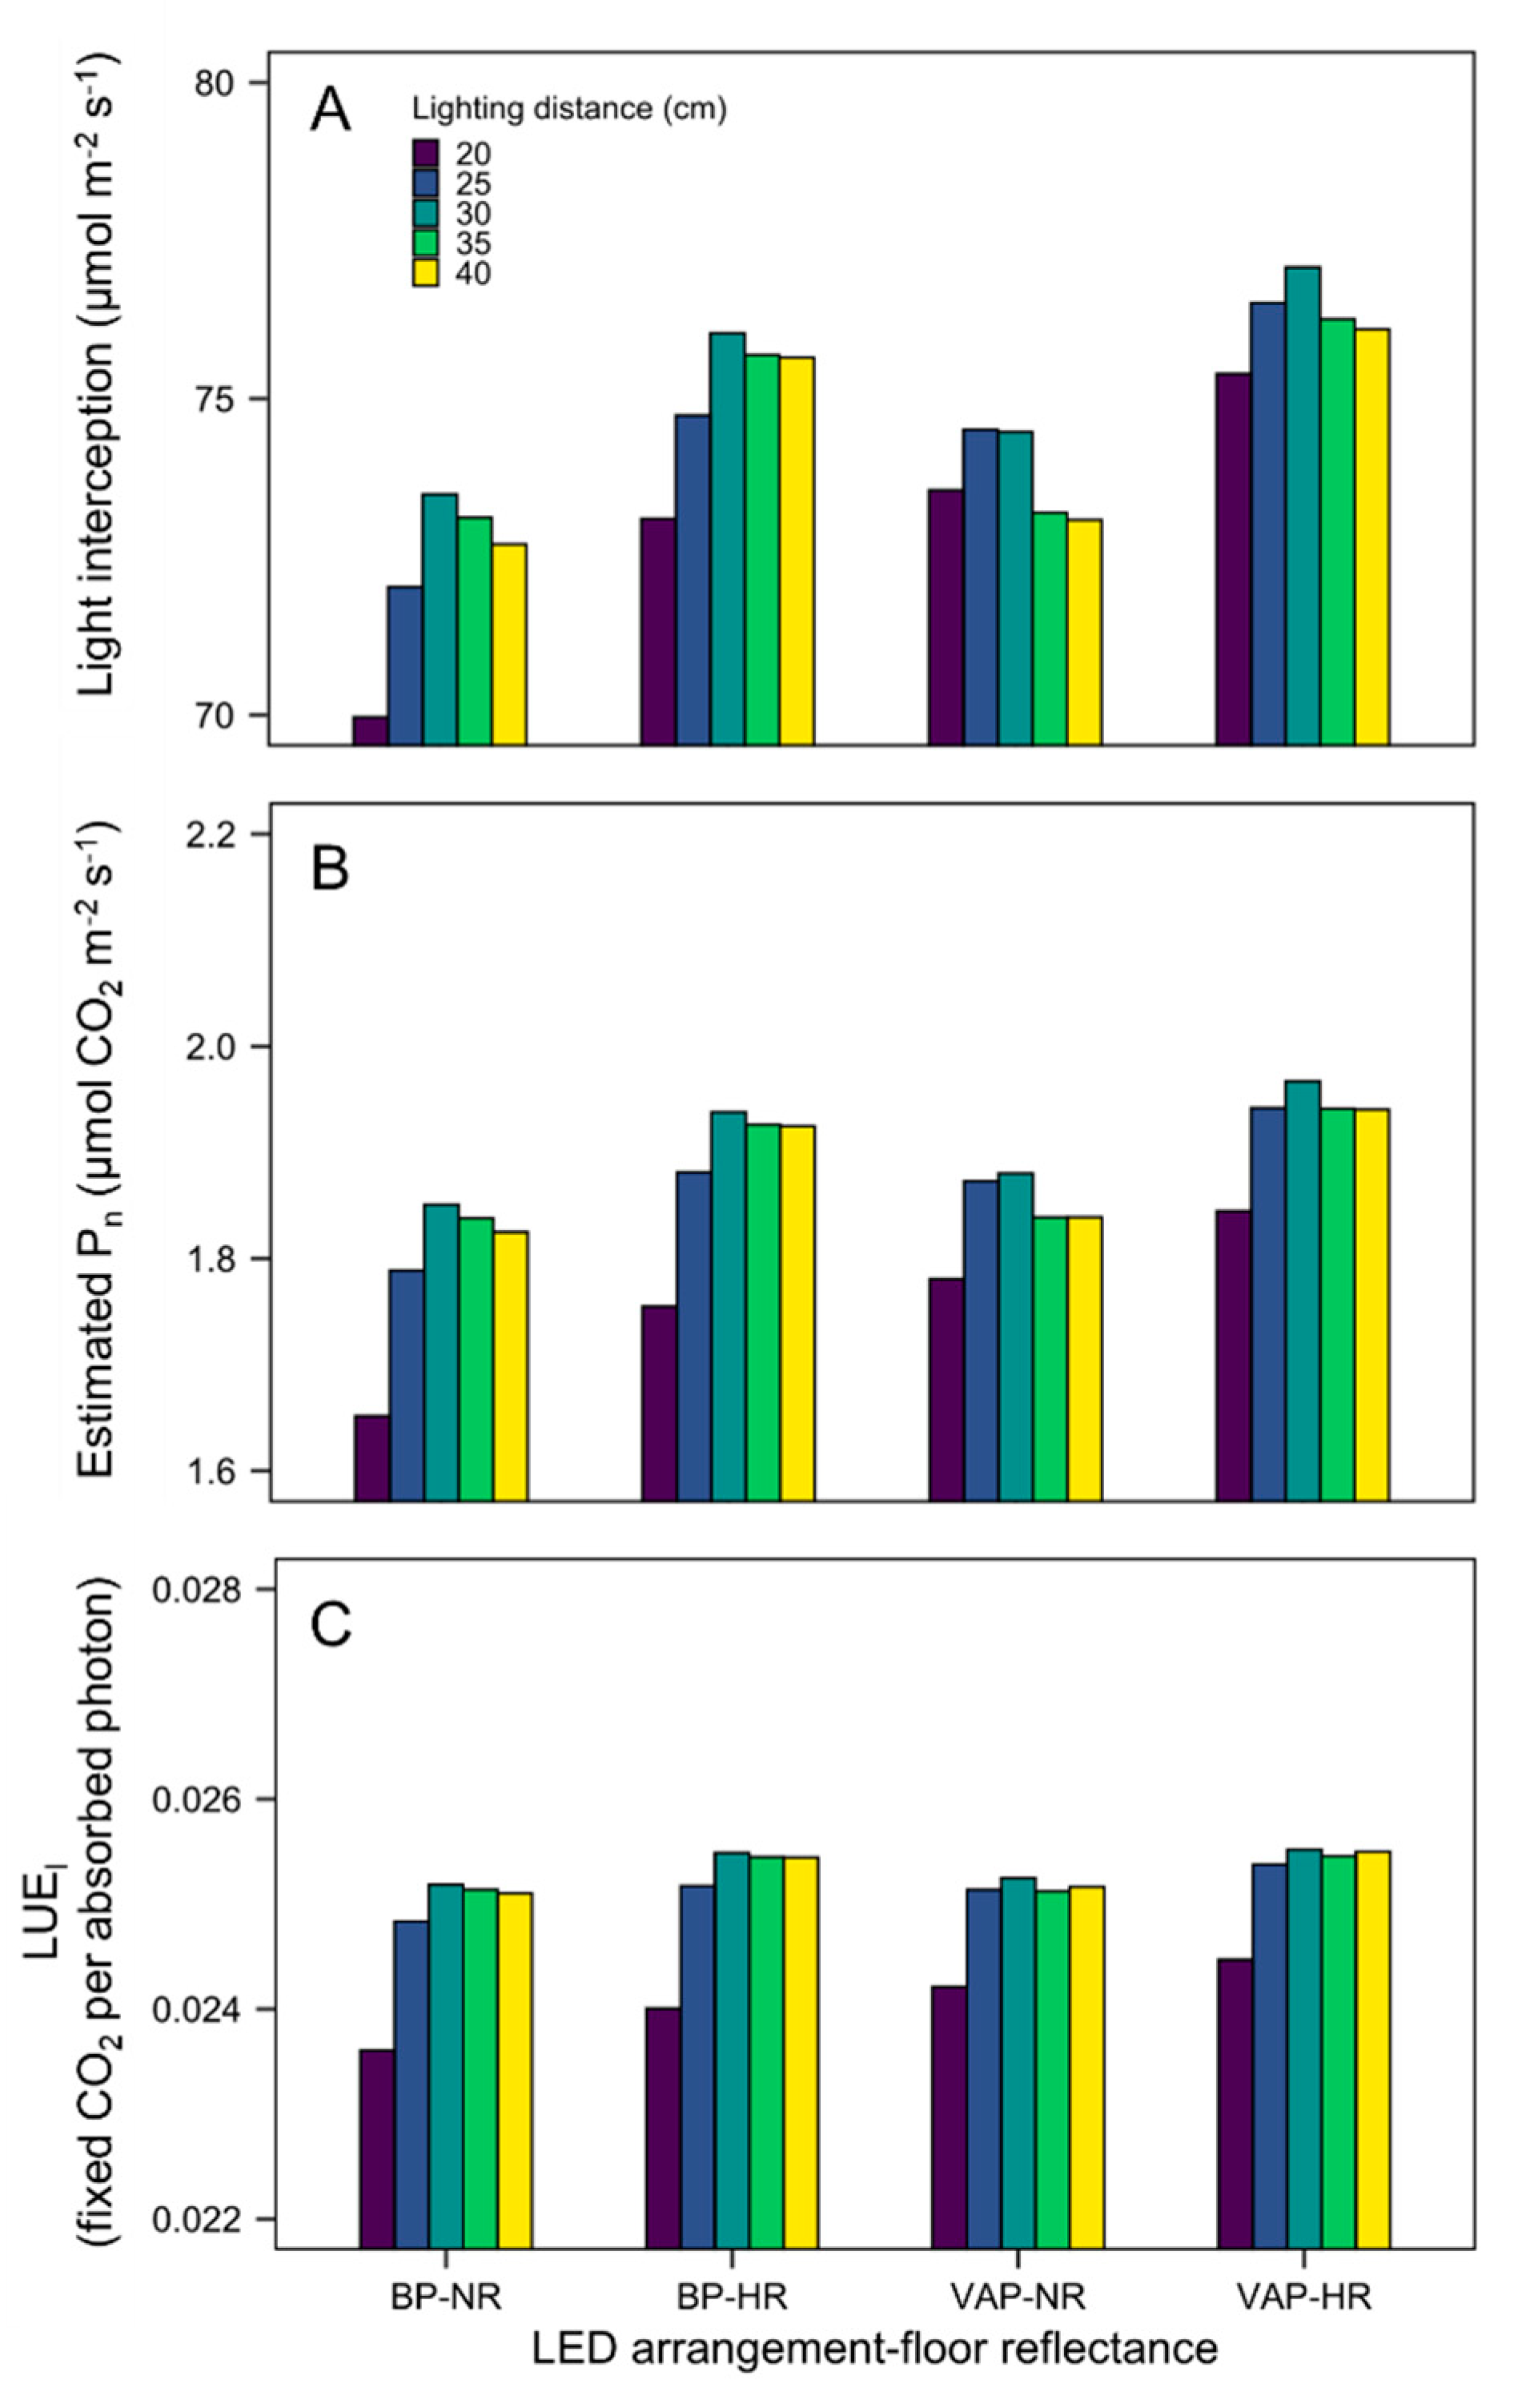
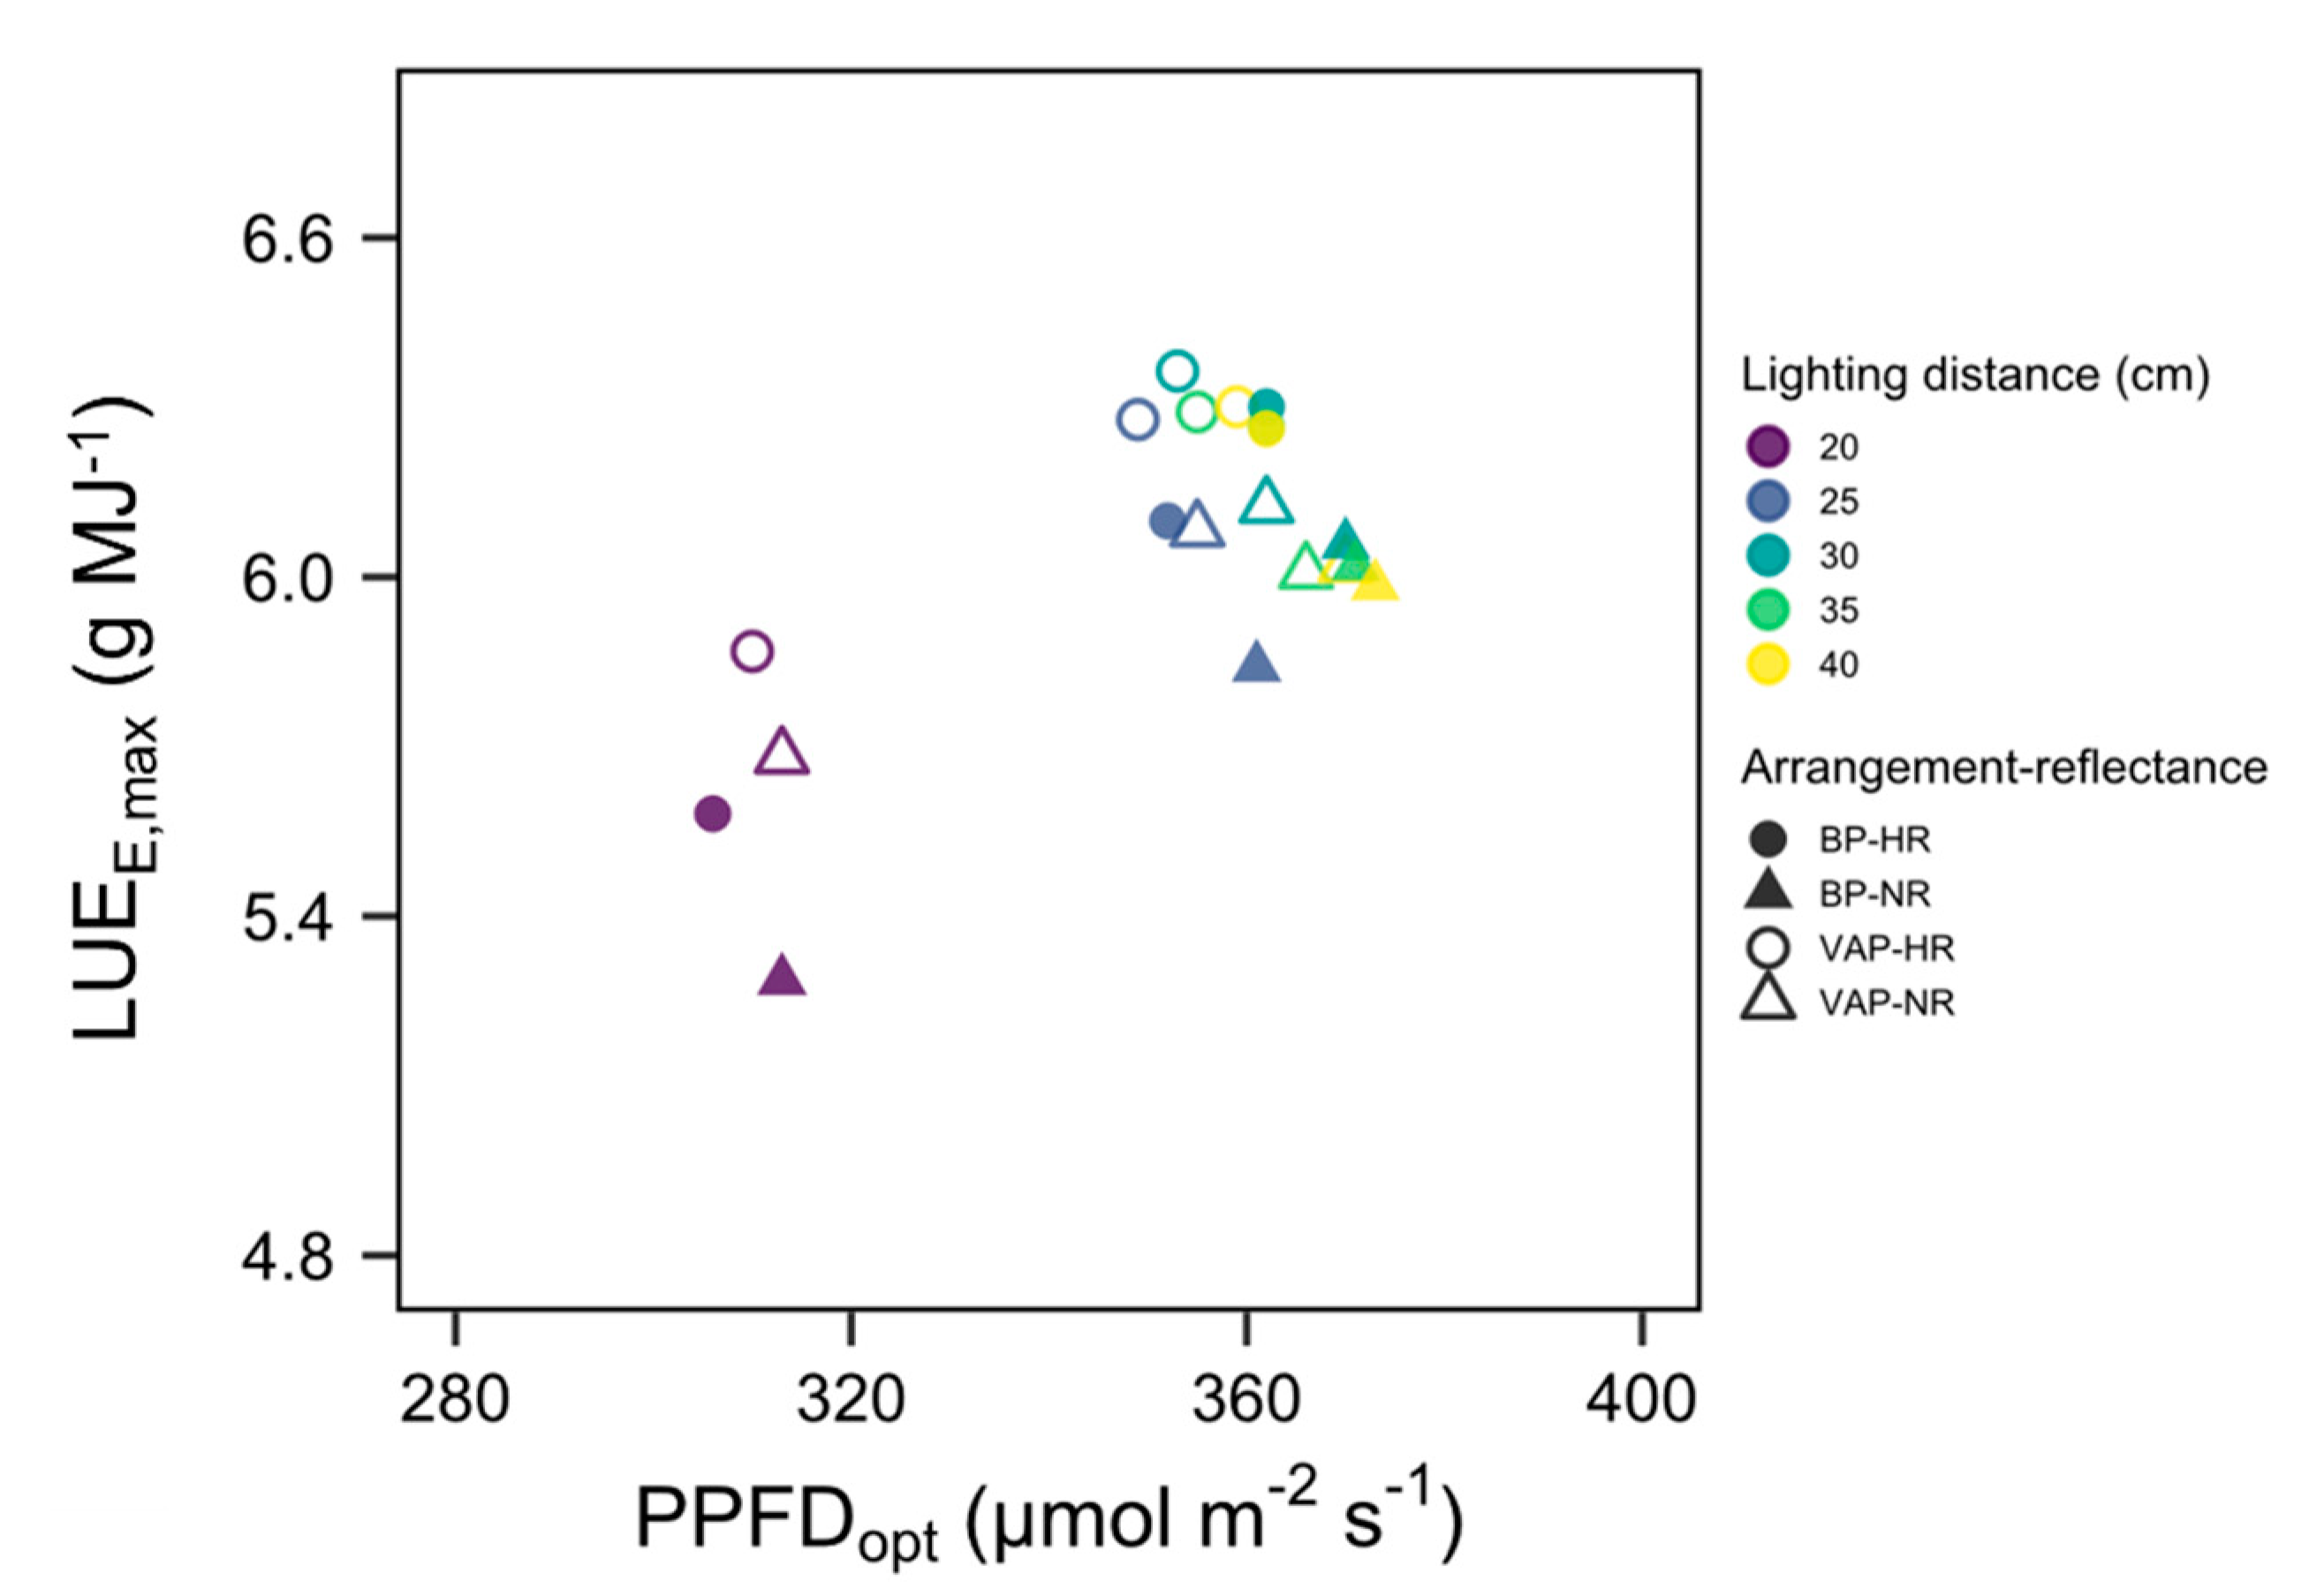
3.4. Scenario
3.5. Applicability and Limitations
4. Conclusions
Author Contributions
Funding
Conflicts of Interest
References
- Despommier, D. The vertical farm: Controlled environment agriculture carried out in tall buildings would create greater food safety and security for large urban populations. J. Verbrauch. Leb. 2011, 6, 233–236. [Google Scholar] [CrossRef]
- Kozai, T. Resource use efficiency of closed plant production system with artificial light: Concept, estimation and application to plant factory. Proc. Jpn. Acad. Ser. B 2013, 89, 447–461. [Google Scholar] [CrossRef]
- Graamans, L.; van den Dobbelsteen, A.; Meinen, E.; Stanghellini, C. Plant factories; crop transpiration and energy balance. Agric. Syst. 2017, 153, 138–147. [Google Scholar] [CrossRef]
- SharathKumar, M.; Heuvelink, E.; Marcelis, L.F.M. Vertical farming: Moving from genetic to environmental modification. Trends Plant Sci. 2020, 25, 724–727. [Google Scholar] [CrossRef] [PubMed]
- Pattison, P.M.; Tsao, J.Y.; Brainard, G.C.; Bugbee, B. LEDs for photons, physiology and food. Nature 2018, 563, 493–500. [Google Scholar] [CrossRef] [PubMed]
- Ohyama, K. Actual management conditions on a large-scale plant factory with artificial lighting. JGHA Prot. Hortic. 2015, 168, 30–33. [Google Scholar]
- Graamans, L.; Baeza, E.; van den Dobbelsteen, A.; Tsafaras, I.; Stanghellini, C. Plant factories versus greenhouses: Comparison of resource use efficiency. Agric. Syst. 2018, 160, 31–43. [Google Scholar] [CrossRef]
- Poulet, L.; Massa, G.D.; Morrow, R.C.; Bourget, C.M.; Wheeler, R.M.; Mitchell, C.A. Significant reduction in energy for plant-growth lighting in space using targeted LED lighting and spectral manipulation. Life Sci. Sp. Res. 2014, 2, 43–53. [Google Scholar] [CrossRef]
- Li, K.; Li, Z.; Yang, Q. Improving light distribution by zoom lens for electricity savings in a plant factory with light-emitting diodes. Front. Plant Sci. 2016, 7, 92. [Google Scholar] [CrossRef]
- Zhang, G.; Shen, S.; Takagaki, M.; Kozai, T.; Yamori, W. Supplemental upward lighting from underneath to obtain higher marketable lettuce (Lactuca sativa) leaf fresh weight by retarding senescence of outer leaves. Front. Plant Sci. 2015, 6, 1110. [Google Scholar] [CrossRef]
- Vos, J.; Evers, J.B.; Buck-Sorlin, G.H.; Andrieu, B.; Chelle, M.; de Visser, P.H.B. Functional–structural plant modelling: A new versatile tool in crop science. J. Exp. Bot. 2010, 61, 2101–2115. [Google Scholar] [CrossRef] [PubMed]
- Sievänen, R.; Godin, C.; DeJong, T.M.; Nikinmaa, E. Functional–structural plant models: A growing paradigm for plant studies. Ann. Bot. 2014, 114, 599–603. [Google Scholar] [CrossRef] [PubMed]
- Buck-Sorlin, G.; de Visser, P.H.; Henke, M.; Sarlikioti, V.; van der Heijden, G.W.; Marcelis, L.F.; Vos, J. Towards a functional-structural plant model of cut-rose: Simulation of light environment, light absorption, photosynthesis and interference with the plant structure. Ann. Bot. 2011, 108, 1121–1134. [Google Scholar] [CrossRef] [PubMed]
- Sarlikioti, V.; de Visser, P.H.; Marcelis, L.F. Exploring the spatial distribution of light interception and photosynthesis of canopies by means of a functional-structural plant model. Ann. Bot. 2011, 107, 875–883. [Google Scholar] [CrossRef]
- de Visser, P.H.B.; Buck-Sorlin, G.H.; van der Heijden, G.W.A.M. Optimizing illumination in the greenhouse using a 3D model of tomato and a ray tracer. Front. Plant Sci. 2014, 5, 48. [Google Scholar] [CrossRef]
- Kim, J.H.; Lee, J.W.; Ahn, T.I.; Shin, J.H.; Park, K.S.; Son, J.E. Sweet Pepper (Capsicum annuum L.) Canopy Photosynthesis Modeling Using 3D Plant Architecture and Light Ray-Tracing. Front. Plant Sci. 2016, 7, 1321. [Google Scholar] [CrossRef]
- Jung, D.; Lee, J.; Kang, W.; Hwang, I.; Son, J. Estimation of whole plant photosynthetic rate of irwin mango under artificial and natural lights using a three-dimensional plant model and ray-tracing. Int. J. Mol. Sci. 2018, 19, 152. [Google Scholar] [CrossRef]
- Kim, D.; Kang, W.H.; Hwang, I.; Kim, J.; Kim, J.H.; Park, K.S.; Son, J.E. Use of structurally-accurate 3D plant models for estimating light interception and photosynthesis of sweet pepper (Capsicum annuum) plants. Comput. Electron. Agric. 2020, 177, 105689. [Google Scholar] [CrossRef]
- Burgess, A.J.; Retkute, R.; Pound, M.P.; Foulkes, J.; Preston, S.P.; Jensen, O.E.; Pridmore, T.P.; Murchie, E.H. High-resolution three-dimensional structural data quantify the impact of photoinhibition on long-term carbon gain in wheat canopies in the field. Plant Physiol. 2015, 169, 1192–1204. [Google Scholar] [CrossRef]
- Burgess, A.J.; Retkute, R.; Herman, T.; Murchie, E.H. Exploring relationships between canopy architecture, light distribution, and photosynthesis in contrasting rice genotypes using 3D canopy reconstruction. Front. Plant Sci. 2017, 8. [Google Scholar] [CrossRef]
- Townsend, A.J.; Retkute, R.; Chinnathambi, K.; Randall, J.W.P.P.; Foulkes, J.; Carmo-Silva, E.; Murchie, E.H. Suboptimal Acclimation of Photosynthesis to Light in Wheat Canopies. Plant Physiol. 2018, 176, 1233–1246. [Google Scholar] [CrossRef] [PubMed]
- Zhu, B.; Liu, F.; Xie, Z.; Guo, Y.; Li, B.; Ma, Y. Quantification of light interception within image-based 3D reconstruction of sole and intercropped canopies over the entire growth season. Ann. Bot. 2020, 1–12. [Google Scholar] [CrossRef]
- Hitz, T.; Henke, M.; Graeff-Hönninger, S.; Munz, S. Three-dimensional simulation of light spectrum and intensity within an LED growth chamber. Comput. Electron. Agric. 2019, 156, 540–548. [Google Scholar] [CrossRef]
- Qian, T.; Elings, A.; Dieleman, J.A.; Gort, G.; Marcelis, L.F.M. Estimation of photosynthesis parameters for a modified Farquhar–von Caemmerer–Berry model using simultaneous estimation method and nonlinear mixed effects model. Environ. Exp. Bot. 2012, 82, 66–73. [Google Scholar] [CrossRef]
- Evans, J.R. Photosynthesis and nitrogen relationships in leaves of C3 plants. Oecologia 1989, 78, 9–19. [Google Scholar] [CrossRef]
- Wullschleger, S.D. Biochemical limitations to carbon assimilation in C3 plants—A retrospective analysis of the A/Ci curves from 109 species. J. Exp. Bot. 1993, 44, 907–920. [Google Scholar] [CrossRef]
- Trouwborst, G.; Oosterkamp, J.; Hogewoning, S.W.; Harbinson, J.; van Ieperen, W. The responses of light interception, photosynthesis and fruit yield of cucumber to LED-lighting within the canopy. Physiol. Plant. 2010, 138, 289–300. [Google Scholar] [CrossRef]
- Hitz, T.; Henke, M.; Graeff-Honninger, S.; Munz, S. Simulating light spectrum within a soybean canopy in an LED growth chamber. In Proceedings of the 2018 6th International Symposium on Plant Growth Modeling, Simulation, Visualization and Applications (PMA), Hefei, China, 4–8 November 2018; pp. 120–125. [Google Scholar] [CrossRef]
- Prieto, J.A.; Louarn, G.; Perez Peña, J.; Ojeda, H.; Simonneau, T.; Lebon, E. A functional–structural plant model that simulates whole- canopy gas exchange of grapevine plants (Vitis vinifera L.) under different training systems. Ann. Bot. 2019, 1–14. [Google Scholar] [CrossRef]
- Henke, M.; Buck-Sorlin, G.H. Using a full spectral raytracer for calculating light microclimate in functional-structural plant modelling. Comput. Inform. 2017, 36, 1492–1522. [Google Scholar] [CrossRef]
- Kozai, T.; Ohyama, K.; Chun, C. Commercialized closed systems with artificial lighting for plant production. Acta Hortic. 2006, 61–70. [Google Scholar] [CrossRef]
- Hogewoning, S.W.; Trouwborst, G.; Harbinson, J.; Ieperen, W. Light distribution in leaf chambers and its consequences for photosynthesis measurements. Photosynthetica 2010, 48, 219–226. [Google Scholar] [CrossRef]
- Zhang, X.; He, D.; Niu, G.; Yan, Z.; Song, J. Effects of environment lighting on the growth, photosynthesis, and quality of hydroponic lettuce in a plant factory. Int. J. Agric. Biol. Eng. 2018, 11, 33–40. [Google Scholar] [CrossRef]
- Chen, X.; Yang, Q.; Song, W.; Wang, L.; Guo, W.; Xue, X. Growth and nutritional properties of lettuce affected by different alternating intervals of red and blue LED irradiation. Sci. Hortic. 2017, 223, 44–52. [Google Scholar] [CrossRef]


© 2020 by the authors. Licensee MDPI, Basel, Switzerland. This article is an open access article distributed under the terms and conditions of the Creative Commons Attribution (CC BY) license (http://creativecommons.org/licenses/by/4.0/).
Share and Cite
Kim, J.; Kang, W.H.; Son, J.E. Interpretation and Evaluation of Electrical Lighting in Plant Factories with Ray-Tracing Simulation and 3D Plant Modeling. Agronomy 2020, 10, 1545. https://doi.org/10.3390/agronomy10101545
Kim J, Kang WH, Son JE. Interpretation and Evaluation of Electrical Lighting in Plant Factories with Ray-Tracing Simulation and 3D Plant Modeling. Agronomy. 2020; 10(10):1545. https://doi.org/10.3390/agronomy10101545
Chicago/Turabian StyleKim, Jaewoo, Woo Hyun Kang, and Jung Eek Son. 2020. "Interpretation and Evaluation of Electrical Lighting in Plant Factories with Ray-Tracing Simulation and 3D Plant Modeling" Agronomy 10, no. 10: 1545. https://doi.org/10.3390/agronomy10101545
APA StyleKim, J., Kang, W. H., & Son, J. E. (2020). Interpretation and Evaluation of Electrical Lighting in Plant Factories with Ray-Tracing Simulation and 3D Plant Modeling. Agronomy, 10(10), 1545. https://doi.org/10.3390/agronomy10101545


