Article

Interpretation and Evaluation of Electrical Lighting in Plant Factories with Ray-Tracing Simulation and 3D Plant Modeling

1
Department of Agriculture, Forest and Bioresources (Horticultural Science and Biotechnology), Seoul National University, Seoul 08826, Korea
2
Research Institute of Agriculture and Life Sciences, Seoul National University, Seoul 08826, Korea
*
Author to whom correspondence should be addressed.
Agronomy 2020, 10(10), 1545; https://doi.org/10.3390/agronomy10101545
Submission received: 3 September 2020 / Revised: 30 September 2020 / Accepted: 8 October 2020 / Published: 11 October 2020
(This article belongs to the Special Issue Role of Vertical Farming in Modern Horticultural Crop Production)

Abstract

:
In plant factories, light is fully controllable for crop production but involves a cost. For efficient lighting, light use efficiency (LUE) should be considered as part of light environment design. The objectives of this study were to evaluate and interpret the light interception, photosynthetic rate, and LUE of lettuces under electrical lights using ray-tracing simulation. The crop architecture model was constructed by 3D scanning, and ray-tracing simulation was used to interpret light interception and photosynthesis. For evaluation of simulation reliability, measured light intensities and photosynthetic rates in a growth chamber were compared with those obtained by simulation at different planting densities. Under several scenarios modeling various factors affecting light environments, changes in light interception and LUE were interpreted. The light intensities and photosynthetic rates obtained by simulation showed good agreement with the measured values, with R2 > 0.86. With decreasing planting density, the light interception of the central plant increased by approximately 18.7%, but that of neighboring plants decreased by approximately 5.5%. Under the various scenarios, shorter lighting distances induced more heterogenetic light distribution on plants and caused lower light interception. Under a homogenous light distribution, the light intensity was optimal at approximately 360 μmol m−2 s−1 with an LUE of 6.5 g MJ−1. The results of this study can provide conceptual insights into the design of light environments in plant factories.

1. Introduction

Light is one of the most important environmental factors driving photosynthesis and growth. In this respect, full control of the light environments of plant factories with electrical lights (PFELs) has the advantages of stable year-round crop production, along with high productivity and quality [1,2,3,4]. Meanwhile, despite the continuous increase in the luminous efficacy of light sources such as LEDs [5], electrical energy consumption for lighting is a major burden for operating commercial PFELs. Electrical energy occupies the largest part of the operation cost, and most of the electrical energy consumption comes from lighting rather than other energy loads, such as heating, cooling, or dehumidification, in PFELs [6,7].
One solution for improving light use efficiency (LUE) is to optimize the light environment to maximize crop photosynthesis. To achieve this purpose, the light distribution in cultivating areas in PFELs can be modified by changing the spatial disposition of the light source when using the same light source or the same usable energy. Targeted lighting by adjacent LED positioning [8] and concentration on effective cultivation areas have been shown to reduce electrical energy loss [9], and supplementary upward lighting for lower light-scarce leaves increases the yield of lettuce, which results in an increase in LUE [10]. However, despite the validity of lighting modifications in improving LUE, there have been few studies concerning the application of this improved lighting method to PFELs, possibly due to the large time, labor and financial cost required for actual cultivation in various light environments. Although previous studies have shown the effect of lighting modification on growth and yield, the effects on intermediate processes between lighting and plant growth, such as light interception and photosynthesis, remain unknown. To clarify the potential effect of lighting modifications on growth and yield, these processes should be considered.
The use of a modeling approach with functional-structural plant models (FSPMs), which describe the plant response to environmental factors by integrating physiological sub-models and plant structure models, can provide good explanations [11,12]. To link the change in the light environment to LUE, various elements should be considered, such as spatial light distribution in the cultivation space, light interception of the plant canopy, and physiological processes that convert light interception to photosynthesis. Several studies have adopted FSPMs to describe these elements, especially by combining ray-tracing simulation with virtual plant models [13,14,15,16,17,18].
In elucidating the influence of light environments on light interception, precise plant structures for virtual plant models are considered to be one of the crucial factors [19]. Kim [18] reported that the light interception and photosynthesis of structurally inaccurate leaf models with low curvature were overestimated compared to those of accurate models. Thus, virtual plant models need to precisely reflect the actual structure to ensure the reliability of prediction. In this respect, image-based 3D reconstruction, which directly extracts the plant structure from 2D or 3D images, is widely used to construct elaborate virtual plant models [20,21,22]. Meanwhile, despite the importance of the light environment design and improvement of LUE, few studies have introduced FSPMs to interpret light interception in PFELs. Recently, Hitz [23] simulated various lighting angles and spectral power distributions for electrical lights in a plant growth chamber and explicitly found the validity of ray-tracing simulation in PFELs. However, the uses of structurally accurate plant models and interpretations of LUE under various light environments in PFELs are still limited.
The objectives of this study were to reproduce a realistic light environment in a growth chamber with 3D lettuce plant models in a virtual scene, to quantitatively estimate light interception and photosynthesis, to evaluate them by comparison with actual measurements, and to determine the impact of lighting design on light interception and photosynthesis.

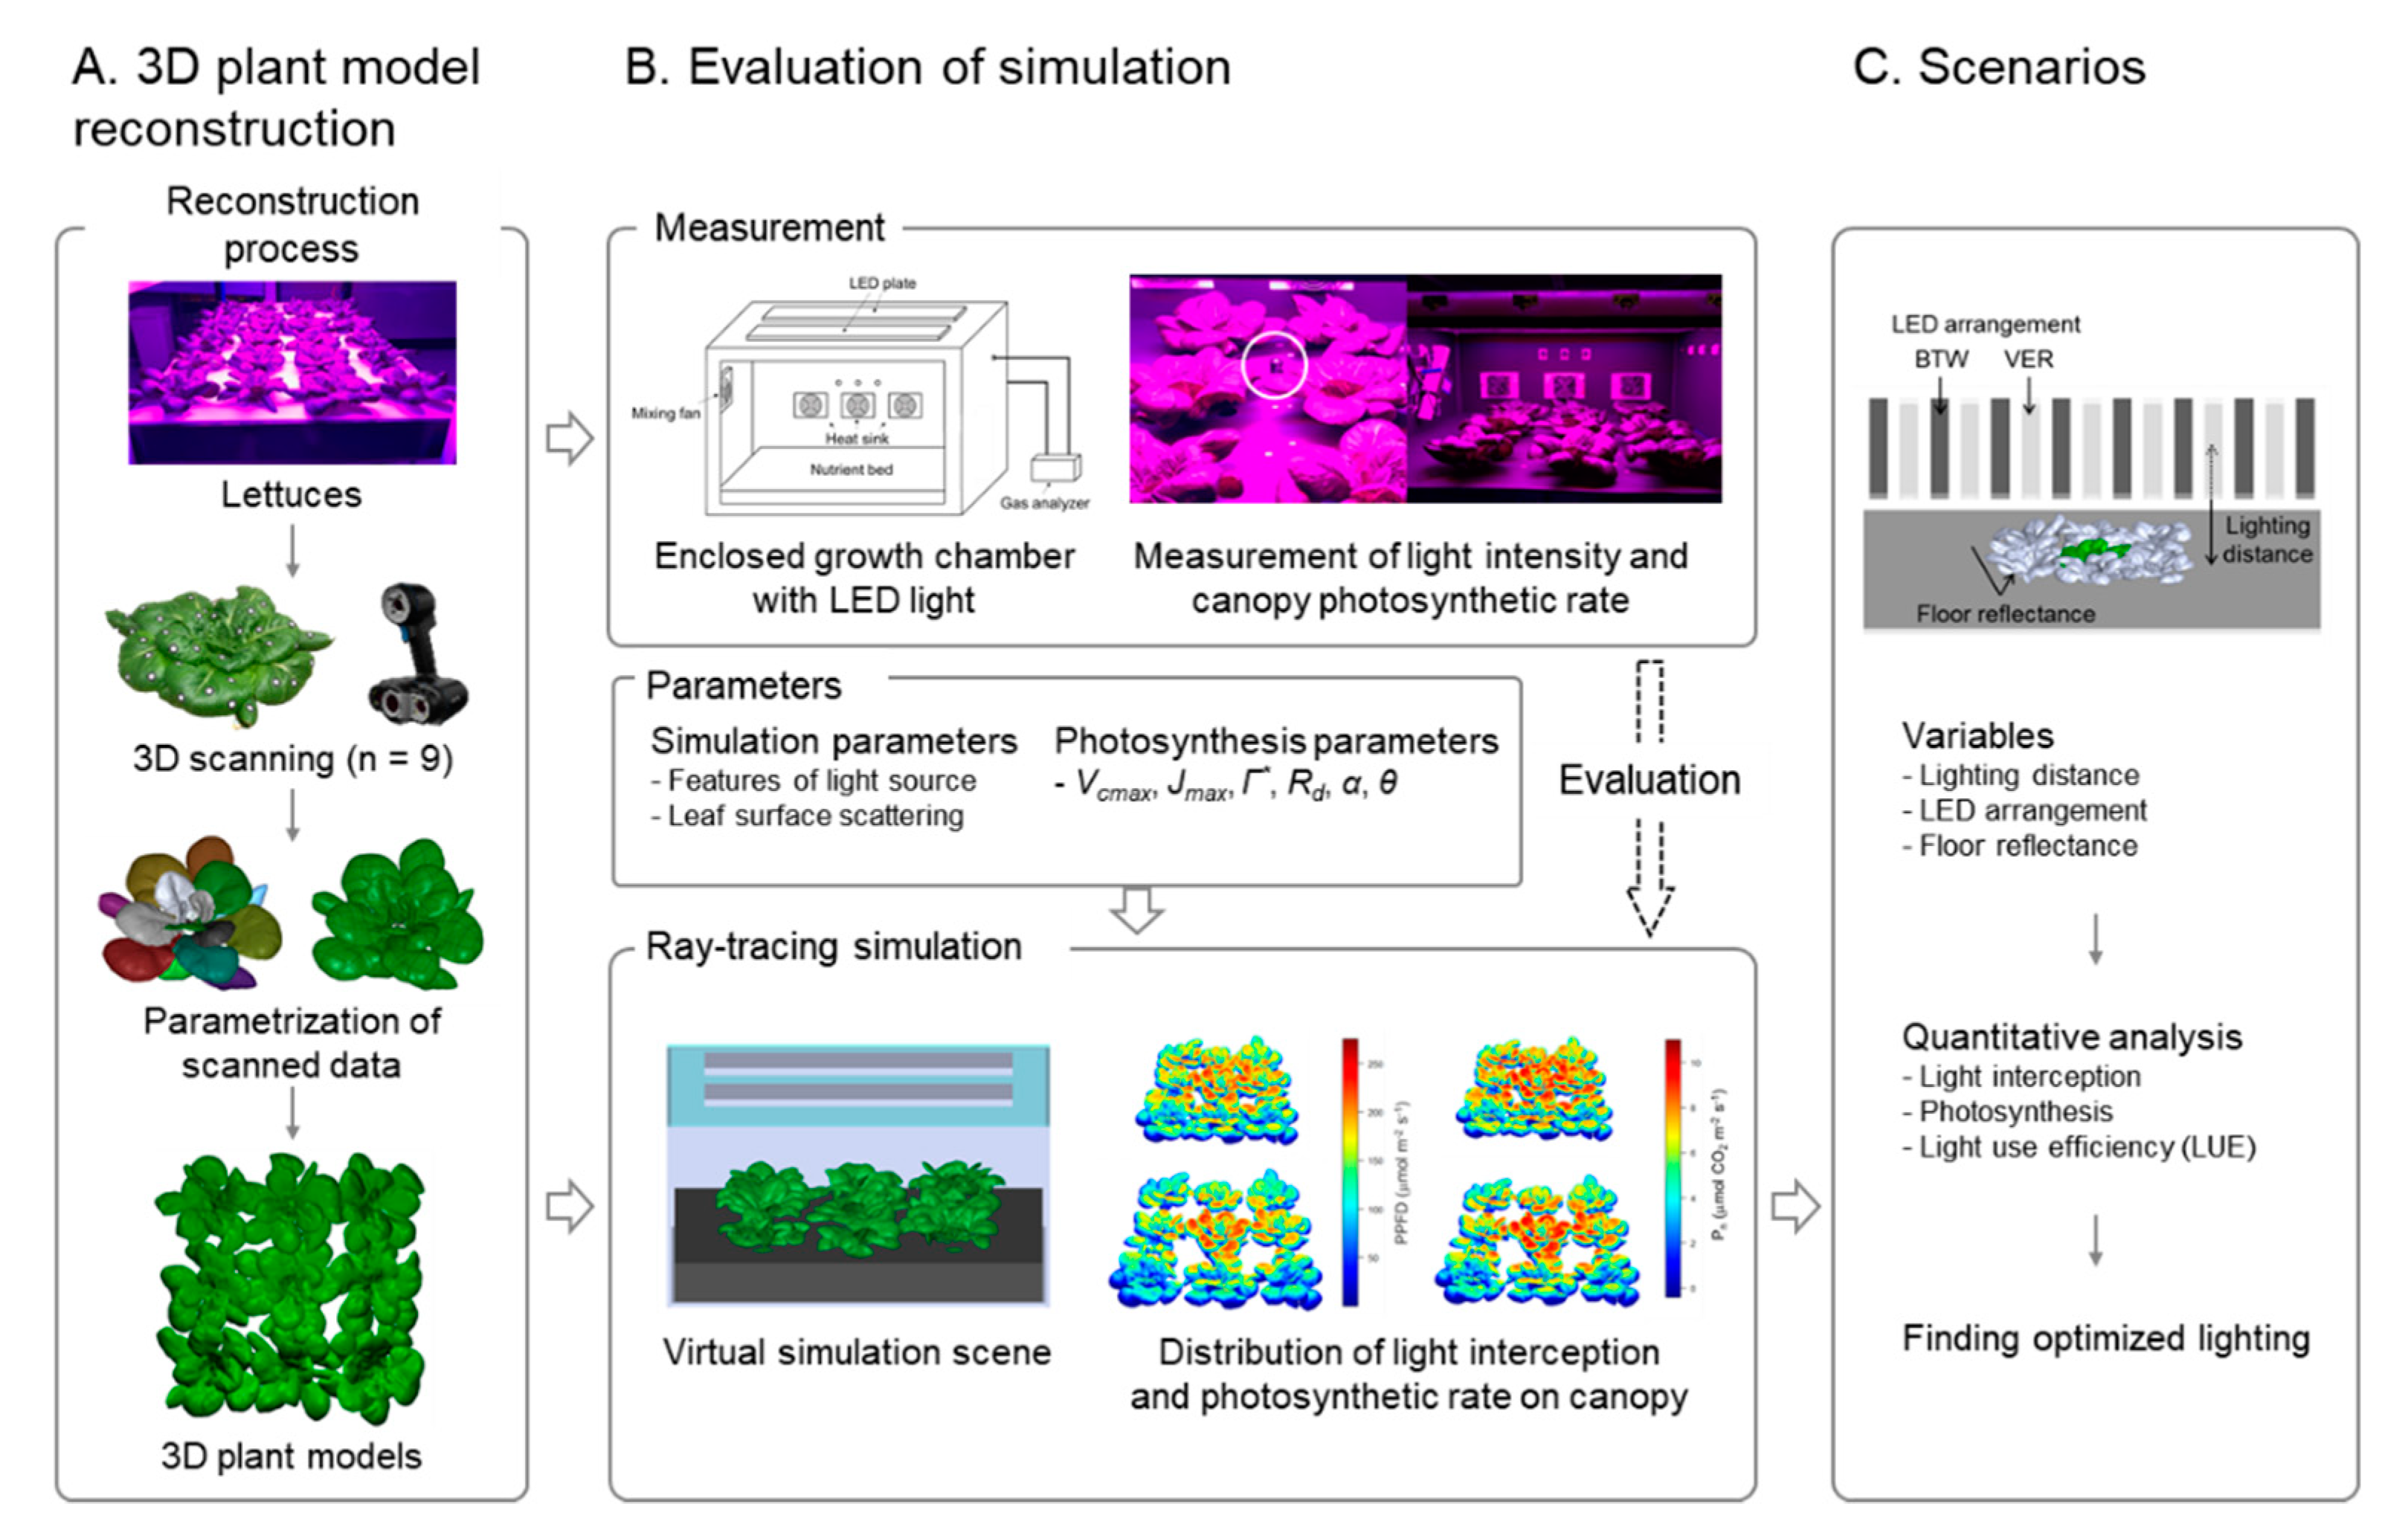
2. Materials and Methods

2.1. Plant Material and Growth Environment

Lettuce (Lactuca sativa L., cv. Asia Heuk Romaine) seeds were sown in polyurethane cubes, and seedlings were grown by the deep flow technique (DFT) under fluorescence tubes (FL40EX-D, Kumho Electric Vina. Inc, Vietnam) with a photosynthetic photon flux density (PPFD) of 200 ± 10 μmol m−2 s−1 in a plant factory system. After 3 weeks, the plants were transplanted to the DFT system with a planting density of 25 plants m−2. After transplanting, LED plates with an 8:2 ratio of red and blue were used as the light source with a PPFD of 200 ± 10 μmol m−2 s−1. Yamazaki nutrient solution (Yamazaki, 1982) was used with electrical conductivities (ECs) of 0.6 ± 0.05 and 1.2 ± 0.05 dS m−1 for two-week-old seedlings and after transplanting, respectively. The temperature and photoperiod were set at 22 °C and 16/8 h (day/night), respectively. Lettuce plants 21 days after transplanting (DAT) were selected and used for experiments.

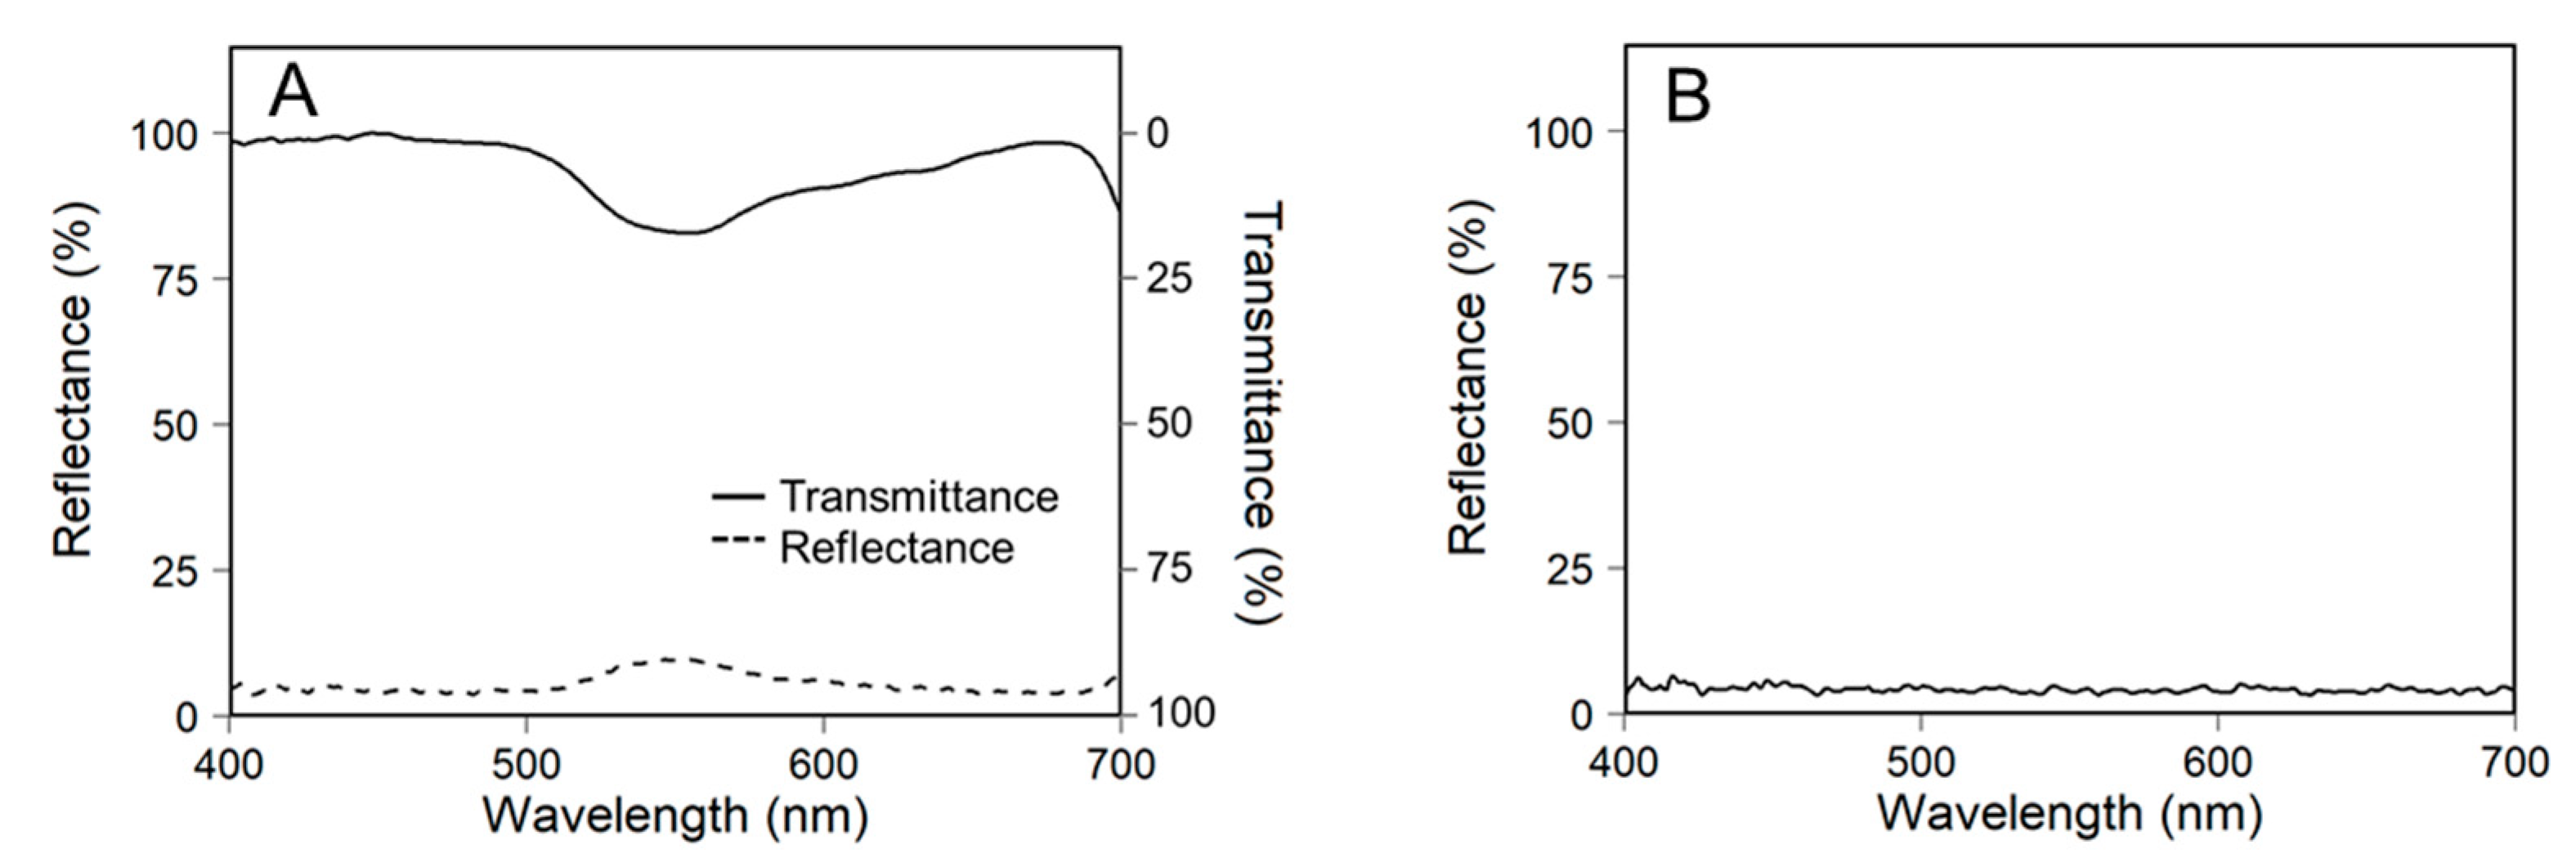
2.2. Measurements of Light Intensity and Canopy Photosynthesis

A closed growth chamber (100 × 80 × 50 cm) was used to measure the light intensity distribution and whole canopy photosynthetic rate (Figure 1B). An acryl plate was used for the ceiling of the growth chamber for light penetration, and the inner surface was covered with a uniform black board to normalize the reflected light. Two LED plates (80 × 16 × 2 cm, Seoul Semiconductor Co., Ansan, Korea) were positioned on the growth chamber with an 8:2 ratio of red and blue LEDs. For precise simulation setting, the datum point for measuring PPFD was fixed in the central position of the bed. The plants were arranged in 3 × 3 isotropic form with a high planting density (HD) of 25 plants m−2 and a low planting density (LD) of 16 plants m−2.
For alternatives for light interception that cannot actually be measured, light intensities at several points were used as an indirect index to describe the accuracy of estimated canopy light interception. PPFD was set at 200 μmol m−2 s−1, and light intensity was measured by a light meter (LI-250A, LI-COR, Lincoln, NE, USA) in both the empty and canopy-arranged growth chamber at fixed points. To investigate whether the lighting power and distribution were well set in the simulation, light intensities were first compared in an empty chamber without plant models at 16 different positions with 3 height-levels from the floor. With the lettuce plants in the chamber, light intensities were only measured on the floor because the measurement through the plant canopy can cause disaccord with simulation by touching.
The net photosynthetic rate (Pn) of the whole canopy was measured by a gas analyzer (LI-840A, LI-COR, Lincoln, NE, USA) connected to the growth chamber. To obtain the Pn, the growth chamber was enclosed, the change in CO2 concentration was monitored every second from 800 to 400 μmol mol−1, and the difference in CO2 concentration averaged over 3 min was used to calculate the whole canopy photosynthetic rate. PPFD was set at 100, 200, and 300 μmol m−2 s−1. The temperature was set to 22 °C, and the range of relative air humidity was 60%–80% in the growth chamber. Air leakage from the growth chamber was measured at CO2 concentrations above 1000 μmol mol−1, and the number of air exchanges was 0.0016 h−1, which was used to calibrate the photosynthetic rate.

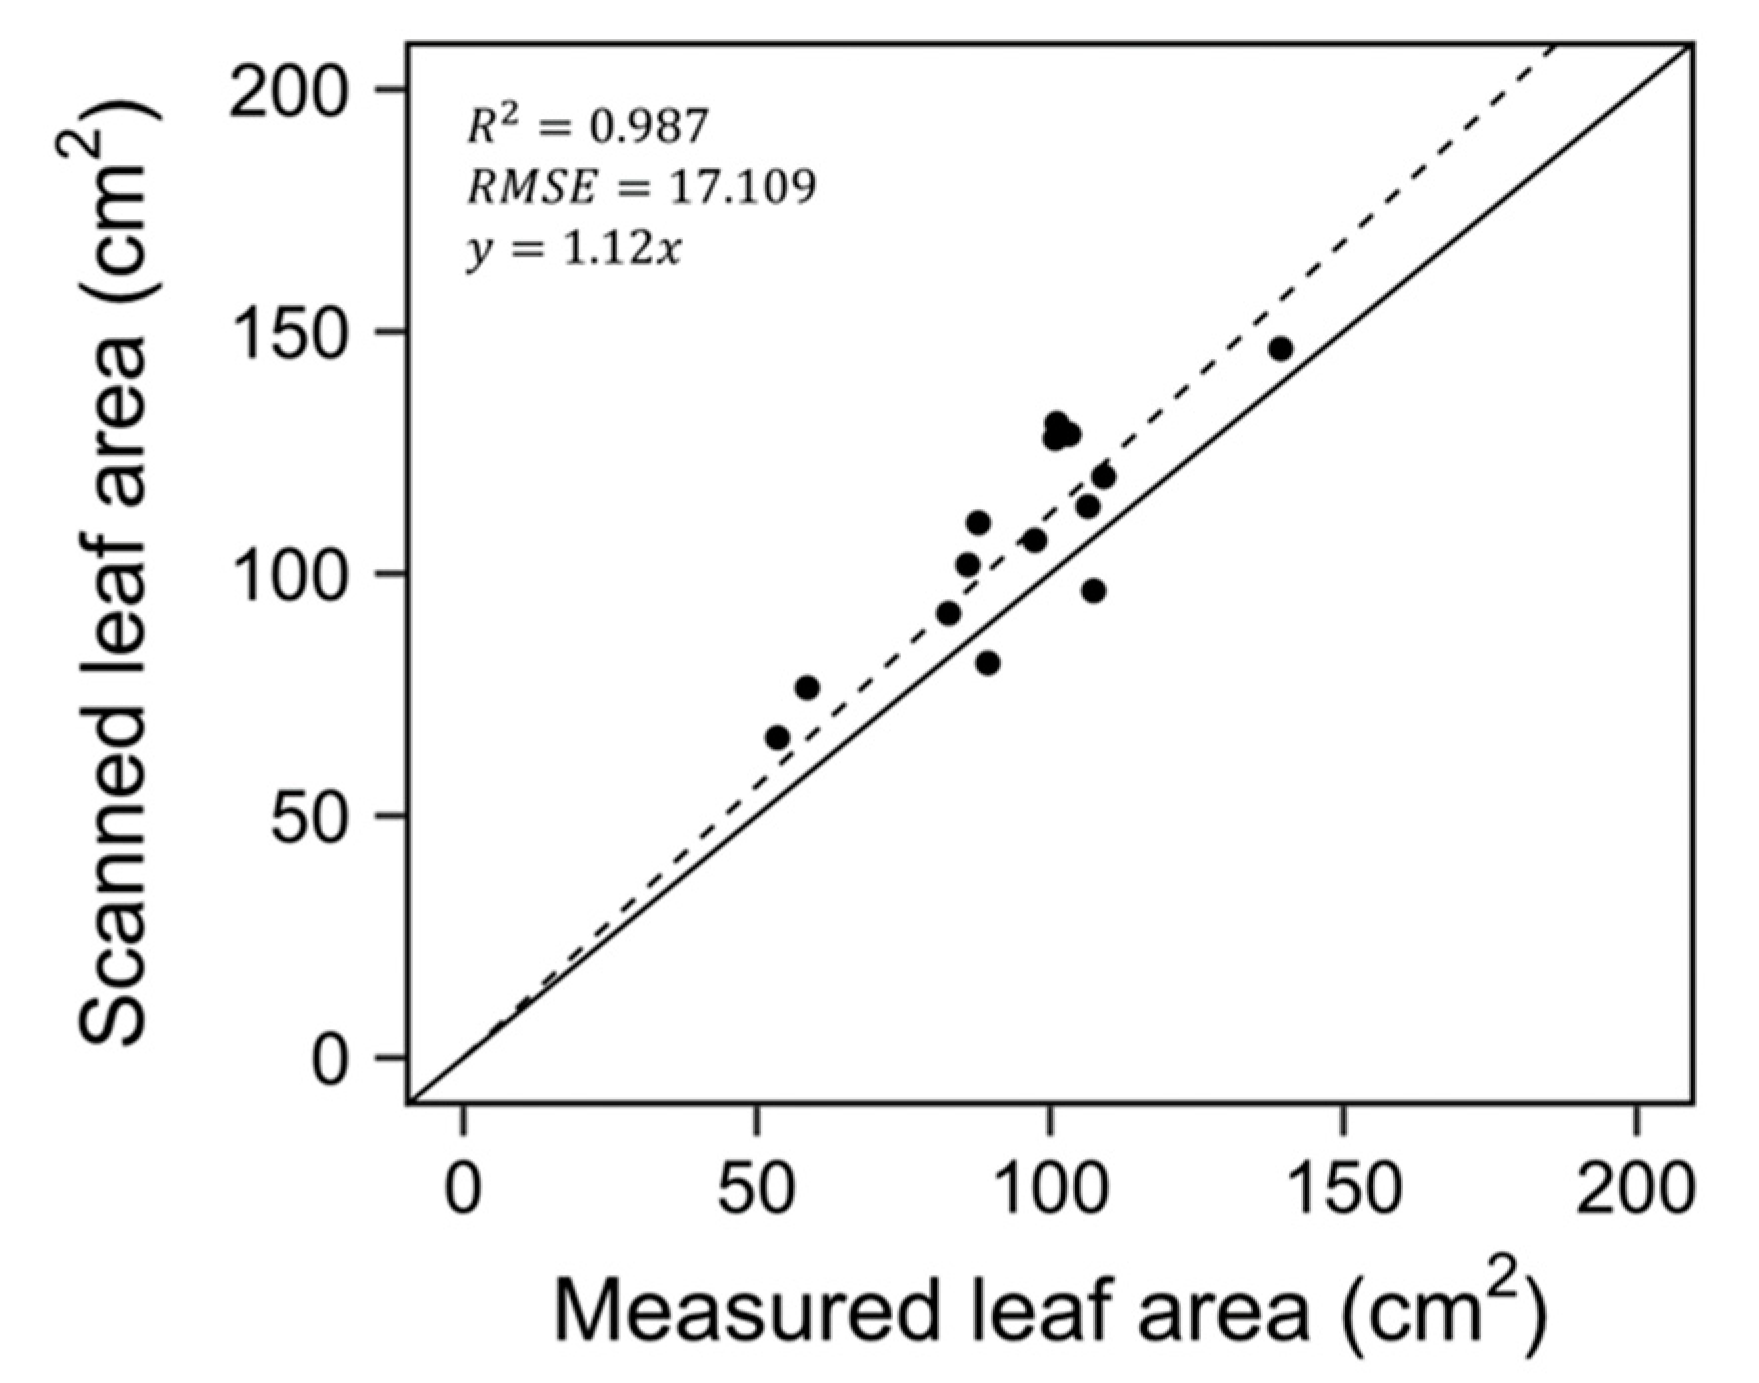
2.3. Construction of 3D-Scanned Plant Models

The lettuces used for the above measurements were directly scanned to reconstruct a 3D-scanned plant model (3D-SPM, Figure 1A) with a high-resolution portable 3D-scanner (GO! SCAN50TM, Creaform, Lévis, Quebec, Canada). The resolution of the scanner was set at 2 mm. Because inner and overlapping leaves are difficult for the 3D scanner to recognize, each leaf was scanned separately. A total of nine lettuces were scanned, and leaves smaller than 2 cm in length were neglected. After scanning, scan data were incorporated into the original plant structure based on positioning information using scan software (Vxelement, Creaform, Lévis, Quebec, Canada). The holes and noises of the 3D mesh data were fixed, and the 3D mesh was reconstructed to the surface model by reverse engineering software (Geomagic Design X, 3D Systems, Rock Hill, SC, USA) to perform ray-tracing simulations.
To determine the model’s validity, leaf areas from scanned data were compared with measured samples. Leaf areas of a lettuce (14 in total) were photographed and quantified with ImageJ software (National Institutes of Health, Bethesda, MD, USA).

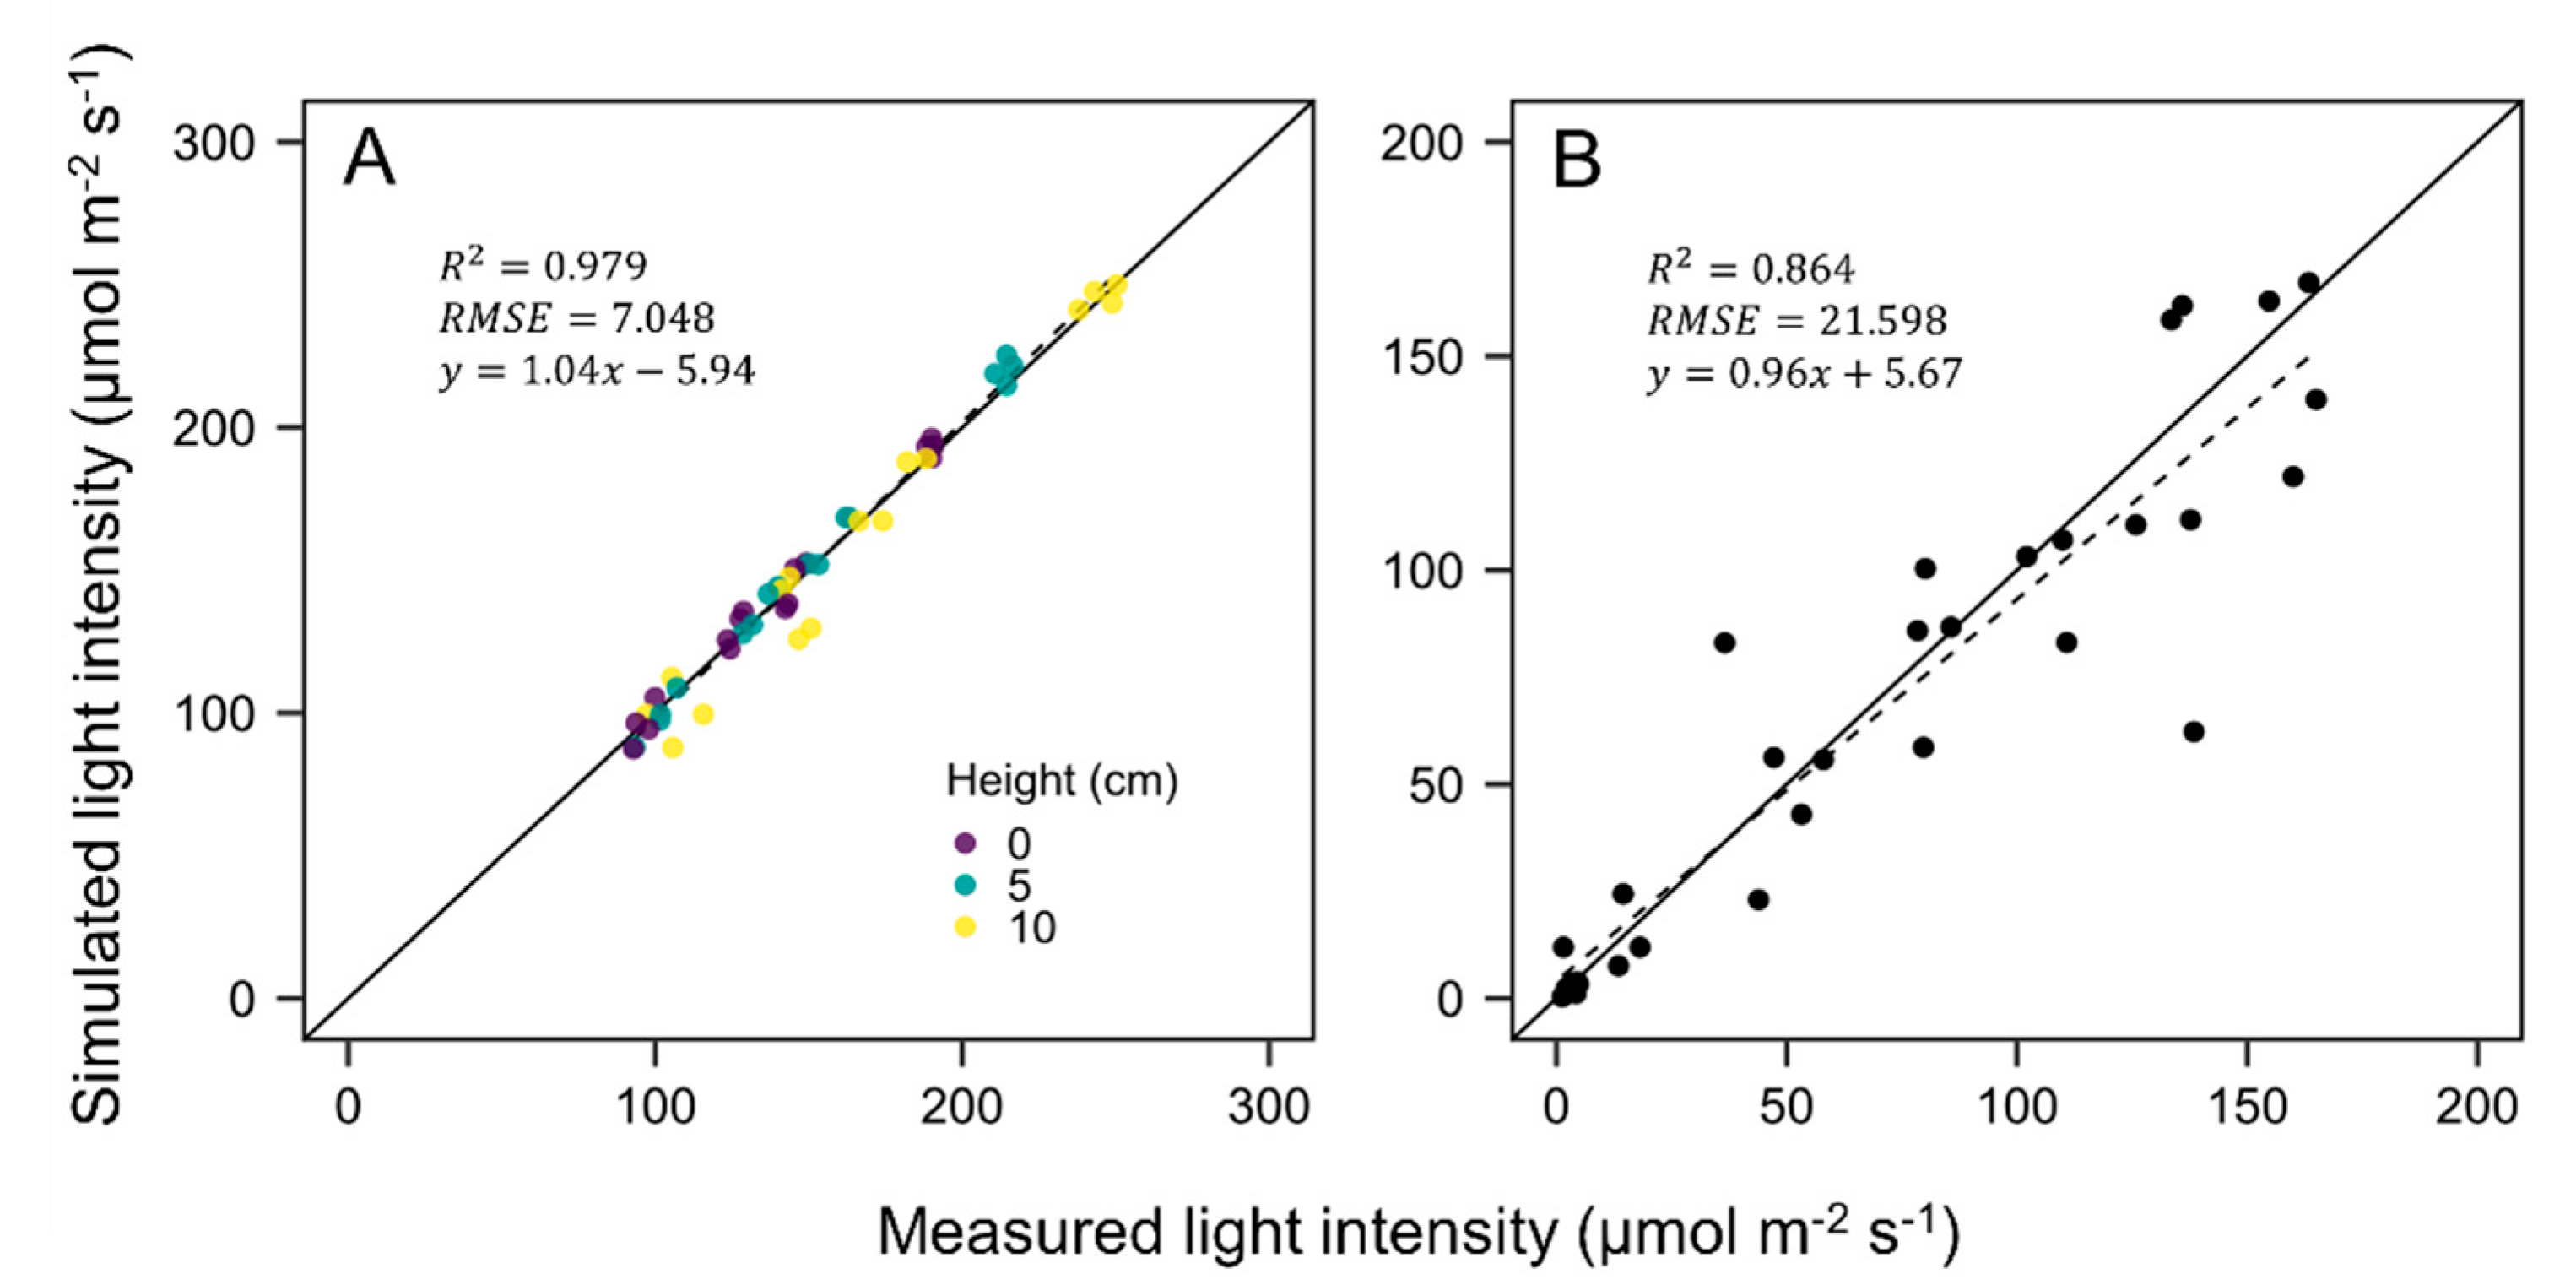
2.4. Ray-Tracing Simulation

To set the optical properties in ray-tracing simulation, the transmittance and reflectance of the leaf and chamber surface were measured with a spectroradiometer (BLUE-Wave Spectrometer, StellarNet Inc., Tampa, FL, USA) (Figure 2). Because leaf optical properties for different ages or positions showed no differences, the average value of three points was used. The transmittance of the black board was neglected, and the ceiling of the chamber was set as a fully permeable material. Optical properties in the range of 400 to 700 nm were applied in the simulation, considering the spectrum range of the LED used.
To perform ray-tracing simulation, the virtual growth chamber and LED plate were reconstructed (Figure 1B) based on the dimensions measured by 3D computer-aided design software (Solidworks, Dassault Systèmes, Vélizy-Villacoublay, France). A total of 640 red LED chips and 96 blue LED chips were mounted on the LED plate, considering dimensions and patterns. For each LED chip, spectral distributions of red and blue LEDs were measured with a spectroradiometer at 1-nm intervals for spectral power distribution (SPD) settings, and for physical light distribution (PLD), a Lambertian distribution with an angle of 60° was set.
After virtual growth chamber setting, 3D-SPMs were placed in the virtual growth chamber to perform ray-tracing simulation (Figure 1B) with the observed rotation angle and position. To compare the measured light intensity with the simulated light intensity, virtual light sensors were placed on the light measurement points.
The ray-tracing simulation was performed using ray-tracing software (OPTISWORKS, OPTIS Inc., La Farlède, France). The total number of rays emitted was set to 200 million, considering the model size. To match the PPFD in the virtual growth chamber with the actual environment, a cylinder-shaped detector was modeled based on the quantum sensor dimension and placed on the datum point. LED outputs were set to 0.009, 0.018, and 0.027 W for red LED chips and 0.02175, 0.0435, and 0.06525 W for blue LED chips, representing PPFDs of 100, 200, and 300 μmol m−2 s−1, respectively. The total photosynthetic photon fluxes emitted were 79.3, 158.6, and 237.9 μmol s−1, respectively.

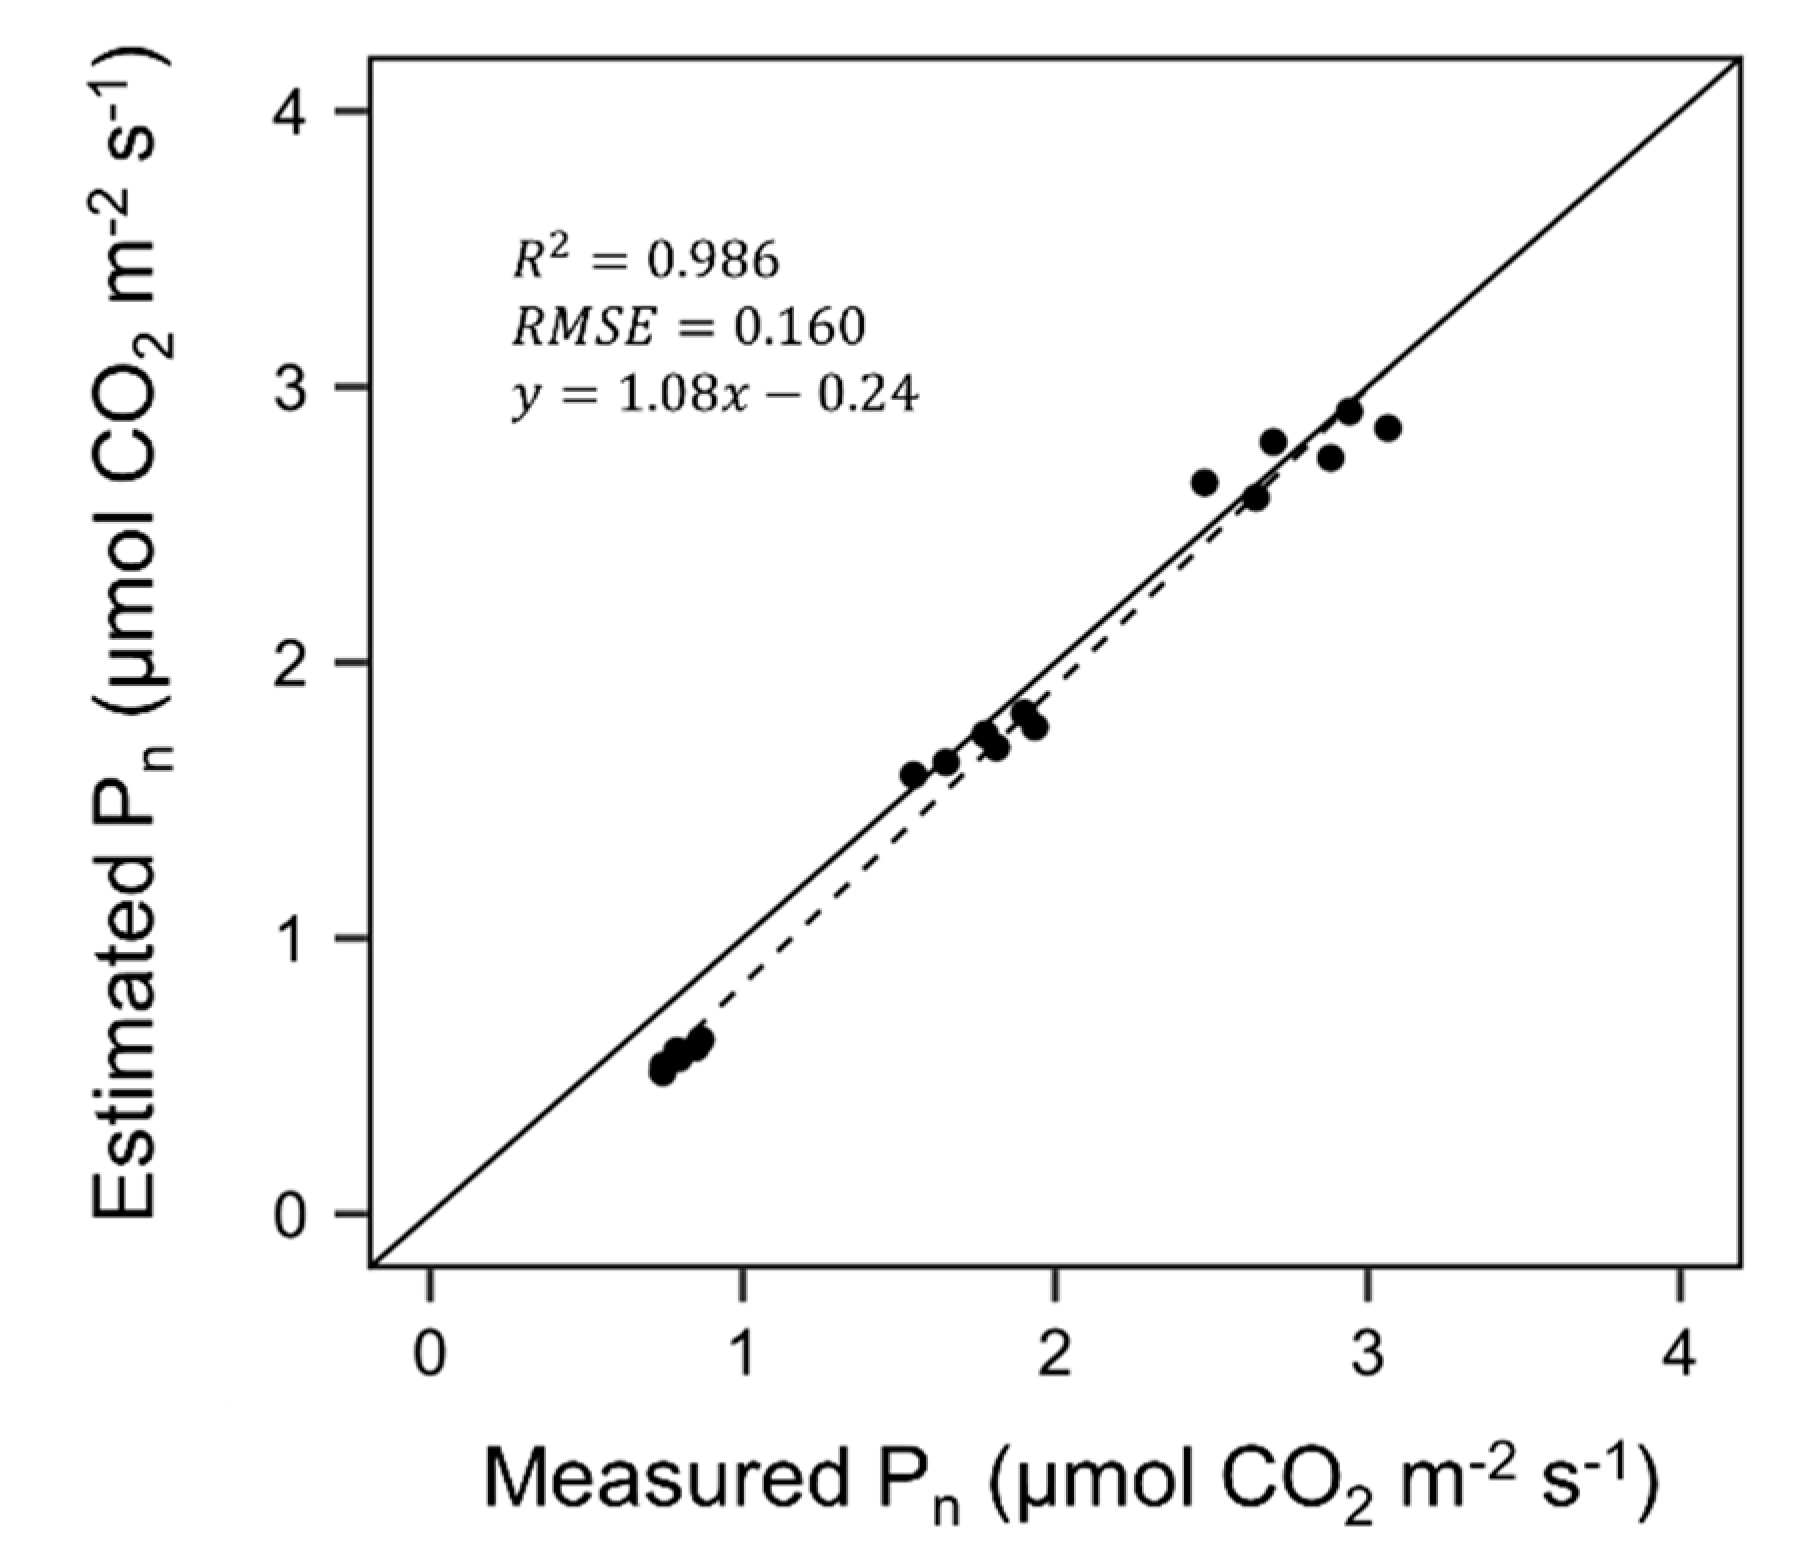
2.5. Calculation of Photosynthetic Rate from Simulation Results

Based on the ray-tracing simulation results, Pn was calculated by the absorbed PPFD and photosynthesis model. For the photosynthesis model, the modified Faquhar, von Caemmerer, and Berry (FvCB) model by Qian [24] was used. To obtain FvCB model parameters, the photosynthetic rate was measured for the upper and lower canopies by a portable photosynthesis system (LI-6400, LI-COR, Lincoln, NE, USA) with 4 different CO2 concentrations (100, 400, 800, and 1200 μmol mol−1) and 8 different light intensities (0, 50, 100, 200, 400, 600, 900, and 1200 μmol m−2 s−1). The leaf temperature was set to 22 °C, and the relative humidity ranged from 60% to 70%.
The dark respiration rate (Rd) was fixed at the measured photosynthetic rate under a PPFD of 0 μmol m−2 s−1, and these were 0.75 and 0.41 μmol CO2 m−2 s−1 for the upper and lower canopies, respectively. The Vcmax and Jmax values were obtained by nonlinear regression using measured leaf photosynthesis data and equations of Qian [24], and were 68.324 and 139.851 for the upper canopy and 46.423 and 52.898 for the lower canopy, respectively. The CO2 compensation points (Γ*) were obtained by nonlinear regression using measured leaf photosynthesis data and the following Equation (1):
P l e a f = a C i b + C i + c
where Pleaf is measured leaf photosynthetic rate and Ci is intercellular CO2 concentration. a, b, and c are equation coefficients. Resultingly, Γ* values were 42.897 and 16.923 for the upper and lower canopies, respectively.
The efficiency of light energy conversion (α) and curvature value (θ) were fixed at empirical values of 0.18 mol (electron) mol−1 (photon) and 0.7, respectively [25,26].
The simulation results included the point cloud of the 3D-SPM (x, y, and z coordinates) and the absorbed light energy (W) that was converted to absorbed PPFD by a conversion coefficient of 5.013, considering the spectral distribution of the LEDs used. The photosynthetic rate on the i-th point cloud (Pi, μmol m−2 s−1) was calculated by Equation (2):
P i = min ( A c , i ,   A j , i )
where Ac,i and Aj,i are the net photosynthetic rate (μmol m−2 s−1) limited by rubisco activity and the electron transfer rate of the i-th point cloud, respectively.
Pn was calculated by Equation (3):
P n = i = 1 n ( P i × O A i ) L A
where OAi (m−2) is the occupied area of a point cloud and was normalized to 1 × 10⁻⁶ m−2 for calculation. n and LA indicate the total point number and total leaf area (m−2), respectively, and these values varied depending on the size of the 3D-SPM. Pn was calculated in various environments with three different light intensities (100, 200, and 300 μmol m−2 s−1), three different CO2 concentrations (500, 600, and 700 μmol mol−1) and two different planting densities (HD and LD) for comparison with the measured values.

2.6. Scenarios

Based on the constructed plant models and explained processes, scenarios were conducted to examine the effect of lighting manipulation on light interception and photosynthesis. Nine 3D-SPMs were isotropically arranged at a planting density of 25 plants m−2, and the central one was selected for the light environment analysis. In addition, 8 or 9 LED bars that were 1.5 m long, which were oversized compared to the canopy size, were only used to find the impact of selected scenario variables, ignoring the decay of light intensity at marginal illuminating areas. Three variables were considered for the scenarios: (1) LED bars were arranged vertically above the center of the plant (VAP) or between the plant (BP); (2) lighting distances were set from 20 to 40 cm with an interval of 5 cm, based on the distance between the floor and the bottom of the LED bars; and (3) floor surface properties were set for nonreflective material (NR, 0% reflectance) or high-reflective material (HR, 100% reflectance). These three variables were independently changed, and thus a total of 40 cases were simulated. For all cases, the power of LED bars was set to represent an average PPFD of 200 μmol m−2 s−1 on the area occupied by the central 3D-SPM (20 × 20 cm).
For evaluation of the light environment according to the scenarios, the coefficient for variance of light interception (CVLI), LUE, light interception, and photosynthetic rate were calculated. The CVLI was calculated by the ratio of the standard deviation of intercepted light to the total mean light interception, and the LUE was calculated by the ratio of the net photosynthetic rate per plant to the emitted photosynthetic photon flux (PPF) from the light source (LUEE) or intercepted PPF (LUEI). The change in LUEE was calculated according to light intensity to obtain the maximal LUEE (LUEE,max), and the light intensity at LUEE,max was described as an optimal PPFD (PPFDopt).

2.7. Statistical Analysis

To compare the simulated light intensity and photosynthesis with the measured ones, the R2 and root mean square error (RMSE) were calculated using statistical programs (R, The R foundation, Vienna, Austria).

3. Results and Discussion

3.1. D-scanned Plant Model

The leaf areas of the scanned data were approximately 12% larger than those of the measured data (Figure 3). This result conflicts with previous studies that found that the image-based model of plant leaves was well matched to actual ones [18,22]; nevertheless, from our perspective, leaf area acquired by 3D scanning was more adjacent to actual values in this case. Leaf area is generally measured from projection area, and this assumes that leaves have flat structure. However, leaf morphology tends to be curled under LED lights with high blue content [27], and the lettuces used in this study also had convex and curled leaf shapes (Figure 1A), indicating that the projection area underestimated the actual leaf area in this case. Meanwhile, the 3D scanner collects the coordinates of the leaf surface converted to a 3D mesh, which can accurately reflect the leaf curvature and structure. Therefore, further analysis and calculation of light interception and photosynthesis were conducted using scanned leaf areas.

3.2. Evaluation of Ray-Tracing Simulation and Photosynthesis Estimation

In the empty growth chamber without plants, the measured and simulated light intensities corresponded well to the 1:1 line with an R2 of 0.979 and RMSE of 0.7048 (Figure 4A). When the plants were positioned in the growth chamber, the simulation result also reflected the measured light intensities well, with an R2 of 0.864 and RMSE of 0.7048, but the accuracy was slightly decreased compared with that of the empty chamber (Figure 4B).
A decreased accuracy of simulated light intensity by introduction of the plant canopy was found in previous studies that conducted the simulation using a chamber with electrical lights and plant models [23,28]. From our perspective, the lower R2 value of light intensities with the plant canopy was attributed to the complexity and denseness of the plants, which can cause some errors between measurement and simulation by touching or misplacement. Because most electrical lights have the feature of direct light, light intensities between shaded and lighted areas are apparently different under light sources. Additionally, small changes in sensor position or angle can induce large differences in measured values.
At different levels of PPFD and CO2 concentration, the measured and estimated values of canopy Pn per unit leaf area were well matched, with an R2 of 0.986. However, at the measurement points of low Pn, which were measured and calculated at low PPFDs, the simulation underestimated Pn by approximately 29% (Figure 5).
In this study, leaf photosynthetic rates measured in the PPFD range of 0 to 1200 μmol m−2 s−1 were used to obtain the parameters of photosynthesis models (e.g., Vcmax, Jmax), whereas the canopy Pn was measured below a PPFD of 300 μmol m−2 s−1. Thus, the model parameters that can be applied for wide PPFD ranges might underestimate the canopy photosynthetic rate at low levels of PPFDs.

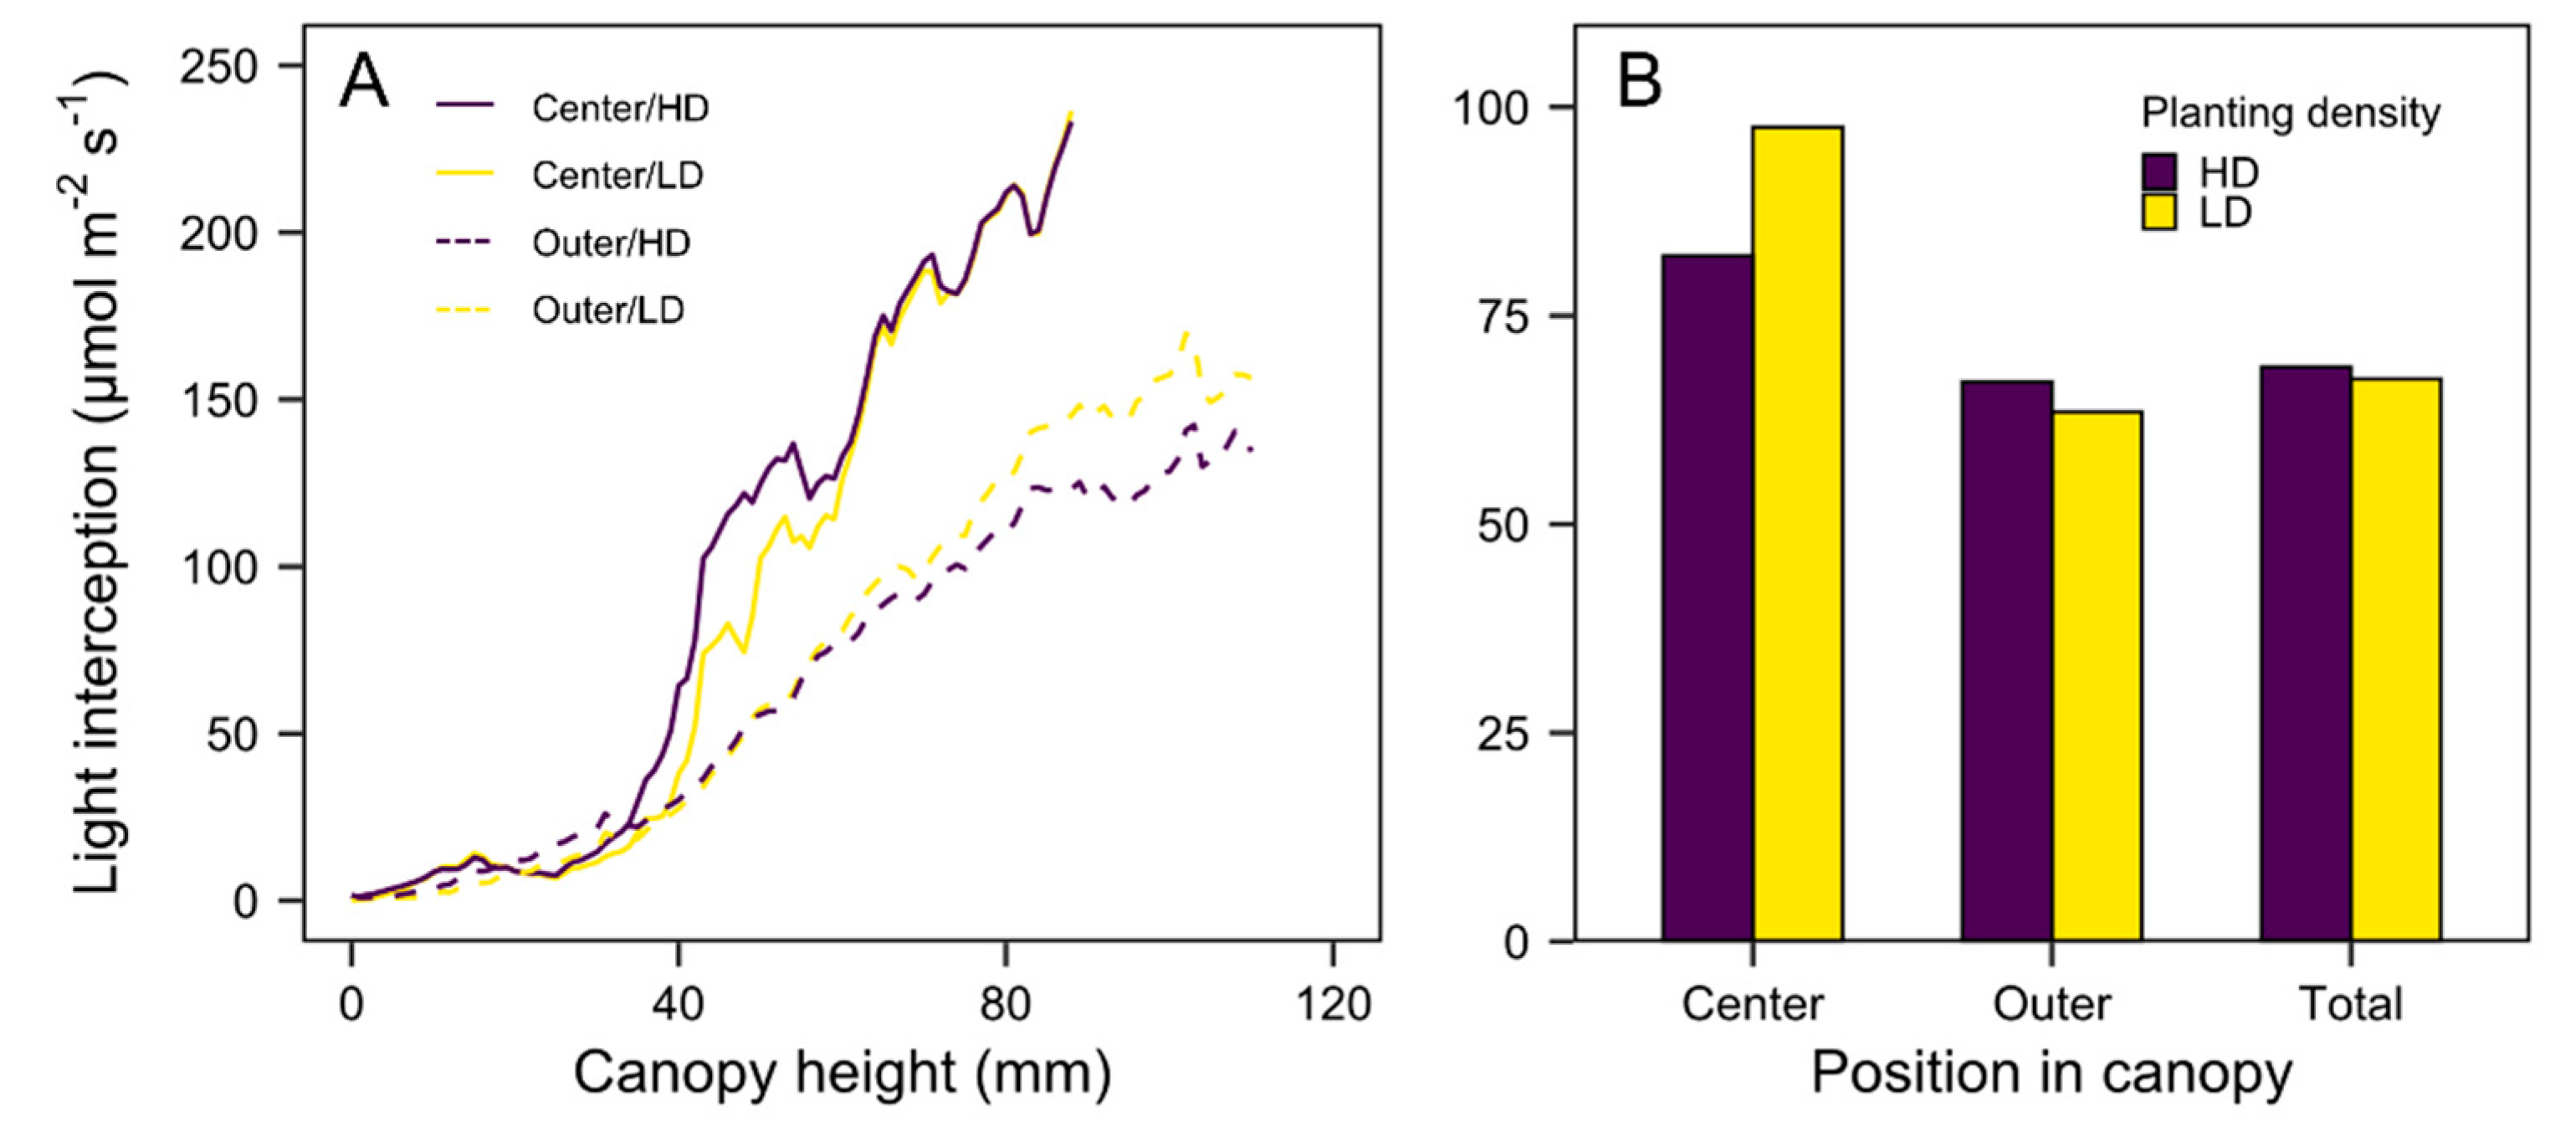
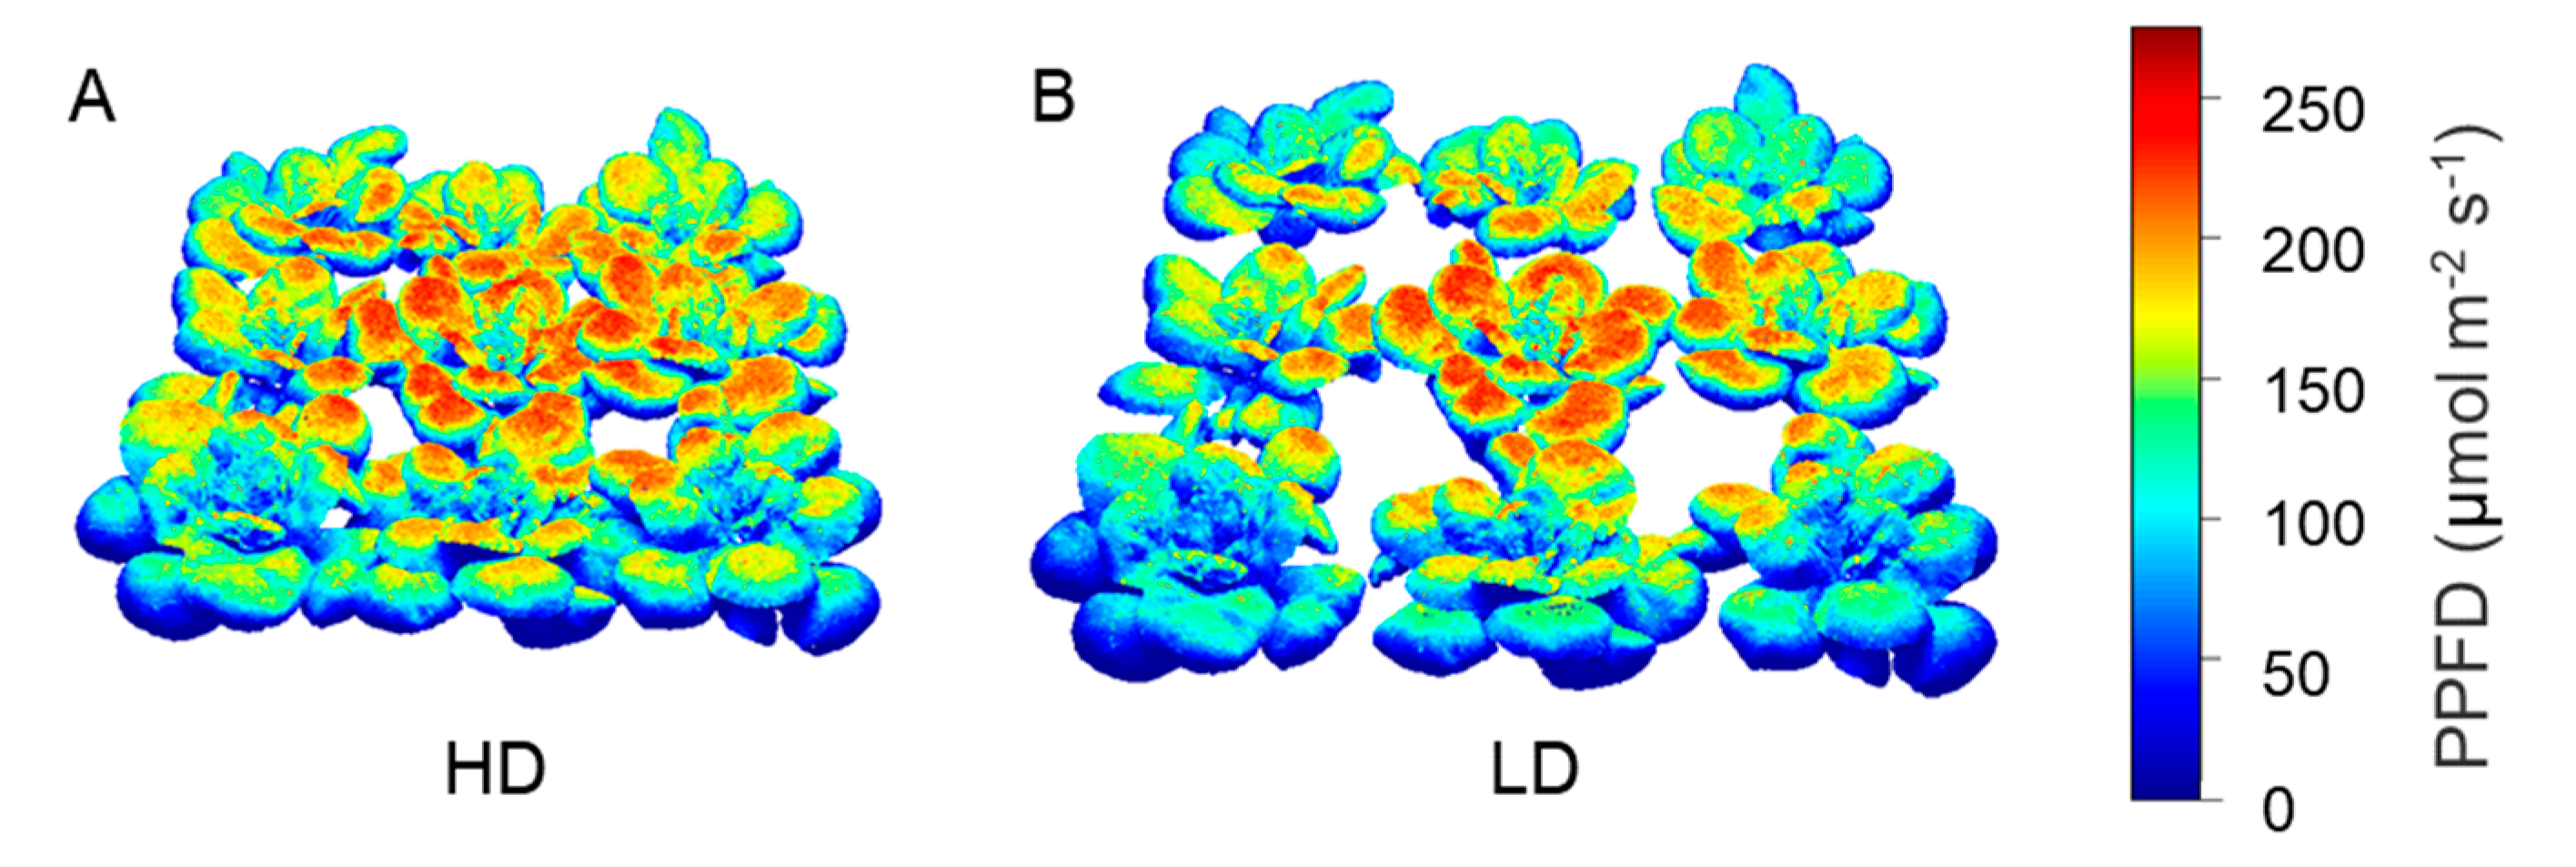
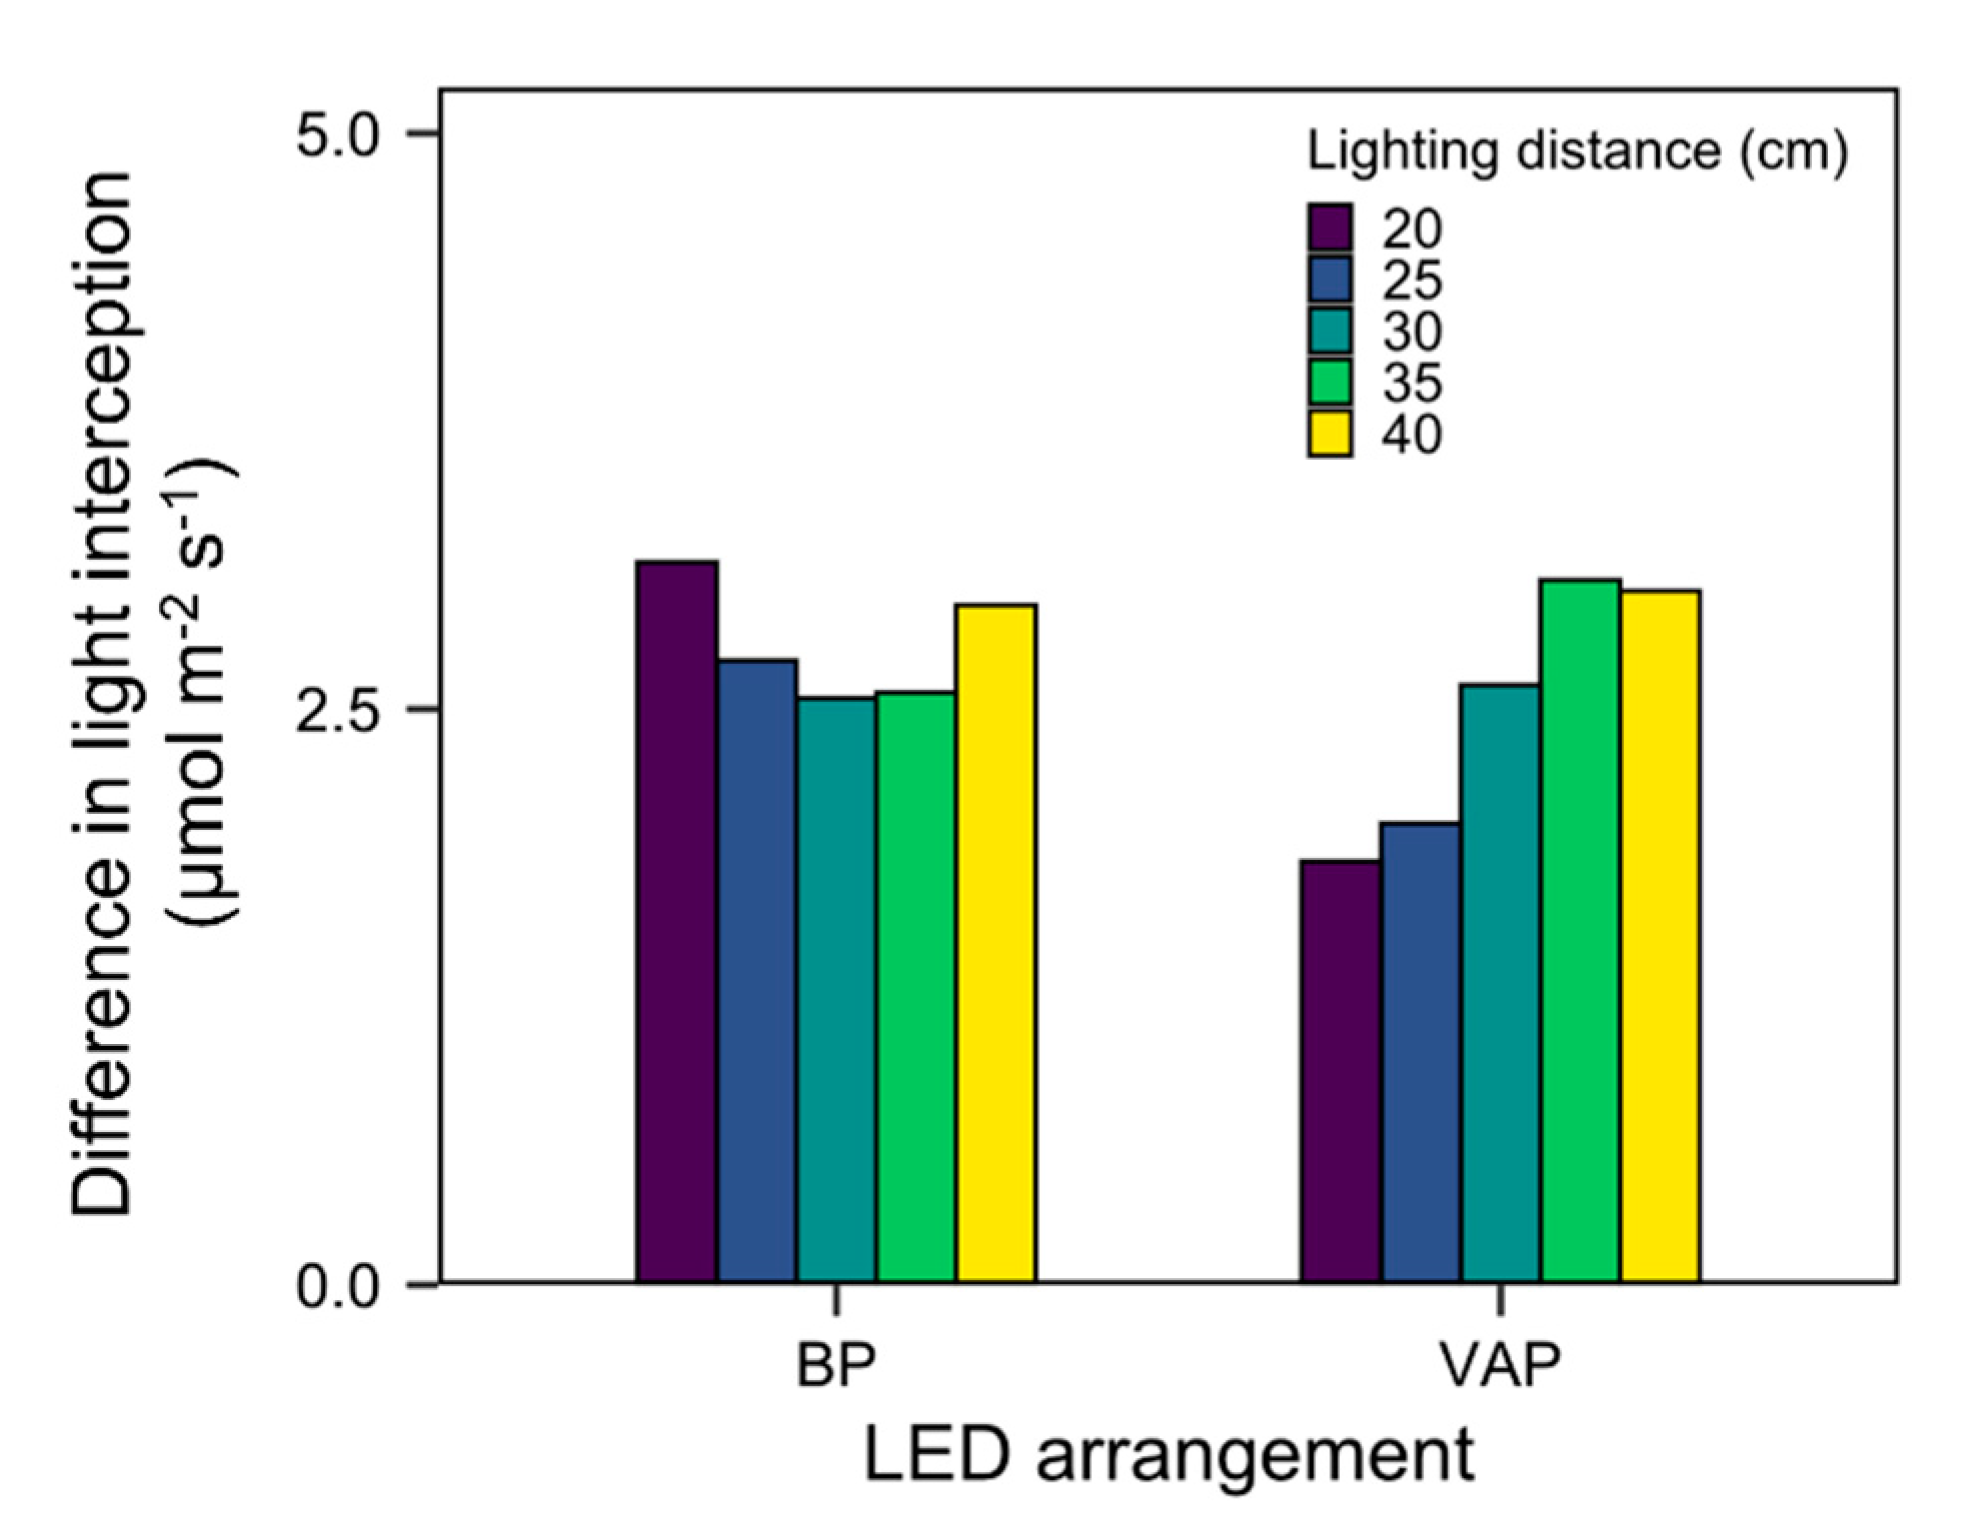
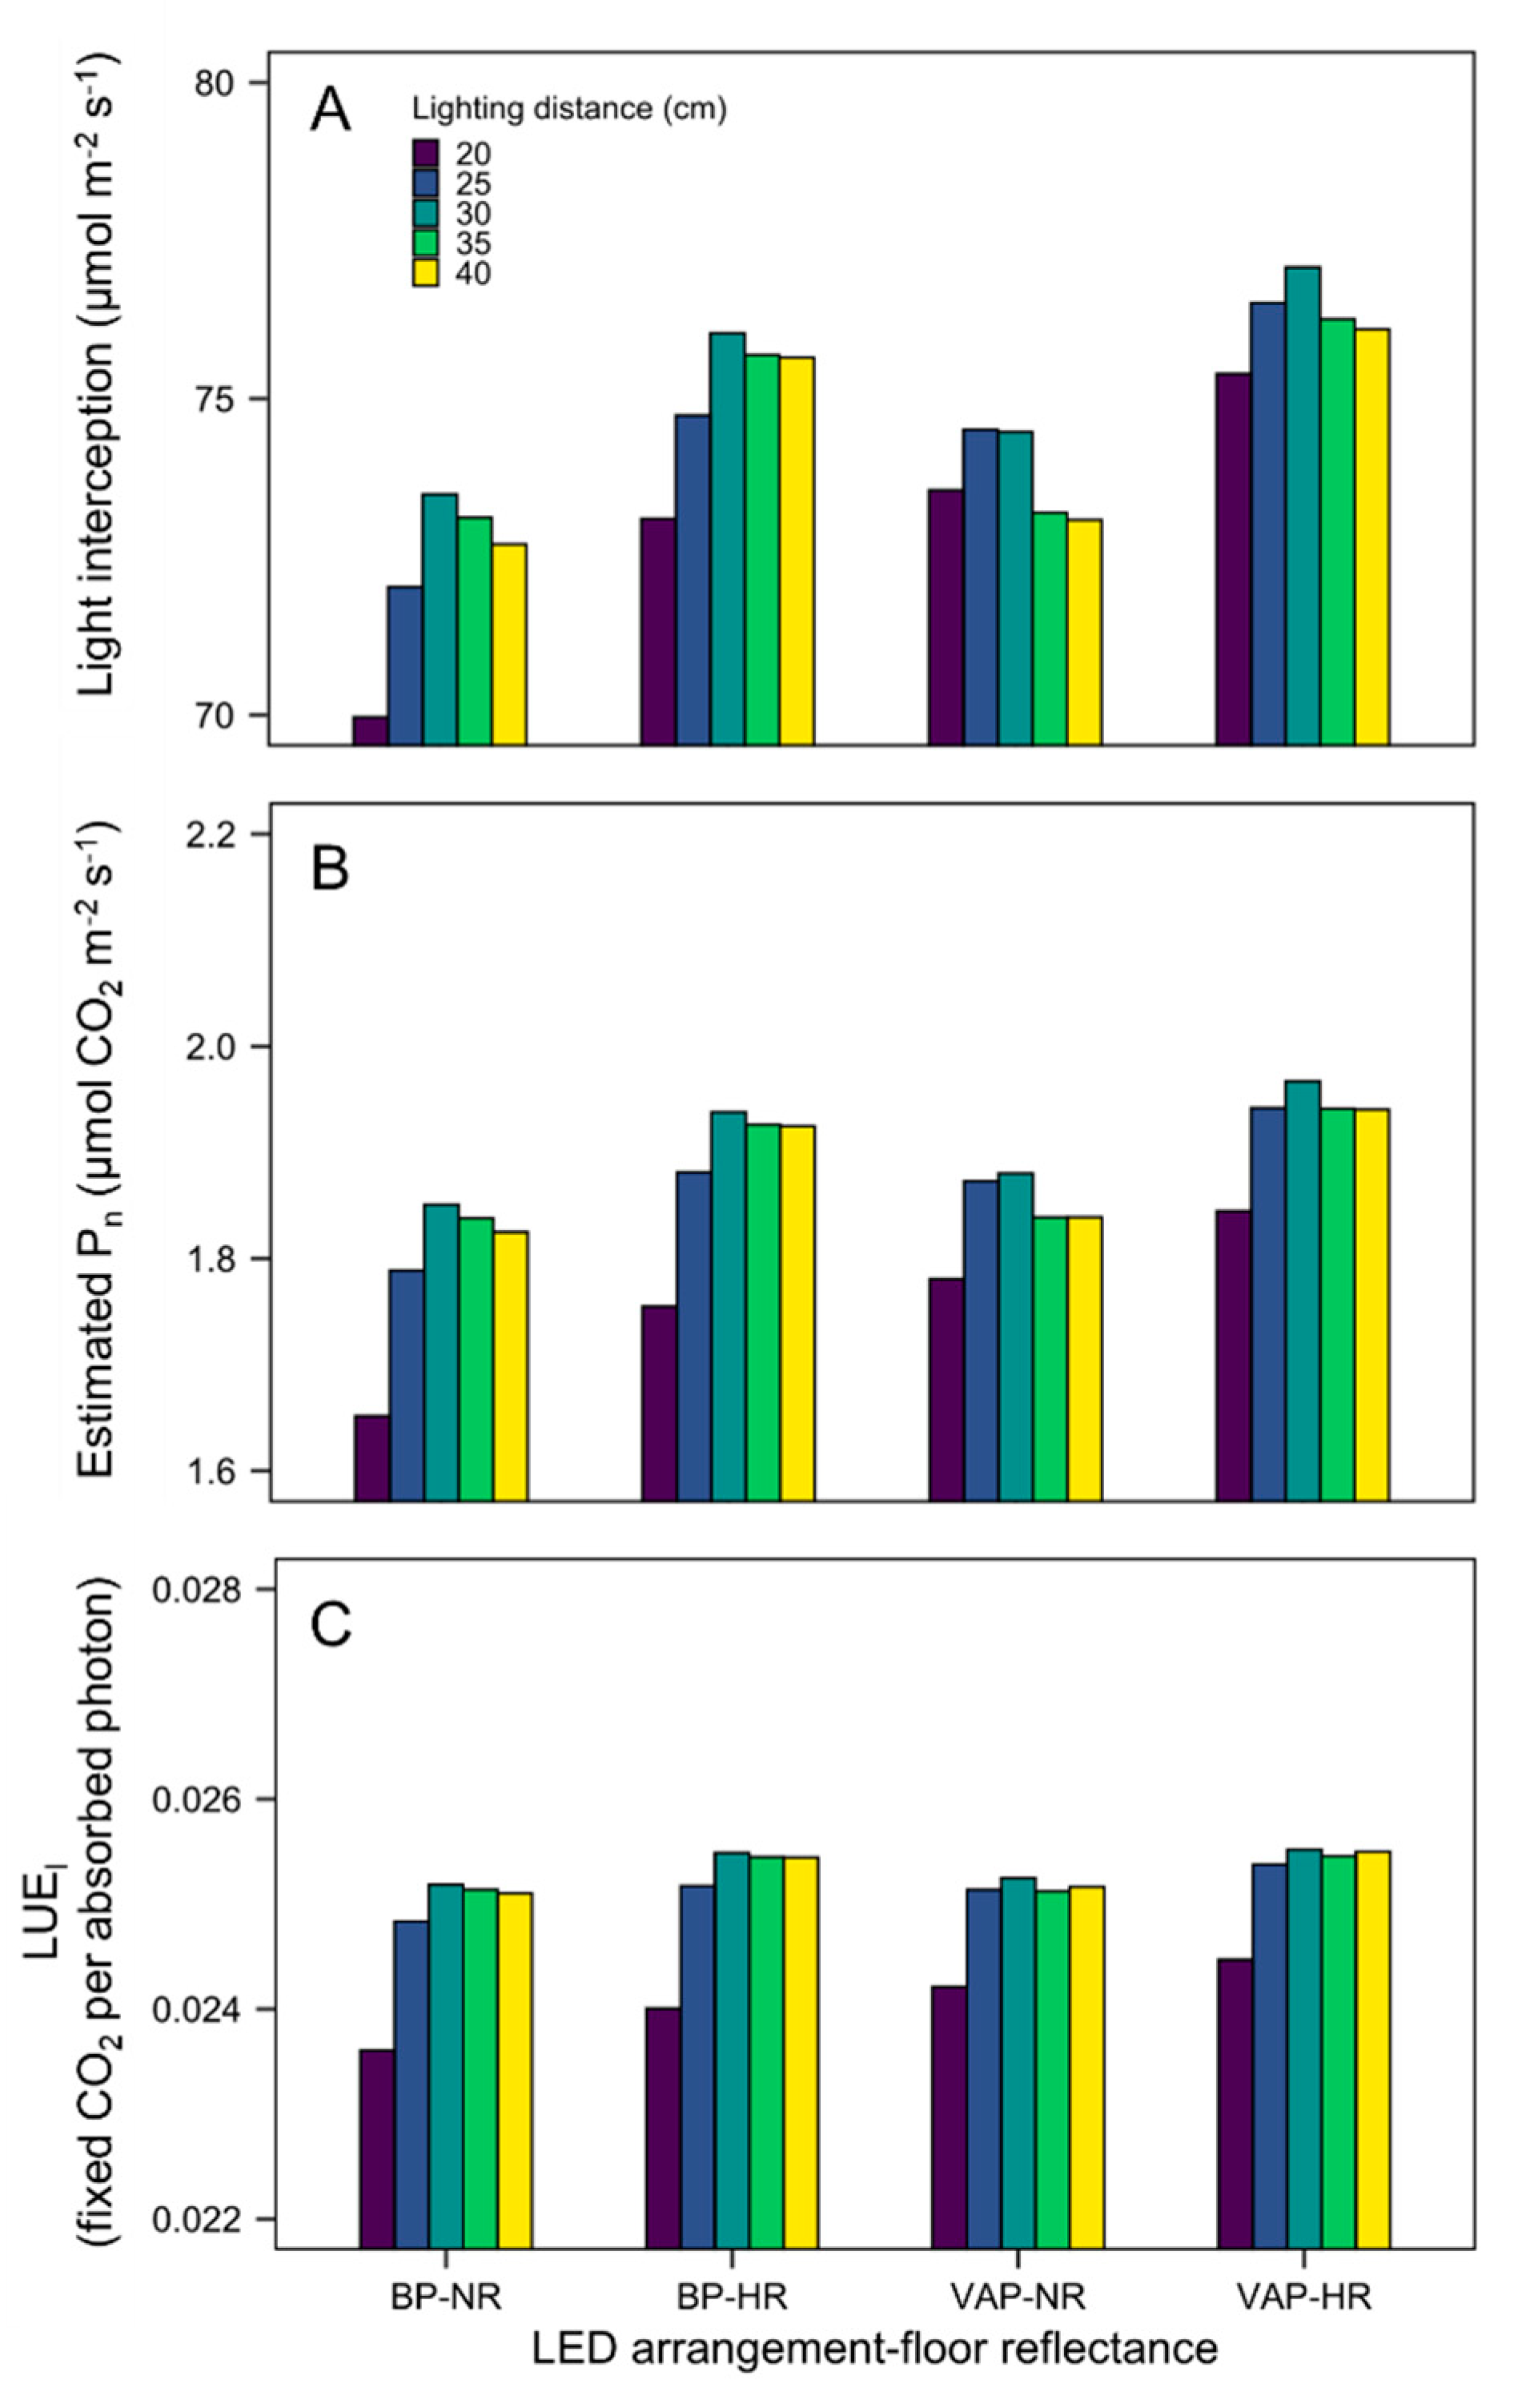
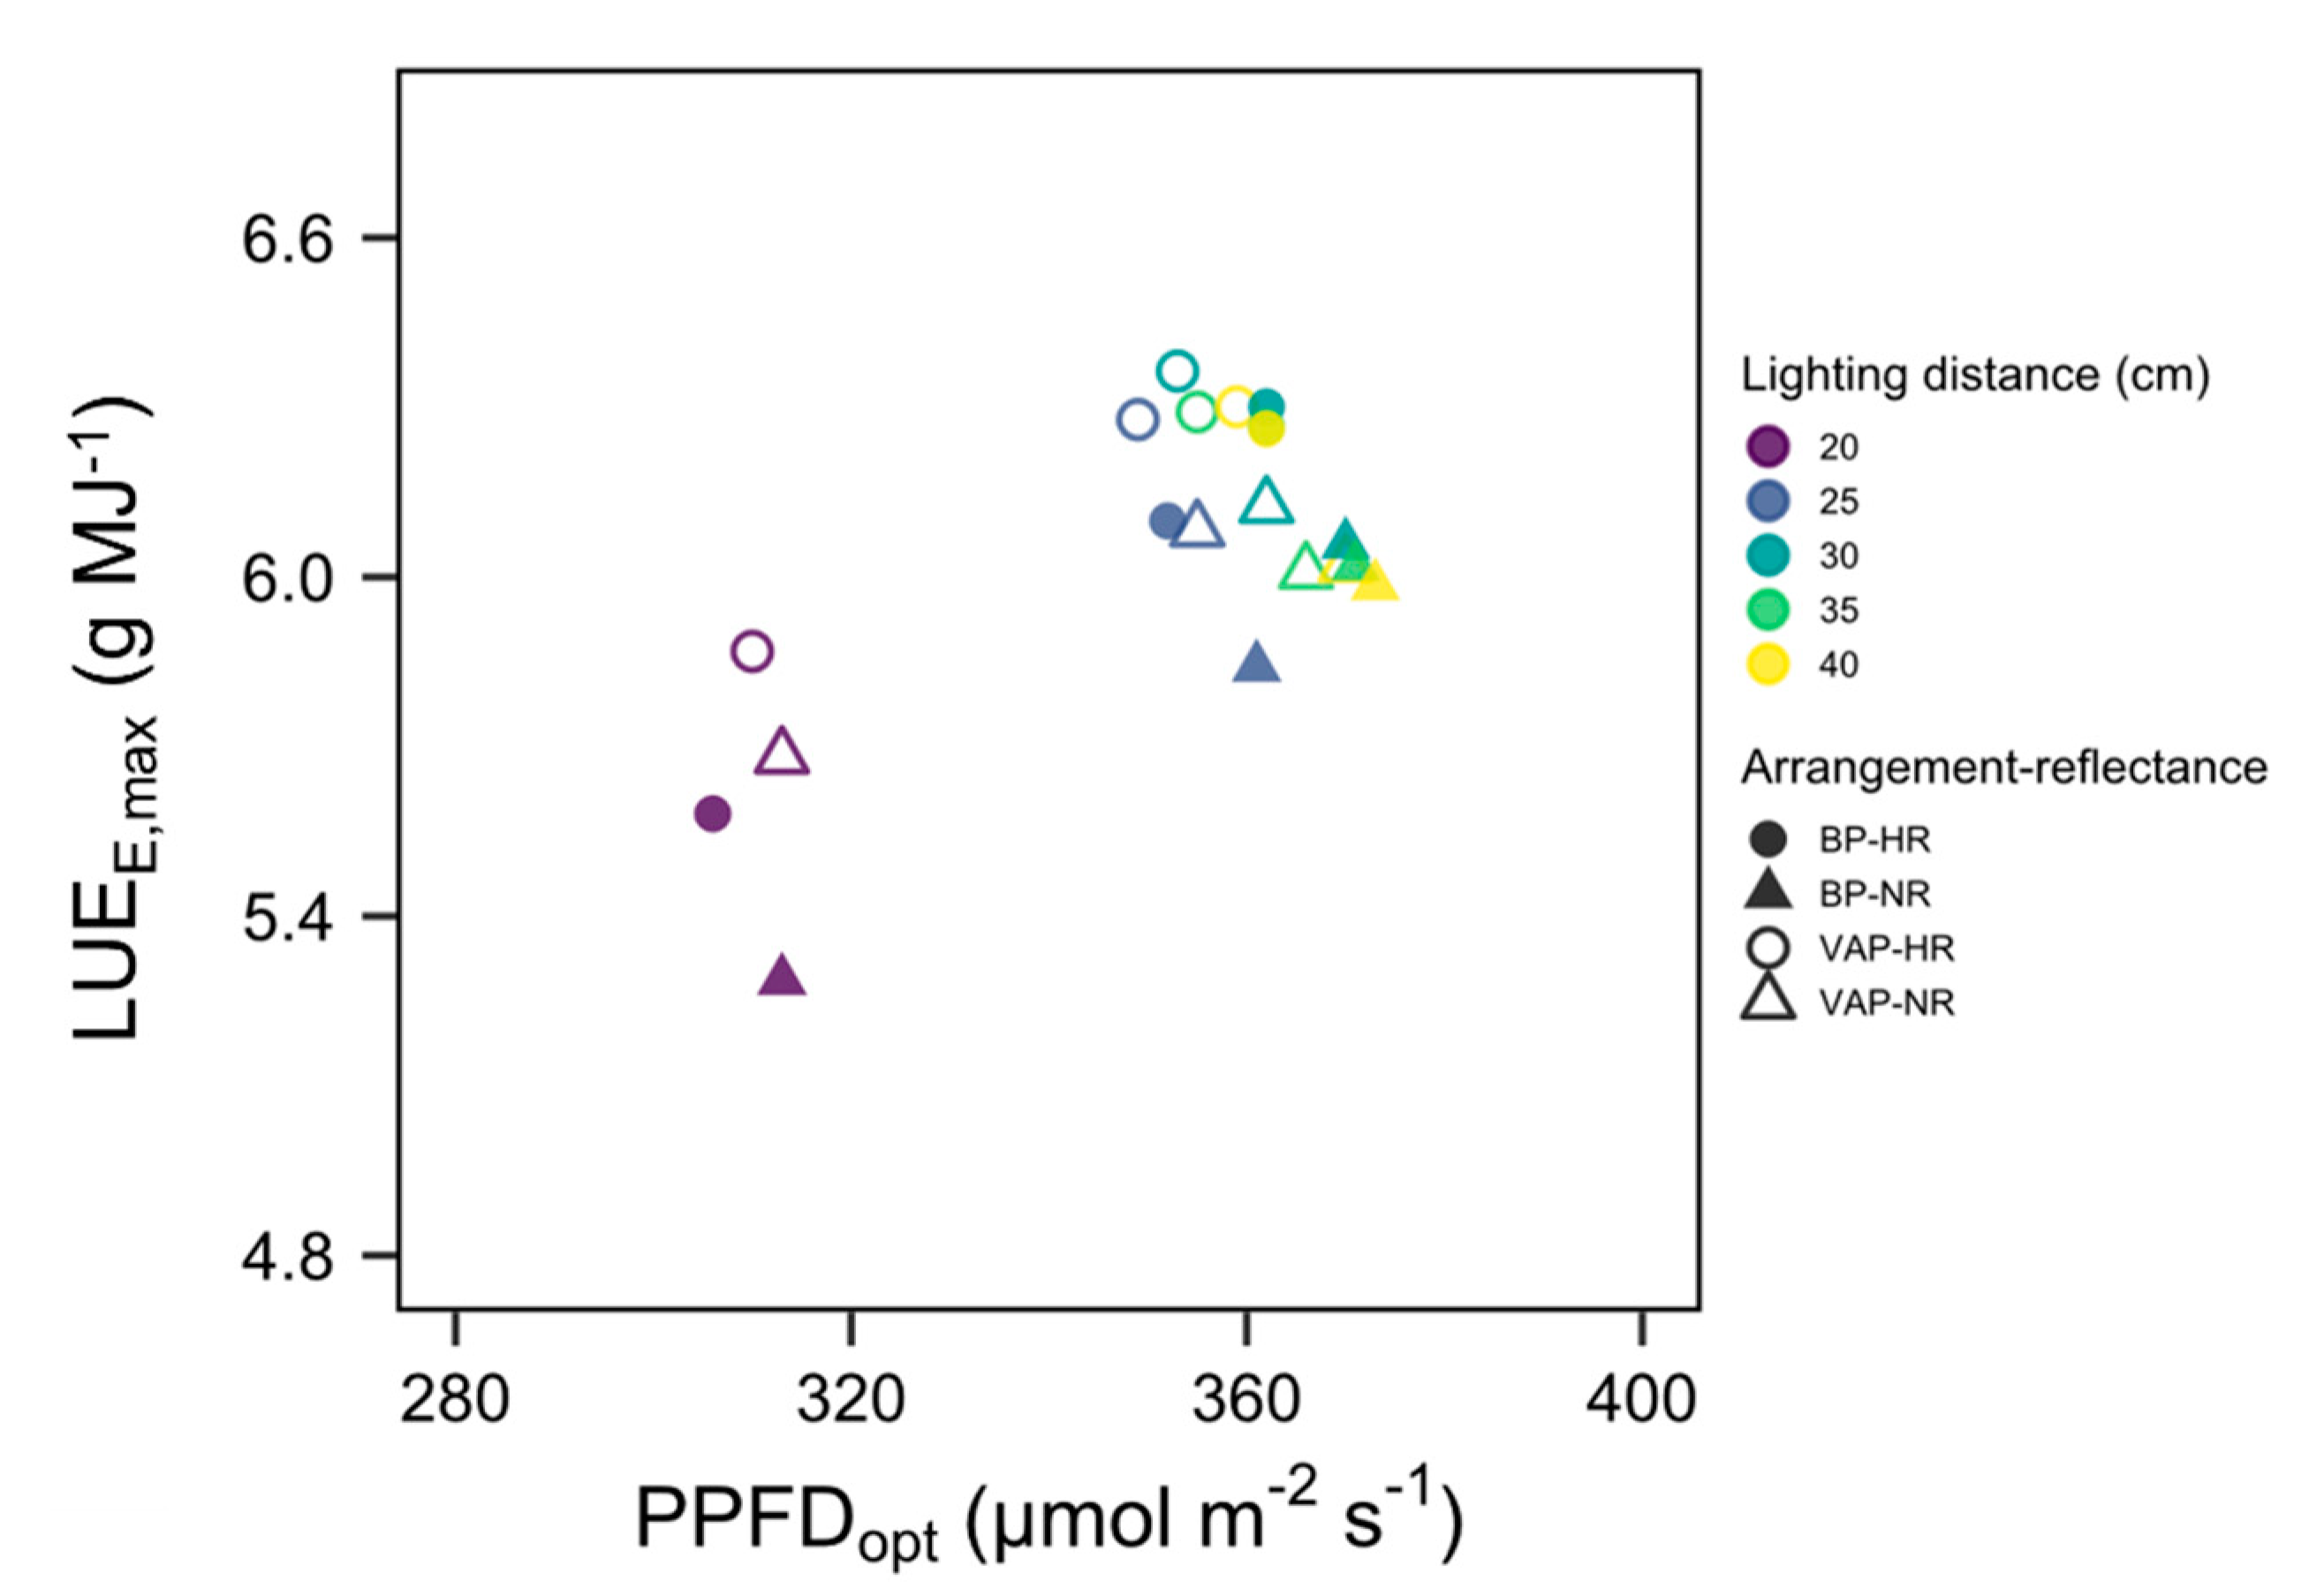
3.3. Quantification of Light Interception in the Growth Chamber Environment
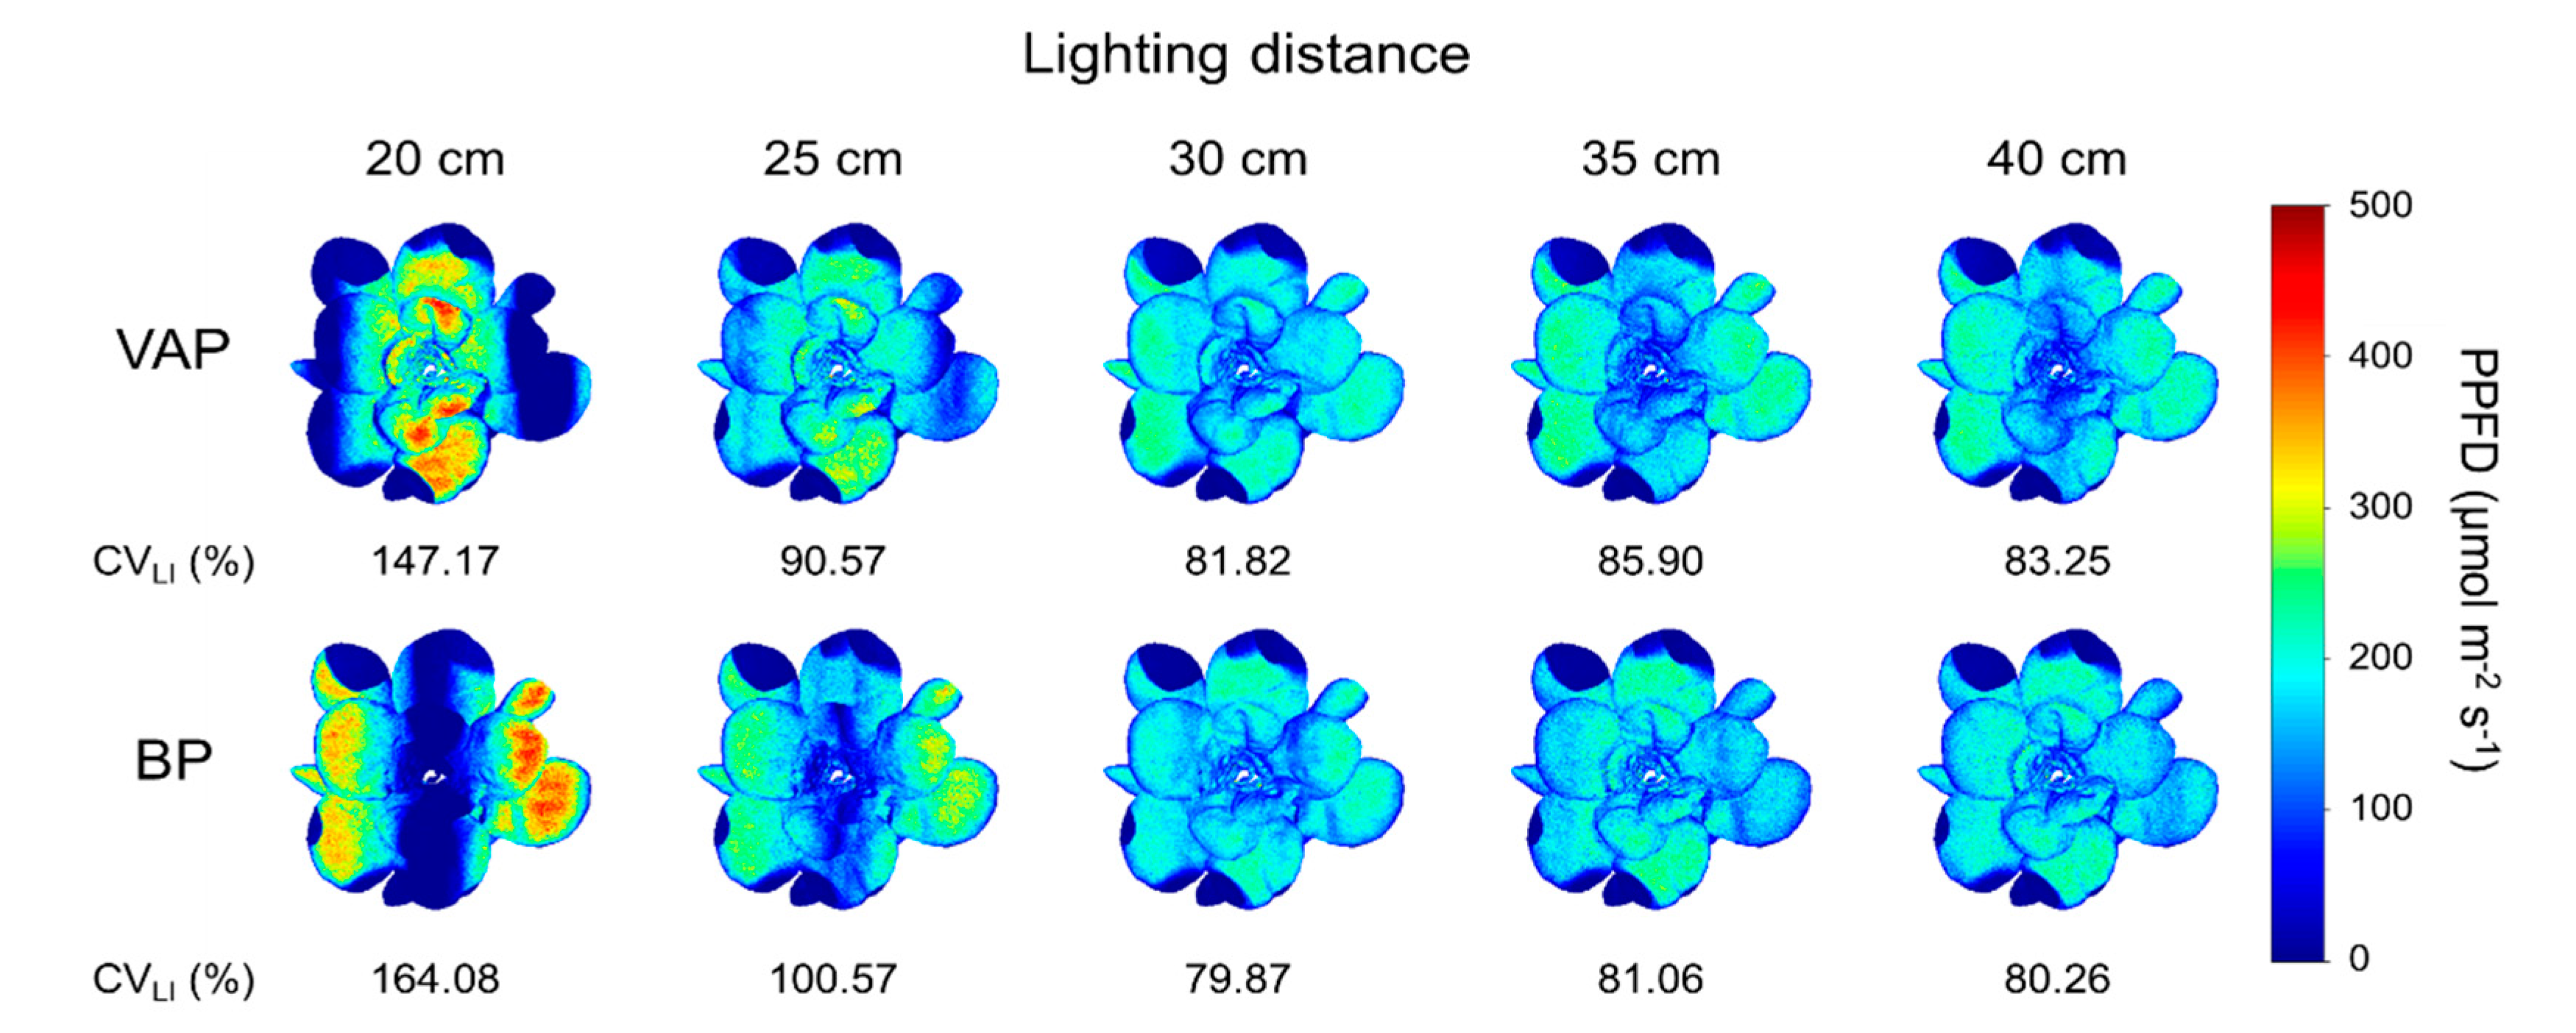
The distributions of intercepted light at different planting densities are visually described by a color gradient along with simulation results in Figure 6. Overall, light interception was evidently heterogeneous at each part of the canopy. In particular, in a leaf, light interception was dramatically decreased at marginal areas due to its convex curvature. In many studies using plant models and optical simulation, most structural elements, such as the angle, size, and geometrical dimensions of plant organs, were generally well considered [13,14,15,29], but detailed morphological features, such as leaf curvature, are often overlooked, which are hard to measure and digitize. However, because the exclusion of some morphological features can lead to misestimations [18], the importance of reflecting morphological details on plant models should be emphasized.
When the planting density was changed from HD to LD, the light interception of the central plant was increased at the middle canopy height, but those of the outer plants decreased at the high canopy height by receding from the center of the light source (Figure 7A). Consequently, the average light interception increased by approximately 18.7% at the central plant but decreased by approximately 5.5% at the outer plants; thus, the total light interception was larger for HD by approximately 2.2% (Figure 7B).
Under natural light, planting density and canopy arrangement are the main considerations for efficient light interception because natural light is assumed to be a surface light source, uniform in illuminating areas, and uncontrollable. However, under electrical lights, changing the canopy arrangement affects not only the mutual shading between plants but also the incident light environment due to the physical light distribution [30]. When the planting density was changed from HD to LD, light interception of the central plant was evidently expected to be increased by reduction of mutual shading, but those of the outer plants were unpredictable. In this case, the decrement in light interception by receding from the center of the light source was larger than the increment by diminished mutual shading for border plants, and consequently, whole canopy light interception was decreased for LD.

3.4. Scenario

The nature of light interception on the canopy surface was obviously changed under different light source arrangements and lighting distances (Figure 8). For the low lighting distance, the light interception was focused on the leaves directly under the light source and was near zero on the other leaves. Meanwhile, for lighting distances over 30 cm, the light interceptions were less influenced by the light source arrangement and were overall uniformly distributed on the canopy, but some decrements in uniformity were again observed at lighting distances over 35 cm, which resulted in the lowest CVLI at 30 cm (Figure 8). The effect of reflective material on canopy light interception also varied between different lighting distances and arrangements (Figure 9). On BP, the increment in light interception showed U-shaped patterns according to lighting distance, which was largest at 20 cm, with 3.13 μmol m−2 s−1, and lowest at 30 cm, with 2.54 μmol m−2 s−1. Conversely, the increment tended to be larger at long lighting distances on VAP—largest at 35 cm, with 3.06 μmol m−2 s−1. On average, the light interception was increased by approximately 3.6% by introducing the reflective material. As a result, the total light interception was larger on VAP than BP and was larger at 30 cm between several lighting distances in most cases (Figure 10A). The estimated Pn showed similar patterns with light interception (Figure 10B), but was reversed in some cases (e.g., VAP-NR) due to low LUEI at short lighting distances (Figure 10C).
Light uniformity in PFELs is crucial not only for even growth between plants [31] but also for efficient photosynthesis due to the convex shape of the light-response curve [32]. The light concentration and overlapping on leaves derived from the emitting distribution of light sources was found in this scenario (Figure 8), and the lack of uniformity was connected to low LUEI, especially for intact lighting (Figure 10C). The use of reflective material on the floor distinctly improved the light interception, but it is shown not to be the prior factor for designing a light environment because the large amount of increased light by reflection was not mostly connected to the increment in total light interception (Figure 9, Figure 10A). The emitting distribution affected the differences in light interception between VAP and BP, which is related to the plant structure. The lettuce is a rosette-type plant with no petiole, so the angle of the leaf surface is positive, that is, the light incidence angle is near perpendicular for VAP and near horizontal for BP. On the leaf level, light interception is highly differentiated by incidence angle and is larger for vertically emitted light [15,18], which results in larger light interception for VAP. In this respect, other types of plants were not simulated, but some plants having negative leaf angles can induce the opposite results under different light source arrangements.
Finally, for all scenarios, the PPFDopt for achieving LUEE,max was found (Figure 11). The range of PPFDopt was between 300 and 380 μmol m−2 s−1 and was mainly distributed at approximately 360 μmol m−2 s−1 for homogeneously intercepted cases. In this scenario, LUEE,max was the largest at a 30-cm lighting distance with VAP-HR, and both PPFDopt and LUEE,max were relatively low at a 20-cm lighting distance; thus, the maximum LUEE,max was approximately 20.3% larger than the minimum. In all cases, a larger LUEE,max was achievable at a low PPFDopt for HR when comparing NR and HR.
When light intensities were increased, the change pattern of LUE was similar to quadratic functions that increase to a certain light intensity point and decrease afterwards. Between the scenario variables, the high level of light interception and low level of CVLI were connected to the high LUEE,max, indicating that the high light-intercepting efficiency (LIe) is related to the potentially achievable LUEE,max. In particular, in the case of a lighting distance of 20 cm, which showed a low LIe, the PPFDopt was relatively low, at approximately 310 μmol m−2 s−1, due to their heterogenetic light distribution on leaves. Additionally, the overall increment in light interception by reflective material induced the higher LUEE,max at a relatively low level of PPFD. It is difficult to directly compare this result with others because there were no cases analyzing LUE in PFELs with the simulation. When compared with normal LUE in greenhouse cases, the LUEE,max in this study is approximately 1.8 times higher [15]. Additionally, compared with generally adopted PPFD levels for research or cultivation with less than 200 μmol m−2 s−1 [9,10,33,34], this result suggests that the larger range of PPFD can be efficient for improving LUE.

3.5. Applicability and Limitations

Previous studies that applied methods similar to those of this study under natural light mainly focused on the analysis of the light environment with diurnal or seasonal changes, which can be affected by climatic and weatherly factors. The light environment in PFELs is determined by controllable light sources, so the potential for application of simulation methods is thought to be larger. In particular, because electrical lighting in PFELs consumes electrical power, which incurs additional costs, simulation studies are important not only for analyzing the light interception of plants but also for improving energy use efficiency. By introducing some variables related to the light environment to the simulation, we analyzed their effects on light interception, photosynthesis, and LUE, and this result could support the optimal light design in PFELs. Additionally, to our knowledge, this is the first study to adopt the optimal light intensity for achieving the maximum LUE, which can support efficient electrical energy management. It is expected that further studies on various types of crops, types of lights, and lighting methods can expand the applicability of our findings for user purposes. Meanwhile, the method for constructing structurally accurate plant models should be improved. Because cultivated crops in PFELs mainly have small and dense canopies, 3D-scanned or image-based plant modeling methods have limitations in describing the whole canopy without destruction. Additionally, compared with rule-based plant models, the description of model continuity in time series is difficult. Nevertheless, because structural accuracy in the plant model is important for precise light analysis, as described above, methods to combine the advantages of different modeling methods should be developed.

4. Conclusions

Light use efficiency (LUE) is an important factor in designing the light environment in plant factories with electrical lights (PFELs). To analyze LUE, 3D-scanned plant models (3D-SPMs) for lettuces and ray-tracing simulation were used. The leaf areas of 3D-SPMs were slightly larger compared with the measured data, but considering the curled and convex structure of leaves, those of 3D-SPMs are thought to be more adjacent to actual ones. Additionally, in a growth chamber with an LED source, the simulation results were well matched with the measured light intensities and photosynthesis. When planting density decreased, the light interception of the central plant was increased due to a decrease in the mutual shading effect, but that of border plants was decreased by receding from the center of the light source. Different lighting distances, light arrangements, and floor reflectances also affected light interception, and the results indicated that cases with lower deviations in intercepted light showed larger light interception and LUE. The optimal photosynthetic photon flux density (PPFD) level for achieving maximal LUE was able to be obtained, which can support the control of light sources. Our study suggests a basic insight into designing the light environment in PFELs for maximization of LUE.

Author Contributions

J.K. and J.E.S. conceived the research; J.K. performed the experiments; J.K. and W.H.K. analyzed the results; J.K. and J.E.S. prepared the manuscript; and J.E.S and W.H.K. revised and edited the manuscript. All authors have read and agreed to the published version of the manuscript.

Funding

This work was supported by Korea Institute of Planning and Evaluation for Technology in Food, Agriculture, Forestry, and Fisheries (IPET) through Agriculture, Food, and Rural Affairs Convergence Technologies Program for Educating Creative Global Leader, funded by Ministry of Agriculture, Food, and Rural Affairs (MAFRA) (717001-7).

Conflicts of Interest

The authors declare no conflict of interest.

References

  1. Despommier, D. The vertical farm: Controlled environment agriculture carried out in tall buildings would create greater food safety and security for large urban populations. J. Verbrauch. Leb. 2011, 6, 233–236. [Google Scholar] [CrossRef]
  2. Kozai, T. Resource use efficiency of closed plant production system with artificial light: Concept, estimation and application to plant factory. Proc. Jpn. Acad. Ser. B 2013, 89, 447–461. [Google Scholar] [CrossRef] [Green Version]
  3. Graamans, L.; van den Dobbelsteen, A.; Meinen, E.; Stanghellini, C. Plant factories; crop transpiration and energy balance. Agric. Syst. 2017, 153, 138–147. [Google Scholar] [CrossRef]
  4. SharathKumar, M.; Heuvelink, E.; Marcelis, L.F.M. Vertical farming: Moving from genetic to environmental modification. Trends Plant Sci. 2020, 25, 724–727. [Google Scholar] [CrossRef] [PubMed]
  5. Pattison, P.M.; Tsao, J.Y.; Brainard, G.C.; Bugbee, B. LEDs for photons, physiology and food. Nature 2018, 563, 493–500. [Google Scholar] [CrossRef] [PubMed]
  6. Ohyama, K. Actual management conditions on a large-scale plant factory with artificial lighting. JGHA Prot. Hortic. 2015, 168, 30–33. [Google Scholar]
  7. Graamans, L.; Baeza, E.; van den Dobbelsteen, A.; Tsafaras, I.; Stanghellini, C. Plant factories versus greenhouses: Comparison of resource use efficiency. Agric. Syst. 2018, 160, 31–43. [Google Scholar] [CrossRef]
  8. Poulet, L.; Massa, G.D.; Morrow, R.C.; Bourget, C.M.; Wheeler, R.M.; Mitchell, C.A. Significant reduction in energy for plant-growth lighting in space using targeted LED lighting and spectral manipulation. Life Sci. Sp. Res. 2014, 2, 43–53. [Google Scholar] [CrossRef]
  9. Li, K.; Li, Z.; Yang, Q. Improving light distribution by zoom lens for electricity savings in a plant factory with light-emitting diodes. Front. Plant Sci. 2016, 7, 92. [Google Scholar] [CrossRef] [Green Version]
  10. Zhang, G.; Shen, S.; Takagaki, M.; Kozai, T.; Yamori, W. Supplemental upward lighting from underneath to obtain higher marketable lettuce (Lactuca sativa) leaf fresh weight by retarding senescence of outer leaves. Front. Plant Sci. 2015, 6, 1110. [Google Scholar] [CrossRef] [Green Version]
  11. Vos, J.; Evers, J.B.; Buck-Sorlin, G.H.; Andrieu, B.; Chelle, M.; de Visser, P.H.B. Functional–structural plant modelling: A new versatile tool in crop science. J. Exp. Bot. 2010, 61, 2101–2115. [Google Scholar] [CrossRef] [PubMed]
  12. Sievänen, R.; Godin, C.; DeJong, T.M.; Nikinmaa, E. Functional–structural plant models: A growing paradigm for plant studies. Ann. Bot. 2014, 114, 599–603. [Google Scholar] [CrossRef] [PubMed]
  13. Buck-Sorlin, G.; de Visser, P.H.; Henke, M.; Sarlikioti, V.; van der Heijden, G.W.; Marcelis, L.F.; Vos, J. Towards a functional-structural plant model of cut-rose: Simulation of light environment, light absorption, photosynthesis and interference with the plant structure. Ann. Bot. 2011, 108, 1121–1134. [Google Scholar] [CrossRef] [PubMed]
  14. Sarlikioti, V.; de Visser, P.H.; Marcelis, L.F. Exploring the spatial distribution of light interception and photosynthesis of canopies by means of a functional-structural plant model. Ann. Bot. 2011, 107, 875–883. [Google Scholar] [CrossRef] [Green Version]
  15. de Visser, P.H.B.; Buck-Sorlin, G.H.; van der Heijden, G.W.A.M. Optimizing illumination in the greenhouse using a 3D model of tomato and a ray tracer. Front. Plant Sci. 2014, 5, 48. [Google Scholar] [CrossRef] [Green Version]
  16. Kim, J.H.; Lee, J.W.; Ahn, T.I.; Shin, J.H.; Park, K.S.; Son, J.E. Sweet Pepper (Capsicum annuum L.) Canopy Photosynthesis Modeling Using 3D Plant Architecture and Light Ray-Tracing. Front. Plant Sci. 2016, 7, 1321. [Google Scholar] [CrossRef] [Green Version]
  17. Jung, D.; Lee, J.; Kang, W.; Hwang, I.; Son, J. Estimation of whole plant photosynthetic rate of irwin mango under artificial and natural lights using a three-dimensional plant model and ray-tracing. Int. J. Mol. Sci. 2018, 19, 152. [Google Scholar] [CrossRef] [Green Version]
  18. Kim, D.; Kang, W.H.; Hwang, I.; Kim, J.; Kim, J.H.; Park, K.S.; Son, J.E. Use of structurally-accurate 3D plant models for estimating light interception and photosynthesis of sweet pepper (Capsicum annuum) plants. Comput. Electron. Agric. 2020, 177, 105689. [Google Scholar] [CrossRef]
  19. Burgess, A.J.; Retkute, R.; Pound, M.P.; Foulkes, J.; Preston, S.P.; Jensen, O.E.; Pridmore, T.P.; Murchie, E.H. High-resolution three-dimensional structural data quantify the impact of photoinhibition on long-term carbon gain in wheat canopies in the field. Plant Physiol. 2015, 169, 1192–1204. [Google Scholar] [CrossRef]
  20. Burgess, A.J.; Retkute, R.; Herman, T.; Murchie, E.H. Exploring relationships between canopy architecture, light distribution, and photosynthesis in contrasting rice genotypes using 3D canopy reconstruction. Front. Plant Sci. 2017, 8. [Google Scholar] [CrossRef]
  21. Townsend, A.J.; Retkute, R.; Chinnathambi, K.; Randall, J.W.P.P.; Foulkes, J.; Carmo-Silva, E.; Murchie, E.H. Suboptimal Acclimation of Photosynthesis to Light in Wheat Canopies. Plant Physiol. 2018, 176, 1233–1246. [Google Scholar] [CrossRef] [PubMed] [Green Version]
  22. Zhu, B.; Liu, F.; Xie, Z.; Guo, Y.; Li, B.; Ma, Y. Quantification of light interception within image-based 3D reconstruction of sole and intercropped canopies over the entire growth season. Ann. Bot. 2020, 1–12. [Google Scholar] [CrossRef] [Green Version]
  23. Hitz, T.; Henke, M.; Graeff-Hönninger, S.; Munz, S. Three-dimensional simulation of light spectrum and intensity within an LED growth chamber. Comput. Electron. Agric. 2019, 156, 540–548. [Google Scholar] [CrossRef]
  24. Qian, T.; Elings, A.; Dieleman, J.A.; Gort, G.; Marcelis, L.F.M. Estimation of photosynthesis parameters for a modified Farquhar–von Caemmerer–Berry model using simultaneous estimation method and nonlinear mixed effects model. Environ. Exp. Bot. 2012, 82, 66–73. [Google Scholar] [CrossRef]
  25. Evans, J.R. Photosynthesis and nitrogen relationships in leaves of C3 plants. Oecologia 1989, 78, 9–19. [Google Scholar] [CrossRef]
  26. Wullschleger, S.D. Biochemical limitations to carbon assimilation in C3 plants—A retrospective analysis of the A/Ci curves from 109 species. J. Exp. Bot. 1993, 44, 907–920. [Google Scholar] [CrossRef]
  27. Trouwborst, G.; Oosterkamp, J.; Hogewoning, S.W.; Harbinson, J.; van Ieperen, W. The responses of light interception, photosynthesis and fruit yield of cucumber to LED-lighting within the canopy. Physiol. Plant. 2010, 138, 289–300. [Google Scholar] [CrossRef]
  28. Hitz, T.; Henke, M.; Graeff-Honninger, S.; Munz, S. Simulating light spectrum within a soybean canopy in an LED growth chamber. In Proceedings of the 2018 6th International Symposium on Plant Growth Modeling, Simulation, Visualization and Applications (PMA), Hefei, China, 4–8 November 2018; pp. 120–125. [Google Scholar] [CrossRef]
  29. Prieto, J.A.; Louarn, G.; Perez Peña, J.; Ojeda, H.; Simonneau, T.; Lebon, E. A functional–structural plant model that simulates whole- canopy gas exchange of grapevine plants (Vitis vinifera L.) under different training systems. Ann. Bot. 2019, 1–14. [Google Scholar] [CrossRef] [Green Version]
  30. Henke, M.; Buck-Sorlin, G.H. Using a full spectral raytracer for calculating light microclimate in functional-structural plant modelling. Comput. Inform. 2017, 36, 1492–1522. [Google Scholar] [CrossRef]
  31. Kozai, T.; Ohyama, K.; Chun, C. Commercialized closed systems with artificial lighting for plant production. Acta Hortic. 2006, 61–70. [Google Scholar] [CrossRef]
  32. Hogewoning, S.W.; Trouwborst, G.; Harbinson, J.; Ieperen, W. Light distribution in leaf chambers and its consequences for photosynthesis measurements. Photosynthetica 2010, 48, 219–226. [Google Scholar] [CrossRef]
  33. Zhang, X.; He, D.; Niu, G.; Yan, Z.; Song, J. Effects of environment lighting on the growth, photosynthesis, and quality of hydroponic lettuce in a plant factory. Int. J. Agric. Biol. Eng. 2018, 11, 33–40. [Google Scholar] [CrossRef]
  34. Chen, X.; Yang, Q.; Song, W.; Wang, L.; Guo, W.; Xue, X. Growth and nutritional properties of lettuce affected by different alternating intervals of red and blue LED irradiation. Sci. Hortic. 2017, 223, 44–52. [Google Scholar] [CrossRef]
Figure 1. A schematic diagram of the overall processes studied—the reconstruction process of 3D-scanned plant models (3D-SPMs) (A), the evaluation of ray-tracing simulation compared with actual measurement in a growth chamber with LED lighting (B), and a case study concerning the effect of variation in the light environment on light interception, photosynthesis, and light use efficiency (LUE) (C).
Agronomy 10 01545 g001
Figure 2. Transmittance and reflectance of a lettuce leaf (A) and reflectance of the chamber surface (B).
Agronomy 10 01545 g002
Figure 3. Comparison between measured and scanned leaf areas. The total number of leaves was 14, and the continuous line was a 1:1 match line.
Agronomy 10 01545 g003
Figure 4. Comparison between measured and simulated light intensities in the empty chamber (A) and the chamber with lettuce plants or models (B). Light intensities in the empty chamber were measured and simulated at different heights from the floor of 0, 5, and 10 cm. Nine lettuce plants at 21 days after transplanting (DAT) were used.
Agronomy 10 01545 g004
Figure 5. Comparison between measured and estimated canopy photosynthetic rates (Pn) in the growth chamber. The PPFD was set to 100, 200, and 300 μmol m−2 s−1, and the CO2 concentration was set to 500, 600, and 700 μmol mol−1. Nine lettuce plants at DAT 21 were used.
Agronomy 10 01545 g005
Figure 6. Simulation results of light distribution on the lettuce canopy for HD (A) and LD (B). HD and LD indicate high planting density (25 plant m−2) and low planting density (16 plant m−2), respectively.
Agronomy 10 01545 g006
Figure 7. Simulation results of vertical light interception at different planting densities and canopy positions (A) and the averaged light interception of lettuce plants according to position in the canopy (B). The canopy was divided into one plant in the center and eight outer plants. HD and LD indicate high planting density (25 plants m−2) and low planting density (16 plants m−2), respectively.
Agronomy 10 01545 g007
Figure 8. Light interception and coefficient for variance of light interception (CVLI) under different light source arrangements and lighting distances. Light sources were arranged vertically above (VAP) the plant or between (BP) the plants.
Agronomy 10 01545 g008
Figure 9. Difference in light interception when floor surface is changed from non-reflective to high-reflective material at different light arrangements and lighting distances. Light sources were arranged vertically above the plant (VAP) or between the plants (BP).
Agronomy 10 01545 g009
Figure 10. Light interception (A), estimated net photosynthetic rate (B), and light use efficiency for intercepted light (LUEI) (C) at different light arrangements, lighting distances, and floor reflectances. Light sources were arranged vertically above the plant (VAP) or between the plants (BP). Floor surface was set at non-reflective (NR) or high-reflective (HR) material.
Agronomy 10 01545 g010
Figure 11. Optimal photosynthetic photon flux density (PPFD) setup (PPFDopt) for achieving the maximal light use efficiency (LUEE,max) for different light arrangements, lighting distances, and floor reflectances. Light sources were arranged vertically above the plant (VAP) or between the plants (BP). Floor surface was set at non-reflective (NR) or highly-reflective (HR) material.
Agronomy 10 01545 g011

