Article

Foliar Application of Zn Alleviates Salt Stress Symptoms of Pak Choi Plants by Activating Water Relations and Glucosinolate Synthesis

1
Horticulture Department, Mohaghegh Ardabili University, Ardabil 56199-13131, Iran
2
Group of Aquaporins, Plant Nutrition Department, Centro de Edafologia y Biologia Aplicada del Segura, CEBAS-CSIC, Campus Universitario de Espinardo, E-30100 Murcia, Spain
*
Author to whom correspondence should be addressed.
Agronomy 2020, 10(10), 1528; https://doi.org/10.3390/agronomy10101528
Submission received: 29 August 2020 / Revised: 1 October 2020 / Accepted: 2 October 2020 / Published: 8 October 2020

Abstract

:
Several studies have related the application of micronutrients such as zinc, iron and molybdenum with alleviation of stress symptoms in horticultural plants. However, there are few studies that correlate the microelements with water relations. The main objective of this study was to determine the effect of the foliar application of Zn on pak choi (Brassica campestris, L.) plants grown under saline conditions. When plants were grown in a nutrient solution containing 0 or 80 mM NaCl, shoot biomass was greatly decreased, while, in a separate experiment, Zn toxicity was observed when it was applied at concentrations above 50 µM as a foliar spray. In a third experiment, low Zn applications, mainly 25 µM, enhanced parameters such as gas exchange, biomass and glucosinolates synthesis in plants grown under saline conditions (80 mM NaCl). Also, Zn application provoked a rise in membrane integrity and decreased oxidative damage in root cells. In conclusion, Zn application decreased oxidative damage and increased the content of glucosinolates, which could act as important signals to improve water uptake and transport and, as a consequence, alleviate salinity stress in pak choi plants.

1. Introduction

Environmental stresses have many detrimental effects on the quality and yield of crops [1,2]. Salinity is one of the most important stresses in the world, since it affects almost 1.5% of agricultural lands, and salt stress provokes decreases in crop production, mainly because of reduced water flow and ionic imbalance in the plants [3]. Therefore, under salt stress, plants usually suffer effects that can be divided into three types: osmotic, toxic and ionome changes. The ion accumulation in soil decreases the water flow into roots [4]. Also, high concentrations of sodium (Na) inside cells cause an ion imbalance, because this element is an antagonist of potassium (K) and decreases its concentration in tissues and cells [5]. Salinity effects are the results of complex interactions among morphological, physiological and biochemical processes [6]. Also, salt stress reduces the rate of photosynthesis, with the consequent decline in crop yield. Such effects explain why salinity is one of the main abiotic stresses of interest to researchers [2,5,7].
The function of zinc (Zn) as a micronutrient involves the activity of six groups of enzymes including isomerases, hydrolases, lyases, transferases and oxidoreductases [8], and it also has important structural functions in cells, being necessary for their integrity, particularly under stress conditions [9]. Furthermore, Zn and iron (Fe) are important metals in redox activity [10,11]. Also, recent studies have suggested that fast uptake of Zn by plants could be the key point of its role against stress [12,13]. Indeed, several studies on different plants, such as soybeans, cordgrass and tomato, under salinity condition have suggested that Zn increased the tolerance against salt stress, due to this element playing an important role in antioxidant metabolism as a cofactor of main enzymes [14,15,16]. However, there are few experiments involving Zn action on water status of plant under salinity conditions. In this way, recent studies with Zn application together with other elements such as calcium, boron or silicon, have shown an enhanced growth and some physiological parameters, such as chlorophyll and proline content, that alleviated salinity stress in potato and mungbean plants [17,18]. But, so far, the mechanism of the effect of Zn needs to be elucidated.
Pak choi (Brassica campestris L.) is an Asian leafy vegetable of the Brassicaceae family, and nowadays it is cultivated worldwide. These plants are important to human health because they contain compounds like folate, vitamin C, carotenoids, phenolic compounds and glucosinolates [19,20]. The glucosinolates (GSLs) are sulphur- and nitrogen-containing glycosides and so far, about 200 types have been described [21]. These compounds are chemically stable under normal conditions, but when plants are injured, they are hydrolysed to isothyocianates by myrosinase [22]. The GSLs and their breakdown products have been reported to have antioxidant, anticancer and antimicrobial effects [23,24,25]. Under salinity conditions, brassicas such as broccoli and Arabidopsis plants have showed an increase of GLS that improved the capacity of plants against salt stress symptoms and maintain the plants’ growth under this condition [26,27]. Likewise, the salt tolerance of brassicas plants have been reported by several studies, including pak choi plants, in this sense showing that 50 mM of NaCl concentration affected their growth [28].
However, the application of some elements, such as Mo or Se, have been described as beneficial to increase the tolerance against stress conditions such as dry and metal toxicity [29,30,31]. There is limited information on the Zn foliar effect on brassicas plants such as pak choi, like as a biostimulant against salt stress and inductor of GLS synthesis. The first objective of the present study was to determine the degree to which supplementation with Zn could decrease the inhibitory effects of salinity on pak choi. For that, we first separately investigated the effects of different Zn and NaCl concentrations on pak choi. Then, we studied the beneficial effects of Zn application on pak choi plant growth under saline conditions, by determining the biomass, gas exchange, membrane integrity, and ionome. We also investigated the GSLs concentrations as a possible connection between the beneficial effect of Zn and the response of water relations.

2. Material and Methods

2.1. Plant Material and Growth Conditions

In order to obtain plant material, pak choi (Brassica campestris L. ssp. chinensis var. communis) seeds from SAKATA Iberica S.A., were hydrated for 24 h, with aeration. After this, the seeds were germinated in vermiculite, in an incubator at 28 °C in darkness, for two days. Then, the seedlings were transferred to a growth chamber and, when they reached the two-leaf stage, were transferred to hydroponic cultivation with Hoagland solution under control conditions. The plants were grown with a temperature of 20–25 °C, a relative humidity (RH) of 60% (day) and 80% (night), a 16 h light and 8 h dark cycle, and photosynthetically active radiation (PAR) of 400 μmol m−2 s−1, provided by Pacific LED, WT 470C, LED8OS/840 PSD WB L1600 lights (Philips). The plants grew under controlled conditions and without any type of treatment for 10 days.
In order to verify the effect of foliar application of Zn under saline conditions, three different experiments were carried out. In each of them, different treatments were applied to 5 plants per treatment.
  • Salinity experiment.
    (i)
    Control: the plants were grown without NaCl (Hoagland solution).
    (ii)
    Salinity: NaCl concentrations of 40, 80, 120 or 160 mM were added to the nutrient solution.
    The treatments were applied the same day and were maintained for 15 days.
  • Zn foliar application.
    (i)
    Control: the plants were grown without foliar Zn application.
    (ii)
    (Zn solutions: 3 mL per plant, containing zinc sulphate at concentrations of 50, 100, 500 or 1000 µM, with 0.1% non-ionic, organo-silicon surfactant, were sprayed onto the leaves three times a week for one week. As we had found previously that 25 µM zinc sulphate did not produce any negative effect on plant biomass [32], in this experiment, to check the levels of toxicity, the lowest concentration was 50 µM.
  • Combination treatments.
    Based on the results of the previous experiments, main dosages of NaCl or Zn were used to carry out this one. The experiment was carried out for 15 days and included two levels of nutrient solution salinity (0 and 80 mM NaCl) for two weeks and three levels of Zn (0, 25 and 50 µM) applied as a foliar solution by spraying (3 mL per plant) three times in the last week of the experiment. One day after the last Zn application, the gas exchange parameters were determined, and tissue samples were collected for the rest of the measurements.
    All samples were collected 45 days after germination, washed thoroughly with tap water and 0.1% non-ionic detergent, and washed twice with distilled water before being frozen at −80 °C. Then, the samples were lyophilized and weighed to obtain the dry weight.

2.2. Gas Exchange Parameters

The gas exchange parameters—transpiration, stomatal conductance, assimilation and internal CO2 (CI)—were measured in the fourth fully expanded leaf of each plant by a LI−6400 portable photosynthesis system (LI-COR Inc., USA), in a total of 5 plants per treatment. The measurements were carried out one day after the last foliar application of Zn and three hours after the chamber lights had been turned on.

2.3. Ion Concentrations

For ion analysis, all the fully expanded leaves were collected, thoroughly washed with tap water and 0.1% non-ionic detergent, and then washed twice with distilled water. The roots of the plants were washed with distilled water three times to remove the nutrients adhering to the tissue. The leaves and roots were frozen at −80 °C and then lyophilised. Finally, finely ground samples of lyophilised material were digested in a microwave oven (CEM Mars Xpress, North Carolina, USA) by HNO3:HClO4 (2:1) digestion. The elements were detected by inductively coupled plasma (ICP) analysis (Optima 3000, PerkinElmer).

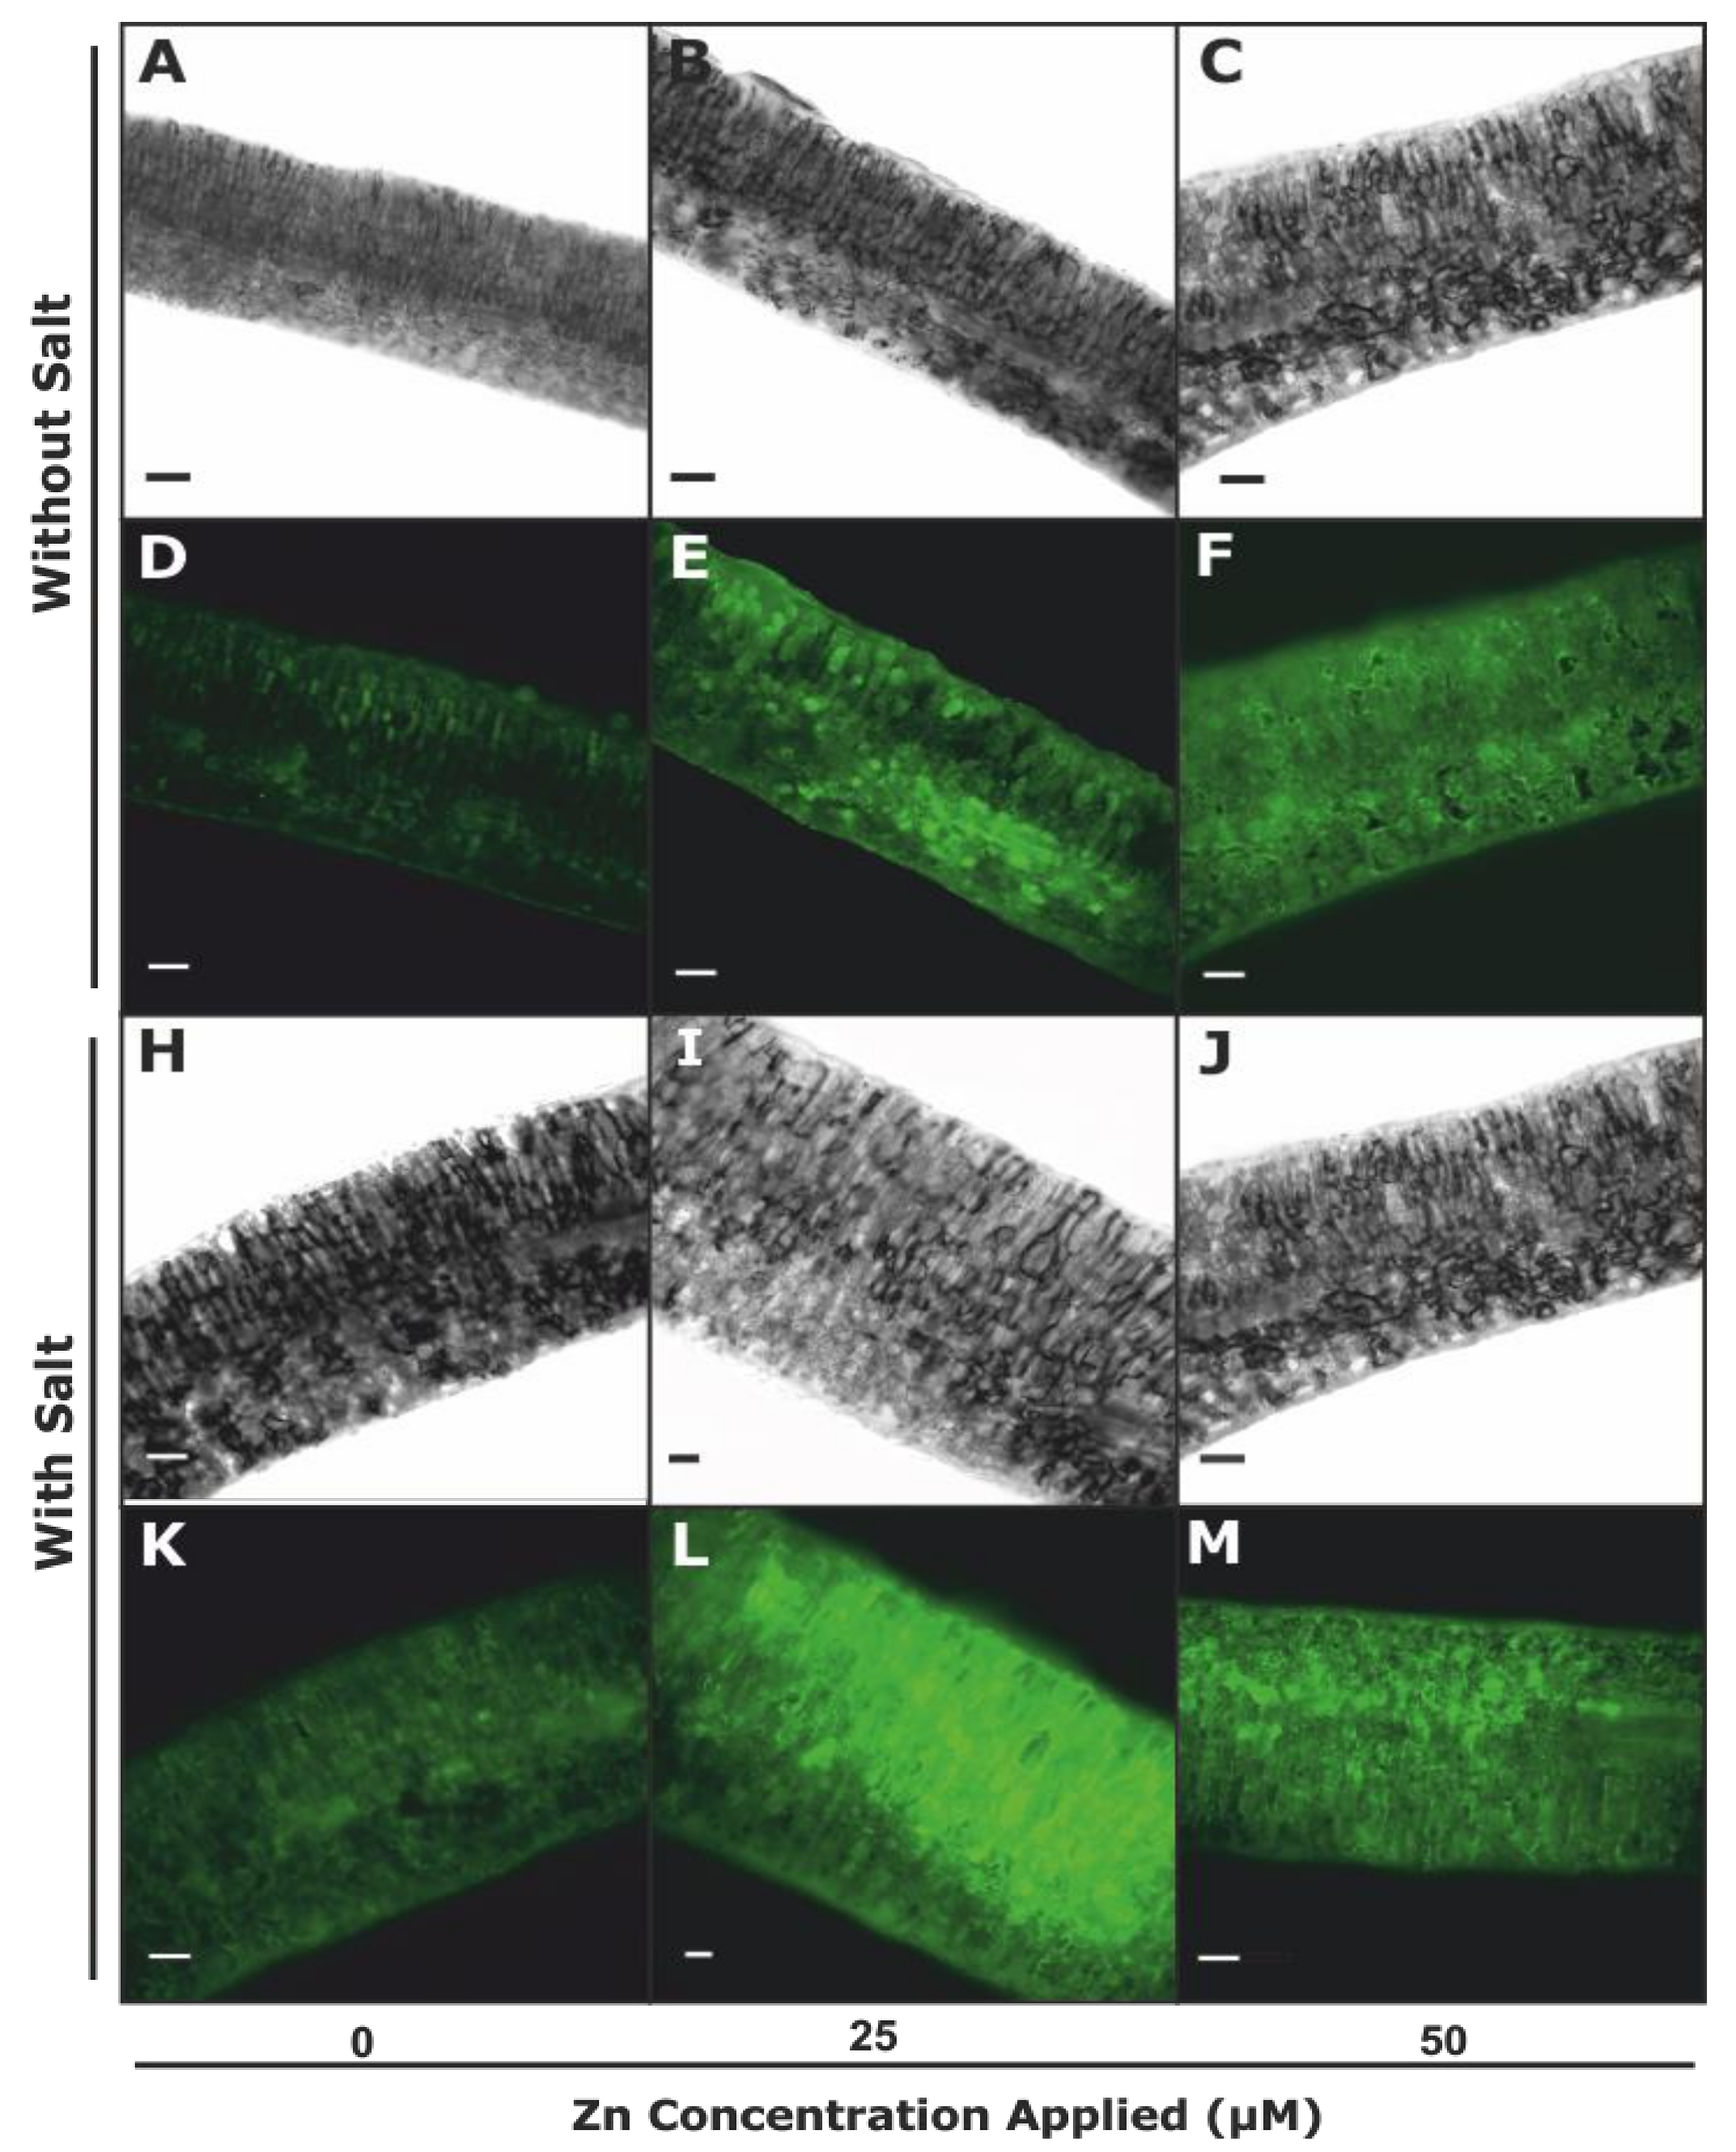
2.4. Histochemical Staining and Malondialdehyde (MDA) Concentration

As pak choi plants have a highly branched root system, four tips of secondary roots per plant were selected for histological staining. To determine the plasma membrane integrity of root cells, sections taken 5 cm from root tips were stained according to Wang and Yang [33]. Root sections taken 5 cm from the apex were washed with 0.5 mM CaCl2 (pH = 4.5) and then incubated in Evans blue (0.025%, v/v) for 20 min. Finally, the sections were washed three times with distilled water before being studied under a light microscope and photographed with a digital camera.
For lipid peroxidation localisation, root sections taken 3 cm from the apex were stained according to Pompella et al. [34]. The sections were exposed to a staining mixture that contained 0.05 g of fuchsine dissolved in 50 mL of distilled water plus 0.5 mL of concentrated HCl, completed with the addition of 0.5 g of Na2SO3. The samples were then maintained in dark conditions for 5 minutes. After this, the sections were transferred to 0.5% (w/v) K2S2O5 that contained 0.05 M HCl, to show the red colour. The images were taken using a binocular Olympus SZ-PT microscope fitted with a digital camera (Altra 20 Olympus UCMAP 3).
Also, the MDA concentration was assessed in roots using the assay as described by Fu and Huang [35]. Briefly, 0.1 g of tissue was homogenised with mortar and pestle on ice in 1 mL of 0.25% thiobarbituric acid (TBA) in 10% trichloroacetic acid (TCA). The slurry was centrifuged at 10,800× g for 25 min at 4 °C. Aliquots of 0.2 mL of the supernatant were supplemented with 0.8 mL of 20% TCA containing 0.25% TBA, the mixture was heated at 95 °C for 30 min and then quickly cooled on ice. Samples were then centrifuged at 10,800 × g for 10 min at 4 °C, and the absorbance of the supernatant was read at 532 nm. Nonspecific absorption at 600 nm was subtracted from the reading at 532 nm. The concentration of MDA was calculated using an extinction coefficient of 155 mM/cm.

2.5. Zynpyr-1 Staining

Pak choi leaves were washed three times with distilled water to remove residual Zn from the leaf surface. After this, leaf sections, approximately 150 nm thick, were taken carefully by hand, with a scalpel. The slices were stained by Zynpyr-1 staining. A stock solution was obtained by reconstitution of the product in DMSO. Afterwards, working solutions of Zynpyr-1 (BioVision, Milpitas, CA, USA), at final concentrations of 5 and 25 µM, were made by diluting a 0.3 mM stock solution in a 0.5% saline solution. Leaf-section images were taken on a Leica DM CTR.6 (Leica Microsystems, Wetzlar, Germany) microscope, using bright light or fluorescence excitation at 488 nm.

2.6. GSLs Determination

The GSLs were quantified using LC, according to a reported method [36], with slight modifications. The HPLC-DAD analyses were carried out in an Agilent 1260 Infinity system equipped with a binary pump (model G 1312 B), degasser (model G 1379 B), autosampler (model G 1313–44510) and diode array detector (DAD) (model G 4212 B), and controlled by the Agilent software B. 02. 02. The mobile phases and gradient were the same as those used for the identification, but with a flow rate of 1 mL/min and a 20 µL injection volume. The intact GSLs were identified according to their UV spectra, and the order of elution previously described for similar acquisition conditions. The GSLs were quantified using sinigrin and glucobrassicin (GBS) as standards of aliphatic and indole GSLs, respectively (Phytoplan Diehm & Neuberger, GmbH, Heidelberg, Germany).

2.7. Statistical Analysis

The data were subjected to a Kolmogorov–Smirnov test to check their normality. As the values followed a normal distribution, they were subjected to a simple analysis of variance (ANOVA) at the 95% confidence level, using the software SPSS Release 18 for Windows (SPSS Inc., Chicago, IL, USA). A two-tailed ANOVA was applied to ascertain whether the salinity and Zn application significantly affected the results, and the means were compared by Fisher’s least-significant differences (LSD). The significant levels for both analyses were expressed as: * p < 0.05, ** p < 0.01, ***p < 0.001. The values presented are the means ± SE.

3. Results

3.1. Effect of Zn Foliar Application or Salinity on Plant Growth

Figure 1A shows the biomass (root and shoot), expressed as grams of dry weight per plant (DW), of pak choi plants grown at different salt concentrations (0, 40, 80, 120 and 160 mM NaCl). The results do not show any effect of salt on root growth. Although 40 mM NaCl did not produce a reduction in shoot biomass with respect to control plants, concentrations of 80 mM or higher caused a significant decrease; for instance, shoot biomass was 4.38 g DW at 80 mM NaCl, versus 6.6 g DW for plants grown without salinity.
Figure 1B shows the effect of different concentrations of Zn (0, 50, 100, 500 and 1000 µM) on the root and shoot biomass of pak choi plants. The shoot biomass did not change with 50 µM Zn, relative to control plants. However, concentrations of 100 µM or higher provoked a decrease: with values of 4.4 g DW and 3.2 g DW per plant when 100 and 1000 µM respectively, were applied, versus 6.58 g DW for the control plants. Nevertheless, Zn did not have any effect on root biomass, with no significant differences between treatments.

3.2. Effects of Salinity and Zn Application on Pak Choi Plants

3.2.1. Plant Growth and Gas Exchange Parameters

The effects of individual and combined Zn and NaCl application on biomass and gas exchange are summarised in Table 1. The results show significant differences between treatments in all parameters determined under salinity and not salinity conditions. Thus, foliar application of 25 µM Zn enhanced shoot biomass by 27% with respect to control plants. However, the 50 µM dose of Zn did not produce changes in shoot biomass. In contrast, the shoot biomass of plants grown under saline conditions was reduced by 41%. Also, Zn application under saline conditions provoked a recovery of shoot biomass to the control value (Table 1). On the other hand, Zn application had no effect on root biomass in the absence of salinity, although under saline conditions, both 25 and 50 µM Zn provoked an increase in root weight (Table 1).
The transpiration values did not show significant differences when Zn was applied in non-saline conditions, or when 80 mM NaCl was applied in the absence of Zn (Table 1). However, transpiration was enhanced by 77% and 63% respectively, by 25 and 50 µM Zn applied under saline conditions. The stomatal conductance decreased in plants treated only with salt. We did not observe changes with other treatments, with respect to control plants (Table 1).
The CO2 assimilation results show that Zn application increased the values, in both the presence and absence of saline conditions, with respect to control plants. The highest value was observed with the application of 25 µM Zn. In addition, salinity induced a decrease in CI, giving the lowest value of this parameter. However, the Zn applications yielded increases in CO2 assimilation—10% and 31% with 25 and 50 µM Zn, respectively—to values that were similar to that of the control plants, with no significant differences (Table 1). They also enhanced the CI, with respect to plants grown under saline conditions in the absence of Zn application.

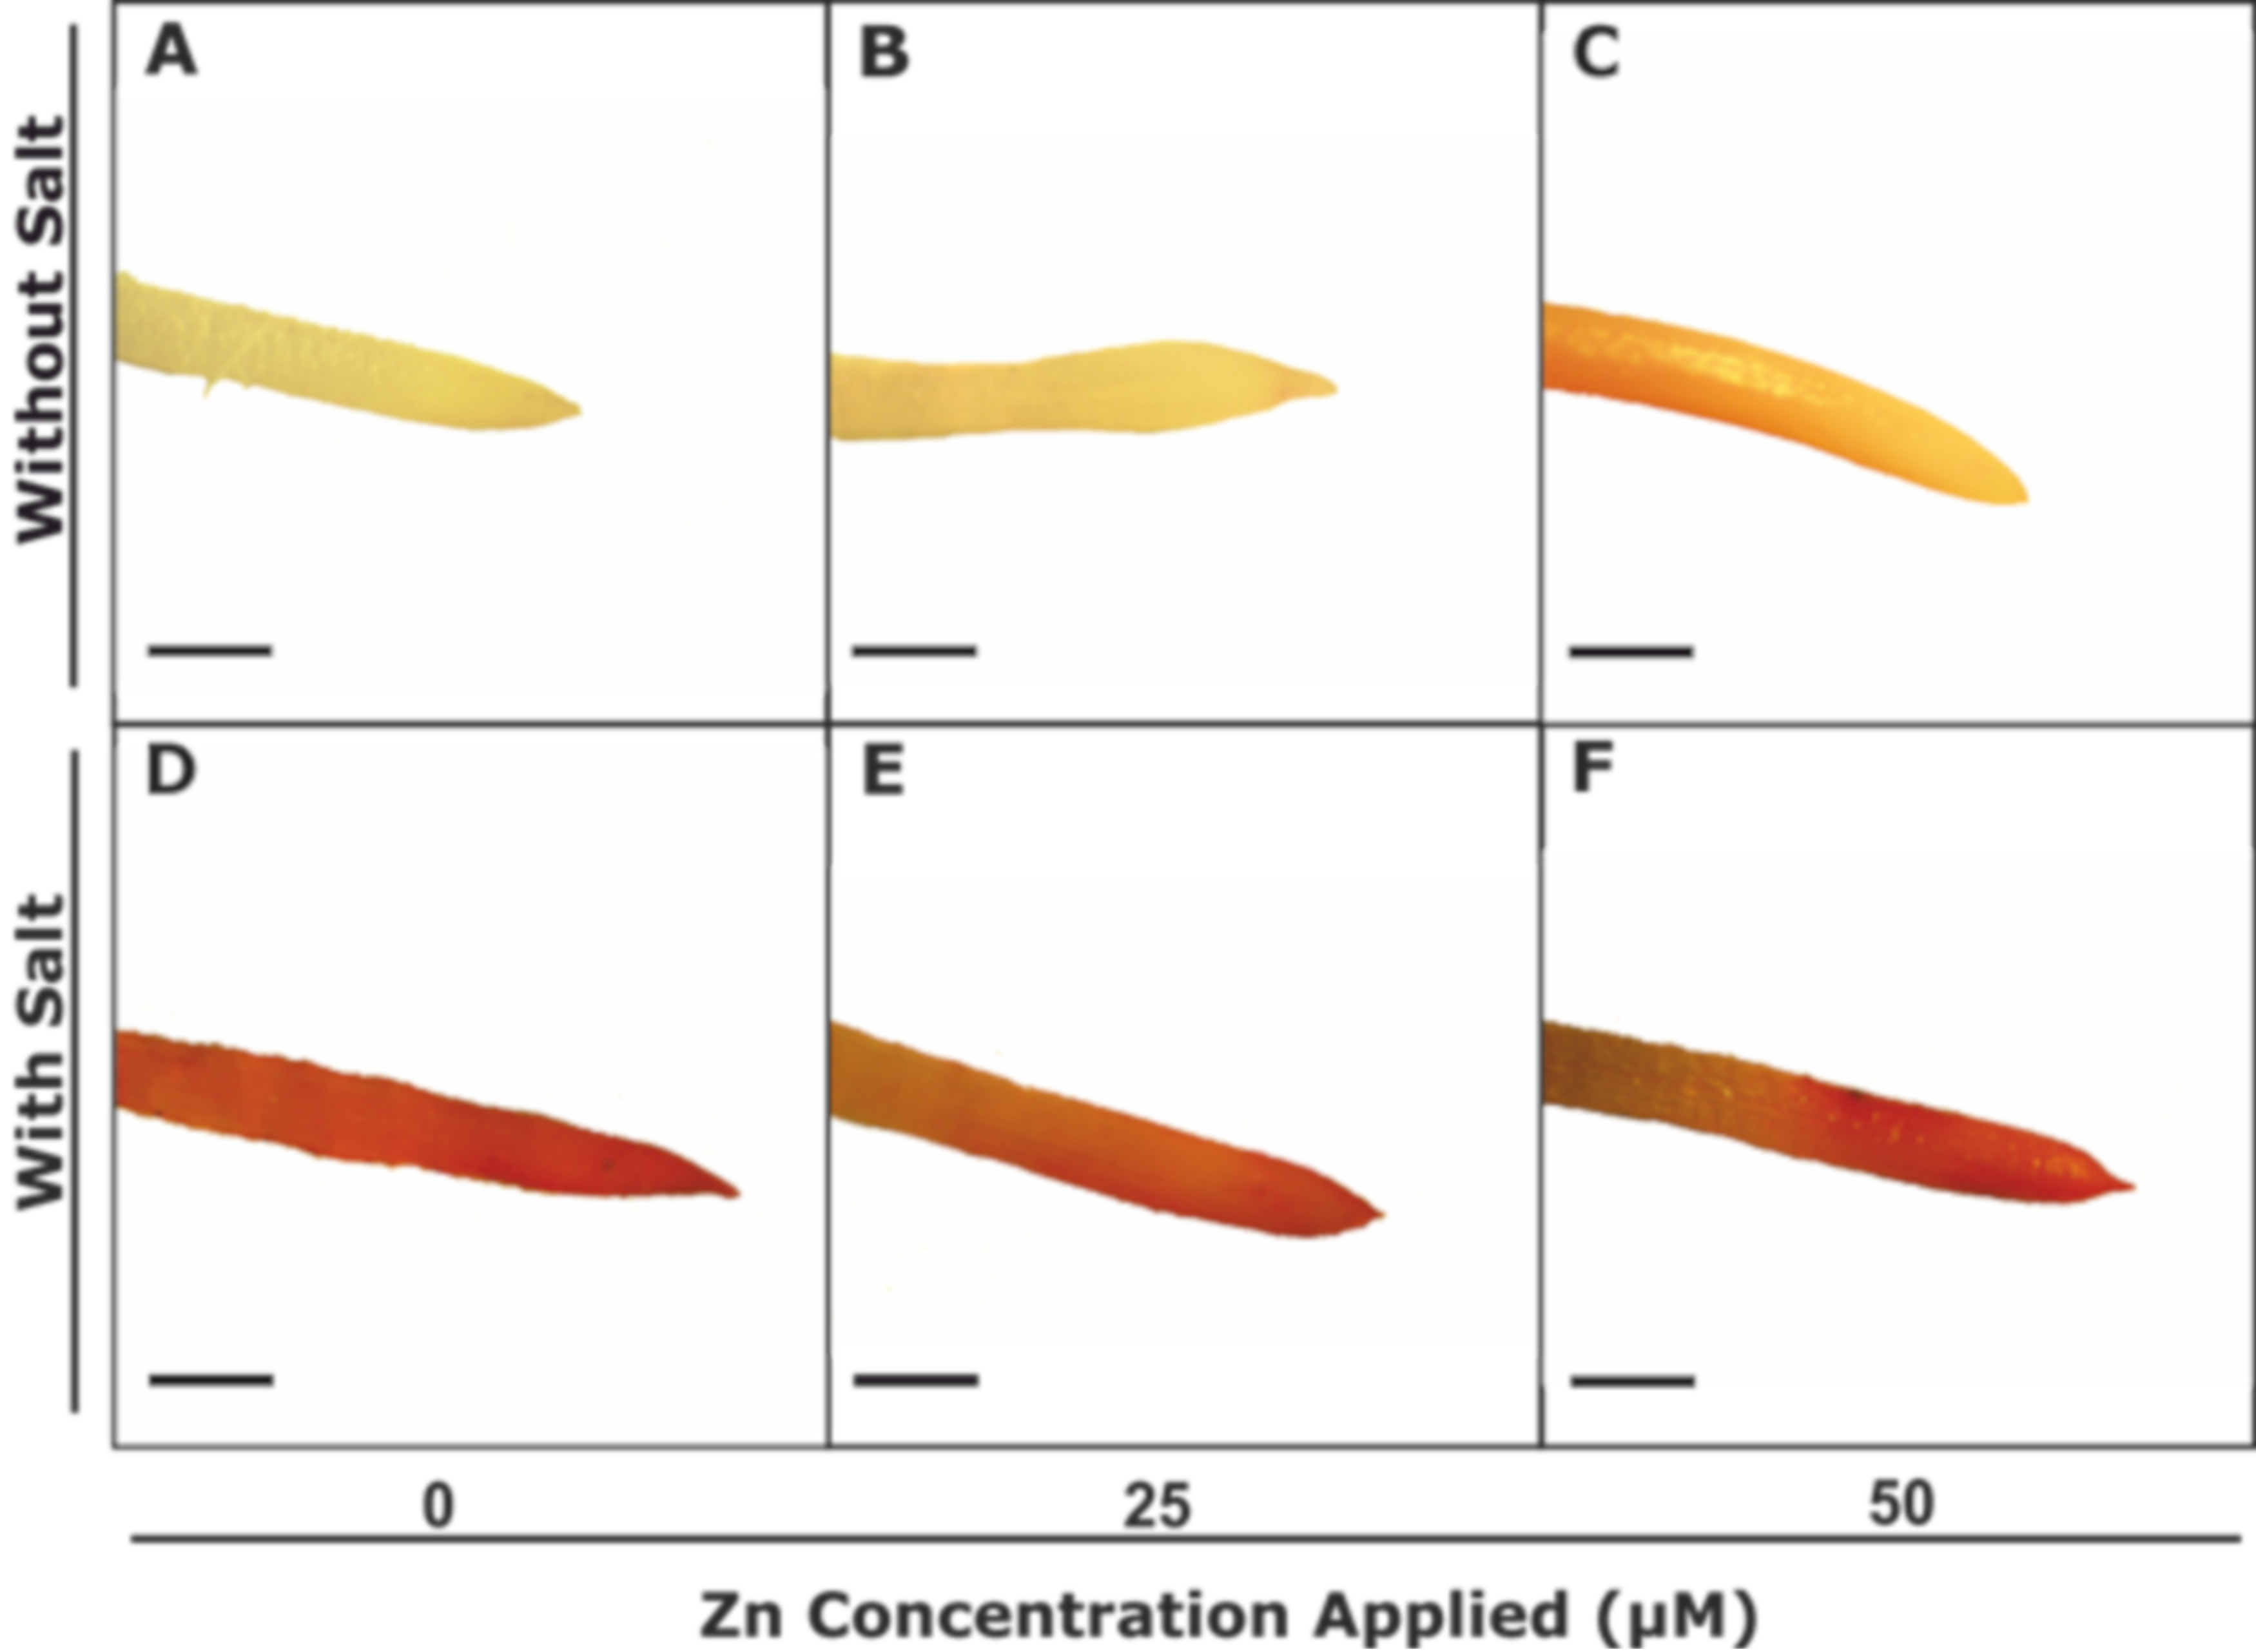
3.2.2. Plasma Membrane Integrity and Lipid Peroxidation

Plasma membrane integrity, determined by the Evans blue staining method, is shown in Figure 2. Under control conditions blue staining was not observed, indicating high membrane integrity (Figure 2A). The images show that after Zn application under optimal conditions, the blue colour was not found with a dose of 25 µM Zn, but some blue areas appeared close to the root apex when 50 µM Zn was applied (Figure 2B,C). However, the image of a root exposed to salinity shows a strong dark-blue stain along the root tip (Figure 2D). Also, the images pertaining to the combined treatments show that both provoked a decrease in both the area and intensity of the blue stain in root tips. Furthermore, the intensity of the blue staining was lower at 25 µM Zn than at 50 µM (Figure 2E,F).
The lipid peroxidation results are shown in Figure 3 and Figure 4. The images show root tips, and red-stained areas indicate lipid peroxidation and MDA concentration in roots. We did not observe any stained areas in roots of plants grown under control conditions or treated only with Zn (Figure 3A–C); in concordance with these images, the concentration of MDA did not affect only when Zn treatment was applied. However, the root tips exposed to salinity showed red staining along practically their entire lengths. For plants grown under saline conditions and treated with Zn, the images show a smaller area of red coloration, at both 25 and 50 µM Zn, with respect to the roots of plants exposed to salinity alone (Figure 3E,F).
In this sense, the MDA concentration was higher under saline conditions than under control conditions. Application of Zn under non-saline conditions did not significantly affect the MDA concentration (Figure 4). However, when Zn was applied together with NaCl, a significant decrease in MDA was observed with respect to the plants treated only with NaCl.

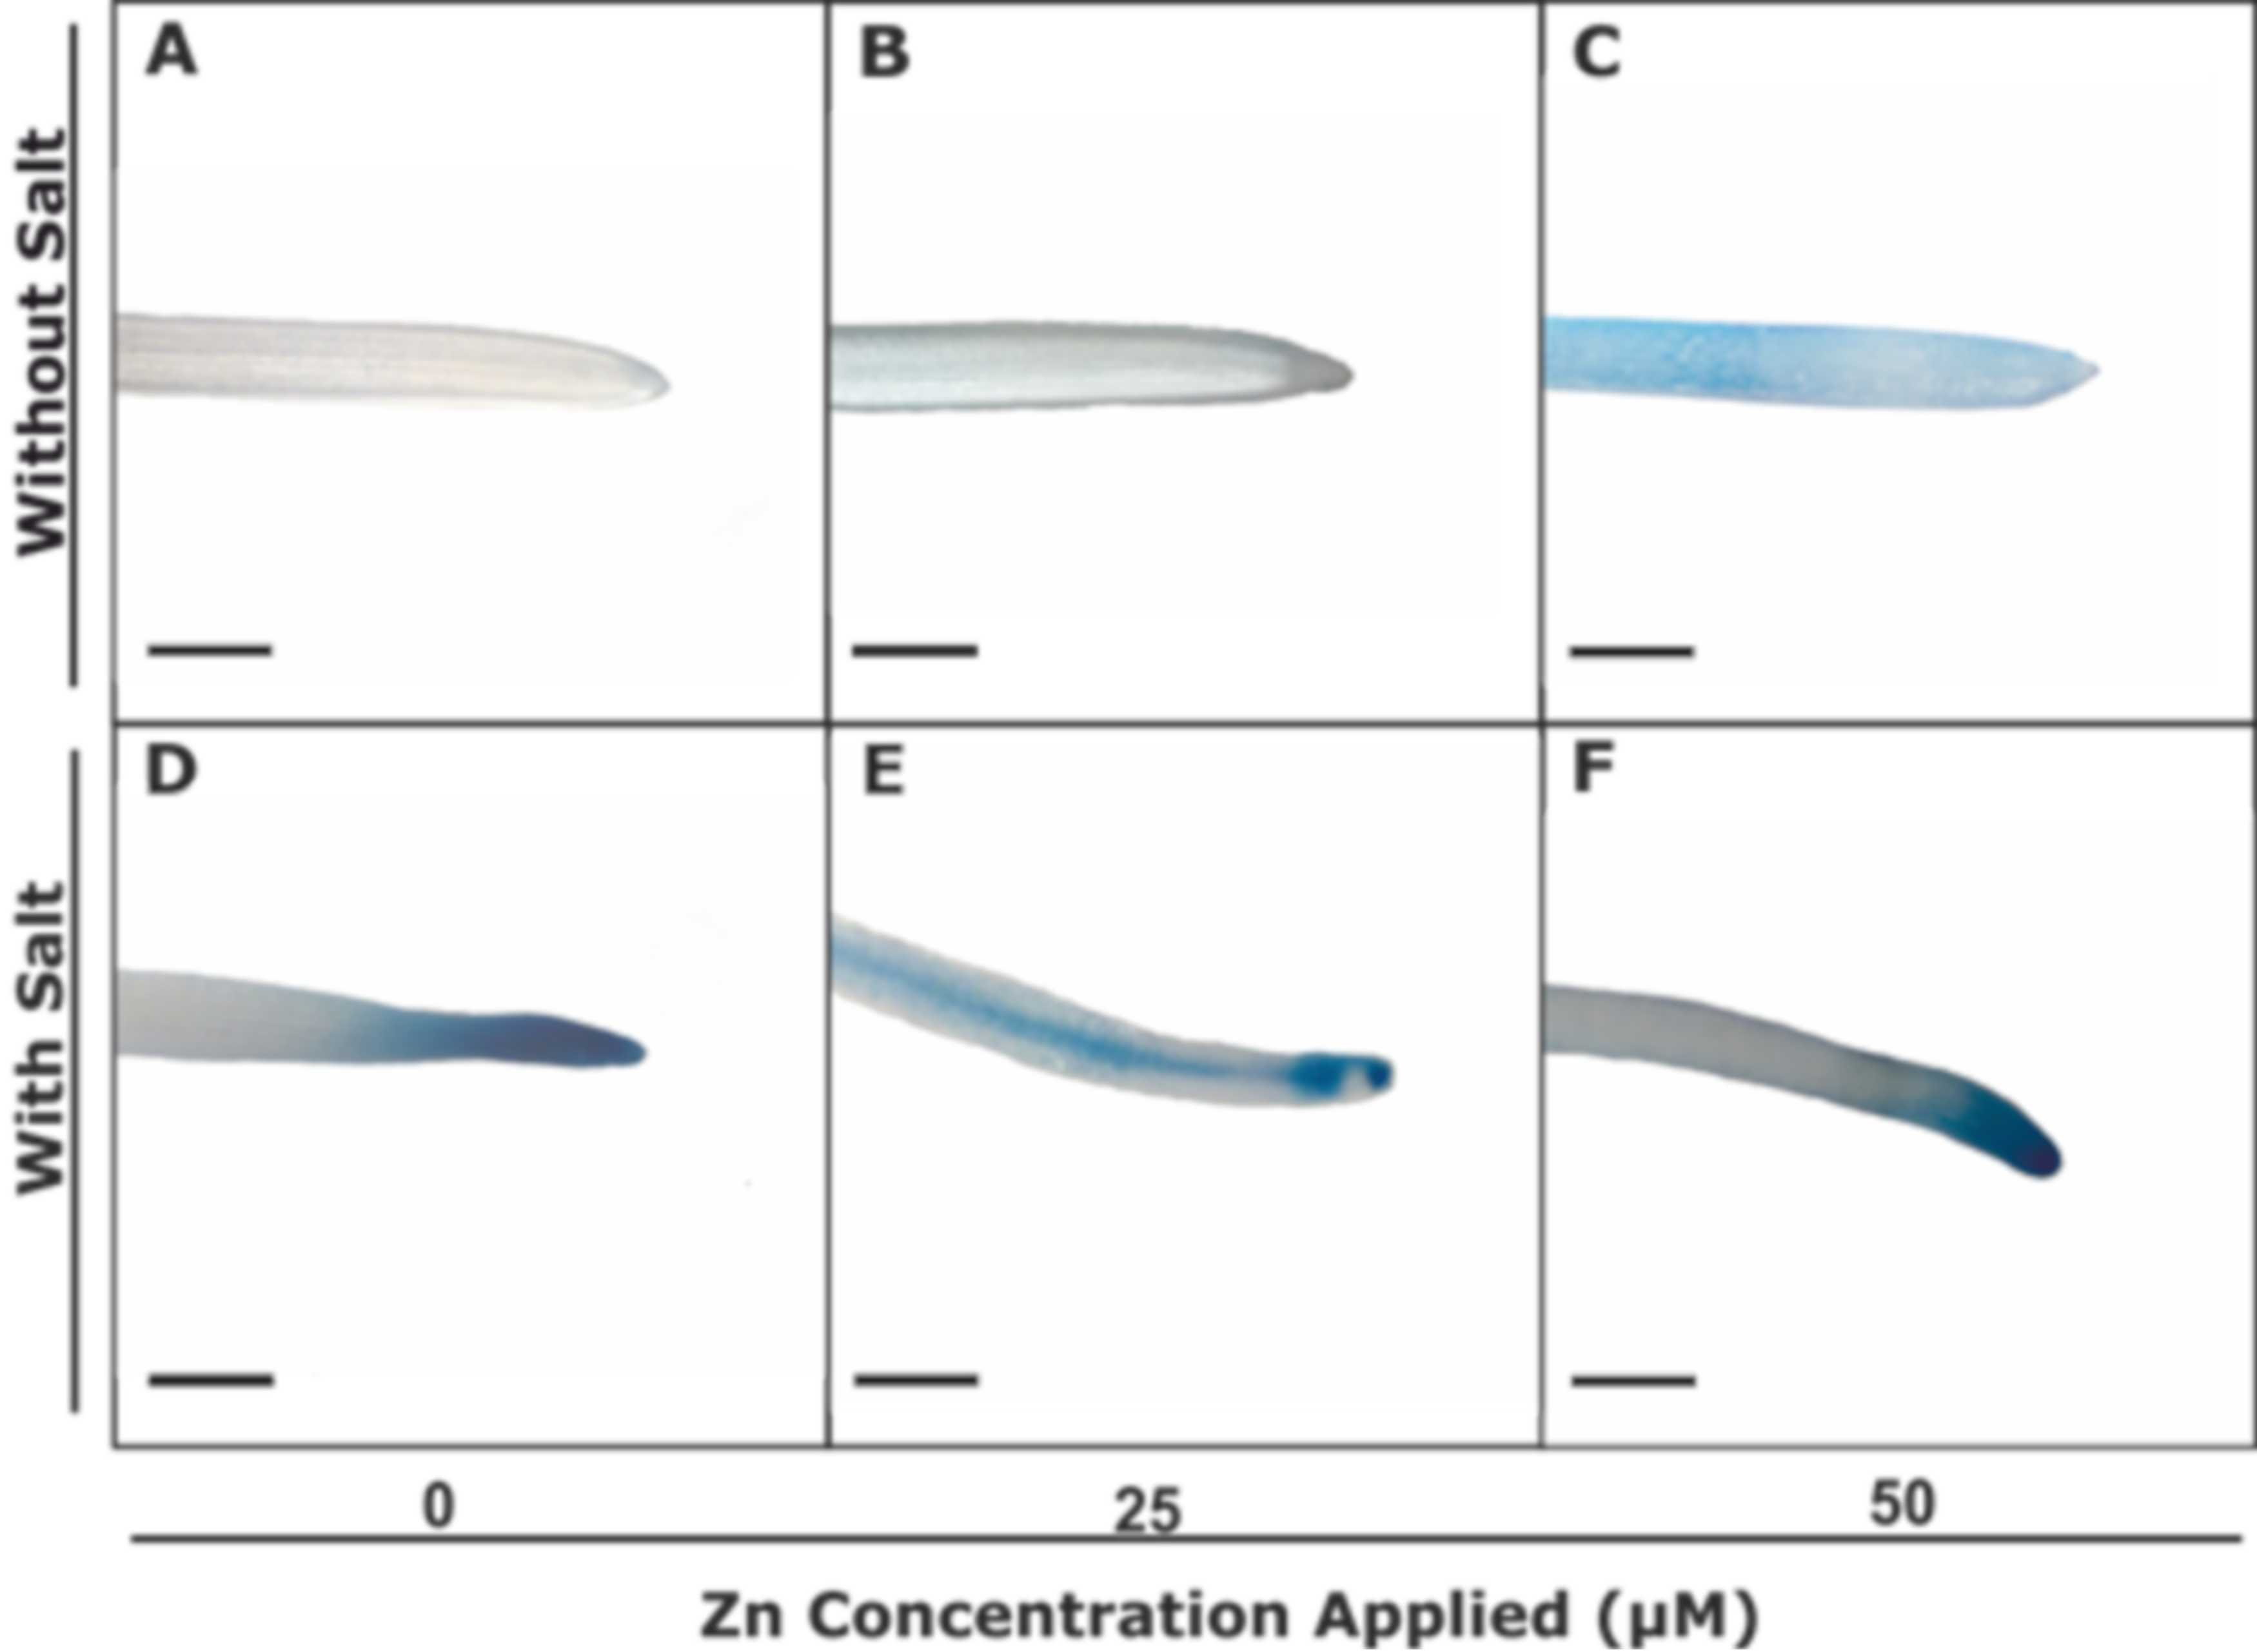
3.2.3. Zn-Pyr Staining

Figure 5 shows images of pak choi leaf sections. Under bright light, the images do not show any changes in histological structures; however, salinity provoked an enhancement of leaf thickness with respect to that of control plants (Figure 5A,H–J). Also, Zn application did not provoke any modification with respect to control plants (Figure 5A–C). The fluorescence images show Zn entry into leaves (Figure 5D–F,K,L). The green fluorescence corresponds to Zn localization and the image demonstrates that Zn passed through the epidermis and was distributed throughout the mesophyll layer. Also, the entry of Zn into the leaves of plants grown with salinity was greater than in those plants grown without salt (Figure 5E,F,L,M). Furthermore, the application of Zn at 25 µM combined with the salt treatment produced greater penetration, since we observed the brightest fluorescent staining with this treatment (Figure 5L).

3.2.4. Ion Concentrations

The macronutrient concentrations in leaves are shown in Table 2. There were no significant differences in the Ca concentration due to Zn application. However, under saline conditions, the Ca concentration in leaves was reduced, with significant differences between saline and non-saline conditions. In the same way, Zn application had no effect on the leaf Mg concentration in both saline and non-saline conditions, but in plants exposed to salinity, the concentrations were lower than in control plants.
Under non-saline conditions, Zn application did not produce any effect on the leaves’ K concentration. Nevertheless, under saline conditions, the K concentration was reduced by 50% with both Zn applications (25 and 50 µM) and by 33% without Zn. On the other hand, salinity increased the Na and P concentrations, independently of the Zn application, obtaining Na concentrations 10-times higher than in plants grown without salinity. The Na and P concentrations were not affected significantly by Zn application (Table 2).
Concerning the microelements in leaves (Table 3), the plants exposed to salinity had higher concentrations of both Fe and Mn than those grown without salt. Zinc application did not affect the Fe and Mn concentrations. The Cu concentration did not change with any of the treatments. Salinity produced an increase in the Zn concentration in leaves. Also, Zn application produced a 31% rise in comparison with untreated plants, in the absence of salinity. The Zn application under saline conditions gave the highest values, at both Zn doses (Table 3).
In roots, there were no significant differences in the Ca concentration due to Zn application under non-saline conditions (Table 4). However, when salinity was applied, a reduction in the Ca concentration of almost 50% with respect to plants grown without salinity was observed, independently of the Zn treatment. Under sanity conditions, the Mg concentrations in the plants were lower than in control plants, and Zn foliar treatments had no effect on the Mg concentration under any conditions in roots. Respect to K concentration showed significant differences between salinity conditions. Likewise, under saline conditions, the K concentration was reduced almost 50% with respect to non-saline conditions. In addition, foliar Zn application enhanced K values under salinity with respect to the treatment involving salinity alone (Table 4). On the other hand, the Na showed a strong increase under salt conditions, and we did not observe any effect of Zn application on Na concentration in roots for any of the growth conditions. P concentration did not show any changes under any treatment (Table 4).
Regarding the micronutrients in roots (Table 5), under salt conditions, the plant showed a lower Fe concentration than without salt; also, Zn-applied treatment showed better Fe concentration under the salinity condition. In this sense, and under the salt condition, foliar Zn application provoked an increase of Mn concentration values. We did not observe any effect to Mn concentration in plants grown under non-salt conditions. Also, Cu concentration has been affected by either salt condition or Zn application. On the other hand, although salt conditions provoked a lower Zn concentration when the plants were not treated with foliar Zn, the element, Zn, concentration in roots was higher in plants subject to foliar Zn application than control plants with or without salt conditions. Under the salinity condition, the application of 50 µM of Zn showed the lowest value of Zn foliar treatments (Table 5).

3.2.5. Glucosinolate Concentrations

Figure 6 shows the GSLs concentrations in pak choi plants subjected to different salt treatments and Zn applications. It can be observed that saline conditions produced an increase in the total GSLs concentration in pak choi leaves but not in roots. Application of Zn did not have an effect on the total GSLs concentration, in leaves or roots. When both treatments were combined, the total GSLs concentration was greater than in plants treated separately (Figure 6A,B). The enhancing effect of Zn was demonstrated in the analysis of variance with p < 0.001, indicating a positive interaction of Zn for GLS under salinity conditions to all GLS parameters shown.
Aliphatic GSLs did not show significant differences due to the salinity or Zn treatments, nor did the combined treatments provoke changes in the aliphatic GSLs concentration in pak choi leaves (Figure 6C). However, saline conditions decreased their concentration in roots, in the absence of Zn application. Regarding the combined treatments, we did not observe significant differences when 25 µM Zn was applied, with respect to control plants. The application of 50 µM Zn increased the concentration of aliphatic GSLs above the values obtained in plants treated only with salinity, but it was still lower than in control plants (Figure 6D).
Finally, the indolic GSLs concentration did not change with the Zn application, in leaves or roots. However, salinity provoked an enhanced abundance of these GSLs. Also, the combined treatments increased their concentrations, in both leaves and roots (Figure 6E,F).

4. Discussion

Many studies have indicated that one of the most important symptoms of salinity stress in plants is growth inhibition [37]. The impact on growth is not only dependent on the salt concentration, but is also related to the particular plant involved and its salinity tolerance [5]. In this sense, our results indicate that pak choi is not highly salt tolerant: it suffered an important loss of shoot biomass at 80 mM NaCl. In fact, its tolerance could be considered, within the Brassicaceae, higher than that of Arabidopsis, but lower than that of broccoli, since Arabidopsis cannot withstand more than 30 mM NaCl, and NaCl concentrations below 100 mM are enough to prevent it completing its lifecycle [5]. However, previous studies showed that broccoli plants could resist NaCl concentrations of up to 120 mM without a great effect on growth [38]. Also, other authors indicated that pak choi showed a tolerance on 50 mM of NaCl, a similar ratio to rice but far below those of barley and alfalfa [5,28].
Studies carried out with beans and Brassica plants suggested that growth inhibition under saline conditions could be related to a reduction of stomatal conductance [39,40]. This is in concordance with our results in pak choi plants. Salt exposure provoked a decrease in stomatal conductance and, in consequence, a lower rate of photosynthesis that finally decreased plant biomass—as described in B. nigra, B. napus, B. campestris and B. carinata [39]. However, studying broccoli plants, a marked decline in stomatal conductance without biomass reduction under salinity was observed. These authors suggested a double response of broccoli plants to salinity [38]. However, our pak choi plants showed a pattern similar to that described by Ashraf [39]. The application of Zn provided better gas exchange values, including stomatal conductance; in consequence, the salt tolerance of pak choi plants was greater. In contrast, Zn application had no effect on the Na and K concentrations in pak choi plants, indicating that the salt-injury symptoms were not due to high ionic concentrations, as suggested for bean plants [40]. Also, Zn is considered an essential micronutrient, and co-factor of several enzymes in plant cells [41,42]. Pak choi has not been described as a Zn hyperaccumulator and high tissue Zn concentrations could result toxic to the plants. In fact, in our experiment, the application of moderate concentrations (above 50 µM) had a negative effect on plant growth, whereas lower concentrations had a beneficial effect. Nevertheless, other studies with sugar beet indicated a relationship between toxic Zn concentrations and declines in intracellular CO2, stomatal conductance and net photosynthesis [43,44,45]. Therefore, in general, the application of high Zn concentrations could decrease the values of gas exchange parameters, producing a loss of biomass. However, low concentrations could have a beneficial effect on these parameters, increasing the plant resistance to stressful situations such as salinity.
Other authors have suggested a different role for Zn in stressed plants. This could be related to the enhancement of plasma membrane integrity, together with decreases in reactive oxygen species (ROS) concentrations in roots [16,46,47,48]. In this regard, Weisany et al. [16] indicated that stress conditions produce damage to cell membranes, leading to a reduction of the water content. Different studies have suggested that the role of Zn could involve redox reactions and protection of plasma membranes through zinc finger proteins [49,50]. According to our results, Zn had similar roles in root cells of pak choi plants under salinity. Therefore, Zn application might reduce the concentration of ROS and, thus, this element could protect the plasma membrane from oxidative damage.
Saline conditions also alter plant nutrition. In this sense, the concentrations of mineral elements in the leaves of pak choi plants in this study were in concordance with those of earlier studies, with decreased concentrations of some macronutrients—such as Ca, K and Mg—under salinity [3,51]. Yermiyahu et al. [52] demonstrated that Ca could be displaced by Na in root cell membranes. Later, Yu and Rengel indicated that Ca is one of the important elements in salt stress and that its displacement by Na provokes structural breakdown of the cell membrane; as a consequence, a reduction in the Ca concentration decreases the plasma membrane integrity [53]. Although it has been reported that the stabilisation functions of Zn in membrane structure and integrity differ from those of Ca, they demonstrated that plasma membrane stabilisation could not be achieved by Ca without an optimal Zn nutritional status [49]. They also described Zn as another stabilising agent, mainly for protection of membrane components such as phospholipids. In fact, the Zn status is involved in the regulation of efflux from root cells. Then, under salinity, Zn application could favour plasma membrane integrity, leading to higher plasma membrane permeability. In addition, under saline conditions, a decrease in tissue K concentration is produced due to Na antagonism. Also, the loss of membrane integrity causes an efflux of K from guard cells of stomata; in cauliflower leaves, this produced a loss of turgor in the guard cells with the concomitant stomatal closure [54]. In our work, Zn application increased the concentration of this element in leaves and this could be responsible for the increased accumulation of K+, a result of the restoration of plasma membrane permeability. Also, Zn is an important constituent of the enzyme carbonic anhydrase, which is needed for the maintenance of an optimal HCO concentration and/or membrane integrity and K+ uptake in guard cells [54,55]. Also, the Zn application produced an increase of Fe and Mn translocation to leaves, due to these elements being necessary for chlorophyll synthesis and in the transfer of electrons and energy (e.g., electron transfer in metabolic processes like photosynthesis and respiration, and antioxidant enzymes cofactor and maintain the photosynthesis process [56,57]). Therefore, foliar Zn application could maintain the water flow through the plant, enhancing stomatal conductance and maintaining the membrane permeability under saline conditions.
The GSLs have been related with stressful conditions. In this respect, previous authors indicated that unfavourable situations provoked changes in the metabolism (including GSLs) and growth of broccoli plants [38]. Also, other studies with different Brassicas, such as radish and canola, demonstrated changes in GSLs concentrations under salinity [58,59]. Although the synthesis of the different GSLs has been described in different plant organs (leaves and roots), there are few studies that indicate that they are transported by the vascular system to other parts of plants, in spite of their role as a defence system [20,60,61]. In this sense, broccoli plants treated with 40 or 80 mM NaCl had a decreased total GSLs concentration in their leaves; however, the indolic GSLs concentration in these plants was enhanced [62]. A recent study of seven different cultivars of broccoli under salinity (80 mM NaCl) and field conditions, indicated that the salinity increased the GSLs concentration, but the effect on the biosynthesis of individual GSLs was cultivar-dependent [27]. Likewise, a common pattern with respect to qualitative and quantitative changes in GSLs under stress is still undefined, with differences among cultivars of the same species for broccoli sprouts or plants growing under salinity [27,36]. In our pak choi plants, aliphatic GSLs did not show significant differences in leaves, but salinity decreased aliphatic GSLs in roots, presumably due to the breakdown of these compounds under saline conditions in this organ, as described by Sarikamis and Cakir in broccoli plants [62]. However, the total abundance of GSLs in leaves was increased, reflecting an enhancement of indolic GSLs synthesis in these organs, under salinity.
The effect of foliar Zn application on GSLs of pak choi plants has not been studied before. Previous studies on species like broccoli, cabbage and Thlaspi caerulescens L. indicated that low concentrations of Zn enhanced GSLs concentrations in roots, leaves or florets, but high Zn concentrations produced a decrease in these compounds in leaves [63,64,65,66]. In our pak choi plants, the GSLs concentrations did not change with any of the doses of Zn applied, but when Zn was applied under saline conditions, a great increase was observed relative to the treatments involving only salinity. The increase in GSL observed when Zn was applied could suggest that they could have an important role in the alleviation of salinity stress. As it has been reported previously in A. thaliana L., GLS were pointed out as the signal molecules to increase aquaporins’ functionality [26]. Therefore, in our plants, they could be the key in the observed improvement of water movement along a plant under salinity.

5. Conclusions

In summary, foliar application of Zn at low dosages to pak choi plants could have an ameliorative effect against salt stress. Since Zn applied in this way is transported from leaves to roots, it could help to maintain plasma membrane integrity—in both root and leaf cells, including guard cells—and thus membrane permeability, osmotic regulation, stomatal opening and water flow through plants. Also, the observed increase in the uptake and transport from roots to leaves of Fe and Mn caused by Zn application is suggested to be involved in maintenance of the photosynthetic system. Also, Zn application under saline conditions enhances the synthesis of GSLs that could be involved in aquaporin function. All this would lead to improved gas exchange parameters and, in consequence, less-severe stress symptoms, enabling plants to maintain biomass production. Therefore, our results suggest that Zn application and GSLs synthesis could be involved in the amelioration response to the negative effect of NaCl under saline conditions. Further studies should be carried out to determine the role of GSLs in this process.

Author Contributions

J.J.R. and M.C.: Conception and design; H.F. and J.J.R.: Analysis and interpretation of data and drafting of the article; M.C.: Critical revision of the article for important intellectual content; M.C. and J.J.R.: Final approval of the article; H.F. and J.J.R.: Statistical expertise; M.C.: Obtaining funding; H.F. and J.J.R.: Collection and assembly of data. All authors have read and agreed to the published version of the manuscript.

Funding

This work was funded by the Spanish Ministerio de Ciencia, Inovación y Universidades, through the project RTC-2015-3536-2. Also, Hamideh Fatemi was supported by Ministry of Science, Research and Technology of Iran.

Conflicts of Interest

The authors declare no conflict of interest.

References

  1. Kumar, J.; Singh, V.P.; Prasad, S.M. NaCl-induced physiological and biochemical changes in two cyanobacteria Nostoc muscorum and Phormidium foveolarum acclimatized to different photosynthetically active radiation. J. Photochem. Photobiol. B Biol. 2015, 151, 221–232. [Google Scholar] [CrossRef] [PubMed]
  2. Zhu, Y.G.; Smith, S.E.; Smith, F.A. Plant growth and cation composition of two cultivars of spring wheat (Triticum aestivum L.) differing in P uptake efficiency. J. Exp. Bot. 2001, 52, 1277–1288. [Google Scholar] [CrossRef] [PubMed] [Green Version]
  3. Parida, A.K.; Das, A.B. Salt tolerance and salinity effects on plants: A review. Ecotoxicol. Environ. Saf. 2005, 60, 324–349. [Google Scholar] [CrossRef] [PubMed]
  4. Carvajal, M.; Martinez, V.; Alcaraz, C.F. Physiological function of water channels as affected by salinity in roots of paprika pepper. Physiol. Plant. 2002, 105, 95–101. [Google Scholar] [CrossRef]
  5. Munns, R.; Tester, M. Mechanisms of Salinity Tolerance. Annu. Rev. Plant. Biol. 2008, 59, 651–681. [Google Scholar] [CrossRef] [Green Version]
  6. Bybordi, A.; Ebrahimian, E. Effect of salinity stress on activity of enzymes involved in nitrogen and phosphorous metabolism case study: Canola (Brassica napus L.). Asian J. Agric. Res. 2011, 5, 208–214. [Google Scholar] [CrossRef]
  7. Rengasamy, P. Soil processes affecting crop production in salt-affected soils. Funct. Plant. Biol. 2010, 37, 613–620. [Google Scholar] [CrossRef]
  8. Coleman, J.E. Zinc enzymes. Curr. Opin. Chem. Biol. 1998, 2, 222–234. [Google Scholar] [CrossRef]
  9. Berg, J.M.; Shi, Y. The galvanization of biology: A growing appreciation for the roles of zinc. Science 1996, 271, 1081–1085. [Google Scholar] [CrossRef]
  10. Vallee, B.L.; Auld, D.S. Zinc Coordination, Function, and Structure of Zinc Enzymes and Other Proteins. Biochemistry 1990, 29, 5647–5659. [Google Scholar] [CrossRef]
  11. Barak, P.; Helmke, P.A. The Chemistry of Zinc. In Zinc in Soils and Plants; Springer: Dordrecht, The Netherlands, 1993. [Google Scholar]
  12. Torabian, S.; Zahedi, M.; Khoshgoftar, A.H. Effects of foliar spray of two kinds of zinc oxide on the growth and ion concentration of sunflower cultivars under salt stress. J. Plant. Nutr. 2016, 39, 172–180. [Google Scholar] [CrossRef]
  13. Iqbal, M.N.; Rasheed, R.; Ashraf, M.Y.; Ashraf, M.A.; Hussain, I. Exogenously applied zinc and copper mitigate salinity effect in maize (Zea mays L.) by improving key physiological and biochemical attributes. Environ. Sci. Pollut. Res. 2018, 25, 23889–23896. [Google Scholar] [CrossRef] [PubMed]
  14. Alpaslan, M.; Inal, A.; Güneş, A.; Çikili, Y.; Özcan, H. Effect of zinc treatment on the alleviation of sodium and chloride injury in tomato (Lycopersicum esculentum (L.) Mill. cv. Lale) grown under salinity. Turk. J. Botany 1999, 23, 1–6. [Google Scholar]
  15. Redondo-Gómez, S.; Andrades-Moreno, L.; Mateos-Naranjo, E.; Parra, R.; Valera-Burgos, J.; Aroca, R. Synergic effect of salinity and zinc stress on growth and photosynthetic responses of the cordgrass, Spartina densiflora. J. Exp. Bot. 2011, 62, 5521–5530. [Google Scholar] [CrossRef] [PubMed]
  16. Weisany, W.; Sohrabi, Y.; Heidari, G.; Siosemardeh, A.; Badakhshan, H. Effects of Zinc Application on Growth, Absorption and Distribution of Mineral Nutrients Under Salinity Stress in Soybean (Glycine Max L.). J. Plant. Nutr. 2014, 37, 2014. [Google Scholar] [CrossRef]
  17. Mahmoud, A.W.M.; Abdeldaym, E.A.; Abdelaziz, S.M.; El-Sawy, M.B.I.; Mottaleb, S.A. Synergetic effects of zinc, boron, silicon, and zeolite nanoparticles on confer tolerance in potato plants subjected to salinity. Agronomy 2020, 10, 19. [Google Scholar] [CrossRef] [Green Version]
  18. Ashraf, M.Y.; Tariq, S.; Saleem, M.; Khan, M.A.; Hassan, S.W.U.; Sadef, Y. Calcium and zinc mediated growth and physio-biochemical changes in mungbean grown under saline conditions. J. Plant. Nutr. 2020, 43, 512–525. [Google Scholar] [CrossRef]
  19. Hanson, P.; Yang, R.Y.; Chang, L.C.; Ledesma, L.; Ledesma, D. Contents of carotenoids, ascorbic acid, minerals and total glucosinolates in leafy brassica pakchoi (Brassica rapa L. chinensis) as affected by season and variety. J. Sci. Food Agric. 2009, 89, 906–914. [Google Scholar] [CrossRef]
  20. Zhu, X.F.; Wang, Z.W.; Dong, F.; Lei, G.J.; Shi, Y.Z.; Li, G.X.; Zheng, S.J. Exogenous auxin alleviates cadmium toxicity in Arabidopsis thaliana by stimulating synthesis of hemicellulose 1 and increasing the cadmium fixation capacity of root cell walls. J. Hazard. Mater. 2013, 263, 398–403. [Google Scholar] [CrossRef]
  21. Ishida, M.; Hara, M.; Fukino, N.; Kakizaki, T.; Morimitsu, Y. Glucosinolate metabolism, functionality and breeding for the improvement of brassicaceae vegetables. Breed. Sci. 2014, 64, 48–59. [Google Scholar] [CrossRef] [Green Version]
  22. Bones, A.M.; Rossiter, J.T. The enzymic and chemically induced decomposition of glucosinolates. Phytochemistry 2006, 67, 1053–1067. [Google Scholar] [CrossRef] [PubMed]
  23. Nilsson, J.; Olsson, K.; Engqvist, G.; Ekvall, J.; Olsson, M.; Nyman, M.; Åkesson, B. Variation in the content of glucosinolates, hydroxycinnamic acids, carotenoids, total antioxidant capacity and low-molecular-weight carbohydrates in Brassica vegetables. J. Sci. Food Agric. 2006, 86, 528–538. [Google Scholar] [CrossRef]
  24. Aires, A.; Fernandes, C.; Carvalho, R.; Bennett, R.N.; Saavedra, M.J.; Rosa, E.A.S. Seasonal effects on bioactive compounds and antioxidant capacity of six economically important brassica vegetables. Molecules 2011, 16, 6816–6832. [Google Scholar] [CrossRef] [PubMed] [Green Version]
  25. Ávila, F.W.; Faquin, V.; Yang, Y.; Ramos, S.J.; Guilherme, L.R.G.; Thannhauser, T.W.; Li, L. Assessment of the anticancer compounds Se -methylselenocysteine and glucosinolates in Se-biofortified broccoli (Brassica oleracea L. var. italica) sprouts and florets. J. Agric. Food Chem. 2013, 8, 532. [Google Scholar] [CrossRef]
  26. Martínez-Ballesta, M.; Moreno-Fernández, D.A.; Castejón, D.; Ochando, C.; Morandini, P.A.; Carvajal, M. The impact of the absence of aliphatic glucosinolates on water transport under salt stress in Arabidopsis thaliana. Front. Plant. Sci. 2015, 6, 524. [Google Scholar] [CrossRef] [PubMed] [Green Version]
  27. Rios, J.J.; Agudelo, A.; Moreno, D.A.; Carvajal, M. Growing broccoli under salinity: The influence of cultivar and season on glucosinolates content. Sci. Agric. 2020. [Google Scholar] [CrossRef] [Green Version]
  28. Keling, H.; Zhujun, Z. Effects of different concentrations of sodium chloride on plant growth and glucosinolate content and composition in pakchoi. Afr. J. Biotechnol. 2010, 28, 4428–4433. [Google Scholar] [CrossRef]
  29. Lin, L.; Zhou, W.; Dai, H.; Cao, F.; Zhang, G.; Wu, F. Selenium reduces cadmium uptake and mitigates cadmium toxicity in rice. J. Hazard. Mater. 2012, 235, 343–351. [Google Scholar] [CrossRef]
  30. Wu, S.; Hu, C.; Tan, Q.; Nie, Z.; Sun, X. Effects of molybdenum on water utilization, antioxidative defense system and osmotic-adjustment ability in winter wheat (Triticumaestivum) under drought stress. Plant. Physiol. Biochem. 2014, 83, 365–374. [Google Scholar] [CrossRef]
  31. Qin, L.; Guo, Y.; Chen, L.; Liang, R.; Gu, M.; Xu, G.; Zhao, J.; Walk, T.; Liao, H. Functional Characterization of 14 Pht1 Family Genes in Yeast and Their Expressions in Response to Nutrient Starvation in Soybean. PLoS ONE 2012, 7, e47726. [Google Scholar] [CrossRef]
  32. Fatemi, H.; Zaghdoud, C.; Nortes, P.A.; Carvajal, M.; del Carmen Martínez-Ballesta, M. Differential Aquaporin Response to Distinct Effects of Two Zn Concentrations after Foliar Application in Pak Choi (Brassica rapa L.) Plants. Agronomy 2020, 10, 450. [Google Scholar] [CrossRef] [Green Version]
  33. Wang, Y.S.; Yang, Z.M. Nitric oxide reduces aluminum toxicity by preventing oxidative stress in the roots of Cassia tora L. Plant. Cell Physiol. 2005, 46, 1915–1923. [Google Scholar] [CrossRef] [PubMed] [Green Version]
  34. Pompella, A.; Maellaro, E.; Casini, A.F.; Comporti, M. Histochemical detection of lipid peroxidation in the liver of bromobenzene-poisoned mice. Am. J. Pathol. 1987, 192, 295–301. [Google Scholar]
  35. Fu, J.; Huang, B. Involvement of antioxidants and lipid peroxidation in the adaptation of two cool-season grasses to localized drought stress. Environ. Exp. Bot. 2001, 45, 105–114. [Google Scholar] [CrossRef]
  36. Pérez-Balibrea, S.; Moreno, D.A.; García-Viguera, C. Improving the phytochemical composition of broccoli sprouts by elicitation. Food Chem. 2011, 1, 35–44. [Google Scholar] [CrossRef]
  37. Wu, H.; Shabala, L.; Zhou, M.; Stefano, G.; Pandolfi, C.; Mancuso, S.; Shabala, S. Developing and validating a high-throughput assay for salinity tissue tolerance in wheat and barley. Planta 2015, 242, 847–857. [Google Scholar] [CrossRef] [PubMed]
  38. López-Berenguer, C.; Martínez-Ballesta, M.C.; García-Viguera, C.; Carvajal, M. Leaf water balance mediated by aquaporins under salt stress and associated glucosinolate synthesis in broccoli. Plant. Sci. 2008, 174, 321–328. [Google Scholar] [CrossRef]
  39. Ashraf, M. Relationships between growth and gas exchange characteristics in some salt-tolerant amphidiploid Brassica species in relation to their diploid parents. Environ. Exp. Bot. 2001, 45, 155–163. [Google Scholar] [CrossRef]
  40. Bayuelo-Jiménez, J.S.; Craig, R.; Lynch, J.P. Salinity tolerance of Phaseolus species during germination and early seedling growth. Crop. Sci. 2002, 42, 1584. [Google Scholar] [CrossRef]
  41. Fässler, E.; Robinson, B.H.; Stauffer, W.; Gupta, S.K.; Papritz, A.; Schulin, R. Phytomanagement of metal-contaminated agricultural land using sunflower, maize and tobacco. Agric. Ecosyst. Environ. 2010, 136, 49–58. [Google Scholar] [CrossRef]
  42. Demim, S.; Drouiche, N.; Aouabed, A.; Semsari, S. CCD study on the ecophysiological effects of heavy metals on Lemna gibba. Ecol. Eng. 2013, 57, 302–313. [Google Scholar] [CrossRef]
  43. Sagardoy, R.; Morales, F.; López-Millán, A.F.; Abadía, A.; Abadía, J. Effects of zinc toxicity on sugar beet (Beta vulgaris L.) plants grown in hydroponics. Plant. Biol. 2009, 11, 339–350. [Google Scholar] [CrossRef] [PubMed]
  44. Sagardoy, R.; Vázquez, S.; Florez-Sarasa, I.D.; Albacete, A.; Ribas-Carbó, M.; Flexas, J.; Abadía, J.; Morales, F. Stomatal and mesophyll conductances to CO2 are the main limitations to photosynthesis in sugar beet (Beta vulgaris) plants grown with excess zinc. New Phytol. 2010, 187, 145–158. [Google Scholar] [CrossRef] [PubMed]
  45. Sagardoy, R.; Morales, F.; Rellán-Álvarez, R.; Abadía, A.; Abadía, J.; López-Millán, A.F. Carboxylate metabolism in sugar beet plants grown with excess Zn. J. Plant. Physiol. 2011, 168, 730–733. [Google Scholar] [CrossRef] [PubMed]
  46. Ali, S.; Farooq, M.A.; Yasmeen, T.; Hussain, S.; Arif, M.S.; Abbas, F.; Bharwana, S.A.; Zhang, G. The influence of silicon on barley growth, photosynthesis and ultra-structure under chromium stress. Ecotoxicol. Environ. Saf. 2013, 89, 66–72. [Google Scholar] [CrossRef] [PubMed]
  47. Jiang, W.; Sun, X.H.; Xu, H.L.; Mantri, N.; Lu, H.F. Optimal concentration of zinc sulfate in foliar spray to alleviate salinity stress in Glycine soja. J. Agric. Sci. Technol. 2014, 16, 445–460. [Google Scholar]
  48. Siddiqui, S.N.; Umar, S.; Iqbal, M. Zinc-induced modulation of some biochemical parameters in a high- and a low-zinc-accumulating genotype of Cicer arietinum L. grown under Zn-deficient condition. Protoplasma 2015, 252, 1335–1345. [Google Scholar] [CrossRef]
  49. Cakmak, I. Tansley review no. 111: Possible roles of zinc in protecting plant cells from damage by reactive oxygen species. New Phytol. 2000, 146, 185–205. [Google Scholar] [CrossRef]
  50. Gill, S.S.; Tuteja, N. Reactive oxygen species and antioxidant machinery in abiotic stress tolerance in crop plants. Plant. Physiol. Biochem. 2010, 48, 909–930. [Google Scholar] [CrossRef]
  51. Maksimovic, I.; Ilin, Z. Effects of Salinity on Vegetable Growth and Nutrients Uptake. In Irrigation Systems and Practices in Challenging Environments; InTech: Rijeka, Croatia, 2012. [Google Scholar]
  52. Yermiyahu, U.; Nir, S.; Ben-Hayyim, G.; Kafkafi, U.; Kinraide, T.B. Root elongation in saline solution related to calcium binding to root cell plasma membranes. Plant. Soil 1997, 191, 67–76. [Google Scholar] [CrossRef]
  53. Yu, Q.; Rengel, Z. Drought and salinity differentially influence activities of superoxide dismutases in narrow-leafed lupins. Plant. Sci. 1999, 142, 1–11. [Google Scholar] [CrossRef]
  54. Sharma, P.N.; Tripathi, A.; Bisht, S.S. Zinc requirement for stomatal opening in cauliflower. Plant. Physiol. 1995, 107, 751–756. [Google Scholar] [CrossRef] [PubMed] [Green Version]
  55. Pinton, R.; Cakmak, I.; Marschner, H. Effect of zinc deficiency on proton fluxes in plasma membrane-enriched vesicles isolated from bean roots. J. Exp. Bot. 1993, 44, 623–630. [Google Scholar] [CrossRef]
  56. López-Millán, A.F.; Duy, D.; Philippar, K. Chloroplast iron transport proteins—Function and impact on plant physiology. Front. Plant. Sci. 2016, 7, 178. [Google Scholar] [CrossRef] [Green Version]
  57. Neocleous, D.; Nikolaou, G.; Ntatsi, G.; Savvas, D. Impact of chelated or inorganic manganese and zinc applications in closed hydroponic bean crops on growth, yield, photosynthesis, and nutrient uptake. Agronomy 2020, 10, 881. [Google Scholar] [CrossRef]
  58. Yuan, G.; Wang, X.; Guo, R.; Wang, Q. Effect of salt stress on phenolic compounds, glucosinolates, myrosinase and antioxidant activity in radish sprouts. Food Chem. 2010, 121, 1014–1019. [Google Scholar] [CrossRef]
  59. Qasim, M.; Ashraf, M.; Ashraf, M.Y.; Rehman, S.U.; Rha, E.S. Salt-induced changes in two canola cultivars differing in salt tolerance. Biol. Plant. 2003, 46, 629–632. [Google Scholar] [CrossRef]
  60. Grubb, C.D.; Abel, S. Glucosinolate metabolism and its control. Trends Plant. Sci. 2006, 11, 89–100. [Google Scholar] [CrossRef]
  61. Chen, S.; Petersen, B.L.; Olsen, C.E.; Schulz, A.; Halkier, B.A. Long-distance phloem transport of glucosinolates in Arabidopsis. Plant. Physiol. 2001, 127, 194–201. [Google Scholar] [CrossRef] [Green Version]
  62. Sarikamiş, G.; Çakir, A. Influence of salinity on aliphatic and indole glucosinolates in broccoli (Brassica oleracea var. Italica). Appl. Ecol. Environ. Res. 2017, 15, 1781–1788. [Google Scholar] [CrossRef]
  63. Tolrà, R.P.; Poschenrieder, C.; Alonso, R.; Barceló, D.; Barceló, J. Influence of zinc hyperaccumulation on glucosinolates in Thlaspi caerulescens. New Phytol. 2001, 151, 621–626. [Google Scholar] [CrossRef] [Green Version]
  64. Noret, N.; Meerts, P.; Tolrà, R.; Poschenrieder, C.; Barceló, J.; Escarre, J. Palatability of Thlaspi caerulescens for snails: Influence of zinc and glucosinolates. New Phytol. 2005, 165, 763–771. [Google Scholar] [CrossRef] [PubMed]
  65. Kusznierewicz, B.; Baczek-Kwinta, R.; Bartoszek, A.; Piekarska, A.; Huk, A.; Manikowska, A.; Antonkiewicz, J.; Namieśnik, J.; Konieczka, P. The dose-dependent influence of zinc and cadmium contamination of soil on their uptake and glucosinolate content in white cabbage (Brassica oleracea var. capitata f. alba). Environ. Toxicol. Chem. 2012, 31, 2482–2489. [Google Scholar] [CrossRef] [PubMed]
  66. Barrameda-Medina, Y.; Blasco, B.; Lentini, M.; Esposito, S.; Baenas, N.; Moreno, D.A.; Ruiz, J.M. Zinc biofortification improves phytochemicals and amino-acidic profile in Brassica oleracea cv. Bronco. Plant. Sci. 2017, 258, 45–51. [Google Scholar] [CrossRef]
Figure 1. Biomass of pak choi plants. (A) Subject under different salinity conditions. (B) Subject under distinct Zn concentrations applied. Values are means ± SE (n = 3).
Agronomy 10 01528 g001
Figure 2. Membrane integrity of pak choi roots under different treatments of Zn and/or salts staining by Evan´s blue. Blue colours show the loss of integrity areas. (A) control roots. (B,C) roots under not salinity condition with Zn application. (D) roots under salinity condition. (E,F) roots under salinity condition with Zn application.
Agronomy 10 01528 g002
Figure 3. Lipid peroxidation of pak choi roots under different treatments of Zn and/or salts. Red colours show peroxidation areas. (A) control roots. (B,C) roots under not salinity condition with Zn application. (D) root under salinity condition. (E,F) roots under salinity condition with Zn application.
Agronomy 10 01528 g003
Figure 4. MDA concentration in pak choi roots subject to different salinity conditions and Zn foliar application.
Agronomy 10 01528 g004
Figure 5. Zinc-pyr-1 staining from transversal leaves sections of pak choi. Green fluorescence indicates area is Zn free. (AC) optical view of leaves sections without salinity condition with Zn application. (DF) fluorescent view of pak choi leaves sections after Zn foliar application under control conditions. (HJ) optical view of leaves sections under salinity condition with Zn application. (KM) fluorescent view of pak choi leaves sections after Zn foliar application under salinity conditions. Scale bars correspond to 100 µm (AM).
Agronomy 10 01528 g005
Figure 6. Glucosinolates concentrations in pak choi plants after Zn foliar application with/without salinity conditions. (A,C,E) Total, aliphatic and indolic concentration in pak choi leaves. (B,D,F) Total, aliphatic and indolic concentration in pak choi roots. GSLs concentrations are expressed as mg g−1 DW. Values are means ± SE (n = 3) and (*) represent statistically significant increase compared to control.
Agronomy 10 01528 g006
Table 1. Biomass and gas exchange parameters of leaves of pak choi plants grown with different salinity and/or Zn treatments. Values are means ± SE (n = 3).
Shoot Biomass (g DW)Root Biomass (g DW)Transpiration (mmol m−2 s−1)Stomatal Conductance (mmol m−2 s−1)) Assimilation (µmol m−2 s−1)CI (mmol m−2 s−1)
TreatmentsSalinity (mM)Salinity (mM)Salinity (mM)Salinity (mM)Salinity (mM)Salinity (mM)
Zn Applied (µM)080080080080080080
07.90 ± 0.474.66 ± 0.890.75 ± 0.070.81 ± 0.063.45 ± 0.213.74 ± 0.25628.14 ± 50.71524 ± 53.166.78 ± 0.799.90 ± 1.16370.40 ± 26.73206.50 ± 18.51
25 10.05 ± 0.937.84 ± 0.770.82 ± 0.071.01 ± 0.073.77 ± 0.206.12 ± 0.16709.09 ± 44.87618 ± 22.2021.53 ± 4.3416.8 ± 0.97534.82 ± 66.92333.01 ± 25.59
508.26 ± 1.067.52 ± 1.780.77 ± 0.051.12 ± 0.153.31 ± 0.225.72 ± 0.30632.59 ± 41.19630 ± 69.0413.91 ± 1.8215.64 ± 1.18528.71 ± 58.37294.3 ± 35.05
p-value*****n.s.*n.s**n.s.***********
LSD1.280.750.030.090.130.2144.1835.414.281.6729.6431.04
Analysis of the variance
Salinity***n.s.***n.s.******
Zn Dosages**n.s.***n.s.*****
S x D**n.s.********
LSD1.090.140.2642.891.1428.61
Biomass expressed as: g plant−1. Transpiration, stomatal conductance and CI expressed as: mmol m−2 s−1. Assimilation expressed as: µmol m−2 s−1. Levels of significance are represented by * p < 0.05, ** p < 0.01, *** p < 0.001, and n.s., not significant.
Table 2. Macronutrient concentrations of leaves of pak choi plants grown with different salinity and/or Zn treatments. Values are means ± SE (n = 3).
Ca (mg g−1 DW)Mg (mg g−1 DW)K (mg g−1 DW)Na (mg g−1 DW)P (mg g−1 DW)
TreatmentSalinitySalinitySalinitySalinitySalinity
Zn Applied (µM)080080080080080
029.20 ± 1.423.11 ± 0.132.81 ± 0.082.2 ± 0.2436.1 ± 1.8224.15 ± 1.010.21 ± 0.0827.21 ± 3.154.31 ± 0.395.9 ± 0.28
2530.91± 0.721.12 ± 4.403.03 ± 0.102.1 ± 0.1639.7 ± 1.1717.98 ± 0.370.18 ± 0.0324.92 ± 3.544.01± 0.236.64 ± 0.75
5032.94± 0.620.4 ± 1.412.9 ± 0.392.0 ± 0.1336.17 ± 3.3418.95 ± 0.310.19 ± 0.0124.21 ± 1.974.21 ± 0.455.14 ± 0.53
p-valuen.s.n.sn.s.n.s.n.s.**n.s.n.s.n.s.n.s.
LSD0.840.590.120.171.220.860.061.930.330.6
Analysis of variance
Salinity***n.s******
Zn Dosagesn.s.n.sn.s.n.s.n.s
S x Dn.s.n.s.*******
LSD0.150.110.971.710.48
Macronutrient concentrations are expressed as mg g−1 DW. Levels of significance are represented by * p < 0.05, ** p < 0.01, *** p < 0.001, and n.s., not significant.
Table 3. Microelement concentrations of leaves of pak choi plants grown with different salinity and/or Zn treatments. Values are means ± SE (n = 3).
Fe (µg g−1 DW)Mn (µg g−1 DW)Cu (µg g−1 DW)Zn (µg g−1 DW)
TreatmentSalinitySalinitySalinitySalinity
Zn Applied (µM)080080080080
048.31 ± 3.4858.58 ± 3.1460.67 ± 2.4668.17 ± 2.321.97 ± 0.172.15 ± 0.2345.36 ± 0.1551.59 ± 1.21
2550.41 ± 3.1763.67 ± 5.1356.91 ± 3.7474.05 ± 5.442.24 ± 0.072.23 ± 0.0758.62 ± 1.4070.43 ± 1.25
5048.43 ± 2.8359.17 ± 5.045714 ± 5.4273.52 ± 6.171.91 ± 0.322.21 ± 0.1659.11 ± 2.4266.43 ± 0.32
p-valuen.s.n.s.n.s.n.s.n.sn.s******
LSD2.034.633.964.570.180.112.030.97
Analysis of variance
Salinityn.s.*n.s**
Zn Dosagesn.s.*n.s.***
S x D***n.s.**
LSD4.112.570.241.16
Microelement concentrations are expressed as μg g−1 DW. Levels of significance are represented by * p < 0.05, ** p < 0.01, *** p < 0.001, and n.s., not significant.
Table 4. Macronutrient concentrations of roots of pak choi plants grown with different salinity and/or Zn treatments. Values are means ± SE (n = 3).
Ca (mg g−1 DW)Mg (mg g−1 DW)K (mg g−1 DW)Na (mg g−1 DW)P (mg g−1 DW)
TreatmentSalinitySalinitySalinitySalinitySalinity
Zn Applied (µM)080080080080080
016.15 ± 1.036.69 ± 0.603.83 ± 0.072.74 ± 0.1247.45 ± 1.7326.35 ± 1.670.88 ± 0.0729.90 ± 2.567.89 ± 0.307.39 ± 0.30
2515.75 ± 1.47.81 ± 0.453.55 ± 0.222.81 ± 0.1041.83 ± 2.4529.86 ± 1.290.80 ± 0.1231.54 ± 1.347.19 ± 0.457.72 ± 0.46
5014.50 ± 0.438.00 ± 0.904.15 ± 0.123.83 ± 0.2948.46 ± 1.7828.39 ± 2.120.99 ± 0.1028.39 ± 1.077.52 ± 0.197.72 ± 0.77
p-valuen.s.**n.s.***n.s.n.s.n.s.n.s.
LSD1.230.590.190.231.552.030.091.280.380.27
Analysis of variance
Salinity**********n.s.
Zn Dosagesn.s.n.s*****n.s
S x D************n.s.
LSD0.230.171.580.980.11
Macronutrient concentrations are expressed as mg g−1 DW. Levels of significance are represented by * p < 0.05, ** p < 0.01, *** p < 0.001, and n.s., not significant.
Table 5. Microelement concentrations of roots of pak choi plants grown with different salinity and/or Zn treatments. Values are means ± SE (n = 3).
Fe (µg g−1 DW)Mn (µg g−1 DW)Cu (µg g−1 DW)Zn (µg g−1 DW)
TreatmentSalinitySalinitySalinitySalinity
Zn Applied (µM)080080080080
0853.30 ± 50.96573.97 ± 36.2530.17 ± 1.0824.02 ± 1.9421.85 ± 1.2419.22 ± 1.8633.67 ± 1.5227.01 ± 1.25
25 995.59 ± 94.03684.41 ± 66.1029.28 ± 1.6830.19 ± 1.1925.68 ± 2.1422.47 ± 2.3342.76 ± 2.0145.01 ± 2.22
501184.37 ± 29.54743.19 ± 67.0231.62 ± 0.9536.47 ± 1.9124.38 ± 0.5622.88 ± 1.8043.04 ± 1.2538.15 ± 2.19
p-valuen.s.*n.s.*n.sn.s*****
LSD62.5534.511.120.921.251.942.082.34
Analysis of variance
Salinity***n.s.n.sn.s.
Zn Dosages****n.s.**
S x D**n.s.n.s.**
LSD49.571.431.281.11
Microelement concentrations are expressed as μg g−1 DW. Levels of significance are represented by * p < 0.05, ** p < 0.01, *** p < 0.001, and n.s., not significant.

