Article

Yield and Quality in Purple-Grained Wheat Isogenic Lines

by
Alexey Morgounov
1,2,*,
Yaşar Karaduman
3,
Beyhan Akin
1,
Sinan Aydogan
4,
Peter Stephen Baenziger
5,
Madhav Bhatta
6,
Vladimir Chudinov
7,
Susanne Dreisigacker
8,
Velu Govindan
8,
Safure Güler
4,
Carlos Guzman
9,
Ajit Nehe
1,
Rachana Poudel
5,
Devin Rose
5,
Elena Gordeeva
10,
Vladimir Shamanin
2,
Kemal Subasi
1,
Yuriy Zelenskiy
11 and
Elena Khlestkina
10,12
1
Global Wheat Program, International Maize and Wheat Improvement Center (CIMMYT), 06010 Ankara, Turkey
2
Department of Agronomy, Omsk State Agrarian University, 644008 Omsk, Russia
3
Breeding Department, Transitional Zone Agricultural Research Institute, 26000 Eskisehir, Turkey
4
Breeding Department, Central Field Crop Research Institute, 06010 Ankara, Turkey
5
Department of Agronomy and Horticulture, University of Nebraska, Lincoln, NE 68588, USA
6
Department of Agronomy, University of Wisconsin, Madison, WI 53706, USA
7
Breeding Department, Karabalyk Agricultural Experimental Station, 110000 Kostanay, Kazakhstan
8
Global Wheat Program, International Maize and Wheat Improvement Center (CIMMYT), Texcoco 56100, Mexico
9
Departamento de Genética, Escuela Técnica Superior de Ingeniería Agronómica y de Montes, Edificio Gregor Mendel, Campus de Rabanales, Universidad de Córdoba, CeiA3, ES-14071 Córdoba, Spain
10
Wheat Department, Institute of Cytology and Genetics SB RAS, 630090 Novosibirsk, Russia
11
Global Wheat Program, International Maize and Wheat Improvement Center (CIMMYT), 010000 Astana, Kazakhstan
12
Wheat Department, N.I. Vavilov All-Russian Institute of Plant Genetic Resources (VIR), 190000 St. Petersburg, Russia
*
Author to whom correspondence should be addressed.
Agronomy 2020, 10(1), 86; https://doi.org/10.3390/agronomy10010086
Submission received: 20 October 2019 / Revised: 24 December 2019 / Accepted: 27 December 2019 / Published: 8 January 2020
(This article belongs to the Special Issue Wheat Breeding: Procedures and Strategies)

Abstract

:
Breeding programs for purple wheat are underway in many countries but there is a lack of information on the effects of Pp (purple pericarp) genes on agronomic and quality traits in variable environments and along the product chain (grain-flour-bread). This study was based on unique material: two pairs of isogenic lines in a spring wheat cv. Saratovskaya-29 (S29) background differing only in Pp genes and grain color. In 2017, seven experiments were conducted in Kazakhstan, Russia, and Turkey with a focus on genotype and environment interaction and, in 2018, one experiment in Turkey with a focus on grain, flour, and bread quality. The effect of environment was greater compared to genotype for the productivity and quality traits studied. Nevertheless, several important traits, such as grain color and anthocyanin content, are closely controlled by genotype, offering the opportunity for selection. Phenolic content in purple-grained lines was not significantly higher in whole wheat flour than in red-colored lines. However, this trait was significantly higher in bread. For antioxidant activities, no differences between the genotypes were detected in both experiments. Comparison of two sources of Pp genes demonstrated that the lines originating from cv. Purple Feed had substantially improved productivity and quality traits compared to those from cv. Purple.

1. Introduction

Wheat (Triticum spp.) is an important crop for global food security, being the staple food for millions of people globally, especially in many developing countries. The current context of food security implies not only sufficient quantity of food but also food of high quality to ensure human health. Nutritional and health aspects of wheat grain have recently been prioritized through studying the diversity of cultivated wheat: different species like einkorn (Triticum monococcum) and spelt (T. spelta), landraces, old and modern cultivars, and colored wheat. The number of research publications devoted to wheat with blue and purple grain have increased dramatically over the last two years, indicating the priority and potential of these genotypes in developing wheat cultivars with specific benefits for human health [1,2]. The interest in purple grain wheat is due to the presence of anthocyanin, flavonoid pigments found in a wide variety of plants including fruits and vegetables. Anthocyanins act as antioxidants, scavenging free radicals [2]. The study of Sytar et al. [3] demonstrated a high correlation between antioxidant activities and content of bioactive phytochemicals (anthocyanin components cyanidin and pelargonin) in colored grain. Anthocyanins have a wide range of biological functions including antioxidants, enzyme inhibitors, induction of detoxification enzymes, activation of protein kinase (important for cellular energy homeostasis), increased membrane stability, induction of apoptosis, and cell cycle arrest. The anthocyanin health benefits have recently been reviewed by Daotong Lia [1]. Crucial cellular processes, such as cell cycle, apoptosis, autophagy, and biochemical metabolism, are involved in the beneficial effects and may provide potential therapeutic targets and strategies for the improvement in treatment for a wide range of diseases in the future.
The origin of wheat genetic resources with purple grain was described in the reviews of Zeven [4] and Grausgruber et al. [2]. Purple tetraploid wheat (T. durum) was first collected in Abyssinia (present Ethiopia) in the 1870s and then introduced to Europe, where it was widely distributed by botanists, and this was followed by further introductions. The purple grain color was eventually incorporated into bread wheat (T. aestivum). In the 1960s and 1970s, purple wheat was developed worldwide to distinguish feed grain, determine outcrossing rates and develop hybrid systems. Commercial purple wheat cultivars were released in Australia, Canada, China, New Zealand, and several European countries. It is also noteworthy that purple grain landraces are still cultivated in Ethiopia and can be found in the markets in the Tigray Region [5].
The anthocyanin pigmentation in wheat is controlled by dominant alleles of the genes Rc (coleoptile), Pc (culm), Plb (leaf blades), Pls (leaf sheaths), Pp (grain pericarp), Pan (anthers), and Ra (auricles) [6,7,8,9,10]. The alleles conferring strong pigmentation induce more intensive transcription of the structural genes, proving their role as regulators in the anthocyanin biosynthesis network. According to Tereshchenko et al. [9], a dark purple pericarp results from complementary action of the dominant genes, Pp-D1 (7D) and Pp3 (2A). Presence of the dominant genes, Pp-A1 and Pp3, results in light purple color, and the grain will remain uncolored in the presence of the recessive Pp3 gene even if two other genes (Pp-A1 and Pp-D1) are in the dominant state [11]. Later, the complementary action of Pp3 and Pp-1 genes was explained by interaction of their products (the bHLH-MYC transcriptional factor encoded by the Pp3 gene and the R2R3-MYB factor encoded by the Pp-1 genes), resulting in a functional regulatory complex for anthocyanin biosynthesis [12].
Breeding and genetic resource efforts to develop purple grain wheat are underway globally. The winter wheat breeding program in the Czech Republic focuses on a combination of dark grain using different genes, important agronomic traits and good baking quality [13]. In China, five novel mutants with variable seed color were developed using gamma irradiation of the hexaploid purple wheat line K4191 [14]. The total anthocyanin content of three mutant lines was significantly higher than the parent and white seeded check. The grain anthocyanin content can be increased by pyramiding different genes responsible for the accumulation of anthocyanins in different grain layers [15]. Bohmdorfer et al. [15] proposed a method of high-performance thin-layer chromatography allowing fast and efficient phenotyping of grain pigments. The same detection method was successfully used in fingerprinting of 94 colored wheat genotypes [16]. The phenotyping cost was below 1 EUR and the processing time was less than 9 min per sample. Crosses between purple pericarp and blue aleurone genotypes were used to increase the anthocyanin content, although the majority of the progenies were within the range of the parental material [17].
One of the main focuses of recent research has been the anthocyanin content of wheat grain, including its composition, dynamics, genotypic variation, and products. Knivel et al. [18] studied adapted spring wheat lines with blue and purple pericarp for two seasons in Saskatoon, Canada and found that genotypic variation for anthocyanin concentration was statistically significant, while the year and genotype by year interaction were not. This facilitates breeding progress. In a more recent study with nine purple wheat genotypes in Saskatchewan, Canada, the content and composition of anthocyanin was significantly influenced by genotype and genotype by environment (G × E) interaction [19]. The source–sink relationship has an important role in anthocyanin content [20]. Grain position in the spike affected the anthocyanin content, decreasing at distal positions, and source reduction decreased anthocyanin content by 25% to 50%. Heat stress positively affected anthocyanin content in wheat grain [21,22]. Combined nitrogen and phosphorus fertilizer application results in higher antioxidant activities in six wheat cultivars, including two purple-grained cultivars [23]. Shoeva et al. [24] demonstrated that anthocyanins in coleoptiles protect shoots, while those in grains protect roots under drought stress (seedlings grown in 15% polyethylene glycol). In addition, anthocyanins in coleoptiles protect wheat seedlings under metal toxicity (treatment with 25 µM CdCl2) [25] and moderate irradiation dose (pretreatment of dry seeds with 50 Gy before sowing) [26].
Four colored winter wheat cultivars along with two checks were studied for two years under organic and non-organic cropping systems [27]. While total phenolic content was more affected by year, anthocyanin content was more affected by genotype and the effect of environment and genotype was comparable for total antioxidant activity. Higher anthocyanin content and antioxidant activities and lower yields were observed under an organic cropping system and in a drier year. Thirteen diverse anthocyanin pigmented wheat genotypes were studied in Austria for two seasons [28]. Both genotype and environmental effects were important for agronomic and biochemical traits. A significant and relatively high negative correlation was observed between 1000-kernel weight and both total phenolic and anthocyanin content. However, protein content did not affect the biochemical traits measured.
Evaluation of purple grain products for end use and nutritional quality has been made for beer [29], biscuits [30,31], pasta [32], bread [33,34], buns [35], powder from bran faction [36], Chinese noodles [37], and steamed bread [38]. Hrivna et al. [39] studied the rheological properties of dough containing 10, 15 and 20% of the bran from purple wheat. Addition of bran increased water loss during baking and the specific volume of the bread. Generally, higher content of bran increased dough viscosity. Detailed evaluation of flour and dough properties from purple and blue wheat grain indicated that colored wheat cultivars did not have characteristics substantially different from standard commercial cultivars or flour products [40]. Khlestkina et al. [34] showed that bread-making quality and organoleptic properties of bakery products made from anthocyanin-containing grains did not concede, or in some cases were higher than the corresponding properties of products obtained from control grains. It was found that the presence of anthocyanin increased the shelf life of bakery products and their resistance to the development of mold under conducive conditions [34].
Most of the purple grain studies compared very diverse material including old and modern cultivars, cultivars with different adaptation and even different species. Using such diverse material makes it is difficult to isolate the effect of Pp genes, because the effect of genotype background will be substantial. The Institute of Cytology and Genetics in Novosibirsk (Russia) developed isogenic lines for purple grain in the background of cv. Saratovskaya-29 [11]. Two sources of Pp genes were used: cvs Purple and Purple Feed. Morphologically identical Saratovskaya-29 isogenic lines were used in the current study to compare isogenic lines with red (recurrent parent) and purple grain for grain yield and yield components, common bread-making quality traits and composition of health-related substances under variable growing conditions to develop relevant breeding approaches.

2. Materials and Methods

2.1. Materials

Spring wheat isogenic lines were developed using landmark cv. Saratovskaya-29 (S29) [41]. This cultivar was released in 1957 and was grown in several millions hectares in the 1960–1970s due to its wide adaptation. S29 has been routinely used in genetic studies in Russia and its genetic composition is well understood. Two purple grain cultivars were used as sources of color: cv. Purple [42] and cv. Purple Feed [43]. The Pp genes in both cultivars originated from Ethiopian T. dicoccum accession E-450. Eight backcrosses were used to transfer Pp genes to S29 by phenotypic selection [44]. Two backcrosses were made to split the lines carrying complementary genes into lines having different combinations of dominant and recessive Pp3 and Pp-1 alleles using molecular markers. Detailed description of this procedure is given by Gordeeva et al. [11]. Six genotypes were used in the study: semidwarf check cv. Seri-82 with white grain; S29 recurrent parent with red grain (Red); near-isogenic lines S29-Red(PF) and S29-Purple(PF), i.e., plants with dark anthocyanin coleoptile, and plants with dark anthocyanin coleoptile plus pericarp, respectively, originating from crosses with Purple Feed; S29-Red(P) and S29-Purple(P) from crosses with Purple (Table 1). The seeds were supplied by the Institute of Cytology and Genetics, Novosibirsk, Russia. The material was genotyped at CIMMYT genomics lab for more than 50 functional markers following the protocol described at https://maswheat.ucdavis.edu.

2.2. Multilocational Experiement in 2017

The isogenic lines along with S29 (parent) and Seri (check) were studied at seven sites in Turkey, Kazakhstan, and Russia in 2017 (Table 2). Two sites in Turkey (Konya and Cumra) represent a facultative wheat environment with planting in October–November and harvesting in July. In Ankara and Izmir, evaluation was made on small plots under artificial inoculation with stripe rust (Puccinia striiformis) and leaf rust (P. triticina), respectively. No grain yield was recorded at these two sites. The three sites in Russia and Kazakhstan represented high latitude short season (May–August) rain-fed spring wheat environments. In 2017, an epidemic of stem rust (P. graminis) affected wheat crop in Astana and Kostanay (the two sites in Kazakhstan) substantially reducing grain yield. Overall, the sites used in the study in 2017 provided sufficient diversity to evaluate the germplasm performance for adaptation, grain yield, and quality. Randomized complete block designs were used with the number of replicates shown in Table 2.
Field observations for common agronomic traits and yield component analysis were conducted following CIMMYT Wheat Physiology Manual volume II [45]. The grain from the 2017 experiments was analyzed for a number of traits at different institutions. University of Nebraska, Lincoln lab (USA) analyzed grain brightness (L), redness (a), and yellowness (b) using ColorFlex colorimeter (Hunter Associates Laboratory, Reston, VA, USA). Anthocyanin content was determined using the pH differential method with a few modifications [46]. Total antioxidant activity (ABTS assay) was used with a few modifications as described by Zhu et al. [47]. Grain protein content, SDS sedimentation value, and alveograph parameters were evaluated at the wheat quality lab at CIMMYT in Mexico using standard equipment and methodology. Zn and iron content were evaluated using the Inductively Coupled Plasma mass spectrometry (ICP-MS) method. Grain hardness was evaluated at the Transitional Zone Agricultural Research Institute (Eskisehir, Turkey) using Single Kernel Characterization System 4100 (Perten Instruments, Springfield, IL, USA). The data from the 2017 multilocational experiment with variable replicates was analyzed using an unbalanced regression design in GenStat (VSN International, Hemel Hempstead, Hertfordshire, UK). ANOVA results are presented in Table S1.

2.3. Experiement in Turkey in 2018

A replicated experiment was conducted in Konya in 2018 with large plots (40 m2) to obtain sufficient amount of grain for detailed quality analysis. The grain quality from the 2018 experiment in Turkey was evaluated at the Transitional Zone Agricultural Research Institute (Eskisehir, Turkey) using intact grain, whole wheat flour, regular flour with an extraction rate of 65.0%, and bread. Protein content was evaluated with Leco FP 657 (Leco Corp, St. Joseph, MI, USA) according to the AACCI method 46-30.01 [48]. Flour and bread color was evaluated using ColorFlex colorimeter (Hunter Associates Laboratory, Reston, VA, USA). Total dietary fiber content was determined by using the AACC Approved Method 32-07.01 [49]. The phenolic content was determined using Folin Ciocalteau reagent, according to the methods of Singleton and Rossi [50] and Gao et al. [51]. The antioxidant activities of the samples were determined using 2,2-di phenyl-2-picryl-hydrazyl reagent, according to the method of Brand-Williams et al. [52]. Macro and micro element content was evaluated using ICP-OES as reported by Kaçar [53]. Amino acid content was determined using HPLC (Agilent 1200 model) as reported by Henderson et al. [54]. Gluten aggregation properties were determined using a GlutoPeak tester (C.W. Brabender Inc., South Hackensack, NJ, USA) as reported by Chandi and Seetharaman [55]. Farinograph analysis was done according to the AACCI 54.21.02 method [48]. The bread-making procedure was conducted according to AACC 10-10B (48) with some modifications; 1.5% NaCl, 2% (w/w) yeast, 100 ppm ascorbic acid, 0.004% alpha-amylases were added to 100 g of regular flour (on 14% moisture basis). The water addition was adjusted according to the water absorption determined by the farinograph. After mixing for 1 min, the dough was left for fermentation at 30 °C and 85% RH for 1 h (30 min + punching + 30 min). The molded and panned dough pieces were proofed for 50 min under the same conditions. The baking was performed at 215 ° C for 25 min. The loaf volume (rapeseed displacement method) and loaf weight were measured after cooling for 2 h. The specific volume was calculated by dividing the loaf volume to loaf weight. The color parameters (L, a and b) for crumb and crust were determined with a Mini Scan XEplus (Hunter Associates Laboratory, Reston, VA, USA). Texture profile analyses of bread samples were determined according to AACC 74-09.01 [49] 24 h after baking using a texture analyzer (Stable Microsytems, TA-XT plus, Godalming, Surrey, UK). The parameters measured were hardness, cohesiveness, springiness, gumminess, and chewiness. The data from the 2018 experiment was analyzed using ANOVA (Table S2) and Biplot in GenStat (VSN International).

3. Results

3.1. Genotype by Environment Interaction for Agronomic and Quality Traits in the 2017 Experiments

Field observations of the isogenic lines confirmed their high phenotypic similarity. The genotyping data of more than 50 molecular markers demonstrated a complete match between the pairs of isogenic lines with purple and red gain as well as S29, their recurrent parent. Therefore, the differences observed in this study can be attributed to the Pp genes controlling the grain color. The isogenic lines had a very similar rate of development, reflected in the number of days to heading and plant height. The results of the ANOVA and significance of sites, genotypes, and their interactions are presented in Table 3. The effects of the sites were significant for all agronomic and grain quality traits. Significant effects of genotypes and genotype by environment interactions were found for grain yield, 1000-kernel weight, all three color parameters, iron content, grain hardness, protein content, and SDS sedimentation value. Three traits (spikelets/spike, anthocyanin content, and alveograph dough strength W value) had significant effects of genotype, but no significant interactions with environment, demonstrating the strong effects of genotype used in the study independent of the growing conditions. Zn, P/L ratio, grain weight/spike, and antioxidant content were not significantly affected by the genotypes.
The mean values of grain yield and spike productivity traits across sites are presented in Table 4. The purple- and red-grained isogenic lines did not differ significantly for the number of spikelets per spike, although for Seri this trait was significantly higher. The important difference was in 1000-kernel weight with purple isogenic lines being significantly higher than the red-grained line: 34.0 vs. 32.7 g for the lines with Pp3 genes originating from Purple Feed and 31.7 vs. 30.2 g for Purple originated lines. This was an increase of 4 to 5% in favor of the purple-grained lines. The grain yield was slightly but not significantly higher for purple-grained isogenic lines. Comparing two sources of Pp genes, it appears that lines originating from Purple Feed have slightly higher productivity, mostly due to larger grain.
The average values of grain quality parameters across sites are presented in Table 5. The purple grain color was clearly detected by the ColorFlex colorimeter parameters L, a and b with significant differences between the isogenic lines and the white-grained check cultivar. The amount of anthocyanin in S29-Purple(PF) was 151 mM/g, significantly higher than in S29 and both red-grained isogenic lines. However, S29-Purple(P) was not significantly higher than other lines. The iron content was highest in Seri but there were significant differences between the purple- and red-grained isogenic lines. S29-Purple(PF) had significantly higher Fe content than S29-Purple(P) (36.2 vs. 33.4 mg/kg). For SDS sedimentation and alveograph W value, the statistically significant genotype effect was largely due to the differences between Seri and other genotypes. No significant differences between the isogenic lines with different grain color were detected for these traits. Overall, it appears that isogenic line S29-Purple(PF) with Pp genes has a slight advantage in the number of traits compared to S29-Purple(P).

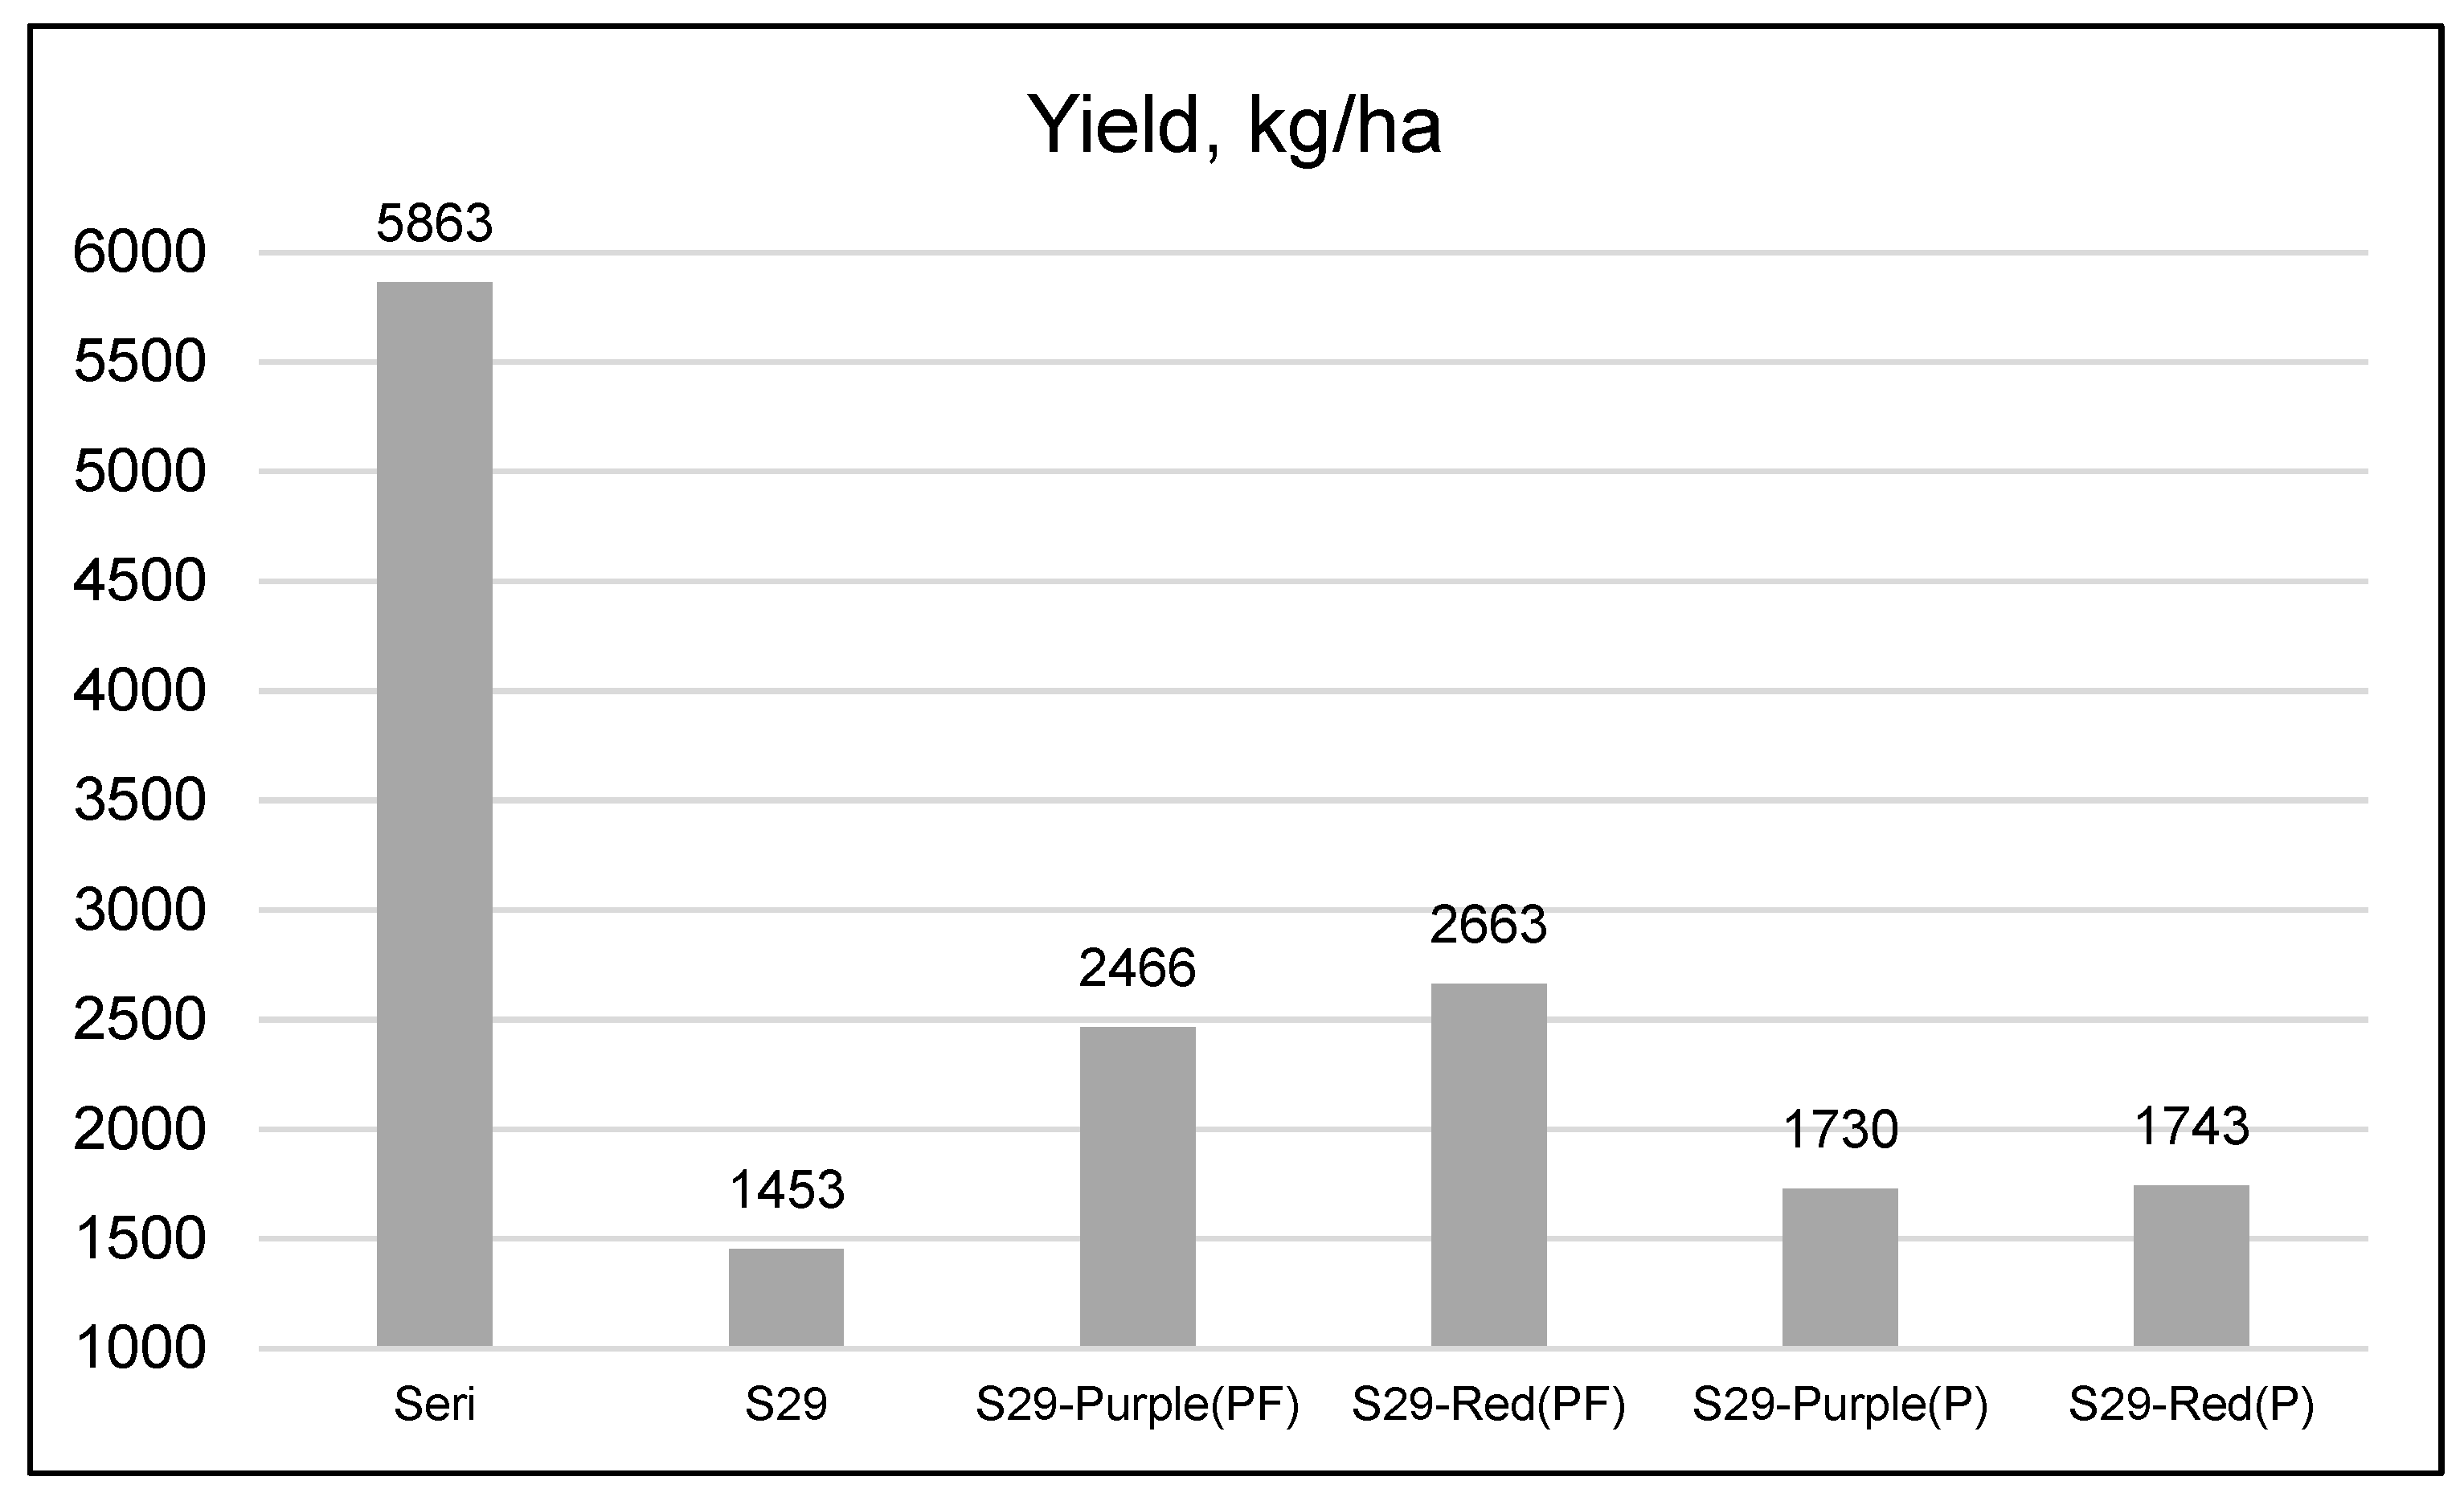
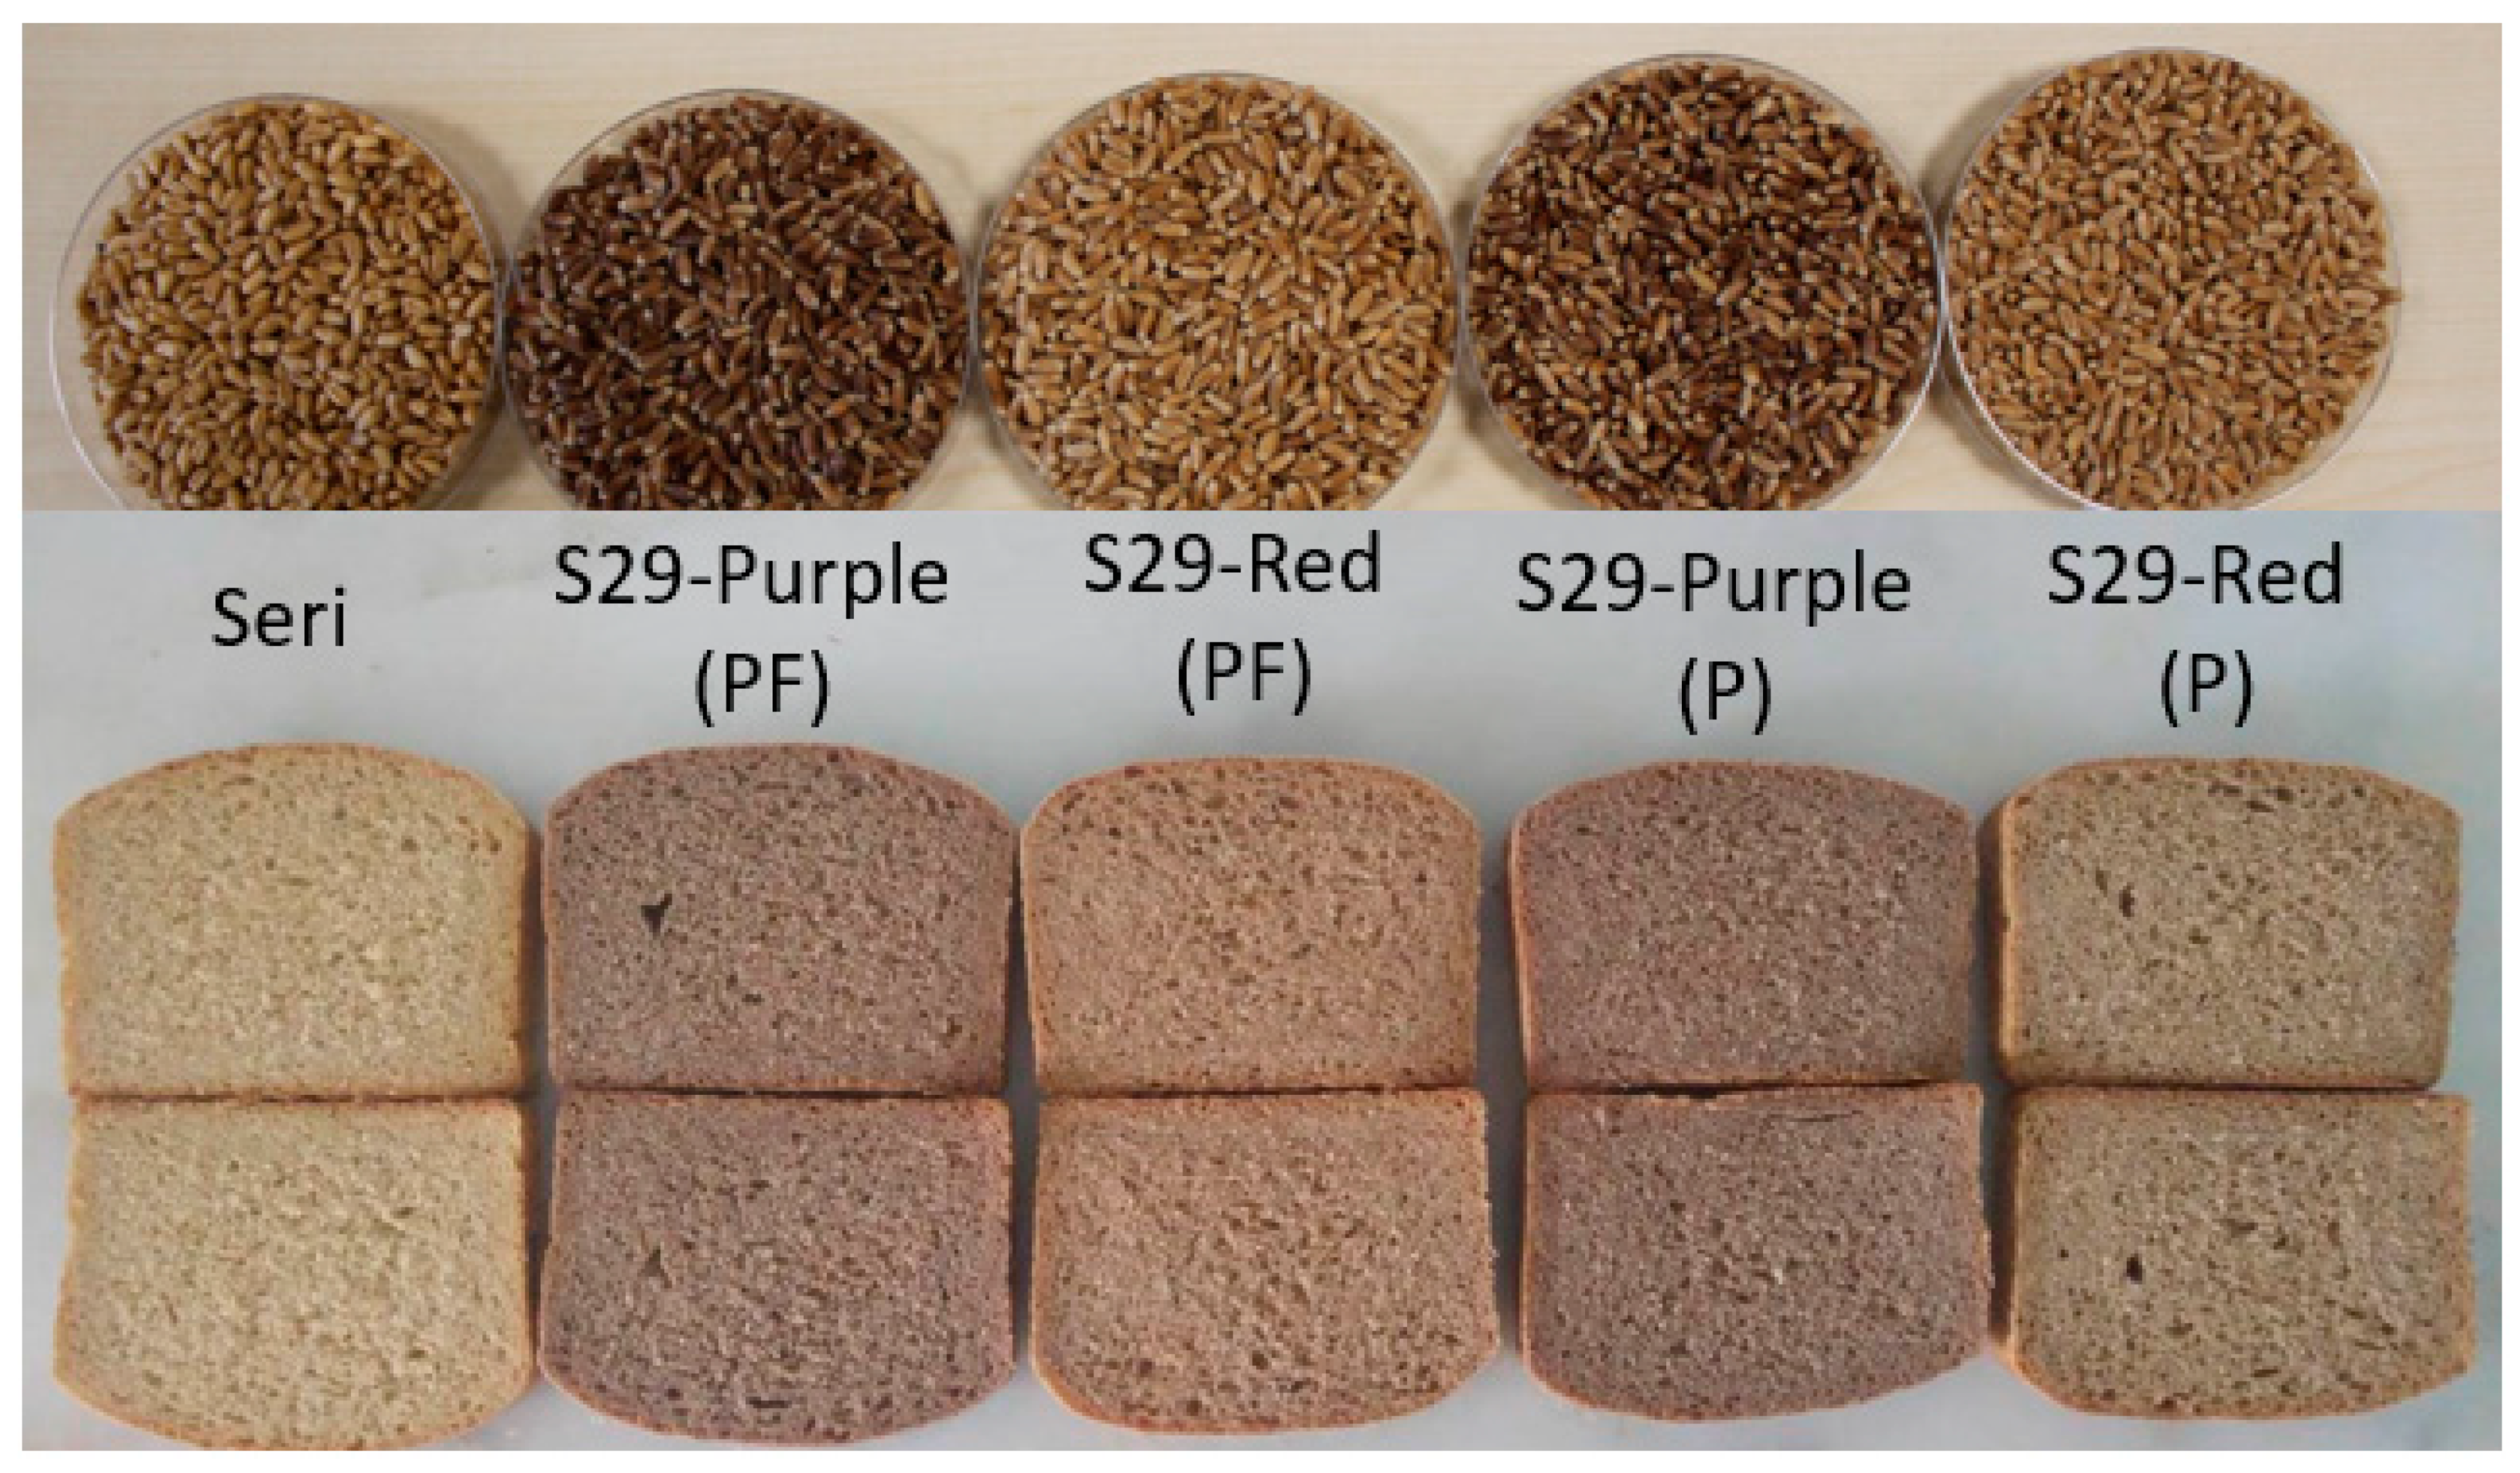
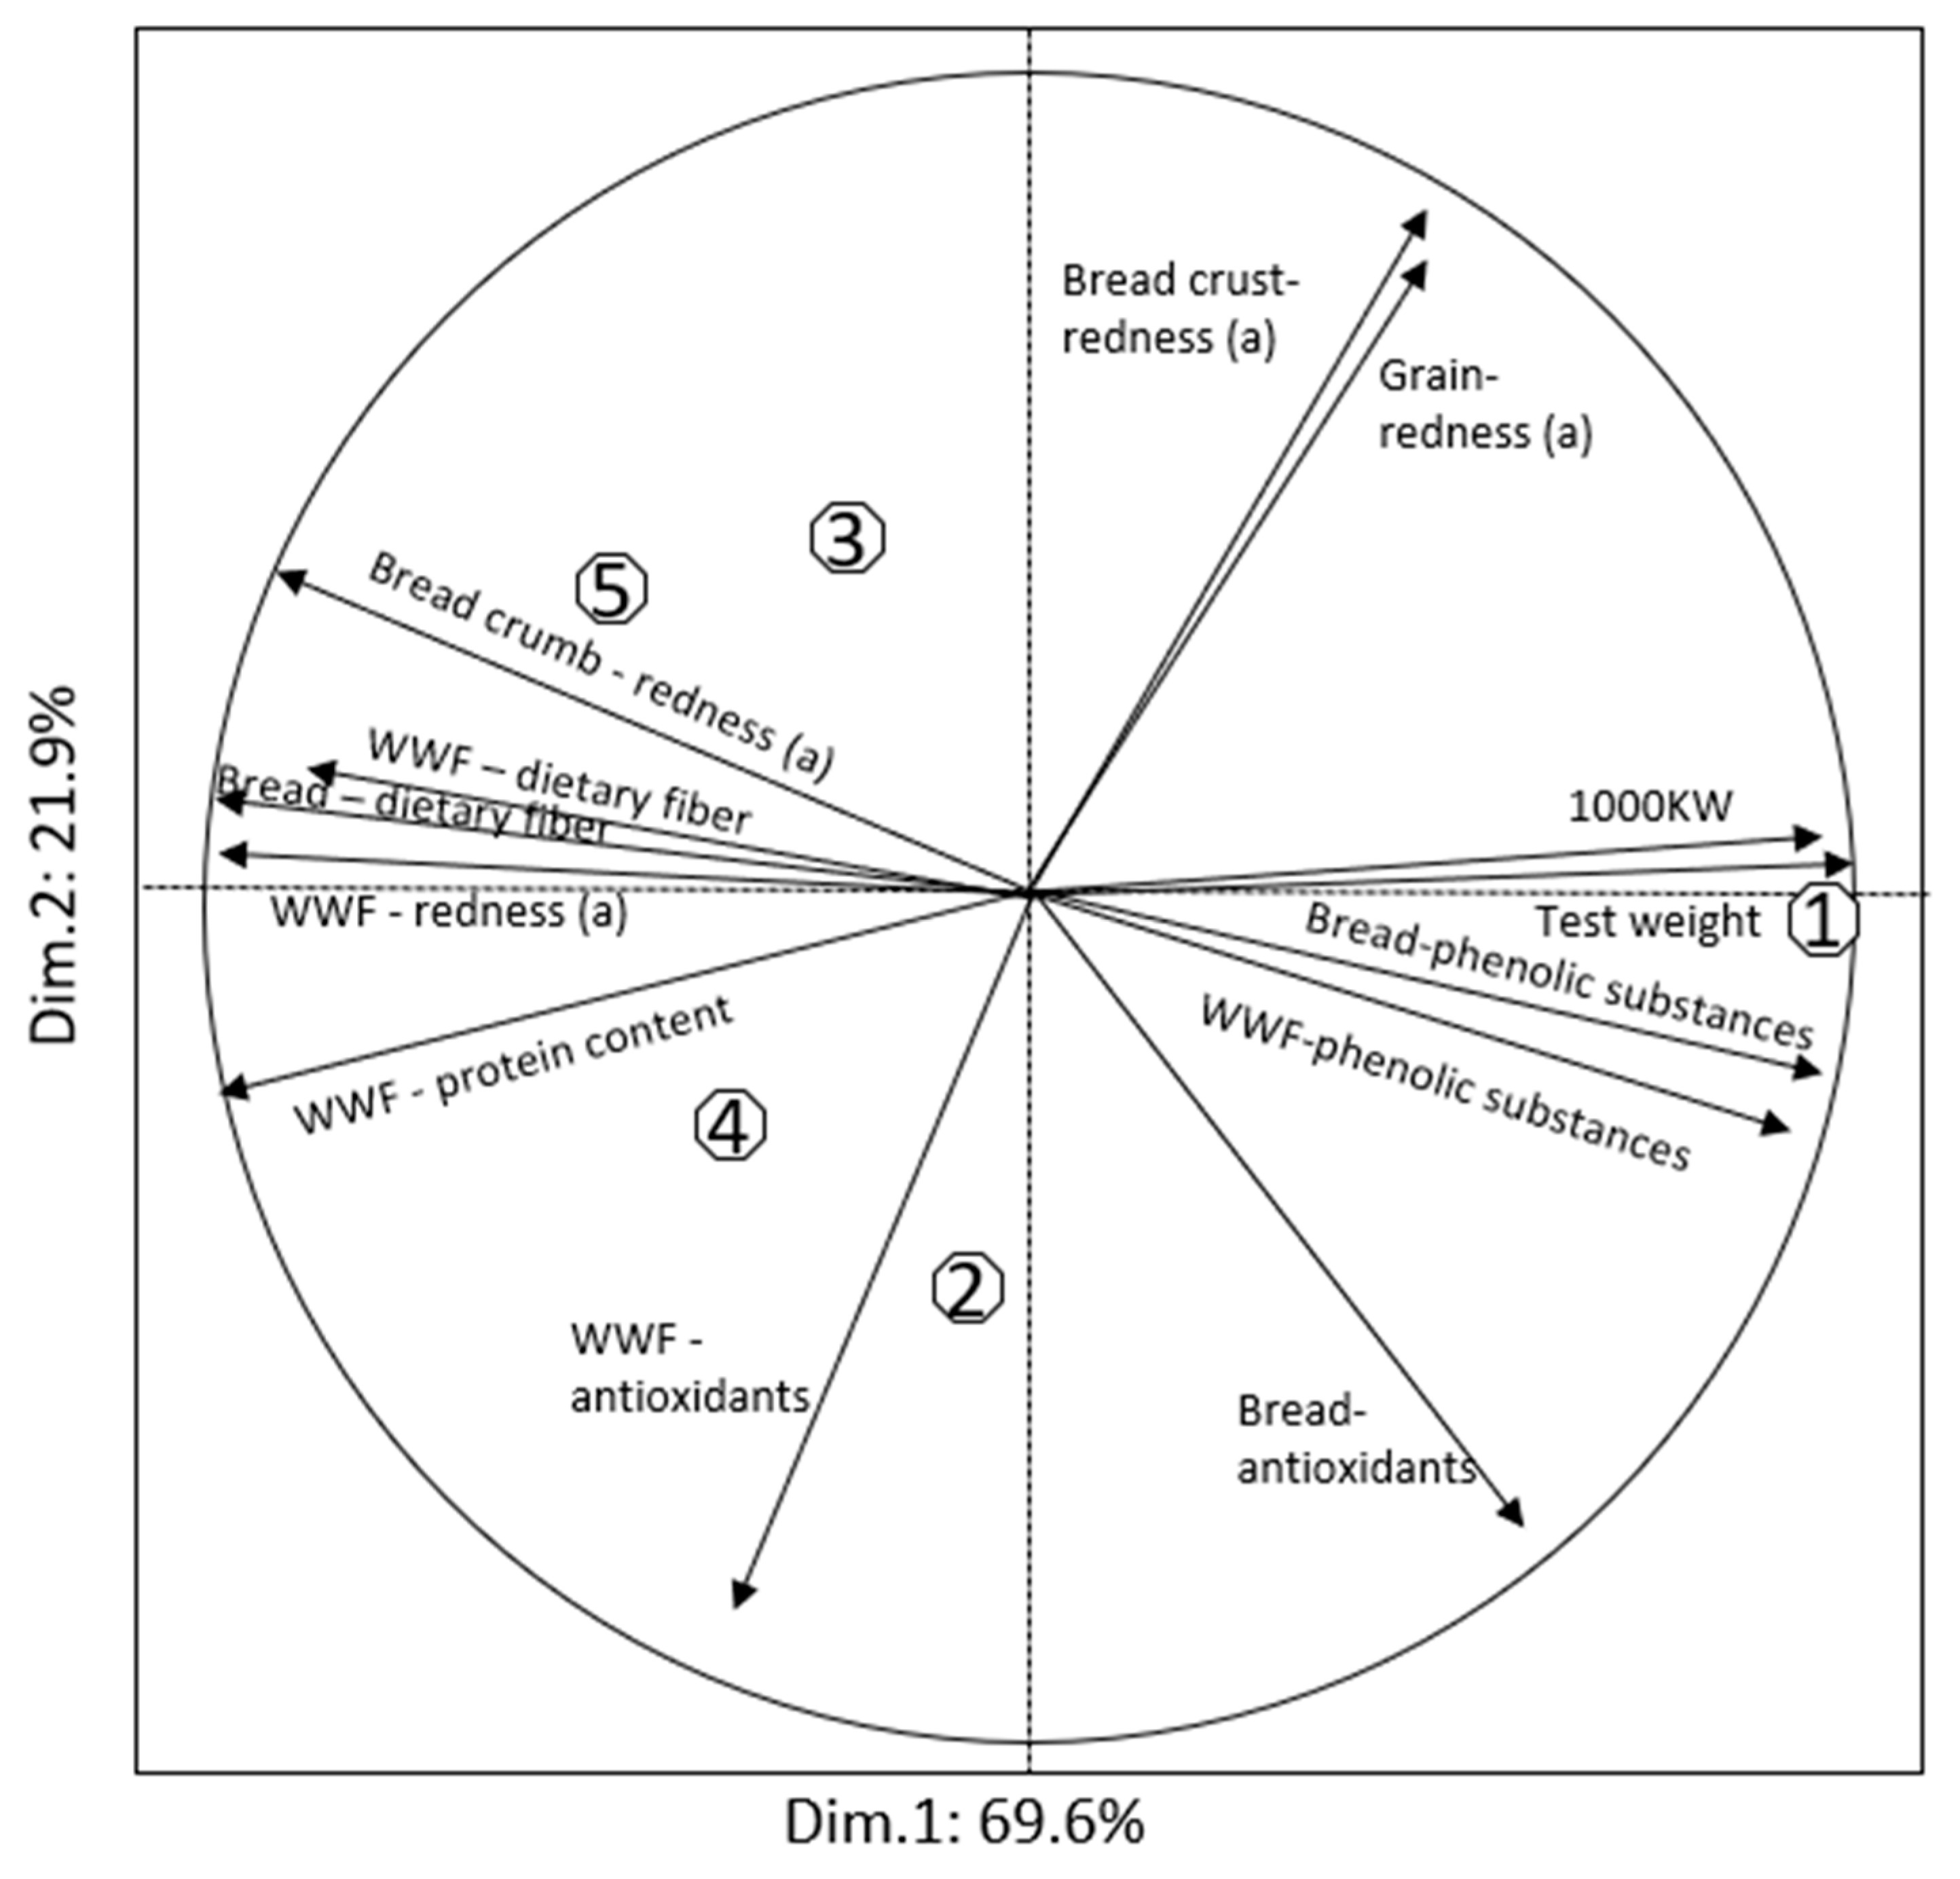
3.2. Effects of Purple Grain Genes on Agronomic Traits, Grain, Flour, and Bread Quality in the 2018 Experiment

In 2018, experimental lines along with S29 and Seri were tested in Konya, Turkey on large plots (40 m2) under irrigated conditions. S29 and all isogenic lines were lodged resulting in relatively low yield compared to Seri, which by far out yielded all other lines (Figure 1). Both isogenic lines S29-Purple(PF) and S29-Red(PF) had yields almost twice as high as the recurrent parent and 40–45% higher than lines originating from Purple.
The 2018 experiment provided sufficient grain for more detailed evaluation of compositional, physical, and technological properties (Table 6). The large differences in adaptation, grain yield, and quality of Seri and experimental lines were reflected in significant variation for a number of traits and parameters. For the test weight, 1000-kernel weight, protein content, and Zeleny sedimentation, Seri was significantly higher than S29 and isogenic lines, which did not differ among themselves. The slight superiority of purple-grained lines in 1000-kernel weight compared to red grain isolines, which was observed in 2017, was not confirmed in 2018. The darker color of purple-grained lines was detected using the colorimeter (L, a and b) on intact grain, whole wheat flour and bread crust and crumb (Figure 2). All the products from purple-grained lines had darker color judged by the L value. The total dietary fiber content in whole wheat flour and bread was highest in two isogenic lines derived from Purple, followed by those derived from Purple Feed and Seri. Both whole wheat flour and bread from purple-grained lines had higher total phenolic content, although the difference was significant only for S29-Purple(PF) vs. S29-Red(PF) for bread. However, Seri had the highest total phenolic content, which was significant. Variety Seri, being a semi-dwarf, is totally different in adaptation and quality from the old and tall material based on S29. It shows once again the importance of the comparison of related germplasm to single out the gene effects. There were no statistically significant differences in antioxidant activities in flour and bread. The rheological dough parameters (development time, BEM torque, and several others not presented in the table) of purple-grained lines were as good as their red counterparts and were, overall, superior to Seri. The baked bread volume and specific bread volume of purple-grained lines were not significantly higher than red-grained lines. There was no difference between the lines for sensory parameters such as springiness and cohesiveness.
The elemental composition (Ca, Cu, Fe, K, Mg, Mn, P, and Zn) of whole wheat flour and bread is presented in Table S3. Significant differences for both flour and bread were only observed for Cu (S29-Purple(PF) had significantly higher content) and for Mn (Seri had significantly higher content). Purple and red-grained isogenic lines were significantly different in P content in whole wheat flour but not in bread. No significant differences were detected for Fe content. Bread Zn content in two isogenic lines derived from Purple Feed was 15 to 20% higher than lines derived from Purple.
The amino acid content in whole wheat flour (per unit weight of flour and protein) and in bread (per unit weight of bread) are presented in Table S4. No significant differences were detected for arginine, tyrosine, cysteine, and lysine. Significant differences in content in whole wheat flour were detected for aspartic acid, glutamic acid, glycine, threonine, alanine, phenylalanine, and leucine. A significant difference was detected for both flour and bread only in isoleucine, but again with Seri being inferior to the other genotypes.
Biplot analysis of key grain quality traits including physical parameters and content of health-related substances demonstrated potentially useful relationships (Figure 3). Seri was associated with a higher test weight, 1000-kernel weight, and higher content of phenolic substances. Experimental lines were associated with higher protein and dietary fiber content, both in whole wheat flour and bread. The redness of whole wheat flour and bread was closely associated with the dietary fiber and protein content. The redness of grain and bread crust were not good indicators of any parameters included in the biplot. Purple-grained isolines clustered together and were associated with higher antioxidant content in whole wheat flour.

4. Discussion

The current study addressed the important question of the relative contribution of genotype and environment for characters associated with purple color. As expected, due to the diversity of our testing sites, the effect of environment was larger compared to genotype for the studied productivity and quality traits. Nevertheless, several important traits such as grain color and anthocyanin content are closely controlled by genotype, offering the opportunity for selection. These results are similar to previous studies conducted in Canada [56,57]. The significant genotypic effects and genotype by environment interactions suggest that the methodology of breeding would require careful selection of sites and consideration of the genotype rank change with the change in testing locations (crossover interactions).
The current study contributed to the understanding of variation of different grain quality traits along the processing line: grain, whole wheat flour, regular flour and bread. When comparing the properties of the isogenic lines differing only in a few genes, it is not guaranteed that purple grain products will have superior and significant advantages. For example, the phenolic content in purple-grained lines was not significantly higher in whole wheat flour than in red-colored lines. However, it was significantly higher in bread. For antioxidant activities, no differences between the genotypes were detected in both years. This is a common challenge for research and breeding for health related traits in wheat. Normally grain phytochemicals are present in small quantities, and require reliable and sophisticated equipment for their accurate quantification. In this regard, while breeding colored wheat with emphasis on anthocyanin and antioxidants, it makes sense to increase the number of replicates to clearly establish the relationships between the traits and genes, and background genotypic effects. Targeting phytochemicals using genomic selection could provide an excellent opportunity to make genetic gains once relevant training populations are developed and characterized.
Two sources of Pp genes were used in the development of the isogenic lines and were conveniently compared in two experiments of this study. The lines originating from Purple Feed were substantially better for grain yield, some productivity and grain quality traits compared to lines originating from Purple. The lines derived from Purple Feed have a donor fragment in chromosome 7D extending from the locus Xgwm0044 to Xgwm0111, while the donor fragment in the lines derived from Purple is larger (from Xgwm1004 to Xgwm0437) [9]. This region of chromosome 7D is known as the gene-rich region [58], including a locus for grain weight [59]. Putative allelic differences in this locus between the isogenic lines can explain the Purple Feed-derived line superiority for grain yield. Thus, this line would be the preferred donor for further transfer of the Pp genes into elite wheat lines. Overall, despite very clear differences in the grain, flour, and bread color observed in this study, the effects of Pp genes on grain quality traits were not large and stable enough to be easily used in breeding. Therefore, from a breeding perspective, utilization of additional genes to strengthen Pp gene effects on targeted traits would be a justified approach for developing germplasm for health-promoting grain. Substantial progress has already been made for biofortified wheat with higher Zn content [60]. The combination of high Zn and purple grain can be explored to further enhance the health benefits of biofortified wheat. Likewise, as research and breeding for other traits such as Fe content and dietary fiber progress, these can also be incorporated into purple wheat improvement programs.
There is always opportunity for genetic gains provided there is genetic diversity, understanding of genotype by environment interaction, and relevant breeding methodology and technology. In this case, purple wheat improvement represents a unique opportunity to use the extensive knowledge of bread wheat to develop healthier food products.

Supplementary Materials

The following are available online at https://www.mdpi.com/2073-4395/10/1/86/s1. Table S1: 2017 experiment ANOVA results, Table S2: 2018 experiment ANOVA results, Table S3. Elemental composition (mg/kg) of flour and bread of purple grain isogenic lines, Konya, Turkey, 2018, Table S4. Amino acids content in flour and bread of purple grain isogenic lines, Konya, Turkey, 2018.

Author Contributions

This cooperative study involved institutions and authors from different countries and continents with the following contributions: conceptualization, writing and editing, A.M., E.K., E.G., and P.S.B.; field experiments, B.A., M.B., V.C., V.S., Y.Z.; 2017 grain quality and molecular markers analysis, C.G., V.G., S.D., R.P., D.R.; 2018 grain quality analysis Y.K., S.G.; statistical analysis, S.A., A.N., K.S. All authors have read and agreed to the published version of the manuscript.

Funding

This research was funded by CRP WHEAT. Field experiment at Omsk State Agrarian University was supported by the Russian Science Foundation grant to Omsk State Agrarian University (project No. 16-16-10005).

Acknowledgments

Carlos Guzman gratefully acknowledges the European Social Fund and the Spanish State Research Agency (Ministry of Science, Innovation and Universities) for financial funding through the Ramon y Cajal Program (RYC-2017-21891). Dr. Ian Riley’s editorial assistance is highly appreciated.

Conflicts of Interest

The authors declare no conflict of interest. The funders had no role in the design of the study; in the collection, analyses or interpretation of data; in the writing of the manuscript, or in the decision to publish the results.

References

  1. Lia, D.; Wanga, P.; Luob, Y.; Zhaoa, M.; Chena, F. Health benefits of anthocyanins and molecular mechanisms: Update from recent decade. Crit. Rev. Food Sci. Nutr. 2017, 57, 1729–1741. [Google Scholar] [CrossRef]
  2. Grausgruber, H.; Atzgersdorfer, K.; Bohmdorefr, S. Purple and blue wheat—health-promoting grains with increased antioxidant activity. Cereal Foods World 2018, 63, 217–220. [Google Scholar]
  3. Sytar, O.; Bosko, P.; Zivcak, M.; Brestic, M.; Smetanska, I. Bioactive phytochemicals and antioxidant properties of the grain and sprouts of colored wheat genotypes. Molecules 2018, 23, 2282. [Google Scholar] [CrossRef] [PubMed] [Green Version]
  4. Zeven, A.C. Wheats with purple and blue grain. Euphytica 1991, 56, 243–258. [Google Scholar] [CrossRef]
  5. Kassegn, H.H. Determination of proximate composition and bioactive compounds of the Abyssinian purple wheat. Cogent Food Agric. 2018, 4, 1421415. [Google Scholar] [CrossRef]
  6. Khlestkina, E.K.; Pestsova, E.G.; Röder, M.S.; Börner, A. Molecular mapping, phenotypic expression and geographical distribution of genes determining anthocyanin pigmentation of coleoptiles in wheat (Triticum aestivum L.). Theor. Appl. Genet. 2002, 104, 632–637. [Google Scholar] [CrossRef]
  7. Khlestkina, E.K.; Pshenichnikova, T.A.; Röder, M.S.; Börner, A. Clustering anthocyanin pigmentation genes in wheat group 7 chromosomes. Cereal Res. Commun. 2009, 37, 391–398. [Google Scholar] [CrossRef]
  8. Khlestkina, E.K.; Gordeeva, E.I.; Arbuzova, V.S. Molecular and functional characterization of wheat near-isogenic line ‘i:S29Ra’ having intensive anthocyanin pigmentation of the coleoptile, culm, leaves and auricles. Plant Breed. 2014, 133, 454–458. [Google Scholar] [CrossRef]
  9. Tereshchenko, O.Y.; Gordeeva, E.I.; Arbuzova, V.S.; Börner, A.; Khlestkina, E.K. The D genome carries a gene determining purple grain colour in wheat. Cereal Res. Commun. 2012, 40, 334–341. [Google Scholar] [CrossRef]
  10. Tereshchenko, O.Y.; Arbuzova, V.S.; Khlestkina, E.K. Allelic state of the genes conferring purple pigmentation of different wheat organs predetermines transcriptional activity of the anthocyanin biosynthesis structural genes. J. Cereal Sci. 2013, 57, 10–13. [Google Scholar] [CrossRef]
  11. Gordeeva, E.I.; Shoyeva, O.Y.; Khlestkina, E.K. Marker-assisted development of bread wheat near-isogenic lines carrying various combinations of purple pericarp (Pp) alleles. Euphytica 2015, 203, 469–476. [Google Scholar] [CrossRef]
  12. Shoeva, O.Y.; Gordeeva, E.I.; Khlestkina, E.K. The regulation of anthocyanin synthesis in the wheat pericarp. Molecules 2014, 19, 20266–20279. [Google Scholar] [CrossRef] [PubMed] [Green Version]
  13. Martinek, P.; Jirsa, O.; Vaculova, K.; Chrpova, J.; Watanabe, N.; Buresova, V.; Kopecky, D.; Stiasna, K.; Vyhnanek, T.; Trojan, V. Use of wheat gene resources with different colour in breeding. In Proceedings of the 64 Tagung der Vereiningung der pflanzenzuchter und saatgutkaufleute Osterreichs, Raumberg-Gumpenstein, Austria, 25–26 November 2013; pp. 1–4. [Google Scholar]
  14. Hong, M.J.; Kim, D.Y.; Nam, B.M.; Ahn, J.-W.; Kwon, S.-J.; Seo, Y.W.; Kim, J.-B. Characterization of novel mutants of hexaploid wheat (Triticum aestivum) with various depths of purple grain color and antioxidant capacity. J. Sci. Food Agric. 2019, 99, 55–63. [Google Scholar] [CrossRef] [PubMed] [Green Version]
  15. Bohmdorfer, S.; Oberlerchner, J.T.; Fuchs, C.; Rosenau, T.; Graugsgruber, H. Profiling and quantification of grain anthocyanins in purple pericarp x blue aleurone wheat crosses by high-performance thin-layer chromatography and densitometry. Plant Methods 2018, 14, 29. [Google Scholar] [CrossRef] [Green Version]
  16. Kryger, S.; Morlock, G.E. Fingerprinting and characterization of anthocyanins in 94 colored wheat varieties and blue aleurone and purple pericarp wheat crosses. J. Chromatogr. A 2018, 1538, 75–85. [Google Scholar] [CrossRef]
  17. Syed Jafar, S.; Baron, J.; Siebenhandl-Ehn, S.; Rosenau, T.; Bohmdorfer, S.; Graugsgruber, H. Increased anthocyanin content in purple pericarp x blue aleurone wheat crosses. Plant Breed. 2013, 132, 546–552. [Google Scholar] [CrossRef]
  18. Knievel, D.C.; Abdel-Aal, E.-S.; Rabalski, I.; Nakamura, T.; Hucl, P. Grain color development and the inheritance of high anthocyanin blue aleurone and purple pericarp in spring wheat. J. Cereal Sci. 2009, 50, 113–120. [Google Scholar] [CrossRef]
  19. Abdel-Aal, E.-S.; Hucl, P.; Shipp, J.; Rabalski, I. Compositional differences in anthocyanins from blue- and purple- grained spring wheat grown jn four environments in central Saskatchewan. Cereal Chem. 2016, 93, 32–38. [Google Scholar] [CrossRef]
  20. Bustos, D.V.; Riegel, R.; Calderini, D.F. Anthocyanin content of grain in purple wheat is affected by grain position, assimilate availability and agronomic management. J. Cereal Sci. 2011, 55, 257–264. [Google Scholar] [CrossRef]
  21. Hosseinian, F.S.; Li, W.; Beta, T. Measurement of anthocyanins and other phytochemicals in purple wheat. Food Chem. 2008, 109, 916–924. [Google Scholar] [CrossRef]
  22. Li, X.; Lv, X.; Wang, X.; Zhang, M.; Ren, M. Effects of abiotic stress on anthocyanin accumulation and grain weight in purple wheat. Crop Pasture Sci. 2018, 69, 1208–1214. [Google Scholar] [CrossRef]
  23. Ma, D.; Zhang, J.; Hou, J.; Li, Y.; Huang, X.; Wang, C.; Lu, H.; Zhu, Y.; Guo, T. Evaluation of yield, processing quality and nutritional quality in different-colored wheat grains under nitrogen and phosphorus application. Crop Sci. 2018, 58, 402–415. [Google Scholar] [CrossRef]
  24. Shoeva, O.Yu.; Gordeeva, E.I.; Arbuzova, V.S.; Khlestkina, E.K. Anthocyanins participate in protection of wheat seedlings from osmotic stress. Cereal Res. Commun. 2017, 45, 47–56. [Google Scholar] [CrossRef] [Green Version]
  25. Shoeva, O.Yu.; Khlestkina, E.K. Anthocyanins participate in the protection of wheat seedlings against cadmium stress. Cereal Res. Commun. 2018, 46, 242–252. [Google Scholar] [CrossRef]
  26. Gordeeva, E.I.; Shoeva, O.Yu.; Yudina, R.S.; Kukoeva, T.V.; Khlestkina, E.K. Effect of seed pre-sowing gamma-irradiation treatment in bread wheat lines differing by anthocyanin pigmentation. Cereal Res. Commun. 2018, 46, 41–53. [Google Scholar] [CrossRef]
  27. Zrckova, M.; Capuchova, I.; Eliasova, M.; Paznoch, L.; Pasderu, K.; Dvorak, P.; Konvalina, P.; Orsak, M.; Sterba, Z. The effect of genotypes, weather conditions and cropping system on antioxidant activity and content of selected antioxidant compunds in wheat with colored grain. Plant Soil Eviron. 2018, 64, 530–538. [Google Scholar] [CrossRef]
  28. Eticha, F.; Grausgruber, H.; Siebenhandl-Ehn, S.; Berghofer, E. Some agronomic and chemical traits of blue aleurone and purple pericarp wheat (Triticum L.). J. Agric. Sci. Technol. 2011, 1, 48–58. [Google Scholar]
  29. Li, W.; Pickard, M.D.; Beta, T. Evaluation of antioxidant activity and electronic taste and aroma properties of antho-beers from purple grain. J. Agric. Food Chem. 2007, 55, 8958–8966. [Google Scholar] [CrossRef]
  30. Pasqualone, A.; Bianco, A.M.; Paradiso, V.M.; Summo, C.; Gabarcorta, G.; Caponio, F.; Blanco, A. Production and characterization of functional biscuits obtained from purple wheat. Food Chem. 2015, 180, 64–70. [Google Scholar] [CrossRef]
  31. Usenko, N.I.; Khlestkina, E.К.; Asavasanti, S.; Gordeeva, E.I.; Yudina, R.S.; Otmakhova, Y.S. Possibilities of enriching food products with anthocyanins by using new forms of cereals. Foods Raw Mater. 2018, 6, 128–135. [Google Scholar] [CrossRef]
  32. Fiocco, D.B.M.; De Simone, V.; De Leonardis, A.M.; Giovaniello, V.; Del Nobile, M.A.; Padalino, L.; Lecce, L.; Borelli, G.M.; De Vita, P. Use of purple durum wheat to produce naturally functional fresh and dry pasta. Food Chem. 2016, 205, 187–195. [Google Scholar] [CrossRef] [PubMed] [Green Version]
  33. Li, W.; Beta, T. Flour and bread from black-, purple-, and blue-colored wheats. In Flour and Breads and Their Fortification in Health and Disease Prevention; Preedy, V.R., Watson, R.R., Patel, V.B., Eds.; Academic Press: Cambridge, MA, USA, 2011; pp. 59–67. [Google Scholar]
  34. Khlestkina, E.К.; Usenko, N.I.; Gordeeva, E.I.; Stabrovskaya, O.I.; Sharfunova, I.B.; Otmakhova, Y.S. Evaluation of wheat products with high flavonoid content: Justification of importance of marker-assisted development and production of flavonoid-rich wheat cultivars. Vavilovskii Zhurnal Genetiki i Selektsii 2017, 21, 545–553. [Google Scholar] [CrossRef]
  35. Paznocht, L.; Kotilkova, Z.; Orsak, M.; Lachman, J.; Martinek, P. Carotenoid changes of colored-grain wheat flours during bun-making. Food Chem. 2019, 277, 727–734. [Google Scholar] [CrossRef] [PubMed]
  36. Abdel-Aal, E.-S.; Hucl, P.; Rabalski, I. Composition and antioxidant properties of anthocyanin-rich products prepared from purple wheat. Food Chem. 2018, 254, 13–19. [Google Scholar] [CrossRef] [PubMed]
  37. Ma, D.; Zhang, J.; Li, Y.; Wang, C. Quality of noodles made from colour-grained wheat. Czech J. Food Sci. 2018, 36, 314–320. [Google Scholar]
  38. Tian, S.-Q.; Chen, Z.; Wei, Y. Measurement of colour-grained wheat nutrient compounds and the application of combination technology in dough. J. Cereal Sci. 2018, 83, 63–67. [Google Scholar] [CrossRef]
  39. Hrivna, L.; Zigmundova, V.; Buresova, I.; Maco, R.; Vyhnanek, T.; Trojan, V. Pheological properties of dough and baking quality of products using coloured wheat. Plant Soil Environ. 2018, 64, 203–208. [Google Scholar]
  40. Genetic Resources Information System for Wheat and Triticale. SARATOVSKAYA-29. Available online: http://wheatpedigree.net/sort/show/56274 (accessed on 5 October 2019).
  41. Genetic Resources Information System for Wheat and Triticale. PURPLE-GRAIN. Available online: http://wheatpedigree.net/sort/show/50574 (accessed on 5 October 2019).
  42. Genetic Resources Information System for Wheat and Triticale. PURPLE-FEED. Available online: http://wheatpedigree.net/sort/show/50573 (accessed on 5 October 2019).
  43. Buresova, I.; Trojan, V.; Helis, M. Characteristics of flour and dough from purple and blue wheat grain. Potravin. Slovak J. Food Sci. 2019, 13, 163–166. [Google Scholar]
  44. Arbuzova, V.S.; Maystrenko, O.I.; Popova, O.M. Development of near-isogenic lines of the common wheat cultivar ‘Saratovskaya 29’. Cereal Res. Commun. 1998, 26, 39–46. [Google Scholar]
  45. Pask, A.J.D.; Pietragalla, J.; Mullan, D.M.; Reynolds, M.P. Physiological Breeding II: A Field Guide to Wheat Phenotyping; CIMMYT: El Batán, Mexico, 2012; pp. 72–130. [Google Scholar]
  46. Shao, Y.; Xu, F.; Sun, X.; Bao, J.; Beta, T. Phenolic acids, anthocyanins, and antioxidant capacity in rice (Oryza sativa L.) grains at four stages of development after flowering. Food Chem. 2014, 143, 90–96. [Google Scholar] [CrossRef]
  47. Zhu, K.X.; Lian, C.X.; Guo, X.N.; Peng, W.; Zhou, H.M. Antioxidant activities and total phenolic contents of various extracts from defatted wheat germ. Food Chem. 2011, 126, 1122–1126. [Google Scholar] [CrossRef]
  48. Anonymous. Approved Method; American Association of Cereal Chemists International: St. Paul, MN, USA, 2000. [Google Scholar]
  49. Anonymous. Approved Method; American Association of Cereal Chemists International: St. Paul, MN, USA, 2010. [Google Scholar]
  50. Singleton, V.L.; Rossi, J.A. Colorimetry of total phenolics with phosphomolybdic-phosphotungistic acid reagent. Am. J. Enol. Viticul. 1965, 16, 144–158. [Google Scholar]
  51. Gao, L.; Wang, S.; Oomah, B.D.; Mazza, G. Wheat quality: Antioxidant activity of wheat millstreams. In Wheat Quality Education; Ng, P., Wrigley, C.W., Eds.; AACC International: St Paul, MN, USA, 1995; pp. 219–233. [Google Scholar]
  52. Brand-Williams, W.; Cuvelier, M.E.; Berset, C. Use of a radical method to evaluate antioxidant activity. Food Sci. Technol. 1995, 28, 25–30. [Google Scholar] [CrossRef]
  53. Kaçar, B.; Inal, A. Bitki Analizleri; Nobel: Ankara, Turkey, 2008; 912p. [Google Scholar]
  54. Henderson, J.W.; Ricker, R.D.; Bidlingmeyer, B.A.; Woodward, C. Rapid, Accurate, Sensitive, and Reproducible HPLC Analysis of Amino Acids; Agilent technologies: Santa Clara, CA, USA, 2000. [Google Scholar]
  55. Chandi, G.K.; Seetharaman, K. Optimization of gluten peak tester: A statistical approach. J. Food Qual. 2012, 35, 69–75. [Google Scholar] [CrossRef]
  56. Garg, M.; Meenakshi, C.; Venkatesh, R.K.; Saloni, S.; Nand, S.; Aman, K.; Jaspreet, J.; Manpreet, S.; Sukhvinder, S. Transfer of grain colors to elite wheat cultivars and their characterization. J. Cereal Sci. 2016, 71, 138–144. [Google Scholar] [CrossRef]
  57. Shin, O.H.; Kim, D.Y.; Seo, Y.W. Effects of different depth of grain colour on antioxidant capacity during water imbibition in wheat (Triticum aestivum L.). J. Sci. Food Agric. 2017, 97, 2750–2758. [Google Scholar] [CrossRef]
  58. Erayman, M.; Sandhu, D.; Sidhu, D.; Dilbirligi, M.; Baenziger, P.S.; Gill, K.S. Demarcating the gene-rich regions of the wheat genome. Nucleic Acids Res. 2004, 32, 3546–3565. [Google Scholar] [CrossRef] [Green Version]
  59. Röder, M.S.; Huang, X.Q.; Börner, A. Fine mapping of the region on wheat chromosome 7D controlling grain weight. Funct. Integr. Genom. 2008, 8, 79–86. [Google Scholar] [CrossRef]
  60. Listman, M.; Guzman, C.; Palacios-Rojas, N.; Pfeiffer, W.H.; San Vicente, F.; Govindan, V. Improving nutrition through biofortification: Preharvest and postharvest technologies. Cereal Foods World 2019, 64. [Google Scholar] [CrossRef]
Figure 1. Grain yield of Seri (check), S29 (parent), and isogenic lines in 2018, Konya, Turkey (LSD0.05 = 1142 kg/ha).
Agronomy 10 00086 g001
Figure 2. Grain and bread made from Seri (check) and purple grain isogenic lines, Konya, Turkey, 2018.
Agronomy 10 00086 g002
Figure 3. Biplot analysis of grain quality traits, in Konya, Turkey, 2018. (1) Seri, (2) S29-Purple(PF), (3) S29-Red(PF), (4) S29-Purple(P), and (5) S29-Red(P). WWF, whole wheat flour.
Agronomy 10 00086 g003
Table 1. Description of the material used in the study.
No.Genotype NameAbbreviationGenotype 1Pp3 Gene SourceGrain Color
1Seri-82 (Check)Seri--White
2Saratovskaya 29 (Recurrent parent)S29pp-D1; pp3-Red
3Saratovskaya 29-Purple PFS29-Purple (PF)Pp-D1; Pp3PFPurple FeedPurple
4Saratovskaya 29-Red PFS29-Red (PF)Pp-D1; pp3PFPurple FeedRed
5Saratovskaya 29-Purple PS29-Purple (P)Pp-D1; Pp3PPurplePurple
6Saratovskaya 29-Red PS29-Red (P)Pp-D1; pp3PPurpleRed
1 All genotypes possess Pp-A1.
Table 2. Characteristics of the experimental sites used in 2017.
SiteLatitude (°N)Longitude (°E)SeasonSeasonal Rainfall (mm)Plots (m2)RepsYield (kg/ha)Protein (%)
Konya, TR 137.5332.29Nov–Jun18952231711.9
Cumra, TR37.3832.4418252401612.5
Ankara, TR39.3632.4022411-13.7
Izmir, TR38.3327.0250411-13.5
Omsk, RU55.0173.18May–Sep17053314114.4
Astana, KZ51.3871.0110312166612.0
Kostanay, KZ53.5162.0821811183814.1
1 TR, Turkey; RU, Russia; and KZ, Kazakhstan.
Table 3. Significance of main effects and their interactions for different traits in purple grain isogenic lines across sites in 2017.
TraitNumber of Sites Trait RecordedTrait Mean ValueSignificance 1 of Main Effects and Their InteractionsCV (%)
SitesGenotypesGenotypes × Sites
Grain yield, kg/ha52841*****12.9
Spike length, cm48.53***nsns6.7
Spikelets/spike416.5******ns5.1
Grains/spike437.0*nsns8.4
1000-kernel weight, g732.5*******2.8
Grain weight/spike, g41.43***nsns13.9
Test weight, kg/hl774.9*********0.7
Grain brightness (L) (UNL)783.7********0.5
Grain redness (a) (UNL)71.32*******8.3
Grain yellowness (b) (UNL)711.0*********2.1
Zn content, mg/kg (Mex)725.1***ns*9.3
Fe content, mg/kg (Mex)734.7*******5.5
Anthocyanin content, mM/g7130.9****ns12.6
Antioxidants content, mM/g70.216*nsns6.0
Grain hardness (ESK)678.7*********1.7
Grain protein content, % (Mex)713.2********3.2
SDS sedimentation, mL (Mex)320.5*******2.6
Alveograph, W (Mex)3489******ns7.6
Alveograph, P/L (Mex)33.14***nsns25.8
1, *, ** and ***, significant at p < 0.05, 0.01 and 0.001, respectively; and ns, not significant at p = 0.05.
Table 4. Grain yield and spike productivity traits in purple grain isogenic lines across sites in 2017.
GenotypeSpike Length (cm)Spikelets/SpikeGrains/Spike1000-Kernal Weight (g)Grain Weight/Spike (g)Test Weight (kg/m3)Yield (kg/ha)
Seri8.9419.2a 146.234.2a1.7775.63197a
S298.3116.1b36.332.1b1.4175.62752bc
S29-Purple(PF)8.3315.4b31.834.0a1.3074.93010ab
S29-Red(PF)8.9216.2b35.332.7b1.4074.42801bc
S29-Purple(P)8.1416.1b36.431.7b1.3774.02769bc
S29-Red(P)8.5016.0b36.230.2c1.3575.12518c
1 values followed by the same letter are not significantly different at p < 0.05.
Table 5. Average grain quality traits in purple grain isogenic lines across sites in 2017.
GenotypeLabAnthocyan in (mM/g)Fe (mg/kg)Protein Content, (%)SDS Sedimen-Tation (mL)Alveograph W
Seri86.6a 11.00d11.5c112b38.3a13.2ab12.3b188c
S2984.8b1.22c11.8b125b33.7bc12.9b21.9a506b
S29-Purple(PF)80.5c1.56b9.2e151a35.5b13.6a22.3a565ab
S29-Red(PF)84.6b1.17c12.0a132b33.8bc13.3b22.0a543ab
S29-Purple(P)80.5c1.78a9.4d140ab33.1c13.0b22.6a579a
S29-Red(P)84.9b1.18c12.1a124b33.5bc13.3b22.1a550ab
1 values followed by the same letter are not significantly different at p < 0.05.
Table 6. Quality parameters in purple grain isogenic lines in Konya, Turkey, 2018.
TraitProductSeriS29-Purple (PF)S29-Red (PF)S29-Purple (P)S29-Red (P)
Test weight, kg/m3Grain79.7a 178.0b77.5b77.5b78.1b
1000-kernel weight, gGrain35.6a31.9b32.0b29.9b29.7b
Protein content, %Flour11.1b13.2a12.3a12.7a12.4a
WWF 213.5b15.6a15.2a15.5a15.4a
Zeleny sediment., mLFlour30.0b54.2a53.5a59.5a57.0a
Color: brightness (L)Grain56.1a41.9c50.9b44.5c51.0b
WWF82.8a75.1c79.0b75.3c78.9b
B. Crust46.2a35.8b43.0a37.6b42.3a
B. Crumb56.5a38.9c46.7b41.0c46.9b
Color: redness (a)Grain8.998.198.818.588.71
WWF3.12b3.74a3.89a4.04a3.98a
B. Crust8.08a6.49b7.72a7.04ab7.60a
B. Crumb4.70c5.04b5.35a5.22ab5.44a
Color: yellowness (b)Grain27.9a17.2e24.1b19.2d23.2c
WWF16.213.715.014.117.2
B. Crust15.2a10.6c13.8b11.4c13.5b
B. Crumb16.9a10.2c13.4b10.9c13.8b
Total dietary fiber, %WWF14.8c16.1b16.5ab16.8a16.9a
Bread15.4c16.4b16.9b18.2a18.3a
Total phenolic content, mg GAE/kgWWF1104a908bc819c931b854bc
Bread1077a909b838c896b867bc
Antioxidant activity, µmol TE/gWWF2.202.562.082.652.34
Bread3.803.753.613.763.57
Development time, minFlour2.72c3.33b3.43ab3.51ab3.83a
BEM (Max. Torque)WWF36.0b60.7a54.2a63.0a63.0a
Flour39.5d44.0b42.7c46.5a44.7b
Volume, mLBread296311283312302
Specific volumeBread2.142.242.062.222.13
SpringinessBread0.880.920.900.900.87
CohesivenessBread0.61b0.66a0.65a0.68a0.66a
1 values followed by the same letter are not significantly different at p < 0.05; 2 WWF, whole wheat flour.

