Article

Effects of Cowpea-Amaranth Intercropping and Fertiliser Application on Soil Phosphatase Activities, Available Soil Phosphorus, and Crop Growth Response

1
Agricultural Research Council-Vegetable and Ornamental Plants, Private Bag X293, Pretoria 0001, South Africa
2
Crop Science, School of Agricultural, Earth and Environmental Sciences, College of Agriculture, Engineering and Science, University of KwaZulu-Natal, Private Bag X01, Scottsville 3209, Pietermaritzburg, South Africa
*
Author to whom correspondence should be addressed.
Agronomy 2020, 10(1), 79; https://doi.org/10.3390/agronomy10010079
Submission received: 4 November 2019 / Revised: 17 December 2019 / Accepted: 24 December 2019 / Published: 6 January 2020

Abstract

:
Low available soil phosphorus (P) is associated with its immobility, which renders it unavailable for plant uptake. In addition, farmers normally apply inorganic fertilisers to legumes to activate soil-bound phosphorus using root exudates. Sufficient soil mineral nutrition is key to sustainable crop production, and hence food and nutritional security. The aim of this study was to quantify the acid and alkaline phosphatase activity as an indicator of P supply and availability under varying levels of nitrogen, phosphorus and potassium (NPK) fertilization and different cropping systems. An intercropping (cowpea and amaranth) and fertiliser (control, 25%, 50%, and 100% of the recommended NPK levels) field trial was laid out in a 2 × 4 factorial treatment structure in a completely randomized design (CRD) with four replications. There was higher acid and alkaline phosphatase activity in the rhizosphere of cowpea and amaranth grown as sole crops compared to those from intercropping. The cowpea and amaranth plants grown without fertiliser or 25% NPK had the highest rhizospheric phosphatase activity, while 100% NPK application exhibited the least. The markedly higher phosphatase activity from the low fertiliser application treatments indicates the possible stimulation of microbial activity to supplement P demands for the crops. The study revealed that the application of lower rates inorganic fertilisers in a legume intercrop stimulates the activity of the phosphatase enzymes, which can subsequently liberate soil-bound phosphorus. Plant tissue phosphorus concentration of cowpea and amaranth plants increased proportionately to the increase in fertiliser application up to 50% of the recommended NPK level. The land equivalent ratio (LER) was greater than 1, indicating that it is more beneficial to intercrop cowpea and amaranth as opposed to growing them as sole crops. Overall, the application of NPK fertilizer to amounts of up to 50%, based on the results of this study, appear to be better than 100% in terms of biomass accumulation and phosphate activity.

1. Introduction

Access to nutritious food to meet dietary requirements remains a challenge in most rural African households [1]. The intake or consumption of indigenous vegetables may offer a low-cost option to mitigate micronutrient deficiencies and contribute to food and nutritional security, especially amongst rural poor communities. Many of these vegetables are rich in vitamins, micronutrients, and protein [2]. To ensure sustainable food and nutritional security, interventions are needed to capture and utilize nutrients [3]. Fertilisers are key inputs in the production of sufficient vegetable supplies to the African population. However, production efforts are compromised by acidic [4] and nutrient-poor soils, such as low phosphorus (P) levels [5].
Studies have shown that P is low in South African soils [6]. The challenges of low P are associated with its limited mobility in the soil, due to high adsorption, and hence its unavailability [7] and fixation [8], thus contributing to its deficiency. Various mechanisms exist to supplement P in the soil and can be implemented to mitigate P deficiency and/or stress [9]. Phosphorus can either be applied through organic (cattle manures, etc.) or inorganic sources (fertilizers). These sources could potentially contribute to improved P supply in a non-legume crop through species interaction and P-acquisition [10], in an intercropping system [11]. Vigna unguiculata L. Walp (Cowpea), through its leaves and seeds, is an important legume crop nutritionally as it provides proteins and minerals that can be easily harnessed by resource-poor rural communities [12]. It is therefore important to embark on studies that will further enhance our understanding of P nutrition in relation to yield, quality and different environments where cowpea is grown [13] in an effort to ensure food and nutritional security for resource-constrained communities.
With respect to P solubilisation, the key enzymes involved are acid and alkaline phosphatase [14]. Acid phosphatases are of plant origin [15], whilst bacteria, fungi, and earthworms secrete alkaline phosphatase enzymes [16]. Both enzymes, in association, facilitate the liberation of organic phosphate esters in both acid and alkaline conditions in phosphorus-deficient soils [17]. These mechanisms ensure the release of P for legumes and/or other plants to utilize [18]. Even though the acid and alkaline phosphatase enzymes are perfectly functional, in natural ecosystems [19], research evidence also suggests that they are responsive in fertilized soils and cropping systems such as intercropping [20].
Several studies have reported the acid and alkaline phosphatase activity in legumes [21,22,23,24]. However, few studies have reported the performance of these in relation to intercropping and inorganic fertilization [25,26]. It was therefore hypothesized that phosphatase activity, phosphorus (soil and plant), as well as and crop yield will be affected by fertilizer application and intercropping. The objective of this study, therefore, was to quantify the acid and alkaline phosphatase activity as an indicator of P supply and availability under varying levels of NPK and intercropping of Amaranthus cruentus (amaranth) and cowpea as test crops.

2. Materials and Methods

2.1. Site Description

The trial was conducted at the Agricultural Research Council (ARC), Vegetables and Ornamental Plants campus situated in Roodeplaat, Pretoria, South Africa (25°35’ S, 28°21’ E, 1165 masl) during 2014/15 and 2015/16 summer seasons from November to January. Soils in which the experiments were carried out are classified as Hutton clay loam (25–32% clay percentage) with red pedal, composing P, potassium (K), sodium (Na), calcium (Ca), magnesium (Mg), nitrate-nitrogen NO3-N and ammonium-nitrogen (NH4-N) in low to moderate fertility status and a pH (H2O) range of 6.17 to 7.26 as indicated in the South African soil taxonomic classification (Table 1). The area has a long-term summer rainfall of approximately 635 mm annually. The highest precipitation is normally experienced during December and January, although it is highly variable. The growing summer seasons in 2014/15 and 2015/16 experienced variations in the weather conditions. On average, in the first season, maximum temperatures ranged between 27.9 °C to 30.2 °C. The second season maximum temperatures ranged from 30.8 °C to 33.9 °C. Daily minimum temperatures for the first season ranged from 13.2 °C to 16.5 °C, and for the second season were 14.2 °C and 18.1 °C (Figure 1). There was less rainfall (193 mm) in the first season compared to the second which received 274 mm (Figure 1).

2.2. Experimental Treatments, Layout and Plot Management

Fertiliser (NPK) was applied based on the recommended cowpea requirement, taking into consideration the lower fertilizer requirements of the legume. In this study, cowpea was the main crop. Recommended fertiliser rates for cowpea in 2014/15 season based on soil analysis results were 135 kg N ha−1, 31 kg P ha−1 and 18 K ha−1 and for 2015/2016 recommendations were 135 kg N ha−1, 20 kg P ha−1 and 250 kg K ha−1. The soil K was adequate for the 25% treatment in the first season and as such was not applied for that treatment level. The NPK fertiliser forms used were limestone ammonium nitrate (28%N) for N, single superphosphate (12%P) for P, and potassium chloride (50%K) for K. In each season N, P, and K, were broadcasted just before planting for cowpea and just before transplanting for amaranth. In the intercropping treatments, fertiliser was applied at the planting stage of cowpea to cover nutrition for amaranth which was transplanted after three weeks. Nitrogen application was split to 40% at planting with two top dressings of 30% applied at 40 and 60 days after planting. Due to its small seed size, the soil type (high clay percentage), and to improve on growth uniformity, amaranth seedlings were first raised in polystyrene trays. Approximately three weeks (19–21 days) after planting on 200-hole polystyrene trays, amaranth seedlings were transplanted into the field plots on 10 December 2014 in the first season and 02 December 2015 in the second season. A week after planting of the amaranth in trays, cowpea seeds were planted directly in the field at a rate of 2 seeds per station at a depth of approximately 10 mm. Prior to direct planting and/or transplanting, irrigation was done to minimize the transplanting shock and to ensure uniform crop establishment.
The trial was laid out in a 2 × 4 factorial treatment structure in a completely randomized design (CRD) with four replications. The field trial comprised of cropping system (2 sole crops and an intercrop) and fertiliser (control, 25%, 50% and 100% of the NPK fertiliser recommendation) as the two factors. The test crops were amaranth and cowpea. Sole cropped amaranth was spaced at 0.30 m between rows by 0.30 m between plants while cowpea plants were spaced at 0.60 m between rows and 0.30 m between plants. Intercropped amaranth plots were spaced at 0.6 m between rows and 0.60 m between plants. Intercropped plots had alternate rows of amaranth spaced at 0.60 m placed in-between cowpea rows which were 0.60 m apart. The fertiliser was applied to cowpea and amaranth based on requirements [27]. Thus, the trial had 12 treatments and 48 plots of 3 m by 3 m, amounting to 9 m2 each. In order to circumvent plot to plot cross contamination, a distance of 1.5 m was maintained between plots.
Compensating non-leaking (CNL) Urinam dripper lines, with a discharge dripper rate of 2.3 l h−1 were used for irrigation. Irrigation scheduling was based on crop water requirement (ETc) of each crop, either in a sole cropping or intercropping. For the 2014/15 season, ET0 ranged from 2.7 to 7.27 mm. In the 2015/16 season, reference evapotranspiration (ETo) ranged from 1.71 to 7.05 mm. The crop factors (Kc) used were 0.85 for cowpea and 0.9 for amaranth. The crop water requirement (ETc) was calculated based on the product of, ET0 and (Kc).

2.3. Data Collection and Statistical Analysis

2.3.1. Plant and Soil Sample Preparation

Rhizosphere soil samples were collected from the roots of cowpea and amaranth plants for determination of acid and alkaline phosphatase activity when cowpea reached its physiological maturity at 71 and 69 days after planting in the first season and second season respectively. Twelve plants were randomly sampled per treatment (three plants per plot). Soil samples were collected by carefully digging up each plant with its roots intact. The loose soil around the roots was gently shaken off and the soil adhering to the roots (hereafter referred to as rhizosphere soil) was collected into a pre-labelled plastic bag. The rhizosphere soil samples were immediately frozen and kept frozen (−20 °C) in the laboratory before being analyzed for phosphatase activity.
For biomass determination, plants were carefully dug out with intact root system, washed with distilled water, and separated into roots, and shoots for both crops. The separated plant parts were oven-dried at 60 °C for 48 h, ground into fine powder (2-mm sieve), and stored at room temperature, before analysis for tissue P concentrations.

2.3.2. Bioassay for Acid and Alkaline Phosphatase Activity in Rhizosphere Soil

The acid and alkaline phosphatase activities in the rhizosphere soil were assayed following the method of Eivazi and Tabatabai [28] as modified by Hedley et al. [29]. The p-nitrophenyl phosphate tetrahydrate method was used in the colourimetric assay for acid and alkaline phosphatase activities. One mL p-nitrophenyl phosphate tetrahydrate was dissolved in acetate buffer (pH 6.5) adjusted with 0.1 M HCl and to pH 11.0 with 0.1 M NaOH for acid and alkaline phosphatases, respectively. For each enzyme activity, 1 g of fresh rhizosphere soil in duplicates was transferred to a 50 mL Erlenmeyer flask and each treated separately with 0.2 mL of toluene and 4 mL of modified universal buffer (MUB) at pH 6.5 or 11 for acid or alkaline phosphatases respectively. For each soil sample, controls were included where p-nitrophenyl phosphate tetrahydrate was added after halting the reaction by adding 1 mL of 0.5 M NaOH and 4 mL of 0.5 M CaCl2 immediately before filtration. Samples were mixed thoroughly and incubated at 37 °C for 1 h. Following incubation, the enzyme activity was halted by adding 1 mL of 0.5 M NaOH and 4 mL of 0.5 M CaCl2. The contents were mixed and filtered through Whatman No. 2 filter paper. The supernatant was transferred to pill vials and the absorbance of the supernatant read at 420 nm using a UV-visible spectrophotometer (Pharmacia LKB, Ultrospec II E). In order to account for non-enzymatic substrate hydrolysis, soils sampled outside the rhizosphere of roots were used to obtain values for control, where these were subtracted from sample replicates. The control samples were prepared the same way as in the rhizosphere soils. After correction for soil moisture content, the enzyme activity was expressed on soil dry weight basis as mg p-nitrophenol. g−1 soil dry weight h−1. One unit of acid phosphatase activity was defined as the activity per gram of soil which produced 1 mmol p-nitrophenol h−1.

2.3.3. Determination of Soil-P in the Rhizosphere Soils

Phosphorus was determined using the Bray 1 method as developed by Dyer [30] and modified by Division of Chemical Services [31] and Du Plessis and Burger [32]. This was done by measuring and recording soil weight, which was further mixed for not more than 60 s to get extractable P. These inorganic minerals in the extract were measured by colometric analysis through conversion of phosphates to orthophosphate by hydrolysis with sulphuric acid at 90 °C. Phosphate concentration is measured by reducing phosphomolybdic acid using a 1-amino-2-naphthol-4-sulfonic acid to yield an intense blue colour sufficient for detection at 660 nm. A 6.67 g mass of soil was placed in an extraction bottle with a volume of 50 mL Bray solution at 20 °C. This was closed using a stopper and shaken for 60 s. Thereafter, two drops of flocculant were added followed by filtering using a Whatman no 2 filter paper into an empty bottle. Analysis was done using the MS spectrometry (IRIS/AP HR DUO Thermo Electron Corporation, Franklin, MA, USA).

2.3.4. Measurement of P Concentration in Plant Tissues

Phosphorus concertation in plant tissues were determined by ashing 1 g ground sample in a porcelain crucible at 500 °C overnight. This was followed by dissolving the ash in 5 mL of 6 M HCl and placing it in an oven at 50 °C for 30 min, before adding 35 mL deionised water. The mixture was then filtered through Whatman No. 1 filter paper, and the concentration of P in plant extracts determined using the Inductively Coupled Plasma (ICP) [33].

2.3.5. Yield

Crops were harvested 71 and 69 days after cowpea seeding corresponding to 49 and 50 days after transplanting in case of amaranth during first and second growing season, respectively. Cowpea was harvested at physiological maturity. Twelve plants were sampled per plot on sole cropping on amaranth amounting to an area of 1.08 m2 on sole cropping. In cowpea nine plants were harvested per plot amounting to a harvested area of 1.62 m2. on both sole cropping and intercropping. From cowpea, the root nodules were detached, and counted. The aboveground material was weighed to determined fresh biomass, and thereafter oven-dried to determine shoot dry weight. Grain yield was determined by removing the dry pods from plants and air-drying them. The seeds were removed from the dry pods (12% moisture content determined using a moisture meter) and their mass recorded to obtain grain yield.

2.3.6. Land Equivalent Ratio (LER)

Land equivalent ratio (LER) was determined using the formula as shown below;
LER = IA/SA + IC/SC
where LER is the land equivalent ratio; IA is amaranth above ground biomass in intercropping; Ic is cowpea above-ground biomass in inter-cropping; SA is amaranth above ground biomass as sole crop; SC is cowpea above ground biomass as sole crop.

2.3.7. Statistical Analysis

A two-way ANOVA involving fertilizer levels and cropping systems between cowpea and amaranth to analyse above ground dry biomass, plant and soil phosphorus concentration, rhizosphere acid, and alkaline phosphatase activities was performed. Data analysis was performed using GENSTAT version 18. Where treatment means were significant, Duncan multiple range test (DMRT) was used to separate them at p ≤ 0.05.

3. Results

3.1. Phosphatase Activity in the Rhizosphere of Cowpea and Amaranth

There was generally a significant characteristic increase in acid and alkaline phosphatase activity of the rhizosphere of cowpea and amaranth in sole cropping at control NPK fertiliser level before dropping down again at 100% fertiliser level in both seasons (Table 2 and Figure 2 and Figure 3). In all cases, the lowest enzymatic activity was recorded in an intercropping system with 100% fertilization level. The rhizosphere phosphatase (acid and alkaline) enzymatic activity significantly decreased inversely proportional to the increase in fertiliser (NPK) application level from the highest in the control to the lowest in 100% NPK in the rhizosphere of both amaranth and cowpea sole cropping in both seasons (Table 2). In rhizosphere of cowpea, acid phosphatase decreased from 1394 µg p-nitrophenol g−1 DWt. soil h−1 (control) to 978 µg p-nitrophenol g−1 DWt. soil h−1 (100% NPK) in the first season and from 1246 µg p-nitrophenol g−1 DWt. soil h−1 (control) to 998 µg p-nitrophenol g−1 DWt. soil h−1 (100% NPK) in the second season (Figure 2).
A similar trend to that observed in sole cropping was recorded for the enzymatic activity (acid and alkaline) in the rhizosphere of amaranth intercrop where the activity increased with the decrease in fertiliser application from 100% to 0% in both seasons (Table 2). Similarly, the alkaline phosphatase activity in the rhizosphere of cowpea intercrop in season one followed a similar trend of increasing activity with decrease in levels of fertiliser applied. The acid phosphatase activity in the rhizosphere of cowpea intercropping (both seasons) and alkaline phosphatase activity (season two) however, increased only up to an optimum 25% level of fertiliser application, beyond which there was a drop at 100% fertiliser level. Comparatively, in both seasons and across all fertiliser levels, the phosphatase (acid and alkaline) activity was consistently higher in the rhizosphere of sole cropping than intercropping in rhizosphere of both crops (Figure 2 and Figure 3).

3.2. Soil P Concentration in Cowpea and Amaranth

There were significant increases in soil P concentration on amaranth with the increase in NPK fertiliser application from the control (0%) to 100% fertiliser level in both seasons (Table 3 and Figure 4C,D). A similar pattern to that of cowpea was obtained on amaranth in the first season. However, soil P concentration on cowpea in the second season of cowpea increased from control (0%) until 50% NPK fertiliser level, beyond which there was a decline at 100% NPK (Table 3 and Figure 4C,D). In all the fertiliser levels, soil P concentration was lower in the intercropping system than with the sole cropping on both cowpea and amaranth (Table 3 and Figure 4C,D and Figure 5C,D).

3.3. Plant P Concentration in Cowpea and Amaranth

There was generally a significant characteristic decrease in plant P concentration in cowpea proportional to the increase in fertiliser application levels in season 1 (sole cropping) and season 2 (intercropping) (Table 4). Plant P concentration in cowpea was also observed to be similar in the second season on sole cropping with the first season of intercropping except for increases up to 25% fertiliser application and decrease in the control treatment (0%). Conversely there was generally a significant characteristic increase in plant P concentration amaranth (in both sole and intercrop) with the increase in fertiliser application from control (0%) to 100% NPK in both seasons (Table 4 and Figure 4A,B). A comparison between the two cropping systems at each fertiliser level in amaranth, indicated plant P to be consistently higher (though not significantly in some cases) in sole cropping than in intercropping in both seasons (Figure 4A,B). Sole cropping in cowpea like in amaranth had consistently higher plant P than in an intercrop (Figure 5A,B).

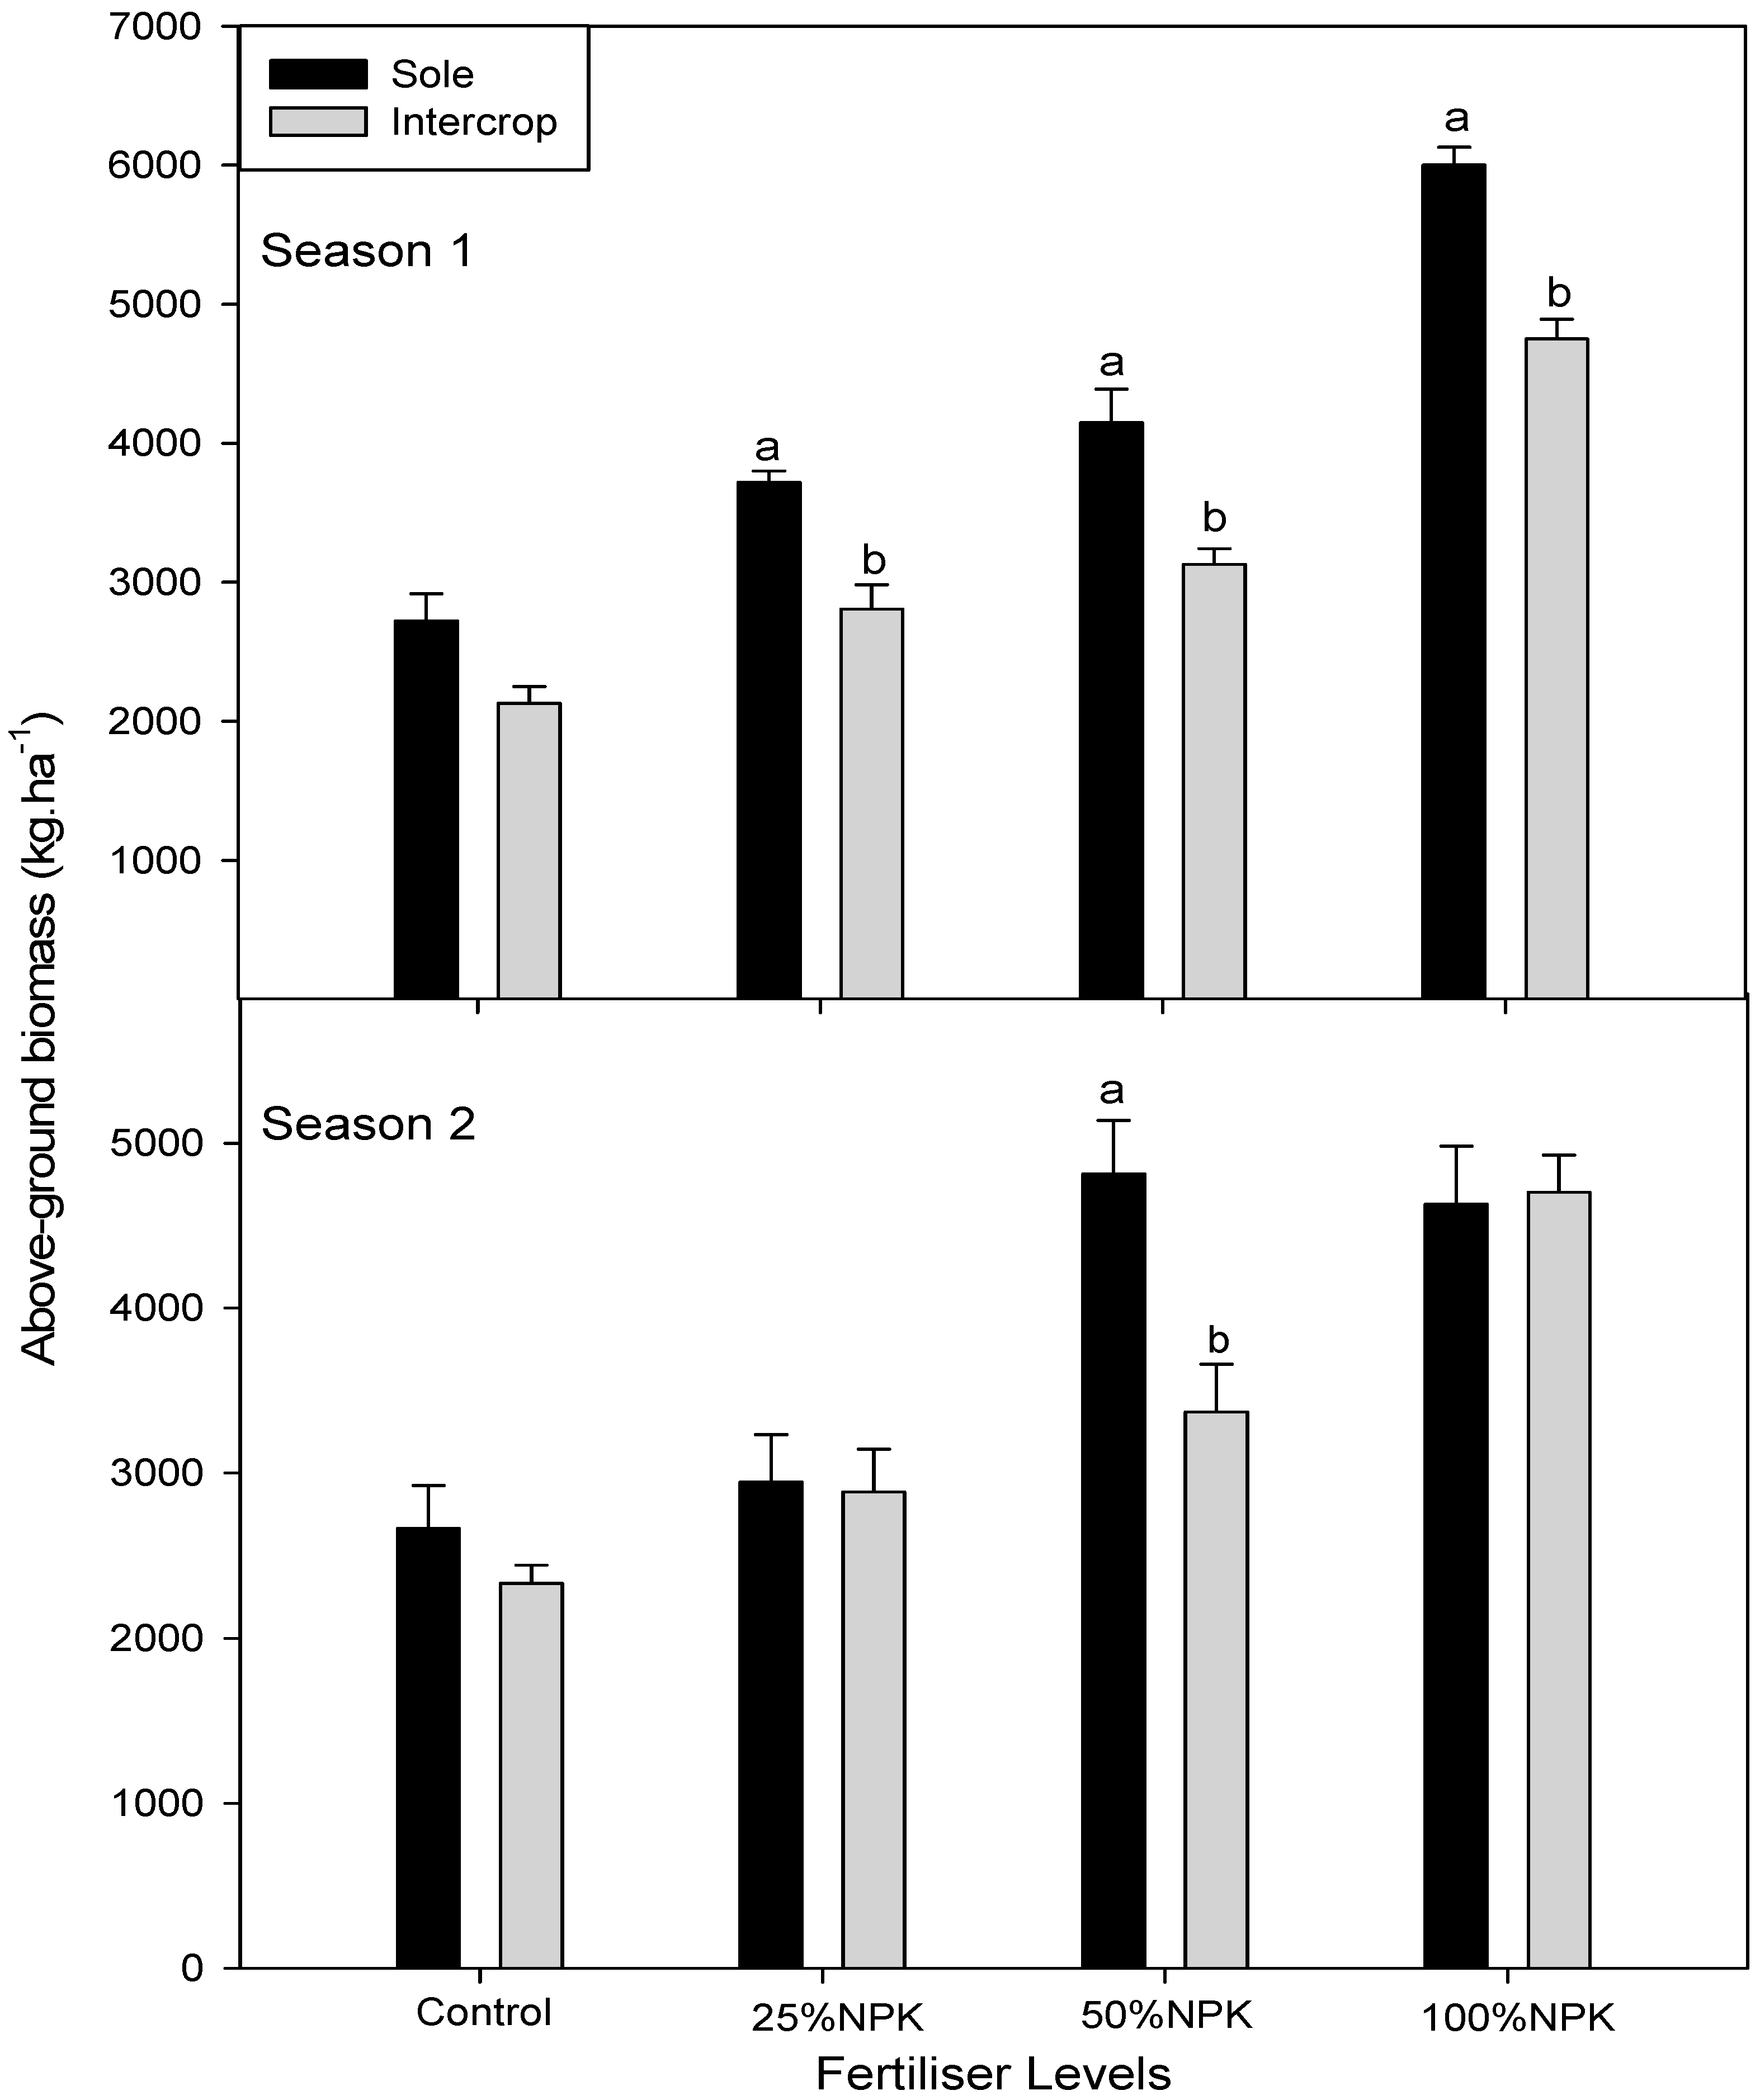
3.4. Above Ground, above Ground Edible on Dry Weight in Cowpea and Amaranth

There was a general characteristic increase in the above ground and above ground edible biomass of cowpea in sole cropping as fertilization increased from control up to 50% NPK fertiliser level before dropping slightly at 100% fertiliser level in both seasons (Table 5). The lowest above ground and above ground edible biomass in cowpea sole cropping (2731 kg ha−1) for first season and for second season (2922 kg ha−1), were observed in the control and 100% NPK fertilization levels respectively. Sole cropping in combination with 50% NPK fertilization gave the highest above ground and above ground edible dry biomass in cowpea, in both seasons. On the other hand, intercropping showed an increase in above ground and above ground edible dry mass from the control, but only up to 25% NPK, which was the highest (4009 kg ha−1) in the first season before declining from 50% NPK to the lowest (1485 kg ha−1) at 100% NPK fertilization. In the second season, although 100% NPK fertilization remained the lowest above ground and above ground edible accumulation in intercropping, 50% NPK recorded the highest (4354 kg ha−1) above ground and above ground edible. A comparison between cropping systems with regard to above ground and above ground edible dry matter revealed that at all fertiliser levels, shoot dry biomass was higher in sole cropping compared to intercropping in both seasons, with significant differences being recorded in some fertiliser level treatments (Figure 6).
There was a marked increase in grain yield of cowpea in sole cropping as fertilization increased from control (0%) up to 50% NPK and 25% fertiliser levels for first and second season respectively (Table 5). The lowest grain yield in cowpea was obtained 100%NPK in both seasons (Table 5). Sole and inter-cropping in combination with 50% fertilization gave the highest grain yield in the first year (Table 5).
In amaranth, above ground and above ground edible biomass increased significantly proportional to the increase in fertiliser levels from the control (0%), right up to the 100% NP fertilization in the first season of both sole and intercropping systems (Table 5 and Figure 7). A similar trend to that of the first season was also observed in the second season with the exception of sole cropping where a slight decrease in above ground and above ground edible biomass (though not significant) was recorded at 100% NPK from that of 50% NPK fertilization. Similar to the trend observed in the cowpea, a comparison between the two cropping systems showed that above ground and above ground edible biomass accumulation was consistently higher in sole cropping compared to intercropping across all fertiliser levels in both seasons (Figure 7). These differences were significant in all fertiliser levels, except the control in the first season. However, in the second season only 50% NPK fertilization had sole cropping yielding significantly higher above ground and above ground edible biomass than that of intercropping (Figure 7).
The results of this study showed LER values greater than one (LER > 1) (Table 5), indicating intercropping of cowpea and amaranth to be more beneficial than sole cropping of each. There was an indication of proportionately high land equivalent ratios ranging from 1.08 to 1.81 for the different fertiliser levels for the first year as well as ratios ranging from 1.59 to 1.8 for the second year. The LERs of more than one (>1), could be interpreted to mean that the land area planted for cowpea and amaranth as a sole cropping would need more land (8–81% for first season), for it to yield match the equivalent land area if the same crops were planted in an intercropping.

4. Discussion

The higher enzymatic phosphatase activity in the rhizosphere of cowpea grown as a sole crop (Table 2 and Figure 2 and Figure 3) could be attributed to the greater demand for phosphorus from soil (Table 3), by cowpea for its growth and symbiotic functioning [34]. These enzymes (acid and alkaline phosphatases) are housed in the roots of plants and soil microbes [35]. Acid phosphatase enzymes are located in root exudates and in some instances in the rhizospheric soil of plants roots [36]. On the other hand, alkaline phosphatases are formed mainly by soil microorganisms [37]. Collectively these enzymes are key in the harnessing of P from the soil as well as its accessibility in soils [36]. In combination, acid and alkaline phosphatases enzymes play an important role in the organic phosphate mineralisation as well as, release of inorganic P by dephosphorylation of organic P into soils.
Even though theory would support the assumption that intercropping would result in more activity due to the interaction of roots, the proximity between companion crops could have resulted to less activity based on the results obtained in this study. An increase in the phosphatase activity on sole cropping indicated the high soil phosphorus in the rhizosphere of the cowpea crop (Table 2), which could be required for the cellular biosynthesis of adenosine triphosphate, necessary for the reduction of N2 to NH3 by the nitrogenase in the cowpea root nodules [38].
The results also indicated that amaranth as a non-legume crop has more enzymatic activity on sole cropping as opposed to intercropping. The ability of a non-legume crop such as amaranth to have phosphatase activity in sole cropping is an indication of the diversity of enzymatic activity across variable crops [39]. Soil phosphatase activity of the non-legumes are affected by crop production practices, which could be either sole or intercropping [40]. Despite such notable phosphatase activity, previous indications have shown the ability of non-legumes such as Leucadendron strictum, Tetraria bromoides, and Zea mays subsp. mays to have rhizosphere phosphatase activity lower than those of legumes [41]. A similar trend was also observed in the results of this study, in which there was a lower acid phosphatase activity in amaranth relative to cowpea (Table 2; Figure 3). In other studies, for example, elevations in arbuscular mycorrhizal fungi spores in a non-legume crops such as maize [42], cluster roots in L. strictum [43] and higher organic matter [44] prompted the phosphatase activity. In the case of this study, for amaranth to be able to have enzymatic activity, root hairs may have played a key role. Part of the mechanisms contributing to lower phosphatase activity in non-legume crops could be linked to their low phosphorus demand as exhibited by the low shoot P concentration since these crops do not fix atmospheric nitrogen [45]. Some studies have also shown the comparable capability of non-legumes to secrete acid phosphatase [46] although their levels are lower than those of legumes such as chickpea and cowpea [23]. This could be particularly attributed in part to the phosphorus requirements for symbiotic nitrogen fixation relative to non-legumes that lacks this metabolic function [47]. The high phosphatase activity in the legume roots and soils results in a substantial increase in plant available P [23]. The secretion of phosphatases is an indicator of soil quality, since their activity mirrors the soil P characteristics (Table 1). Phosphatases are affected by crop management practices and therefore are an indicator of soil quality [47]. In this case, the higher enzymatic activity at sole cropping of cowpea could be an indication of P crop demand under this cropping system, with the possibility of benefiting a non-legume crop in an intercropping system. If phosphatase enzyme activity could be higher in intercropping relative to sole cropping [48], the roots of the legumes would spread to accommodate the non-legume, in a complementary relationship [49]. It could be established that different crops on variable cropping systems differ in their phosphatase activity. Intercropping is able to benefit the non-legume through a leguminous crop over its high phosphatase activity and thus liberation of P [50]. Combining legumes with non-legumes crops in and intercrop can, therefore, exploit of the activity of phosphatase enzymes in liberating P for crop utilisation. Enzymatic activity, such as alkaline phosphatase, is lowered in soils cultivated with non-legumes such as corn and wheat [51].
The markedly higher phosphatase activity from the control plants (without supplementary fertiliser application) of the tested crops in this study (Table 2; Figure 2 and Figure 3), was evidence that the application of NPK fertilizer increased the soil available P, thus reducing the phosphatase activity (Table 3 and Figure 4A,B and Figure 5A,B). This is because low P content in the soil and/or the plant triggers the mechanisms that increase P solubility in the soil, or its remobilization within tissues [52]. Just as in the control, when NPK fertiliser applied was low (25%NPK), there could have been stimulation of microbial activity, which resulted in a favourable environment for enzymatic synthesis and accumulation of P [53]. The decrease in enzyme activity with the increase in fertiliser levels in this study corroborate with this logic. For example, alkaline phosphate decreased with increased fertilization on both cowpea and amaranth. Studies have also shown that acid phosphatase is sensitive to increasing NPK fertilization in legumes and non-legumes, hence the least acid and alkaline rhizospheric phosphatase activity in the recommended rate of 100% NPK (Table 2) in both crops in this study. Therefore, phosphatase activity could be used as a good indicator of soil quality with regard to P.
In this study, shoot P concentration was higher in crops planted in sole cropping when compared to the intercrop. Some studies have shown that legumes and non-legumes planted as sole crops exhibit comparably high shoot P concentration, relative to the intercropped counterparts when similarly fertilized [54]. These higher concentrations of P on sole cropping are in line with the theory that legumes (e.g., chickpea) and non-legumes (e.g., durum wheat) demonstrate higher affinity mechanisms of P acquisition on sole stands relative to intercrops.
There was an increase in shoot P with the increase in fertiliser application up to 50% NPK in both cropping systems. Increased shoot P at NPK fertiliser concentration levels below the 100% NPK can be attributed to the fact that higher amounts have been found to negatively affect soil P, which in turn affects shoot mineral composition [55]. Just as shoot P concentrations increased with fertilization (Table 4), yield correspondingly increased in non-legumes, for example in amaranth, proportional to plant biomass [56]. The uptake of P by plants contributes to crop growth and increased yield on both cowpea and amaranth.
The lower individual above ground and above ground edible biomass in an intercropping system of both crops, i.e., cowpea and amaranth, could be attributed to competition for resources between the two crops [44]. On the other hand, the higher yields in sole cropping were as a result of high plant density (only in amaranth) as well as absence of competition for resources such as light, nutrients, water and solar radiation [57]. The results of this study show similar patterns to those obtained in other studies on the yields of cowpea and maize where low yields were recorded in intercropping due to low plant densities of individual crops than those in sole cropping [58]. Moisture also played a key role in plant growth as shown by increased biomass in the second season corresponding to more rainfall amounts as opposed to lower amounts on the first season (Figure 1).
In order to determine land utilisation efficiency, this study also looked into the land equivalent ratio (LER), defined as the comparative land space necessary in sole cropping to match production of similar yield in an intercropping system [59]. It is the sum of the fractions of the intercropped yields divided by the sole-crop yields. If the LER is 1, the same acreage would be sufficient to get a specified yield of each of the individual crops irrespective of whether they are grown as sole or intercrops. LER values greater than 1 (>1) indicate that more land area would be required to produce the same yield in each crop in a sole cropping as in intercropping [59]. The results of this study showed LER values greater than one (LER > 1) (Table 5), indicating intercropping of cowpea and amaranth to be more beneficial than sole cropping of each. These results corroborated with those from other authors such as [59] on corn-bean intercropping.
The LER of more than one (Table 5), shows that, sole cropping may need more land area to be cultivated to get the similar yield as that of intercropping. These results represent the role of fertilisers to increasing yield therefore, LER and merits of intercropping when compared to sole cropping in terms of the utilisation of resources for improved plant growth and efficient land utilization. In this context, there were higher LER values, irrespective of the fertiliser level applied as well as the improvement in intercropping relative to sole cropping [60].

5. Conclusions

In conclusion, in an intercropping system, interactions between companion crops improved their survival and growth, [61]. This was confirmed by a higher LER indicating the merits of intercropping, which might have contributed to improved nutrition and enzyme activity [53]. Intercropping thus enhances soil fertility, which could lead to increased yields [62]. In more detail, phosphatase activity provided inorganic P through enzymatic activity in both cowpea and amaranth, mainly in limited NPK fertilization levels of up to 25%. However, higher fertiliser application levels tend to reduce the phosphatase enzyme activity. There was more shoot phosphorus concentration on sole crops compared to intercrops up to 50% NPK. Moderate fertiliser application enhances legume ability to harness phosphorus key mineral nutrient for biomass production. Overall, the application of NPK fertilizer to amounts of up to 50%, based on the results of this study, appear to be better than 100% in terms of biomass accumulation and phosphate activity. Farmers can thus benefit from applying less than the recommended doses of fertilization in combination with intercropping and thus economically contributing to cost saving measures for resource-constrained smallholder farming communities.

Author Contributions

B.M., A.M. and M.F., conceptualized the research project while B.M., executed the experiments and data collection. B.M. and B.N. analyzed the data and wrote the original draft manuscript. B.N., M.F., S.A., C.D.P., T.M., A.M. and S.V. reviewed and edited the manuscript. S.V. assisted with sourcing of funds for the project. T.M. and A.M. did critical review, redrafting and supervised the student’s research project. All the authors read and approved the final draft of the manuscript. All authors have read and agreed to the published version of the manuscript.

Funding

The study received funding from the Agricultural Research Council under Pipeline Technology Research, which was supported by the Department of Rural Development and Land Reform.

Acknowledgments

We are grateful to the assistance of J. Habig and Agricultural Research Council-Soil Climate and Water for the analyses of the soil and plant samples. We are further grateful to M. Nyathi for access to most of the journal articles.

Conflicts of Interest

The authors declare no conflict of interest. Author declare that there are no personal circumstances or interest that may be perceived as inappropriately influencing the representation or interpretation of reported research results. The funders had no role in the design of the study; in the collection, analyses, or interpretation of data; in the writing of the manuscript, or in the decision to publish the results.

References

  1. Tumushabe, J.T. Climate Change, Food Security and Sustainable Development in Africa. In The Palgrave Handbook of African Politics, Governance and Development; Palgrave Macmillan: New York, NY, USA, 2018; pp. 853–868. [Google Scholar]
  2. Ochieng, J.; Afari-Sefa, V.; Karanja, D.; Kessy, R.; Rajendran, S.; Samali, S. How promoting consumption of traditional African vegetables affects household nutrition security in Tanzania. Renew. Agric. Food Syst. 2018, 33, 105–115. [Google Scholar] [CrossRef]
  3. Masso, C.; Nziguheba, G.; Mutegi, J.; Galy-Lacaux, C.; Wendt, J.; Butterbach-Bahl, K.; Wairegi, L.; Datta, A. Soil Fertility Management in Sub-Saharan Africa. In Sustainable Agriculture Reviews; Springer: Berlin/Heidelberg, Germany, 2017; pp. 205–231. [Google Scholar]
  4. Materechera, S.A. Soil properties and subsoil constraints of urban and peri-urban agriculture within Mahikeng city in the North West Province (South Africa). J. Soils Sediments. 2018, 18, 494–505. [Google Scholar] [CrossRef] [Green Version]
  5. Power, S.C.; Cramer, M.D.; Verboom, G.A.; Chimphango, S.B. Does phosphate acquisition constrain legume persistence in the fynbos of the Cape Floristic Region? Plant Soil. 2010, 334, 33–46. [Google Scholar] [CrossRef]
  6. Nongqwenga, N.; Modi, A.T. Phosphorus and Potassium Quantity/Intensity Properties of Selected South African Soils (Kwa-Zulu-Natal) and Their Correlation with Selected Soil Parameters. Appl. Ecol. Environ. Res. 2017, 15, 1–14. [Google Scholar] [CrossRef]
  7. Nziguheba, G.; Zingore, S.; Kihara, J.; Merckx, R.; Njoroge, S.; Otinga, A.; Vanlauwe, B. Phosphorus in smallholder farming systems of sub-Saharan Africa: Implications for agricultural intensification. Nutr. Cycl. Agroecosyst. 2016, 104, 321–340. [Google Scholar] [CrossRef]
  8. Malepfane, N.M.; Muchaonyerwa, P. Pre-incubation in soil improves the nitrogen fertiliser value of hair waste. Environ. Monit. Assess. 2018, 190, 94. [Google Scholar] [CrossRef]
  9. Bulmer, D.; Kar, G.; Hamilton, J.; Siciliano, S.; Peak, D. Extent and mechanism of interaction between phosphate and citrate in a calcareous soil. Soil Sci. Soc. Am. J. 2018, 82, 315–322. [Google Scholar] [CrossRef] [Green Version]
  10. Bargaz, A.; Noyce, G.L.; Fulthorpe, R.; Carlsson, G.; Furze, J.R.; Jensen, E.S.; Isaac, M.E. Species interactions enhance root allocation, microbial diversity and P acquisition in intercropped wheat and soybean under P deficiency. Appl. Soil Ecol. 2017, 120, 179–188. [Google Scholar] [CrossRef]
  11. Adigbo, S.O. Performance of cowpea intercropped with amaranth in an inland valley of a derived savanna. Agric. Trop. Subtrop. 2009, 42, 59–64. [Google Scholar]
  12. Aworh, O.C. From lesser-known to super vegetables: The growing profile of African traditional leafy vegetables in promoting food security and wellness. J. Sci. Food Agric. 2018, 98, 3609–3613. [Google Scholar] [CrossRef]
  13. Singh, R.; Singh, A.P. Effect of phosphorus, sulphur and biofertilisers on yield, quality of uptake of nutrients in cowpea (Vigna unguiculata). Ann. Plant Soil Res. 2017, 19, 175–179. [Google Scholar]
  14. Margalef, O.; Sardans, J.; Fernández-Martínez, M.; Molowny-Horas, R.; Janssens, I.A.; Ciais, P.; Peñuelas, J. Global patterns of phosphatase activity in natural soils. Sci. Rep. 2017, 7, 1337. [Google Scholar] [CrossRef] [PubMed] [Green Version]
  15. Luciano, C.S.; Newell, S.J. Effects of prey, pitcher age, and microbes on acid phosphatase activity in fluid from pitchers of Sarracenia purpurea (Sarraceniaceae). PLoS ONE 2017, 12, e0181252. [Google Scholar] [CrossRef] [PubMed] [Green Version]
  16. Shahzad, S.M.; Arif, M.S.; Riaz, M.; Ashraf, M.; Yasmeen, T.; Zaheer, A.; Robroek, B.J. Interaction of compost additives with phosphate solubilizing rhizobacteria improved maize production and soil biochemical properties under dryland agriculture. Soil Tillage Res. 2017, 174, 70–80. [Google Scholar] [CrossRef]
  17. Thabet, O.B.D.; Gtari, M.; Sghaier, H. Microbial diversity in phosphate rock and phosphogypsum. Waste Biomass Valoriz. 2017, 8, 2473–2483. [Google Scholar] [CrossRef]
  18. Satyaprakash, M.; Nikitha, T.; Reddi, E.U.B.; Sadhana, B.; Vani, S.S. Phosphorous and phosphate solubilising bacteria and their role in plant nutrition. Int. J. Curr. Microbiol. Appl. Sci. 2017, 6, 2133–2144. [Google Scholar]
  19. Nesme, T.; Colomb, B.; Hinsinger, P.; Watson, C.A. Soil phosphorus management in organic cropping systems: From current practices to avenues for a more efficient use of P resources. In Organic Farming, Prototype for Sustainable Agricultures; Springer: Berlin/Heidelberg, Germany, 2014; pp. 23–45. [Google Scholar]
  20. Tang, X.; Placella, S.A.; Daydé, F.; Bernard, L.; Robin, A.; Journet, E.P.; Hinsinger, P. Phosphorus availability and microbial community in the rhizosphere of intercropped cereal and legume along a P-fertiliser gradient. Plant Soil 2016, 407, 119–134. [Google Scholar] [CrossRef]
  21. Maseko, S.T.; Dakora, F.D. Accumulation of mineral elements in the rhizosphere and shoots of Cyclopia and Aspalathus species under different settings of the Cape fynbos. S. Afr. J. Bot. 2017, 110, 103–109. [Google Scholar] [CrossRef]
  22. Fraser, T.D.; Lynch, D.H.; Gaiero, J.; Khosla, K.; Dunfield, K.E. Quantification of bacterial non-specific acid (phoC) and alkaline (phoD) phosphatase genes in bulk and rhizosphere soil from organically managed soybean fields. Appl. Soil Ecol. 2017, 111, 48–56. [Google Scholar] [CrossRef]
  23. Makoi, J.H.; Chimphango, S.B.; Dakora, F.D. Elevated levels of acid and alkaline phosphatase activity in roots and rhizosphere of cowpea (Vigna unguiculata L. Walp.) genotypes grown in mixed culture and at different densities with sorghum (Sorghum bicolor L.). Crop Pasture Sci. 2010, 61, 279–286. [Google Scholar] [CrossRef]
  24. Bhavya, G.; Shaker, K.C.; Jayasree, G.; Reddy, M.M. Effect of Integrate Use of Phosphorus, PSB and Vermicompost on Acid and Alkaline Phosphatase Activity and Yield of Green Gram (Vigna radiata L.). Int. J. Curr. Microbiol. Appl. Sci. 2018, 7, 1465–1468. [Google Scholar] [CrossRef]
  25. Li, S.M.; Li, L.; Zhang, F.S.; Tang, C. Acid phosphatase role in chickpea/maize intercropping. Ann. Bot. 2004, 94, 297–303. [Google Scholar] [CrossRef] [PubMed] [Green Version]
  26. Li, X.; Mu, Y.; Cheng, Y.; Liu, X.; Nina, H. Effects of intercropping sugarcane and soybean on growth, rhizosphere soil microbes, nitrogen and phosphorus availability. Acta Physiol. Plant. 2013, 35, 1113–1119. [Google Scholar] [CrossRef]
  27. Shata, S.M.; Mahmoud, A.; Siam, S. Improving calcareous soil productivity by integrated effect of intercropping and fertilizer. Eur. J. Anaesthesiol. 2007, 3, 733–739. [Google Scholar]
  28. Eivazi, F.; Tabatabai, M.A. Phosphatases in soils. Soil Biol. Biochem. 1977, 9, 167–172. [Google Scholar] [CrossRef]
  29. Hedley, M.J.; Stewart, J.W.B.; Chauhan, B.S. Changes in inorganic and organic soil phosphorus fractions induced by cultivation practices and by laboratory incubations. Soil Sci. Soc. Am. J. 1982, 46, 970–976. [Google Scholar] [CrossRef]
  30. Dyer, B. On the analytical determination of probable available mineral plant food in soils. Trans. Chem. Soc. 1894, 65, 115–167. [Google Scholar] [CrossRef] [Green Version]
  31. Division of Chemical Services. Analytical Methods; Division of Chemical Services, Department of Agriculture: Pretoria, South Africa, 1956. [Google Scholar]
  32. Du Plessis, S.F.; Burger, R.D.T. A comparison of Chemical extraction methods for the evaluation of phosphate availability of top soils. S. Afr. J. Agric. Sci. 1964, 8, 11–13. [Google Scholar]
  33. Giron, H.C. Comparison between Dry Ashing and Wet Digestion in the Preparation of Plant Material for Atomic Absorption Analysis. 1973. Available online: https://scholar.google.com/scholar_lookup?title=Comparison%20between%20dry%20ashing%20and%20wet%20digestion%20in%20the%20preparation%20of%20plant%20material%20for%20atomic%20absorption&author=HC.%20Giron&journal=Atomic%20Absorption%20Newsletter&volume=12&pages=28-29&publication_year=1973 (accessed on 4 November 2019).
  34. Mitran, T.; Meena, R.S.; Lal, R.; Layek, J.; Kumar, S.; Datta, R. Role of Soil Phosphorus on Legume Production. In Legumes for Soil Health and Sustainable Management; Springer: Singapore, 2018; pp. 487–510. [Google Scholar]
  35. Dakora, F.D.; Phillips, D.A. Root exudates as mediators as mineral acquisition in low-nutrient environments. Plant Soil. 2002, 245, 35–47. [Google Scholar] [CrossRef]
  36. Duff, S.M.; Sarath, G.; Plaxton, W.C. The role of acid phosphatase in plant phosphorus metabolism. Phys. Plant 1994, 90, 791–800. [Google Scholar] [CrossRef]
  37. Tabatabai, M.A. Soil enzymes. In Methods of Soil Analysis. Part 2—Microbiological and Biochemical Properties; SSSA Book Series; Soil Science Society of America: Madison, WI, USA, 1994; pp. 775–859. [Google Scholar]
  38. Ndungu, S.M.; Messmer, M.M.; Ziegler, D.; Thuita, M.; Vanlauwe, B.; Frossard, E.; Thonar, C. Evaluation of MALDI-TOF mass spectrometry for the competitiveness analysis of selected indigenous cowpea (Vigna unguiculata L. Walp.) Bradyrhizobium strains from Kenya. Appl. Microbiol. Biotechnol. 2018, 102, 5265–5278. [Google Scholar] [CrossRef] [PubMed]
  39. Nuruzzaman, M.; Lambers, H.; Bolland, M.D.A.; Veneklaas, E.J. Distribution of carboxylates and acid phosphatase and depletion of different phosphorus fractions in the rhizosphere of a cereal and three grain legumes. Plant Soil. 2006, 281, 109–120. [Google Scholar] [CrossRef]
  40. Eivazi, F.; Bayan, M.R.; Schmidt, K. Select soil enzyme activities in the Historic Sanborn Field as affected by long-term cropping systems. Commun. Soil Sci. Plant Anal. 2003, 34, 2259–2275. [Google Scholar] [CrossRef]
  41. Maseko, S.T.; Dakora, F.D. Relationship between acid phosphatase activity and P concentration in organs of Cyclopia and Aspalathus species, and a non-legume of the Cape Floristic Region. J. Plant Ecol. 2018, 12, 387–392. [Google Scholar] [CrossRef]
  42. Koffi, G.A.; Ndoye, F.; Dabonne, S.; Bakhoum, N.; Faye, M.N.; Fall, D.; Diouf, D. Effect of maize and peanut crops on Ivory Coast northern soil biological activities and their response to arbuscular mycorrhizal fungi inoculation. Afr. J. Microbiol. Res. 2018, 12, 171–180. [Google Scholar]
  43. Maseko, S.T.; Dakora, F.D. Plant enzymes, root exudates, cluster roots and mycorrhizal symbiosis are the drivers of P nutrition in native legumes growing in P deficient soil of the Cape fynbos in South Africa. J. Agric. Sci. Technol. A. 2013, 3, 331. [Google Scholar]
  44. Ndakidemi, P.A. Manipulating legume/cereal mixtures to optimize the above and belowground interactions in the traditional African cropping systems. Afr. J. Biotechnol. 2006, 5, 2526–2533. [Google Scholar]
  45. Vardien, W.; Mesjasz-Przybylowicz, J.; Przybylowicz, W.J.; Wang, Y.; Steenkamp, E.T.; Valentine, A.J. Nodules from Fynbos legume Virgilia divaricata have high functional plasticity under variable P supply levels. Plant Physiol. 2014, 171, 1732–1739. [Google Scholar] [CrossRef] [Green Version]
  46. Maseko, S.; Dakora, F. Rhizosphere acid and alkaline phosphatase activity as a marker of p nutrition in nodulated Cyclopia and Aspalathus species in the cape fynbos of South Africa. S. Afr. J. Bot. 2013, 89, 289–295. [Google Scholar] [CrossRef] [Green Version]
  47. Makoi, J.H.; Ndakidemi, P.A. Selected soil enzymes: Examples of their potential roles in the ecosystem. Afr. J. Biotechnol. 2008, 7, 3. [Google Scholar]
  48. Mouradi, M.; Farissi, M.; Makoudi, B.; Bouizgaren, A.; Ghoulam, C. Effect of faba bean (Vicia faba L.)–rhizobia symbiosis on barley’s growth, phosphorus uptake and acid phosphatase activity in the intercropping system. Ann. Agrar. Sci. 2018, 16, 297–303. [Google Scholar] [CrossRef]
  49. Hauggaard-Nielsen, H.; Jensen, E.S. Facilitative root interactions in intercrops. Plant Soil. 2005, 274, 237–250. [Google Scholar] [CrossRef]
  50. Wieder, W.R.; Cleveland, C.C.; Smith, W.K.; Todd-Brown, K. Future productivity and carbon storage limited by terrestrial nutrient availability. Nat. Geosci. 2015, 8, 441. [Google Scholar] [CrossRef]
  51. Kalembasa, S.; Symanowicz, B. Enzymatic activity of soil after applying various waste organic materials, ash, and mineral fertilisers. Pol. J. Environ. Stud. 2012, 21, 1635–1641. [Google Scholar]
  52. Wang, L.; Liu, D. Functions and regulation of phosphate starvation-induced secreted acid phosphatases in higher plants. Plant Sci. J. 2018, 271, 108–116. [Google Scholar] [CrossRef]
  53. Giacometti, C.; Cavani, L.; Baldoni, G.; Ciavatta, C.; Marzadori, C.; Kandeler, E. Microplate-scale fluorometric soil enzyme assays as tools to assess soil quality in a long-term agricultural field experiment. Appl. Soil Ecol. 2014, 75, 80–85. [Google Scholar] [CrossRef]
  54. Betencourt, E.; Duputel, M.; Colomb, B.; Desclaux, D.; Hinsinger, P. Intercropping promotes the ability of durum wheat and chickpea to increase rhizosphere phosphorus availability in a low P soil. Soil Biol. Biochem. 2012, 46, 181–190. [Google Scholar] [CrossRef]
  55. Sun, J.; Zou, L.; Li, W.; Yang, J.; Wang, Y.; Xia, Q.; Peng, M. Rhizosphere soil properties and banana Fusarium wilt suppression influenced by combined chemical and organic fertilizations. Agric. Ecosyst. Environ. 2018, 254, 60–68. [Google Scholar] [CrossRef]
  56. Latati, M.; Blavet, D.; Alkama, N.; Laoufi, H.; Drevon, J.J.; Gerard, F.; Ounane, S.M. The intercropping cowpea-maize improves soil phosphorus availability and maize yields in an alkaline soil. Plant Soil. 2014, 385, 181–191. [Google Scholar] [CrossRef]
  57. Eskandari, H.; Ghanbari, A. Intercropping of maize (Zea mays) and cowpea (Vigna sinensis) as whole-crop forage: Effect of different planting pattern on total dry matter production and maize forage quality. Not. Bot. Hort. Agrobot. Cluj Nacopa. 2009, 37, 152–155. [Google Scholar]
  58. Manasa, P.; Maitra, S.; Reddy, M.D. Effect of Summer Maize-Legume Intercropping System on Growth, Productivity and Competitive Ability of Crops. Int. J. Eng. Res. Manag. Technol. 2018, 8, 2871–2875. [Google Scholar]
  59. Mahallati, M.; Koocheki, A.; Mondani, F.; Feizi, H.; Amirmoradi, S. Determination of optimal strip width in strip intercropping of maize (Zea mays L.) and bean (Phaseolus vulgaris L.). J. Clean. Prod. 2015, 106, 343–350. [Google Scholar] [CrossRef]
  60. Ajala, R.O.; Awodun, M.A.; Adeyemo, A.J.; Dada, B.F. Assessment of Wood Ash Application on Yield Advantage Indices of Maize and Lima Beans in an Intercrop. J. Exp. Agric. Int. 2019, 34, 1–11. [Google Scholar] [CrossRef] [Green Version]
  61. Hauggaard-Nielsen, H.; Ambus, P.; Jensen, E.S. Interspecific competition, N use and interference with weeds in pea–barley intercropping. Field Crop. Res. 2001, 70, 101–109. [Google Scholar] [CrossRef]
  62. Li, Q.Z.; Sun, J.H.; Wei, X.J.; Christie, P.; Zhang, F.S.; Li, L. Overyielding and interspecific interactions mediated by nitrogen fertilization in strip intercropping of maize with faba bean, wheat and barley. Plant Soil. 2011, 339, 147–161. [Google Scholar] [CrossRef] [Green Version]
Figure 1. Weather data (monthly meteorological) for the 2014/15 season (A) and 2015/16 season (B) at Roodeplaat, Pretoria, South Africa. The reported values are daily climatic data during season 1 (S1) and season 2 (S2) from day of direct seeding of cowpea and transplanting of amaranth until the end of harvest. Legend: Tmax: maximum temperature. (°C); Tmin: minimum temperature. (°C); Rain: Rainfall. (mm); ET0: Reference evapotranspiration. (mm).
Agronomy 10 00079 g001
Figure 2. Two-way analysis showing the effects of fertilizer levels and cropping on acid and alkaline phosphatase activity on rhizosphere of cowpea at four NPK levels in (A,B) 2014/15 and (C,D) 2015/16 seasons. Each bar represents the mean ± SE (n = 4). Different letters in each fertilizer treatment shows significant differences at p ≤ 0.05 in sole or intercropping.
Agronomy 10 00079 g002
Figure 3. Two-way analysis showing the effects of fertilizer levels and cropping on acid and alkaline phosphatase activity on rhizosphere of amaranth at four NPK levels in (A,B) 2014/15 and (C,D) 2015/16 seasons. Each bar represents the mean ± SE (n = 4). Different letters in each fertilizer treatment show significant differences at p ≤ 0.05 in sole or intercropping.
Agronomy 10 00079 g003
Figure 4. Two-way analysis of variance showing the effects on (A,B) plant and (C,D) soil P concentration on rhizosphere of cowpea at four NPK levels in 2014/15 and 2015/16 seasons. Each bar represents the mean (mean ± SE). Letters in each fertilizer treatment shows significant differences at p ≤ 0.05 in sole or intercropping.
Agronomy 10 00079 g004
Figure 5. Two-way analysis showing the effects on (A,B) plant and (C,D) soil P concentration on rhizosphere of amaranth at four NPK levels in 2014/15 and 2015/16 seasons. Each bar represents the mean ± SE (n = 4). Different letters in each fertilizer treatment shows significant differences at p ≤ 0.05 in sole or intercropping.
Agronomy 10 00079 g005
Figure 6. Two-way analysis showing the effects on plant and soil P concentration on rhizosphere of above ground biomass of cowpea at four NPK levels in 2014/15 and 2015/16 seasons. Each bar represents the mean ± SE (n = 4). Different letters in each fertilizer treatment shows significant differences at p ≤ 0.05 in sole or intercropping.
Agronomy 10 00079 g006
Figure 7. Two-way analysis showing the effects on plant and soil P concentration on rhizosphere of above ground biomass of amaranth at four NPK levels in 2014/15 and 2015/16 seasons. Each bar represents the mean ± SE (n = 4). Lettering in each fertilizer treatment shows significant differences at p ≤ 0.05 in sole or intercropping.
Agronomy 10 00079 g007
Table 1. Chemical properties of the topsoil layer (0.3 m) for the experimental sites.
Chemical Properties2014/152015/16
Before After Before After
pH (H2O)6.2 ± 0.46.2 ± 0.27.3 ± 0.47.2 ± 0.5
P(Bray 1) (mg kg−1)20 ± 0.618 ± 1.657 ± 355 ± 2
K (mg kg−1)218 ± 3.9203 ± 14158 ± 14155 ± 14
Na (mg kg−1)18 ± 0.915 ± 156 ± 1.256 ± 1
Ca (mg kg−1)635 ± 3.3602 ± 40857 ± 49847 ± 5
Mg (mg kg−1)198 ± 1.3190 ± 13174 ± 11170 ± 1.5
NO3-N (mg kg−1)7.8 ± 0.67.7 ± 0.62.6 ± 0.32.4 ± 0.8
NH4-N (mg kg−1)2.4 ± 0.22.2 ± 0.13.6 ± 0.43.9 ± 0.1
Clay %25 ± 225 ± 232 ± 232 ± 2
Values (Mean ± SE) are averages of three duplicate runs.
Table 2. Soil acid and alkaline phosphatase in cowpea and amaranth that have been fertilised with four levels of NPK in 2014/15 (season 1) and 2015/16 (season 2) seasons respectively.
Cropping System CowpeaAmaranth
Fertiliser LevelsSeason 1 Season 2Season 1 Season 2Season 1 Season 2Season 1 Season 2
Acid Phosphatase Activity Alkaline Phosphatase ActivityAcid Phosphatase Activity Alkaline Phosphatase Activity
(µg p-nitrophenol g−1 DWt. soil h−1)
SoleCONTROL1394 ± 7a11246 ± 9ab1950 ± 4a1888 ± 6a11325 ± 8a11292 ± 8a11246 ± 8a11471 ± 4a1
25%NPK1325 ± 4ab1,21292 ± 6a1766 ± 4b2868 ± 7a11199 ± 8b21144 ± 7b121021 ± 7c21126 ± 4bc12
50%NPK1244 ± 8bc21144 ± 7bc12667 ± 3bc2630 ± 4b21122 ± 9bc21116 ± 7b2948 ± 7c21004 ± 8bc2
100%NPK978 ± 7d3998 ± 6cde2575 ± 4cd2501 ± 3cd2946 ± 7de3982 ± 8c3784 ± 5d3949 ± 7c2
IntercropCONTROL1144 ± 5c11099 ± 7bcd1892 ± 5a1597 ± 4bc21021 ± 8d11179 ± 7b11137 ± 8b11236 ± 9ab1
25%NPK1177 ± 6c11119 ± 8bcd1626 ± 3cd2712 ± 5b11113 ± 6c121094 ± 8b21015 ± 8c21098 ± 6bc1
50%NPK1150 ± 7c1977 ± 8de2542 ± 3d23610 ± 4bc12945 ± 9de23956 ± 6c3922 ± 7c2894 ± 5cd2
100%NPK946 ± 6d2879 ± 6e2395 ± 2e3468 ± 2d3875 ± 6e3740 ± 4d4698 ± 5d3649 ± 5d3
LSD (p-value)Cropping56 (<0.001)69 (<0.001)53 (<0.001)55 (<0.001)39 (<0.001)55 (<0.001)49 (0.025)124 (0.011)
LSD (p-value)Fertiliser Level79 (<0.001)97 (<0.001)75 (<0.001)78 (<0.001)55 (<0.001)78 (<0.001)69 (<0.001)176 (<0.001)
LSD (p-value)Cropping X Fertiliser Level 111 (0.017)138 (0.935)107 (0.404)110 (0.007)77 (0.001)110 (0.101)97 (0.366)248 (0.375)
Mean ± SE (n = 4) in each column followed by different letters indicate significant differences between treatments. Numerical values that have been superscripted compare means of each cropping system at different fertiliser levels (p ≤ 0.05).
Table 3. Soil P concentration in cowpea and amaranth fertilised with four levels of nitrogen, phosphorus and potassium (NPK) in 2014/15 (season 1) and 2015/16 (season 2) seasons.
Cropping SystemFertiliser LevelsCowpea Amaranth
Season 1 Season 2Season 1 Season 2
mg.kg−1
SoleCONTROL53.7 ± 2.5d337.0 ± 3.2c378.7 ± 2.2bc250.1 ± 3.0c3
25%NPK84.8 ± 1.9c265.4 ± 3.6a1297.9 ± 3.1abc1264.1 ± 4.2bc23
50%NPK97.2 ± 2.9bc1275.1 ± 5.4a1102.1 ± 2.4ab1281.4 ± 4.7a12
100%NPK131.2 ± 9.5a152.3 ± b23142.4 ± 10.8a192.0 ± 8a1
IntercropCONTROL51.4 ± 2.8d236.5 ± 2.9c348.9 ± 3c234.1 ± 2.1d2
25%NPK63.9 ± 3.9d252.1 ± 2.6b277.7 ± 4.7bc1251.0 ± 3.4c12
50%NPK88.0 ± 5.3c166.6 ± 3.9a197.2 ± 3.5abc156.0 ± 4.5c12
100%NPK101.4 ± 9.1b146.7 ± 2.8bc23104.1 ± 9.8ab179.0 ± 6.9ab1
LSD (p-value)Cropping6.1 (<0.001)6.2 (0.030)23.3 (0.050)7.9 (<0.001)
LSD (p-value)Fertiliser Level8.7 (<0.001)8.8 (<0.001)33.0 (0.013)11.2 (<0.001)
LSD (p-value)Cropping X Fertiliser Level12.2 (0.019)12.5 (0.492)46.6 (0.732)15.9 (0.609)
Mean ± SE (n = 4) values in each column followed by different letters indicate significant differences between treatments. Numerical values following different letters have been superscripted to compare means of each cropping system at different fertiliser levels (p ≤ 0.05).
Table 4. Plant phosphorus concentration in cowpea and amaranth fertilized with four levels of NPK in 2014/15 (season 1) and 2015/16 (season 2) seasons.
Cropping SystemFertiliser LevelsCowpeaAmaranth
Season 1Season 2Season 1Season 2
mg kg−1
SoleCONTROL4935 ± 23a14249 ± 22a14514 ± 14cd23401 ± 15cd3
25%NPK 4586 ± 34a14569 ± 24a15220 ± 9b13732 ± 18bc23
50%NPK 4401 ± 35a14224 ± 21a15340 ± 37ab13896 ± 19ab12
100%NPK 2675 ± 16c23517 ± 19b25671 ± 32a14114 ± 3a1
IntercropCONTROL2793 ± 22c23744 ± 20b14174 ± 28d33166 ± 19d2
25%NPK3673 ± 27b13651 ± 18b14629 ± 31c23399 ± 22cd12
50%NPK 3710 ± 22b13560 ± 19b14653 ± 38c23427 ± 28cd12
100%NPK2396 ± 24c23086 ± 21c25120 ± 48b13851 ± 26ab1
LSD (p-value)Cropping256 (<0.001)215 (<0.001)184 (<0.001)163.2 (<0.001)
LSD (p-value)Fertiliser Level363 (<0.001)304 (<0.001)260 (<0.001)230.9 (<0.001)
LSD (p-value)Cropping X Fertiliser Level 513 (<0.001)430 (0.362)368 (0.552)326.5 (0.707)
Mean ± SE (n = 4) values in each column followed by different letters indicate significant differences between treatments. Numerical values following different letters have been superscripted to compare means of each cropping system at different fertiliser levels (p ≤ 0.05).
Table 5. Above ground biomass (AGB), above ground edible biomass (AGEB), in cowpea and amaranth under sole and intercropping systems as well as Land Equivalent Ratio (LER) and grain yield of cowpea at four fertiliser levels (F. level) (NPK) in 2014/15 (season 1) and 2015/16 (season 2) seasons.
2014/15F. LevelCowpea Amaranth
AGBAGEBGRAIN YIELDAGBAGEBF. levelLER
kg.ha−1kg.ha−1kg.ha−1kg.ha−1kg.ha−1
SoleCONTROL2731 ± 137c3573 ± 29b23577 ± 179b22389 ± 119c1116 ± 6de2
25%NPK4126 ± 165b2760 ± 30a15678 ± 227a13519 ± 141abc12177 ± 7bcd2
50%NPK5034 ± 151a1869 ± 26a16016 ± 180a14370 ± 131ab23206 ± 6bc2
100%NPK4238 ± 254b2816 ± 49a13259 ± 196bc25278 ± 317a3388 ± 23a1
IntercropCONTROL2605 ± 130c2507 ± 25bc12415 ± 121bc232056 ± 103c1103 ± 5e3CONTROL1.81
25%NPK4009 ± 160b1546 ± 22bc15709 ± 228a12481 ± 99bc1126 ± 5de2325%NPK1.68
50%NPK2108 ± 63d3406 ± 12bc13642 ± 109b23074 ± 92bc1146 ± 4cde250%NPK1.12
100%NPK1485 ± 89e4393 ± 24c21989 ± 119c33870 ± 232abc1211 ± 13b1100%NPK1.08
LSD (p-value)Cropping230 (<0.001)106 (0.157)578 (<0.001)862 (0.024)29 (<0.001)
LSD (p-value)Fertiliser Level325 (<0.001)75 (<0.001)817 (<0.001)1220 (0.007)41 (<0.001)
LSD (p-value)Cropping X Fertiliser Level 460 (<0.001)151 (0.003)1156 (0.050)1725 (0.783)58 (0.004)
2015/16
SoleCONTROL3996 ± 216ab11796 ± 90bc23430 ± 172c22667 ± 133b2107 ± 5c3
25%NPK4319 ± 177a12749 ± 110a15230 ± 209a12944 ± 118b2118 ± 5c3
50%NPK4419 ± 88a11945 ± 58b24275 ± 128 bc124815 ± 144a1187 ± 6b2
100%NPK2922 ± 222c21060 ± 64b22035 ± 122d34630 ± 278a1270 ± 16a1
IntercropCONTROL3702 ± 179b21574 ± 79d31993 ± 100d22333 ± 117b1117 ± 6c2CONTROL1.80
25%NPK3576 ± 174b21710 ± 68c14843 ± 194ab12889 ± 116b1 126 ± 5c225%NPK1.81
50%NPK4354 ± 85a11555 ± 47bc14226 ± 127bc12889 ± 87 b1141 ± 4bc1250%NPK1.59
100%NPK2835 ± 85c31134 ± 60cd21553 ± 93d23407 ± 204ab1190 ± 11b1100%NPK1.71
LSD (p-value)Cropping205 (0.008)155 (<0.001)429 (0.011)684 (0.015)25 (0.033)
LSD (p-value)Fertiliser Level290 (<0.001)219 (<0.001)607 (<0.001)967 (0.012)35 (<0.001)
LSD (p-value)Cropping X Fertiliser Level 410 (0.085)309 (<0.001)859 (0.132)1368 (0.194)49 (0.042)
Mean values in each column followed by different letters indicate significant differences between reatments. Numerical values following different letters have been superscripted to compare means of each cropping system at different fertiliser levels (p ≤ 0.05).

