Abstract
Agroforestry is indicated as a farming practice suited to enhance ecosystem services generated by cropping systems. However, farmers are often reluctant to implement agroforestry systems due to the potential yield loss of crops. In a field trial, soybean was intercropped with poplar short-rotation-coppice rows in an alley-cropping system with 13.5 m wide alleys, in order to assess the effect of tree presence on soybean yield and quality. The light availability (LA) was significantly affected by the tree presence, with an increasing effect along the season due to tree growth, being at its lowest in the tree–crop interface positions (West and East). Significant effects of the tree-distance and LA were registered on soybean yield, with the highest reduction of soybean yield in the West (−78%) and East (−35%) positions. Crude fat content in soybean grain did not vary among positions in the alley, while crude protein content was the lowest in the most shaded position (West −8% than the highest value). The assessment of spatial variability among plots of measured soil characteristics highlighted no significant effect of pedological conditions upon soybean yield. Thus, in our study, the LA effect was more important than soil characteristics in determining a detrimental effect of competition for resources between soybean and poplar. Conversely, soybean quality was affected by soil characteristics, since crude fat significantly correlated with soil nutrients, pH, soil organic matter and soil texture.
1. Introduction
Among agroforestry systems, silvoarable Alley-Cropping Systems (ACS) are characterized by the intercropping of crops and wide-row trees [1], providing a variety of products, such as food, feed, fibers, fuelwood and timber, while increasing the potential delivery of agroecosystems services [2]. Nonetheless, farmers are reluctant to implement agroforestry systems because of the potential loss of gross production due to: (i) the reduction of arable surface and (ii) the risk of lower crop yields driven by the competition for resources between crops and trees [3]. In Italy, farmers consider tree management in a silvoarable system, and its relative cost as a possible driver of failure [4]. Furthermore, the majority of farmers are not attracted to bioenergy plantations with fast-growing tree species such as Populus spp., Salix spp. and Robinia pseudoacacia L., because of the poor financial returns and the depressed Italian market [5]. The conversion of existing Short Rotation Coppice (SRC) stands to silvoarable ACS, in which the hedgerows are managed as a SRC, is proposed as an option for the implementation of sustainable cropping systems by combining the production of food and wood at the farm level in the temperate regions of Europe [6,7].
In recent years, the European Commission has been fostering the cultivation of soybean, and it has promoted the necessity to reduce consistently the dependence from imports of protein supply for animal feeding. To date, imported soybean meal for animal feeding (i) represents 70% of protein-rich feedstuff used in the European Union (EU) [8] and (ii) it is associated with an increase of environmental impacts generated by land clearing in South America [9]. Worldwide, soybean represents one of the largest sources of vegetable oil and animal protein feed [10].
The effect of intercropping on soybean productivity has been studied under several agroforestry systems and in different biogeographic regions, resulting in different responses according to tree density when it comes to elements such as the competition for light, water and nutrients [11,12,13,14]. In particular, Reynolds [11] observed that, under temperate climate conditions, the reduction of light availability, more than the competition for soil water, caused a significant decline of the Net Assimilation of plants within a distance of 2 m from the tree rows. Other authors found that tree presence may induce soybean yield stability and promote N2-fixation under water stress, boosting agroforestry as a promising solution to climate change adaptation [3]. However, few studies have been conducted in Mediterranean environments, and consequently, there is a scarcity of information about the effect of the tree presence on the soybean seed content of fat and protein.
A soybean–poplar SRC intercropping field trial was set up in 2017 in Italy in a coastal Mediterranean environment. The present study aims: (i) To investigate the effect of tree presence upon soybean yield components and feed quality in a rainfed ACS, according to the position of the soybean plants in the alley (West, Mid-West, Center, Mid-East, East) and (ii) to evaluate the effect of light availability at the herbaceous layer and of soil characteristics on soybean grain yield and composition in an ACS.
2. Materials and Methods
2.1. Experimental Design and Crop Management
The field trial was carried out in a coastal plain area close to the city of Pisa (Tuscany, Italy), in the Center for Agro-Environmental Research of the University of Pisa (CIRAA) “E. Avanzi” (43°40’56.1” N, 10°20’31.1” E; 1 m above sea level and 0% slope). The experimental area is characterized by an average annual rainfall of 920 mm and 15 °C of annual mean temperature (long-term average 1986–2016).
The experimental Alley-Cropping Systems (ACS) fields were originated from a former poplar Short Rotation Coppice (SRC) plantation (Populus x canadensis clone AF2 and Populus x generosa A. Henry × nigra L. clone Monviso) established in 2009. The stand had a planting design of 30 rows with a NW–SE orientation (357° N-NW), spaced 2.7 m between rows and 0.5 m between trees in the row. The total surface covered is 1.2 ha. From 2009 to 2016, poplar was coppiced every two years with a cut-and-chip harvester at the end of February, after the frost period. In March 2017 four out of five rows of poplar were removed, leaving 12 m-wide alleys of arable surface within two single-rows of SRC poplar spaced 13.5 m. Land clearing was performed with a forestry shredder (until 20 cm depth). Within the arable alleys, four randomly-distributed alley plots for the cultivation of soybean were obtained (12 × 30 m). Aside of the ACS, five continuous poplar rows spaced at 2.7 m (7400 plants ha−1), and covering an area of about 3000 m2, were left as our SRC control treatment.
In the first year after the conversion from SRC to ACS, no crops were cultivated in the alleys, so as to achieve the full devitalization of poplar below-ground residues by herbicide spraying on re-sprouted shoots. The experiment started in May 2018, during the second poplar SRC growing seasons.
The seedbed was prepared by chisel ploughing (50 cm depth) and disk harrowing for the cultivation of soybean under rainfed conditions. Soybean (Glycine max (L.) Merr. cv. Zora) inoculated with Bradyrhizobium japonicum was sown with a seeding rate of 50 seeds per m2. N-P-K fertilization (32 N-96 P2O5-96 K2O kg ha−1) was provided before sowing in order to avoid soil nutrient scarcity as a limiting factor for crop development. After 40 days from the emergence, root nodules were absent. Thus, two consecutive nitrogen (N) applications of 92 kg N ha−1 were carried out on 13 July 2018 and 21 August 2018. Nitrogen fertilizer was applied to poplar rows in both the ACS and SRC plantations. Soybean was harvested on 8th October 2018. The harvest of woody, above-ground biomass was performed on 5 March 2019. Poplar above-ground biomass accumulation per plant was equal to 7.1 kg dry weight in ACS and 4.7 kg in SRC, while the biomass production of poplar per unit area was 15.2 and 5.7 Mg ha−1 in ACS and SRC, respectively. At harvest, the average tree height was about 5.0 m in both ACS and SRC.
2.2. Data Collection
A meteorological station, located inside one agroforestry alley plot, collected daily values of air temperature and rainfall. Soil characteristics were derived from samples collected in 63 points and georeferenced with a handheld global positioning system (GPS) during September 2017. Soil sampling was performed in the overall experimental area, collecting random cores with an auger (5 cm inner diameter) at two depths (0–10 cm and 10–30 cm). Soil cores were analyzed for the following parameters: soil texture (international pipette method), pH (H2O, 1:2.5), organic matter content (Walkley–Black method), total N content (Kjeldhal method), available P (Olsen method) and exchangeable potassium (K) (BaCl2 method) [15].
The Light Availability (LA) at the herbaceous layer and its variability along the alley was measured by means of hemispherical photos taken according to a transept replicated three times (every 10 m) in each plot. The transept was designed in order to consider progressive distances along a line perpendicular to the tree row and the ordination of rows. Thus, each transept consisted in five positions from west to east within the alleys: 2.5 m-West; 4.5 m-Mid-West; 6.75 m-Center, 4.5 m-Mid-East; 2.5 m-East. Overall, 60 photos (5 positions × 3 replicates in each plot × 4 plots in the alley) were taken by a digital camera fitted with a 180° fish-eye lens (Nikon, Coolpix 4500 with FC-E8 lens, Minato, Tokyo, Japan) during three development stages of the soybean at sowing (16 June), complete formation of side shoots (26 July) and its full maturity stage (2 October). Finally, LA was obtained by processing the images with the free software Gap Light Analyzer 2.0 GLA [16].
In the same five positions where hemispherical photos were taken, soybean above-ground biomass was sampled at harvest (8 October 2018), collecting 15 samples per plot in an area of 0.5 m2 each. The following parameters were considered to evaluate the soybean productivity and yield components: total dry weight of above ground biomass (g m−2), dry weight of grain (g m−2), dry weight of crop residues (total weight minus the weight of grain) (g m−2), number of plants (n° m−2), plant height (cm), number of internodes of the main shoot (n° plant−1), number of pods (n° pods of the sample/n° plants of the sample) (n° plant−1), average weight of a single pod (weight of pods of the sample/n° of pods of the sample) (g pods−1), number of seeds per pod (n° of seeds of the sample/n° of pods of the sample) (n° pod−1) and the weight of 1000 seeds (g). The dry weight, samples of seeds, pods and stems, were placed into a forced-draft oven at a 60 °C until constant weight for the determination of the dry matter content.
Then, soybean grain samples were analyzed for Crude Protein (CP) and Crude Fat (CF) contents. Crude fat was extracted for 6 h with petroleum ether, while the Kjeldahl method was used to determine N [17]. Crude protein was calculated as N × 6.25. Area-scaled CP and CF (g m−2) were calculated as the products of dry grain yield (g m−2) by CP and CF content (%).
2.3. Statistical Analysis
Statistical analyses were performed using the R software [18]. Ordinary Kriging (OK) was used to interpolate the values of 63 soil points for the analyzed parameters (Table 1) with the “gstat” package [19,20] and “automap” package [21] was used to calculate the cross-validation outcomes.

Table 1.
Mean value ± standard error (SE) of the under-canopy light availability in the alley plots (%) for the five transect positions in the three investigated soybean growth periods (Sowing, Vegetative, Maturity) and mean value ± standard error of the whole soybean cropping season.
Mean and standard deviation (SD) of the soil parameters for each plot were calculated by the “zonal statistic” function in QGIS software version 2.18.14 [22] from the raster maps generated by OK interpolation for each investigated depth. To evaluate the relationships among soil parameters and crop performance, in each soybean sampling point, soil parameter values were extrapolated from the raster maps generated by OK interpolation with the “Point sampling tool” plugin found in QGIS software version 2.18.14 [22].
The LA measured in the three soybean development stages and the average value of the cropping season were analyzed in order to investigate the differences among the positions in the alley using the Kruskal-Wallis Test with the “FSA” package [23], since the residuals were deviated from a normal distribution.
The parameters describing the agronomic performance of soybean were analyzed in order to assess the differences among the positions in the alley. Levene’s test was used to check the homogeneity of variance and the Shapiro–Wilk test to check the normality of the residuals. The following parameters were log transformed, since these residuals deviated from a normal distribution: “Number of pods per plant” and “Area-scaled CF”. The effect of the position in the alley on soybean yield parameters and grain quality was determined using the lmer() function for linear mixed-effects models, in the “lme4” package [24], with the factor “position” (n = 5) as a fixed effect and the interaction between “plot” (n = 4) and “replicate”(n = 3) as the random effect. Tukey’s honestly significant difference (HSD) post-hoc test was carried out by pairwise multiple comparisons using the “emmeans” package [25] with the emmeans() function. In order to investigate the multiple relationship among soybean grain yield, tree presence, light availability and soil characteristics, a Principal Component Analysis (PCA) was performed using the “vegan” package [26], and Spearman’s correlation was performed to investigate the relationships among dry grain yield, CP, CF and soil characteristics.
3. Results
3.1. Meteorological Conditions
The most suitable sowing period for soybean in the experimental area usually occurs across April and May; nevertheless, the high rainfall level recorded in these two months of 2018 (66 mm and 91 mm, respectively) led to delay the sowing until June 2018.
During the soybean growing period, rainfall distribution was characterized by high variability (Figure 1). From 1 June to 18 October the total rainfall was 125 mm, and in the sixty days after sowing, 88 mm of precipitation were registered. The wettest period was recorded in the last ten days of June (32 mm), while a dry period started in September and continued until soybean harvest in October. During the soybean vegetative stages, an absence of rainfall was observed only from 31 July to 9 August that matched with the warmest period of 2018, with an average air temperature of 27.6 °C. The average temperature in the study period was 22.8 °C.
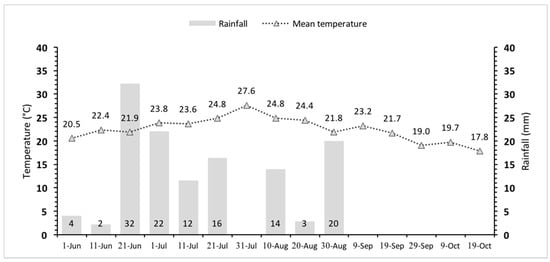
Figure 1.
Ten-day average rainfall and mean air temperature in San Piero a Grado (Pisa, Italy) from 1 June to 28 October 2018.
3.2. Spatial Variability of Soil Characteristics
Table A1 (Appendix A) shows the Ordinary Kriging (OK) parameters for each analyzed soil characteristic, and Table 2 depicts the average values of the parameters for each experimental plot. The interpolation of soil texture parameters, sand, silt and clay with OK showed a high correlation between the observed and predicted values in both investigated depths; moreover, the Pearson’s r ranged from 0.95 to 0.98. Lower coefficients resulted for pH and soil organic matter (SOM), with an average value for both depths of 0.82 and 0.66, respectively. Among soil macronutrient contents, the highest correlation value was recorded for P (0.96 and 0.94 for the 0–10 and 10–30 cm depths, respectively) and the lowest for N with 0.61 and 0.71, for these same 0–10 and 10–30 cm depths, respectively. Regarding the variability of soil parameters along the field site, plots A and B were characterized by a higher presence of sand and a lower of silt and clay if compared to the plots C and D (Table 2). In particular, sand showed the highest variability among plots, (coefficient of variation (CV) = 0.85 and 0.84, 0–0.10 m and 0.10–0.30 m depths, respectively) while silt and clay varied less. Soil pH, SOM, Total N and exchangeable K varied slightly among plots, while conversely, available P showed a high variation with a CV of 0.60 and 0.54, for the 0–0.10 m and 0.10–0.30 m depths, respectively (Table 2).
Table 2.
Average plot values and Coefficient of Variation (CV) among plots of soil characteristics of the experimental plots: presence of sand (g kg−1), silt (g kg−1), clay (g kg−1), pH, soil organic matter (SOM) (%), total N (%), available phosphorus (ppm of P2O5) and exchangeable potassium (ppm of K2O).
3.3. Effect of the Position in the Alley on Light Availability, Soybean Yield and Quality
On average, in the four investigated plots, LA showed a decreasing trend during the soybean growing season in all considered positions (Table 1). The average value of LA during the soybean growing season was 86.79% ± 1.18%. The mean LA in the alley was 90.44% ± 1.02%, 87.19% ± 1.33% and 82.72% ± 1.48% in the first, second and third periods of investigation, respectively. LA at the herbaceous layer varied significantly in each sampling period among the investigated positions according to the tree distance. In all the sampling periods LA exhibited a similar pattern along the alley transect, showing a significant reduction in the closer position to both tree rows, (West and East) with respect to the central positions (Table 1). LA mean in the West and East positions (2.5 m from the tree rows) was significantly lower with respect to the other positions in the alley. The highest LA in the alley was recorded in the Center position with average value of 94.70% ± 0.34%. LA in Mid-West (91.54% ± 0.71%) position was lower with respect to Mid-East (93.05% ± 0.32%), similarly LA in West (74.30% ± 2.12%) was lower than in East (80.35% ± 1.64%), even if these differences were not statistically significant (Table 1).
All of the measured parameters describing the soybean development were significantly affected by their position in the alley, except for the 1000 seeds weight (Table 3).
Table 3.
Effect of the position in the alley on the measured soybean yield parameters (mean ± standard error). Different lowercase letters indicate significant difference among position in the alley for Tukey’s HSD test.
In particular, the dry weight of grain was the highest in Center (247 ± 25 g m−2), the lowest in West (−78%), while it recorded intermediate values in the other positions (on average 182 ± 14 g m−2). The dry weight of total biomass and the dry weight of crop residues showed a similar behavior, being the highest in Center, the lowest in West (−75% total biomass and −72% crop residues) and intermediate in the other positions. The number of plants in a square meter was the highest in Center and in East (on average 22 ± 1 m−2), and the lowest in West (14 ± 2 m−2), while Mid-West and Mid-East were in between the two extreme values (on average 18 ± 2 m−2). The height of the plants and the number of internodes were the lowest in West (33 ± 6 cm, 6 ± 1 n° m−2), while these values were not different among the other positions (on average 50 ± 1 cm, 9 ± 0.2 n° m−2). The number of pods per plant was the highest in Center, Mid-West and Mid-East (on average 50 ± 10 n° plant−1) and the lowest in West (16 ± 5 n° plant−1), while East recorded an intermediate value (30 ± 3 n° plant−1).
The average dry weight of a single pod was the highest in Center, Mid-West and Mid-East (on average 0.41 ± 0.02 g pod−1), the lowest in West (0.31 ± 0.03 g pod−1), and it was intermediate in East (0.39 ± 0.03 g pod−1).
The number of seeds per pod was the lowest in West (1.6 ± 0.2 n° pod−1), the highest in Center (2.2 ± 0.1 n° pod−1).
Soybean grain CP content was significantly affected by the position in the alley, being the lowest in West (30% ± 1 %), the highest in Mid-West, Mid-East and East (on average 33 ± 1 %) and recorded a middle value in Center (31% ± 1 %), Table 4. Differently, Soybean grain CF content was not significantly affected by the position.
Table 4.
Effect of the position in the alley on crude proteins (CP) and crude fat (CF) contents both expressed as percentage in the soybean grain (%) and as the quantity in a square meter of the field (g m−2).
The area-scaled quantity of CP was affected by the position in the alley, being ordered as Center < Mid-East < Mid-West = East < West. Moreover, also the area-scaled quantity of CF was significantly affected by the position, with the lowest value recorded in West, the highest in Center, Mid-East and East, and Mid-West was in between the two extremes.
3.4. PCA Analysis of the Effect of Soil Characteristics on Soybean Yield and Quality
The first two principal components describing the relationship among soybean grain yield, the distance of the observations from the tree row, the light availability and the content of sand in the soil explained ca. 82% of the total variance (Figure 2). In particular, the analysis highlighted that the first principal component was positively associated to the distance from the tree row, the light availability and the grain yield. The second principal component was positively associated with the sand presence of the soil. Indeed, concerning the positions, the first component separated the soybean samples according to the position in the alley: samples from the West position had negative scores of the first component being associated to the lowest light availability and lowest yield. On the contrary, samples from the Center position had positive scores of the first principal component, being associated with the highest light availability and the highest yield. The second principal component detached the samples according to the sand presence in the soil, irrespective to the grain yield (Figure 2).
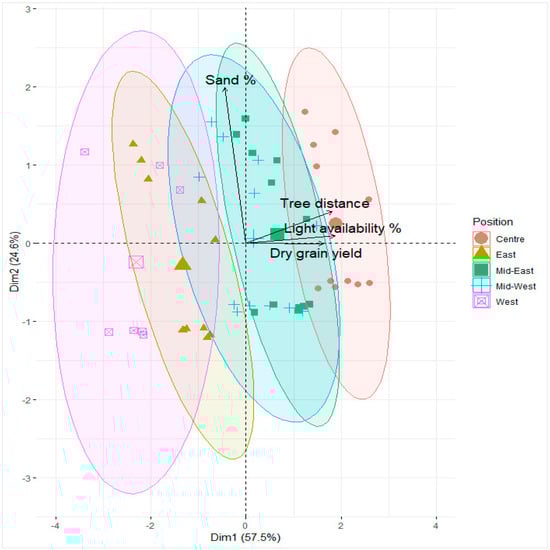
Figure 2.
Biplot for Principal Components Analysis (PCA). Variables were: sand content in soil (“Sand %”), distance from tree row in meters (“Tree distance”), light availability (“Light availability %”) and dry grain yield in g m−2 (“Dry grain yield”). Colored ellipses highlight the observations taken in the different position in the alley.
The analysis of the Pearson correlation confirmed that the main soil characteristics were not related to the dry grain yield (Figure 3). Soybean grain CF content was positively correlated with the soil pH (rs: 0.42), while it was negatively correlated with the content of exchangeable K in soil (rs: −0.33). Grain CP content correlated significantly with all the soil characteristics measured, and in particular, it was positively correlated with: available P (rs: 0.83), sand (rs: 0.77), total N (rs: 0.33), SOM (rs: 0.28) and exchangeable K (rs: 0.79). Conversely, CP was negatively correlated with pH (rs: −0.64), silt (rs: −0.77) and clay (rs: −0.83).
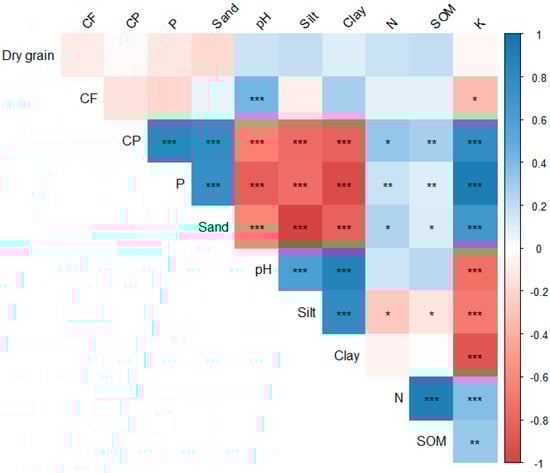
Figure 3.
Correlation plot among soil characteristics, grain yield and quality. CF: crude fat (%), CP: crude protein (%), P: available phosphorous in soil (ppm of P2O5), Sand: sand content in soil (g kg−1), pH: pH of soil, Silt: silt content in soil (g kg−1), Clay: clay content in soil (g kg−1), N: total nitrogen in soil (‰), SOM: soil organic matter content in soil (%), K: exchangeable potassium in soil (ppm of K2O). Numbers are the Spearman’s coefficients (rs). Asterisks indicate significance levels: * p ≤ 0.05, ** p ≤ 0.01, *** p ≤ 0.001.
4. Discussion
During 2018, water availability was likely not limiting for the growth of both soybean and poplar, as rainfall occurred uniformly until September. Comparatively, mineral nutrients were sufficiently present, as deficiency symptoms in crop and trees were not observed, mainly thanks to a good initial soil fertility and to the distribution of N, P and K through mineral fertilization. Indeed, concerning nitrogen, N fertilizer was distributed at sowing and in two topdressing applications, since no nodule formation was observed in soybean roots, even if soybean seeds were inoculated with Bradyrhizobium japonicum. Previous studies reported that alkaline pH in the soil is not optimal for B. japonicum, and thus nodulation may be reduced or inhibited [27,28].
Soybean yield in alley cropping with poplar SRC varied according to the light availability and tree distance with a significant reduction in the tree–crop interface positions (West −78% and East −35%) with respect to the Center position of the alley (6.75 m distance from the tree rows). In particular, the West position was the one which recorded the lowest dry grain yield, linked to the lowest number of plants, the lowest average height of plants and the lowest number of pods per plant. In a field trial on clay loam soil in subtropical–humid conditions, [29] it was reported that soybean plant height was higher in shade conditions (resulting in 60% light reduction) than in a natural light setting, even if the number of nodes was significantly reduced like in our study.
Moreover, in our study the average weight of a single pod was the lowest in West as the number of seeds per pod was the lowest with respect to the other positions, while the weight of 1000-seeds was not significantly affected by the position in the alley. Other authors reported that shade reduced the number of pods per soybean plant, with no effect on the size of seeds and no effect on the number of seeds per pod [30,31].
Recently, [14] a field trial in Uganda demonstrated that soybean was significantly affected by intercropping with a deciduous tree, Vitellaria paradoxa, showing a yield reduction with respect to an open field cultivation, ranging from 39% to 46% when cultivated under the canopy of young and mature trees, respectively. Under humid, sub-tropical conditions in Brazil [13], it was shown that soybean yield parameters were affected by LA reduction in two agroforestry systems based upon eucalyptus and Peltophorum dubium. Their results highlighted that the yield components of soybean, cultivated in a 12-m-wide alley-cropping system, were significantly reduced by LA equal to 65% in the understory layer. Moreover, it was found that there were no significant differences for 1000-seeds weight similarly to what we observed in our study.
Under the temperate climate conditions of Southern Quebec, in an ash and oak row-based alley-cropping system (tree rows spaced 4 m with a NW–SE orientation) [32], a soybean yield reduction according to the tree presence was measured in 2016, while in 2017, no differences were recorded. In their study, the yield reduction was about 39% from the Center of the plot to the tree–crop interface zone where the tree–crop distance was equal to the half of the tree height. Nevertheless, their results highlighted that no differences occurred in soybean yield cultivated in the other three agroforestry systems in Quebec in the same years. In our field trial, according to results observed in 2016 by Carrier et al. [32], the significant yield reduction of soybean occurred when the distance from the trees was about half of the tree height in both sides of the alley. Moreover, no significant differences were found for Center and Mid-West/Mid-East positions, even if our investigated system is characterized by a higher tree density compared to the alley system studied by Carrier et al. [32] (700 vs. 28 plant ha−1). In addition, Reynolds et al. [11] in 2007 reported that taller trees casting a longer shadow provide a more detrimental effect on soybean net assimilation and productivity. Furthermore, they concluded that competition for water was of lesser importance than competition for light. In the same environment, Isaac et al. [12] observed a soybean above-ground and below-ground biomass reduction according to the soybean–poplar row distance, but with no significant correlations between light parameters and crop biomass. In agreement with other Canadian outcomes from a poplar–soybean intercropping two-year study [31], our result showed that a small difference in LA between the West and East positions affected soybean yield and total biomass production at the poplar–soybean interface, suggesting that competition for light was more important than competition for water in 2018.
In our study, the variation of the grain quality of soybean according to the position in the alley was also evaluated, and no effect of distance from tree rows and LA was observed on the grain CF content, while a lower grain CP content was recorded in the West position (−8% with respect to the highest value). Our results were in partial agreement with that reported by Werner et al. [33], that highlighted a no significant effect of tree distance on soybean CF and CP content in a Eucalyptus grandis agroforestry system in Southern Brazil.
Few previous studies investigated the effect of soil physical and chemical properties on soybean yield and quality, even if some authors reported a significant variability in soybean productivity and grain quality both among sites and within the same field [34,35]. In our study, we did not observe any significant correlation among dry grain yield and soil characteristics, although the availability of nutrients in soil (e.g., P, K) may be limiting for the crop at a high level of soil pH [36,37]. Maybe, the P and K fertilization carried out in our experiment may have masked this effect.
Based on our results, soybean grain yield was not correlated with CF and CP grain content. Previous studies reported contrasting results regarding the relationship between soybean yield and CF/CP contents, probably due to the high variability in the values of soybean yield and quality found in those experiments [35,38]. Many studies also reported a significant negative correlation between CF and CP content [39], although this is not confirmed in our study. However, in our study, differently to grain yield, the contents of CF and CP in grain were affected by soil characteristics. Indeed, CF content in soybean grain was slightly negatively correlated with the exchangeable K content of the soil. This correlation however may be a consequence of the strong, negative correlation between K content and soil pH, as we highlighted that CF values positively correlated with pH, while CP content showed a negative correlation with soil pH. This result is in line with Anthony et al. [36] that reported a negative correlation between soil pH and the protein/oil ratio in soybean. In our study, CP content in soybean grain increased at higher sand contents, which are associated with lower pH values and higher P and K availability. Moreover, N and SOM contents were positively correlated with CP in soybean grain, as reported by Spoljar et al. [40]. Furthermore, other factors not considered in this study, such as cultivar and year, may affect protein and oil content in soybean more than nutrient availability with medium-to-high initial soil fertility [41,42].
5. Conclusion
This study evaluated the effect of tree presence on soybean yield in rainfed Mediterranean conditions and highlighted the detrimental effect on crop yield in the tree–crop interface. Moreover, soybean yield was significantly different between the opposite tree–crop interface positions in the alley, West and East, highlighting that the competition for light between trees and soybean was likely more important than the competition for water. Yield reduction was not registered in the two intermediate positions as compared with the Center, demonstrating that the detrimental effect of the tree presence on soybean yield is important when the tree–crop distance is lower than the tree height in a poplar SRC silvoarable system. Slight differences were recorded in the contents of oil and protein in soybean grain among the positions in the alley, and in particular the percentage of protein in soybean grain was significantly lower only in West. Concluding, further field studies are needed to investigate the productivity of soybean in alley-cropping systems and the stability of the production in the long term, testing also how different soybean cultivars could respond to cultivation under tree canopy in order to improve the productivity of soybean and poplar intercropping.
Author Contributions
Conceptualization, A.M., I.V., S.B., F.D., M.M. (Marcello Mele) and G.R.; methodology, A.M., I.V., S.B., F.D. and G.R.; investigation, A.M., I.V., G.P., M.M. (Martina Micci); data curation, A.M., I.V., G.P., M.M. (Martina Micci); writing—original draft preparation, A.M., I.V., G.P.; writing—review and editing, A.M., I.V., G.P., F.D., S.B., G.R. and M.M. (Marcello Mele); supervision, G.R. and M.M. (Marcello Mele). All authors have read and agreed to the published version of the manuscript.
Funding
This research received no external funding.
Acknowledgments
The authors wish to thank the staff from CIRAA and SSSA for their valuable support in the trial management. We thank Martina Occelli for improving the language of this paper. We are grateful for the constructive feedback of three anonymous referees.
Conflicts of Interest
The authors declare no conflict of interest.
Appendix A
Table A1.
Ordinary Kriging (OK) parameters of soil characteristics of the experimental plots: presence of sand, silt, clay, pH, SOM, total N, available phosphorus (P2O5) and exchangeable potassium K2O, * Mean Squared Normalized Error, ** Pearson correlation coefficient between observed and predicted values, “Sph”—spherical model, “Exp”—exponential model, “Gau”—gaussian model, “Wav”—wave model.
| Sand | Silt | Clay | pH | SOM | Total N | P2O5 | K2O | |
|---|---|---|---|---|---|---|---|---|
| Ordinary kriging parameters (0–10 cm soil depth) and cross-validation (5 folds) results | ||||||||
| Variogram Model | Sph | Exp | Exp | Wav | Exp | Sph | Gau | Gau |
| Nugget | 512.86 | 177.38 | 0.00 | 0.01 | 0.05 | 0.01 | 313.68 | 958.79 |
| Partial Sill | 12,685.88 | 29,885.08 | 1542.97 | 0.01 | 0.31 | 0.071 | 4230.47 | 6662.27 |
| Range | 89.88 | 363.82 | 13.74 | 39.99 | 27.77 | 50.80 | 67.35 | 9.19 |
| MSNE * | 0.77 | 0.815 | 0.98 | 1.29 | 0.90 | 1.16 | 0.49 | 0.87 |
| Correlation ** | 0.98 | 0.98 | 0.95 | 0.78 | 0.67 | 0.61 | 0.96 | 0.79 |
| Ordinary kriging parameters (10–30 cm soil depth) and cross-validation (5 folds) results | ||||||||
| Variogram Model | Gau | Gau | Exp | Sph | Exp | Sph | Gau | Sph |
| Nugget | 1024.52 | 508.80 | 127.43 | 0.000 | 0.030 | 0.006 | 152.67 | 0.00 |
| Partial sill | 8990.09 | 4924.37 | 1227.82 | 0.02 | 0.26 | 0.07 | 2065.38 | 8458.37 |
| Range | 34.360 | 40.25 | 23.82 | 15.26 | 37.10 | 47.96 | 23.07 | 44.86 |
| MSNE * | 1.83 | 1.30 | 0.95 | 0.76 | 0.99 | 1.01 | 1.31 | 1.08 |
| Correlation ** | 0.96 | 0.97 | 0.96 | 0.86 | 0.65 | 0.71 | 0.94 | 0.85 |
References
- Mosquera-Losada, M.R.; McAdam, J.H.; Romero-Franco, R.; Santiago-Freijanes, J.J.; Rigueiro-Rodróguez, A. Definitions and Components of Agroforestry Practices in Europe. In Agroforestry in Europe: Current Status and Future Prospects; Rigueiro-Rodróguez, A., McAdam, J., Mosquera-Losada, M.R., Eds.; Springer: Dordrecht, The Netherlands, 2009; pp. 3–19. ISBN 978-1-4020-8272-6. [Google Scholar]
- Kay, S.; Rega, C.; Moreno, G.; den Herder, M.; Palma, J.H.N.; Borek, R.; Crous-Duran, J.; Freese, D.; Giannitsopoulos, M.; Graves, A.; et al. Agroforestry creates carbon sinks whilst enhancing the environment in agricultural landscapes in Europe. Land Use Policy 2019, 83, 581–593. [Google Scholar] [CrossRef]
- Nasielski, J.; Furze, J.R.; Tan, J.; Bargaz, A.; Thevathasan, N.V.; Isaac, M.E. Agroforestry promotes soybean yield stability and N2-fixation under water stress. Agron. Sustain. Dev. 2015, 35, 1541–1549. [Google Scholar] [CrossRef]
- Camilli, F.; Pisanelli, A.; Seddaiu, G.; Franca, A.; Bondesan, V.; Rosati, A.; Moreno, G.M.; Pantera, A.; Hermansen, J.E.; Burgess, P.J. How local stakeholders perceive agroforestry systems: An Italian perspective. Agrofor. Syst. 2018, 92, 849–862. [Google Scholar] [CrossRef]
- Paris, P.; Camilli, F.; Rosati, A.; Mantino, A.; Mezzalira, G.; Dalla Valle, C.; Franca, A.; Seddaiu, G.; Pisanelli, A.; Lauteri, M.; et al. What is the future for agroforestry in Italy? Agrofor. Syst. 2019, 93, 2243–2256. [Google Scholar] [CrossRef]
- Tsonkova, P.; Böhm, C.; Quinkenstein, A.; Freese, D. Ecological benefits provided by alley cropping systems for production of woody biomass in the temperate region: A review. Agrofor. Syst. 2012, 85, 133–152. [Google Scholar] [CrossRef]
- Beuschel, R.; Piepho, H.P.; Joergensen, R.G.; Wachendorf, C. Effects of converting a temperate short-rotation coppice to a silvo-arable alley cropping agroforestry system on soil quality indicators. Agrofor. Syst. 2019, 2, 1–2. [Google Scholar] [CrossRef]
- Schreuder, R.; De Visser, C. EIP-AGRI Focus Group Protein Crops : Final report. European Commission: Brussels, Belgium, 2014. [Google Scholar]
- Weightman, R.M.; Cottrill, B.R.; Wiltshire, J.J.J.; Kindred, D.R.; Sylvester-Bradley, R. Opportunities for avoidance of land-use change through substitution of soya bean meal and cereals in European livestock diets with bioethanol coproducts. GCB Bioenergy 2011, 3, 158–170. [Google Scholar] [CrossRef]
- Sugiyama, A.; Ueda, Y.; Takase, H.; Yazaki, K. Do soybeans select specific species of Bradyrhizobium during growth? Commun. Integr. Biol. 2015, 8, 9–12. [Google Scholar] [CrossRef] [PubMed]
- Reynolds, P.E.; Simpson, J.A.; Thevathasan, N.V.; Gordon, A.M. Effects of tree competition on corn and soybean photosynthesis, growth, and yield in a temperate tree-based agroforestry intercropping system in southern Ontario, Canada. Ecol. Eng. 2007, 29, 362–371. [Google Scholar] [CrossRef]
- Isaac, M.E.; Carlsson, G.; Ghoulam, C.; Makhani, M.; Thevathasan, N.V.; Gordon, A.M. Legume Performance and Nitrogen Acquisition Strategies in a Tree-Based Agroecosystem. Agroecol. Sustain. Food Syst. 2014, 38, 686–703. [Google Scholar] [CrossRef]
- Caron, B.O.; Sgarbossa, J.; Schwerz, F.; Elli, E.F.; Eloy, E.; Behling, A. Dynamics of solar radiation and soybean yield in agroforestry systems. An. Acad. Bras. Cienc. 2018, 90, 3799–3812. [Google Scholar] [CrossRef] [PubMed]
- Ogwok, G.; Id, P.O.A.; Kizza, S. Influence of Shea tree (Vitellaria paradoxa) on maize and soybean production. PLoS ONE 2019, 14, e0201329. [Google Scholar] [CrossRef] [PubMed]
- Motsara, M.R.; Roy, R.N. Guide to Laboratory Establishment for Plant Nutrient Analysis; Food and Agriculture Organization of the United Nations—FAO: Rome, Italy, 2008; ISBN 9789251059814. [Google Scholar]
- Frazer, G.; Canham, C.; Lertzman, K. Gap Light Analyzer (GLA), Version 2.0: Imaging Software to Extract Canopy Structure and Gap Light Transmission Indices from True-Color Fisheye Photographs, Users Manual and Program Documentation; Simon Fraser University: Burnaby, BC, Canada; Institute of Ecosystem Studies: Millbrook, NY, USA, 1999. [Google Scholar]
- A.O.A.C. Official Methods of Analysis of the Association of Official Analytical Chemists; A.O.A.C.: Rockville, MD, USA, 1990; Volume 60, p. 334. [Google Scholar]
- R Core Team. R: A language and environment for statistical computing. R Foundation for Statistical Computing, Vienna, Austria. Available online: https://www.R-project.org/ (accessed on 20 September 2019).
- Pebesma, E.J. Multivariable geostatistics in S: The gstat package. Comput. Geosci. 2004, 30, 683–691. [Google Scholar] [CrossRef]
- Gräler, B.; Pebesma, E.; Heuvelink, G. Spatio-temporal interpolation using gstat. R J. 2016, 8, 204–218. [Google Scholar] [CrossRef]
- Hiemstra, P. Package “automap”. Available online: https://cran.r-project.org/web/packages/automap/automap.pdf (accessed on 20 September 2019).
- Quantum GIS geographic information system. Open Source Geospatial Foundation Project. 2013. Available online: http://www.qgis.org/it/site/ (accessed on 20 September 2019).
- Ogle, D.H.; Wheeler, P.; Dinno, A. FSA: Fisheries Stock Analysis. R package version 0.8.25; Available online: https://github.com/droglenc/FSA (accessed on 20 September 2019).
- Bates, D.; Mächler, M.; Bolker, B.M.; Walker, S.C. Fitting linear mixed-effects models using lme4. J. Stat. Softw. 2015, 67, 1–48. [Google Scholar] [CrossRef]
- Lenth, R. emmeans: Estimated Marginal Means, aka Least-Squares Means. R package version 1.3.2. Available online: https://CRAN.R-project.org/package=emmeans (accessed on 20 September 2019).
- Oksanen, J.; Blanchet, F.G.; Friendly, M.; Kindt, R.; Legendre, P.; McGlinn, D.; Minchin, P.R.; O’Hara, R.B.; Simpson, G.L.; Solymos, P.; et al. vegan: Community Ecology Package. R package version 2.5-2. Cran R 2019, 1, 2. [Google Scholar]
- Yang, S.S.; Bellogı, R.A.; Buendı, A.; Miao, L.; Ollero, F.J.; Olsthoorn, M.M.A.; Rodrı, D.N. Effect of pH and soybean cultivars on the quantitative analyses of soybean rhizobia populations. J. Biotechnol. 2001, 91, 243–255. [Google Scholar] [CrossRef]
- Thilakarathna, M.S.; Raizada, M.N. A meta-analysis of the effectiveness of diverse rhizobia inoculants on soybean traits under field conditions. Soil Biol. Biochem. 2017, 105, 177–196. [Google Scholar] [CrossRef]
- Wu, Y.S.; Yang, F.; Gong, W.Z.; Ahmed, S.; Fan, Y.F.; Wu, X.L.; Yong, T.W.; Liu, W.G.; Shu, K.; Liu, J.; et al. Shade adaptive response and yield analysis of different soybean genotypes in relay intercropping systems. J. Integr. Agric. 2017, 16, 1331–1340. [Google Scholar] [CrossRef]
- Kakiuchi, J.; Kobata, T. The relationship between dry matter increase of seed and shoot during the seed-filling period in three kinds of soybeans with different growth habits subjected to shading and thinning. Plant Prod. Sci. 2006, 9, 20–26. [Google Scholar] [CrossRef][Green Version]
- Rivest, D.; Cogliastro, A.; Vanasse, A.; Olivier, A. Production of soybean associated with different hybrid poplar clones in a tree-based intercropping system in southwestern Québec, Canada. Agric. Ecosyst. Environ. 2009, 131, 51–60. [Google Scholar] [CrossRef]
- Carrier, M.; Rhéaume Gonzalez, F.A.; Cogliastro, A.; Olivier, A.; Vanasse, A.; Rivest, D. Light availability, weed cover and crop yields in second generation of temperate tree-based intercropping systems. F. Crop. Res. 2019, 239, 30–37. [Google Scholar] [CrossRef]
- Werner, F.; Balbinot Junior, A.A.; Franchini, J.C.; Ferreira, A.S.; de Aguiar e Silva, M.A. Agronomic performance of soybean cultivars in an agroforestry system1. Pesqui. Agropecuária Trop. 2017, 47, 279–285. [Google Scholar] [CrossRef][Green Version]
- Adams, T.C.; Brye, K.R.; Purcell, L.C.; Ross, J.; Gbur, E.E.; Savin, M.C. Soil property predictors of soybean yield using yield contest sites. J. Crop Improv. 2017, 31, 816–829. [Google Scholar] [CrossRef]
- Martin, N.F.; Bollero, A.G.; Bullock, D.G. Relationship between secondary variables and soybean oil and protein concentration. Trans. ASABE 2007, 50, 1271–1278. [Google Scholar] [CrossRef]
- Anthony, P.; Malzer, G.; Sparrow, S.; Zhang, M. Soybean yield and quality in relation to soil properties. Agron. J. 2012, 104, 1443–1458. [Google Scholar] [CrossRef]
- Islam, A.; Bolton, J. The effect of soil ph on potassium intensity and release of nonexchangeable potassium to ryegrass. J. Agric. Sci. 1970, 75, 571–576. [Google Scholar] [CrossRef]
- Yin, X.; Vyn, T.J. Relationships of isoflavone, oil, and protein in seed with yield of soybean. Agron. J. 2005, 97, 1314–1321. [Google Scholar] [CrossRef]
- Sabo, M.; Jug, D.; Jug, I. Effect of reduced tillage on quality traits of soybean [Glycine max (L.) Merr.]. Acta Agron. Hungarica 2007, 55, 83–88. [Google Scholar] [CrossRef]
- Spoljar, A.; Kislc, I.; Birkas, M.; Kvaternjak, I.; Marencic, D.; Orehovacki, V. Influence of tillage on soil properties, yield and protein content in maize and soybean grain. J. Environ. Prot. Ecol. 2009, 10, 1013–1031. [Google Scholar]
- Bosaz, L.B.; Gerde, J.A.; Borrás, L.; Cipriotti, P.A.; Ascheri, L.; Campos, M.; Gallo, S.; Rotundo, J.L. Management and environmental factors explaining soybean seed protein variability in central Argentina. F. Crop. Res. 2019, 240, 34–43. [Google Scholar] [CrossRef]
- Seguin, P.; Zheng, W. Potassium, phosphorus, sulfur, and boron fertilization effects on soybean isoflavone content and other seed characteristics. J. Plant Nutr. 2006, 29, 681–698. [Google Scholar] [CrossRef]
© 2019 by the authors. Licensee MDPI, Basel, Switzerland. This article is an open access article distributed under the terms and conditions of the Creative Commons Attribution (CC BY) license (http://creativecommons.org/licenses/by/4.0/).