
Composite Polymer Electrolytes: Nanoparticles Affect Structure and Properties


Abstract
:
1. Introduction
2. Ion Transport in Binary and Composite Polymer Electrolytes
3. Nanoparticle Additives Affect the Polymer Electrolyte Structure
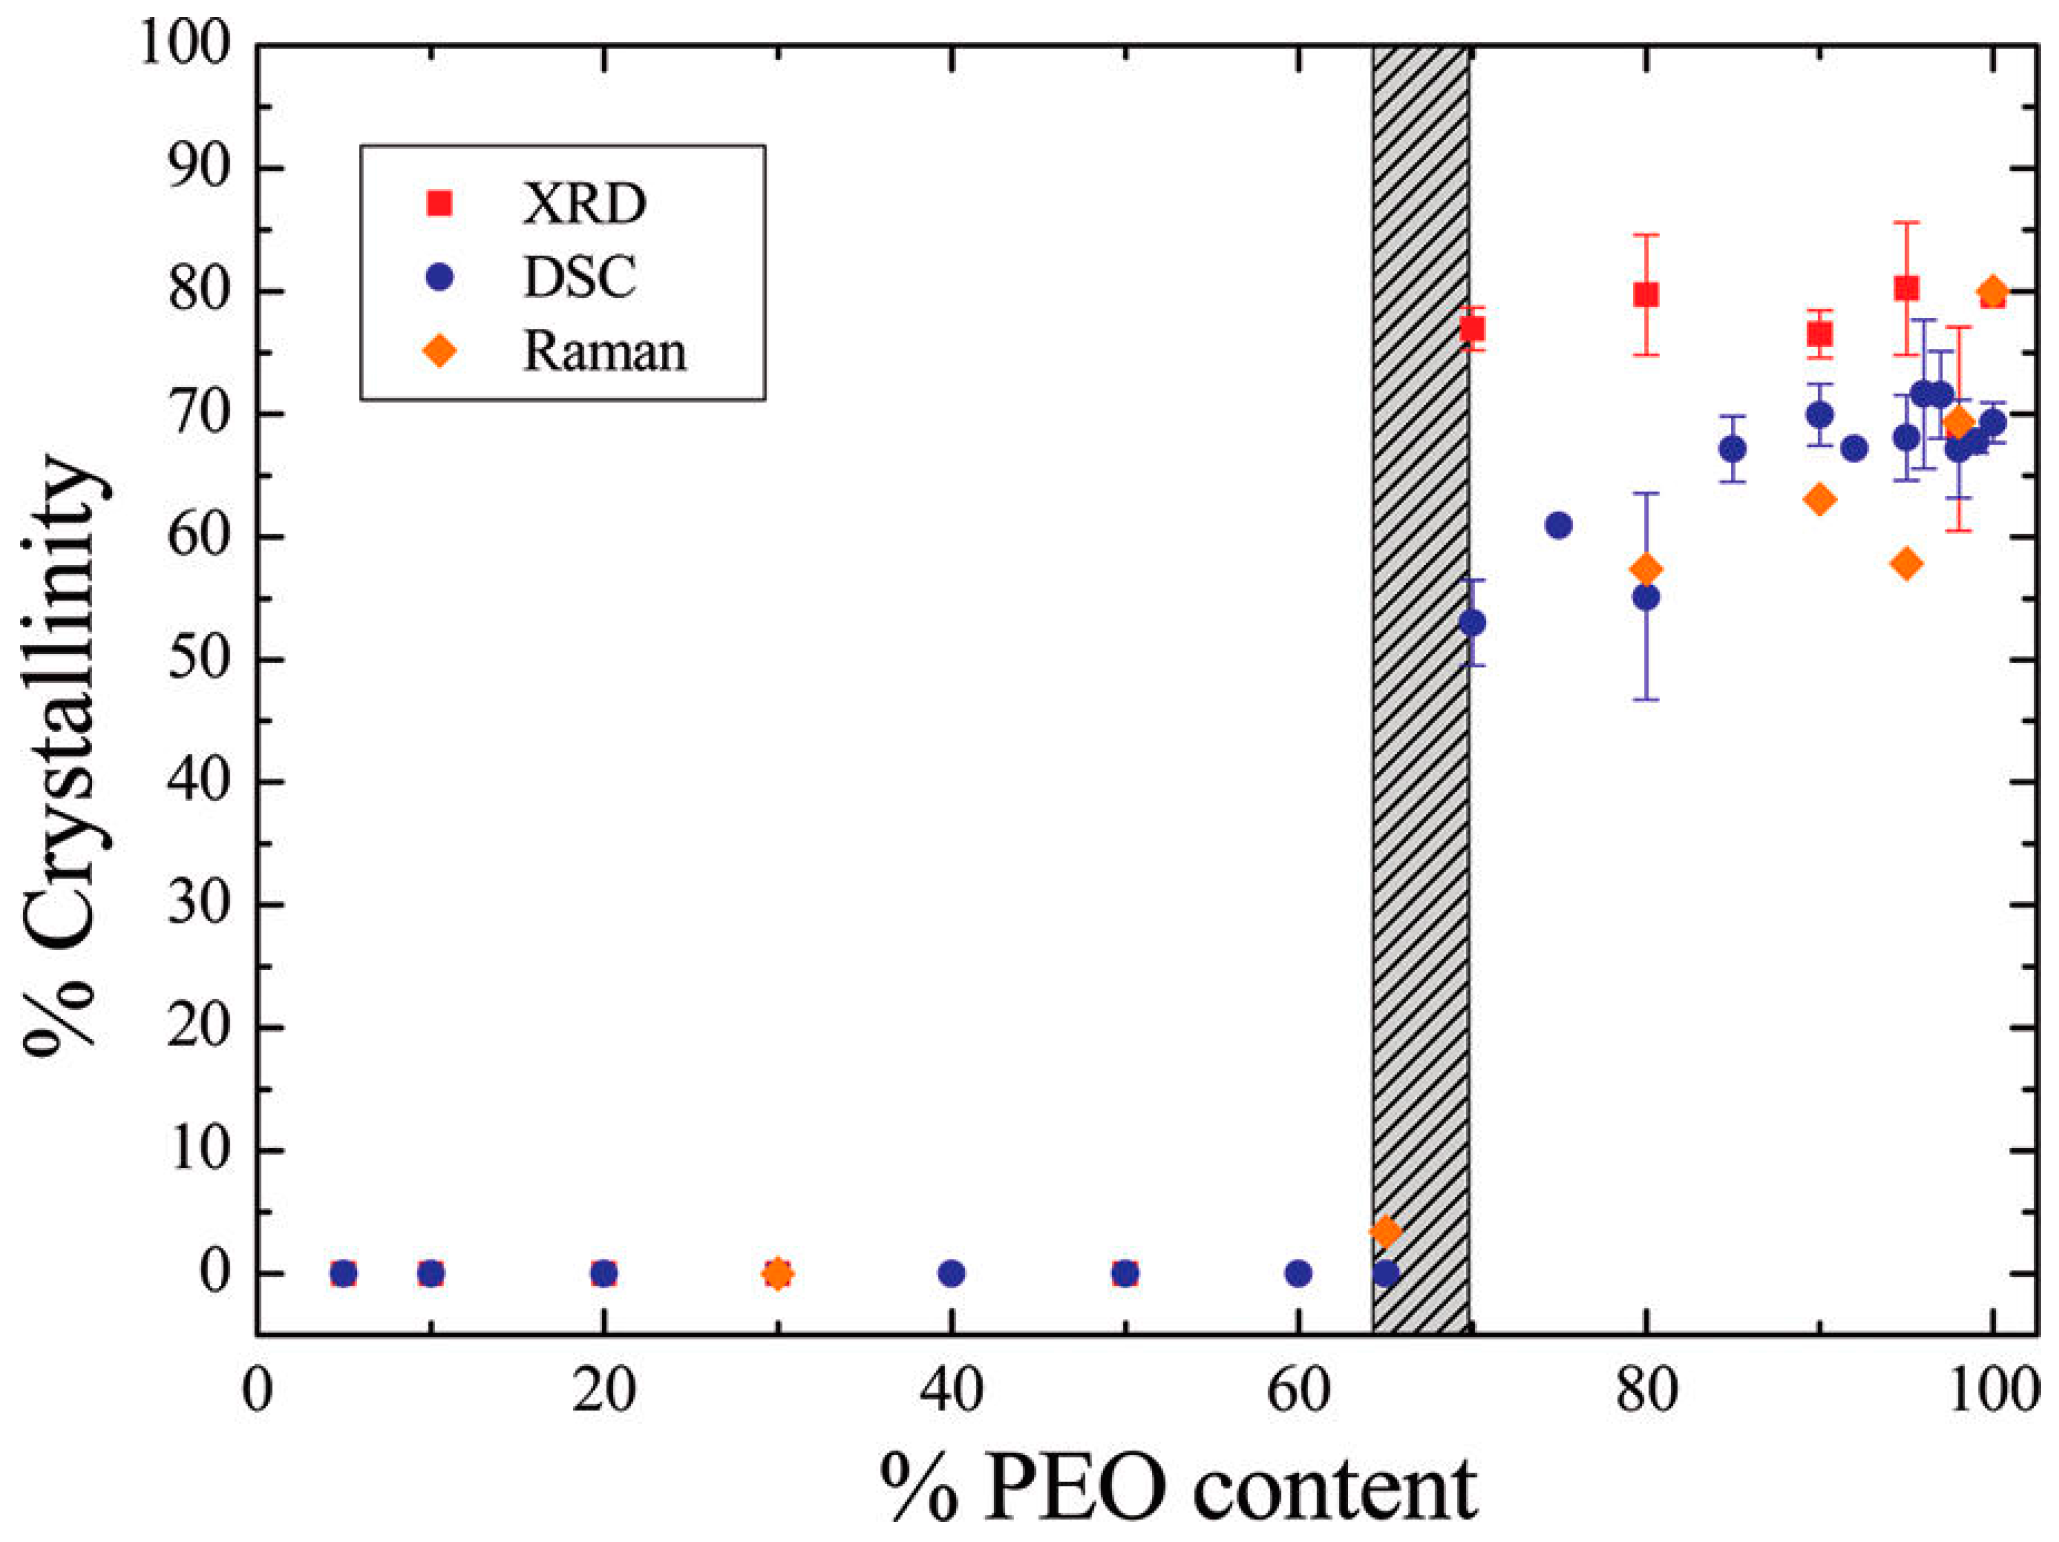
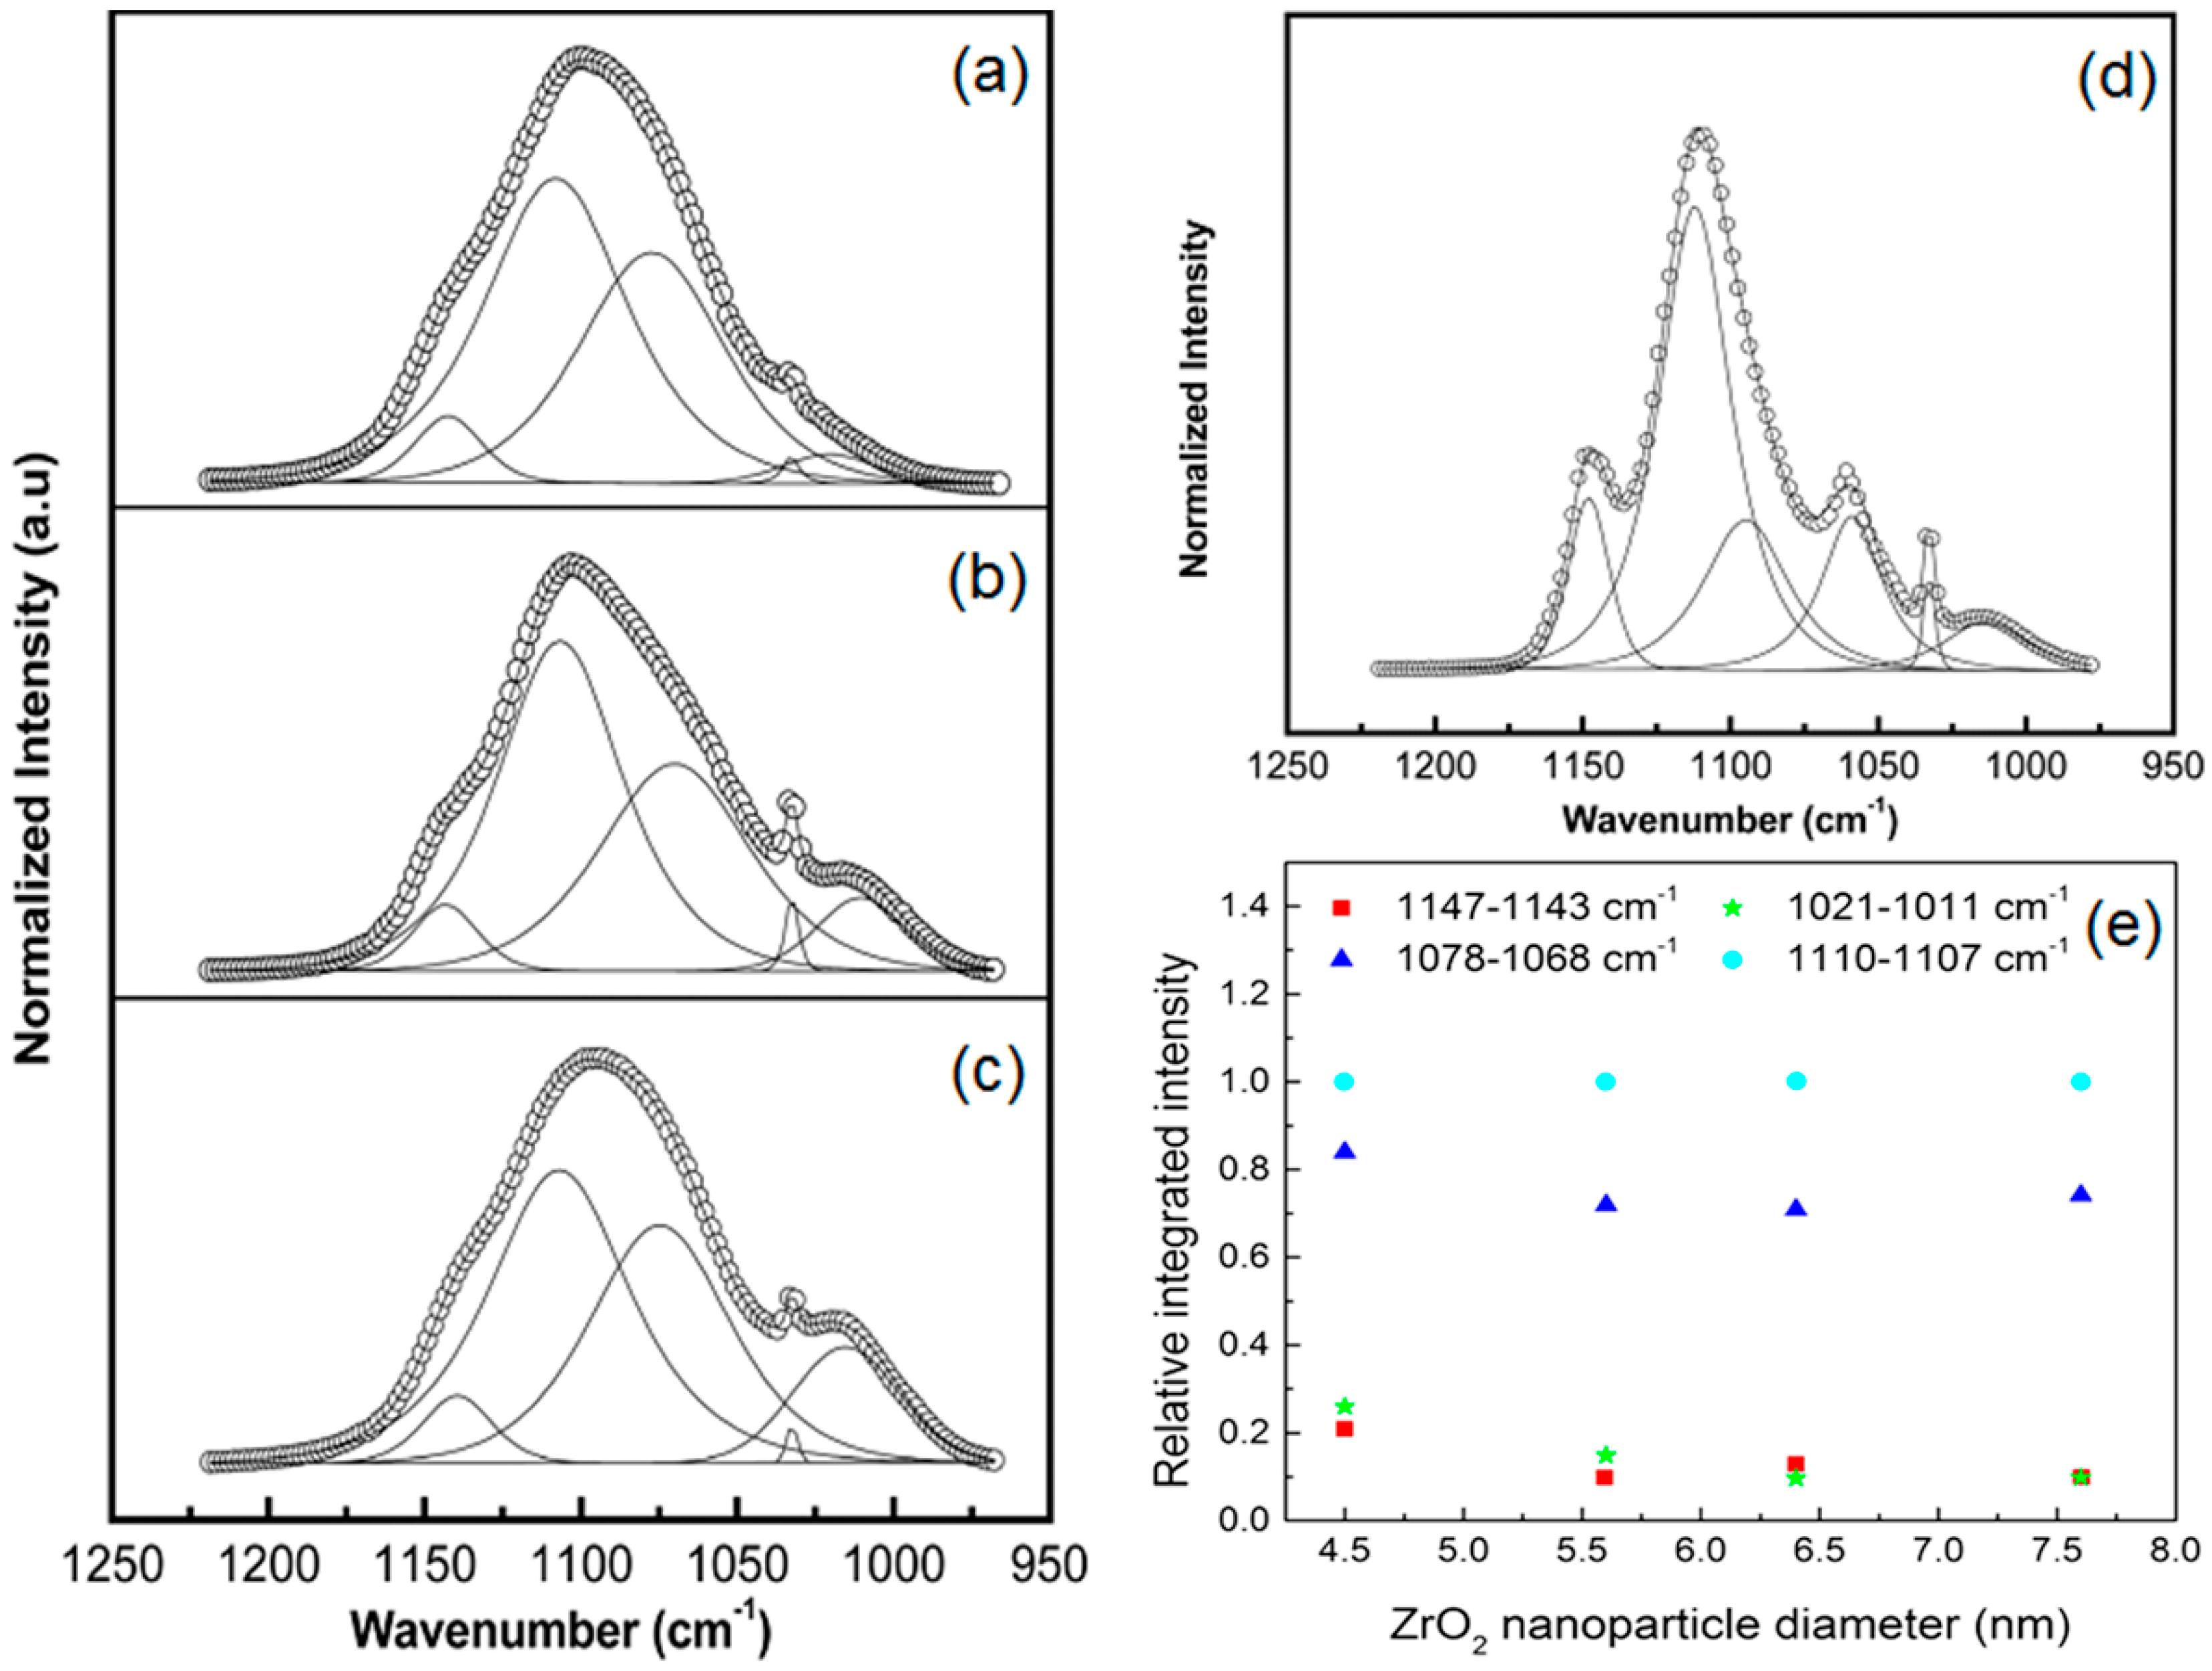
3.1. Effect of Nanoparticles on Polymer Crystallinity
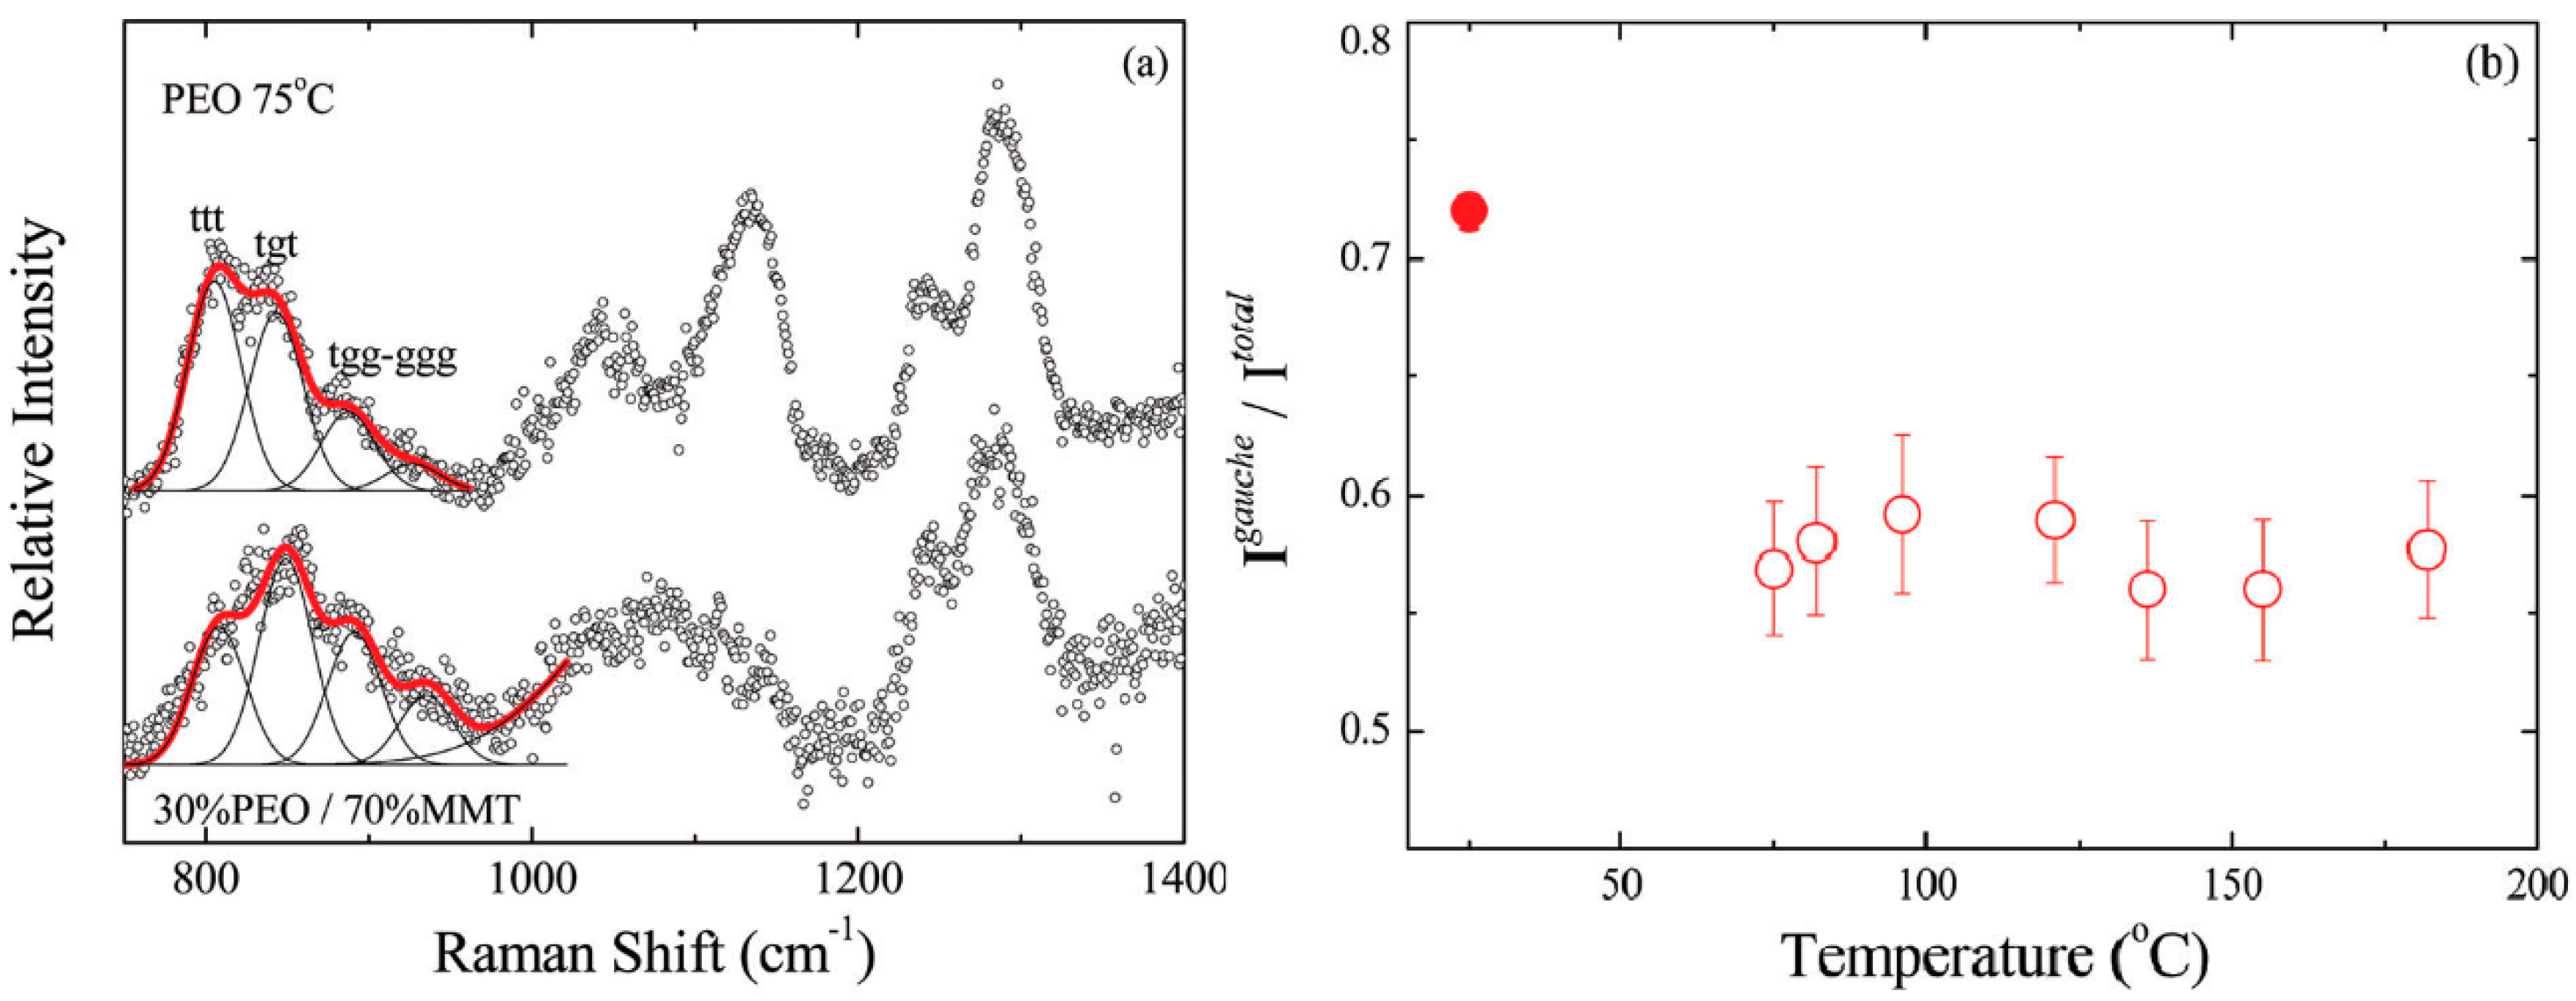
3.2. Effect of Nanoparticles on Polymer Chain Conformation
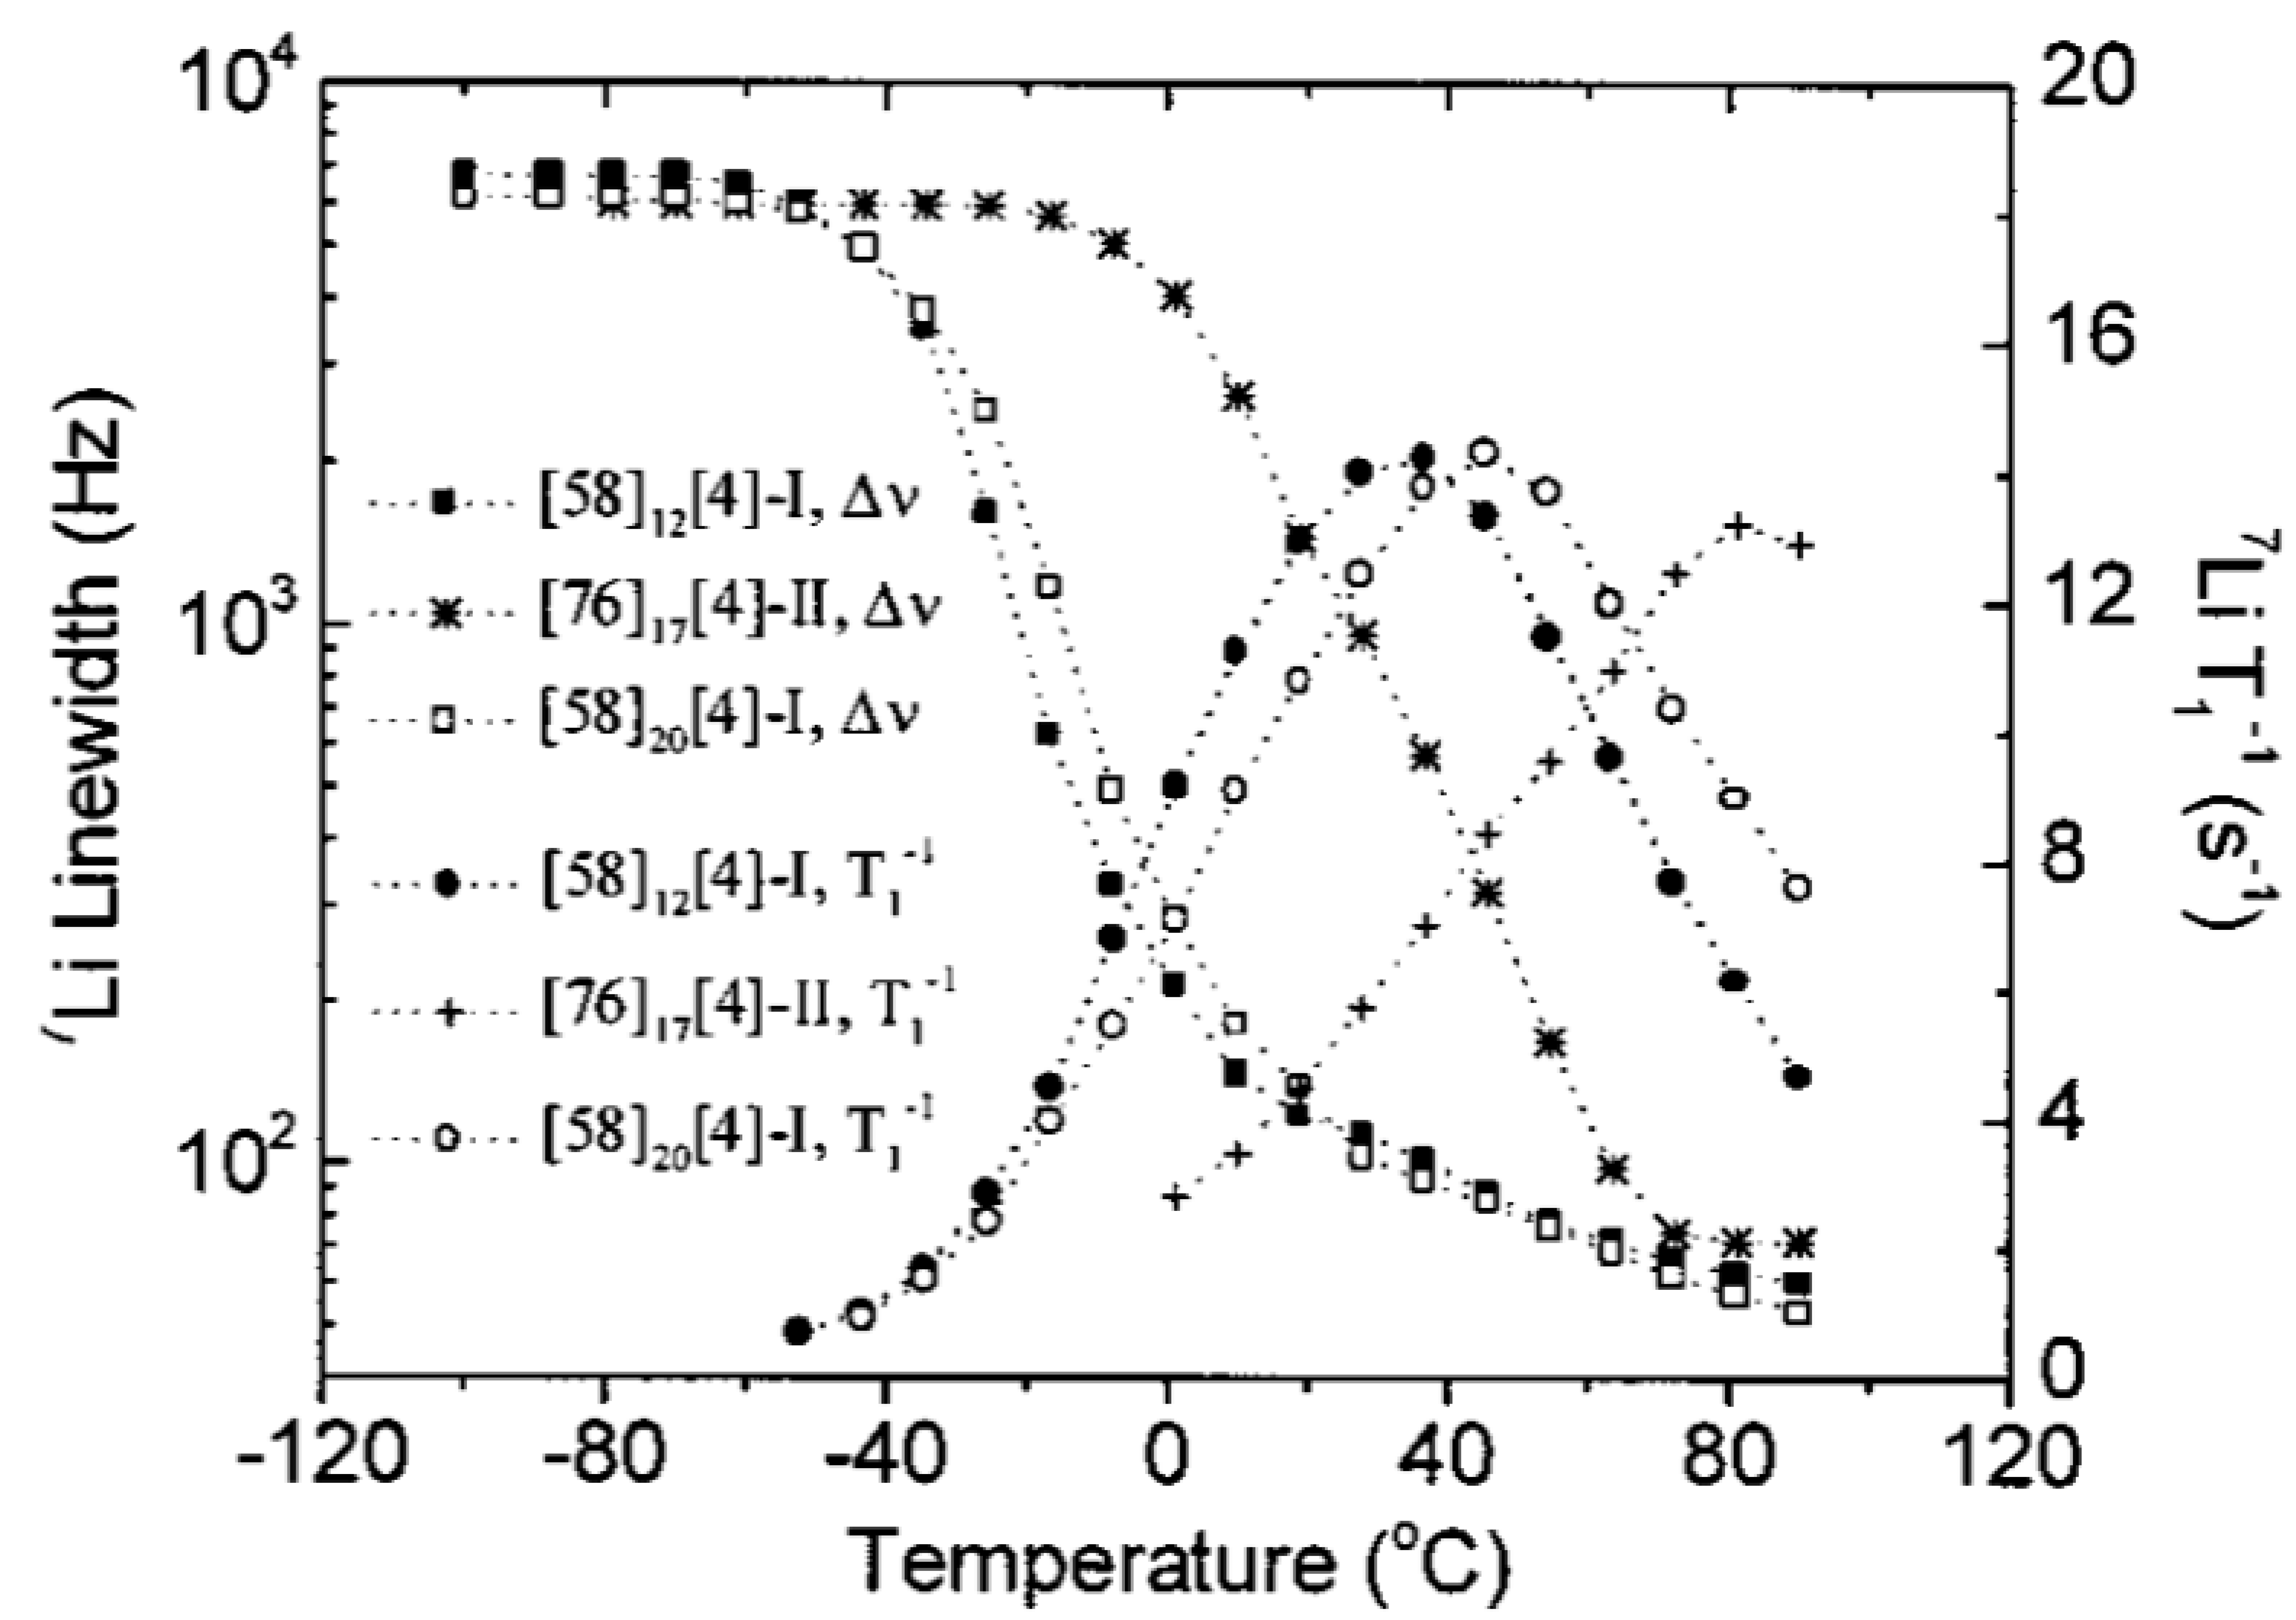
3.3. Effect of Nanoparticles on Polymer Chain Segmental Movement
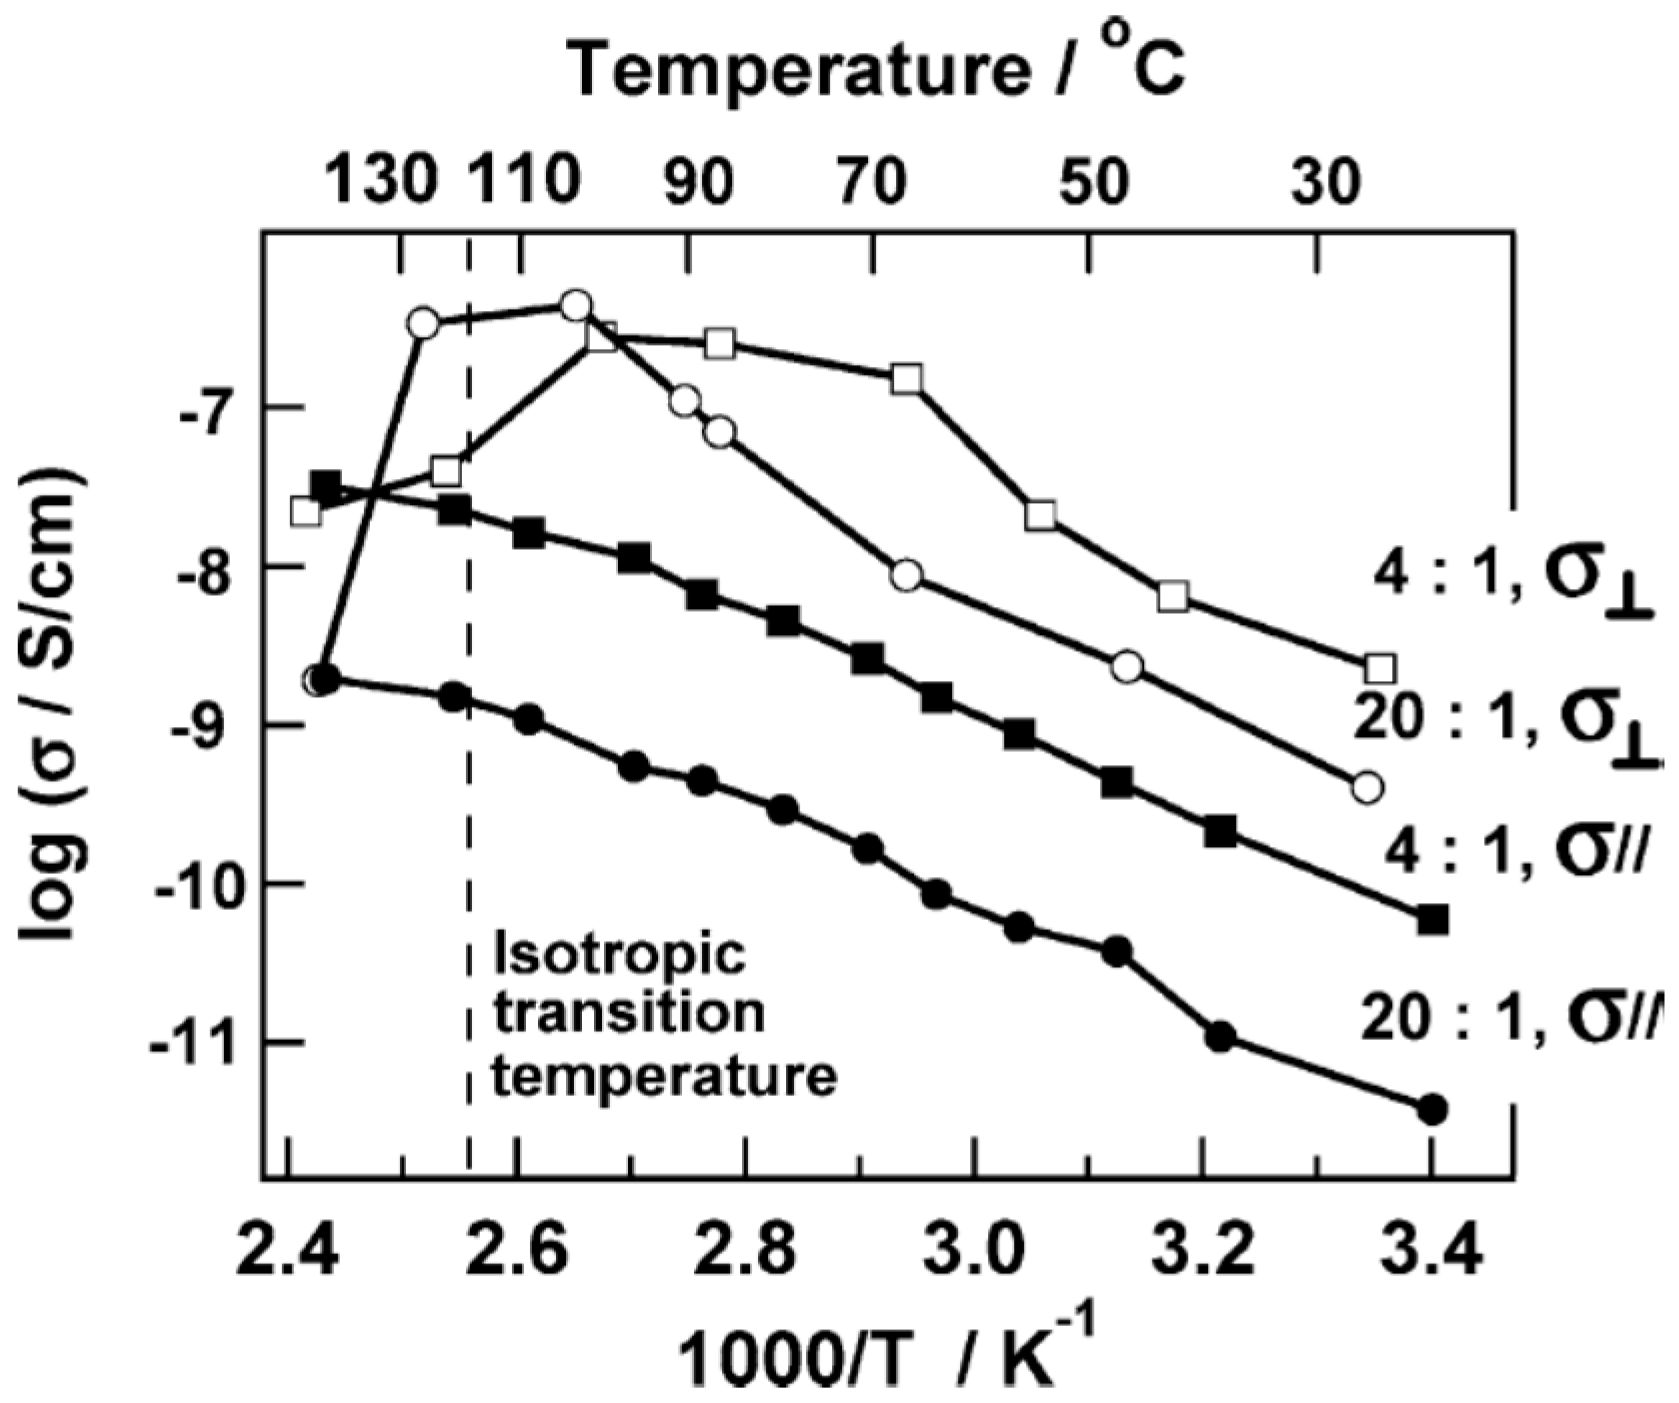
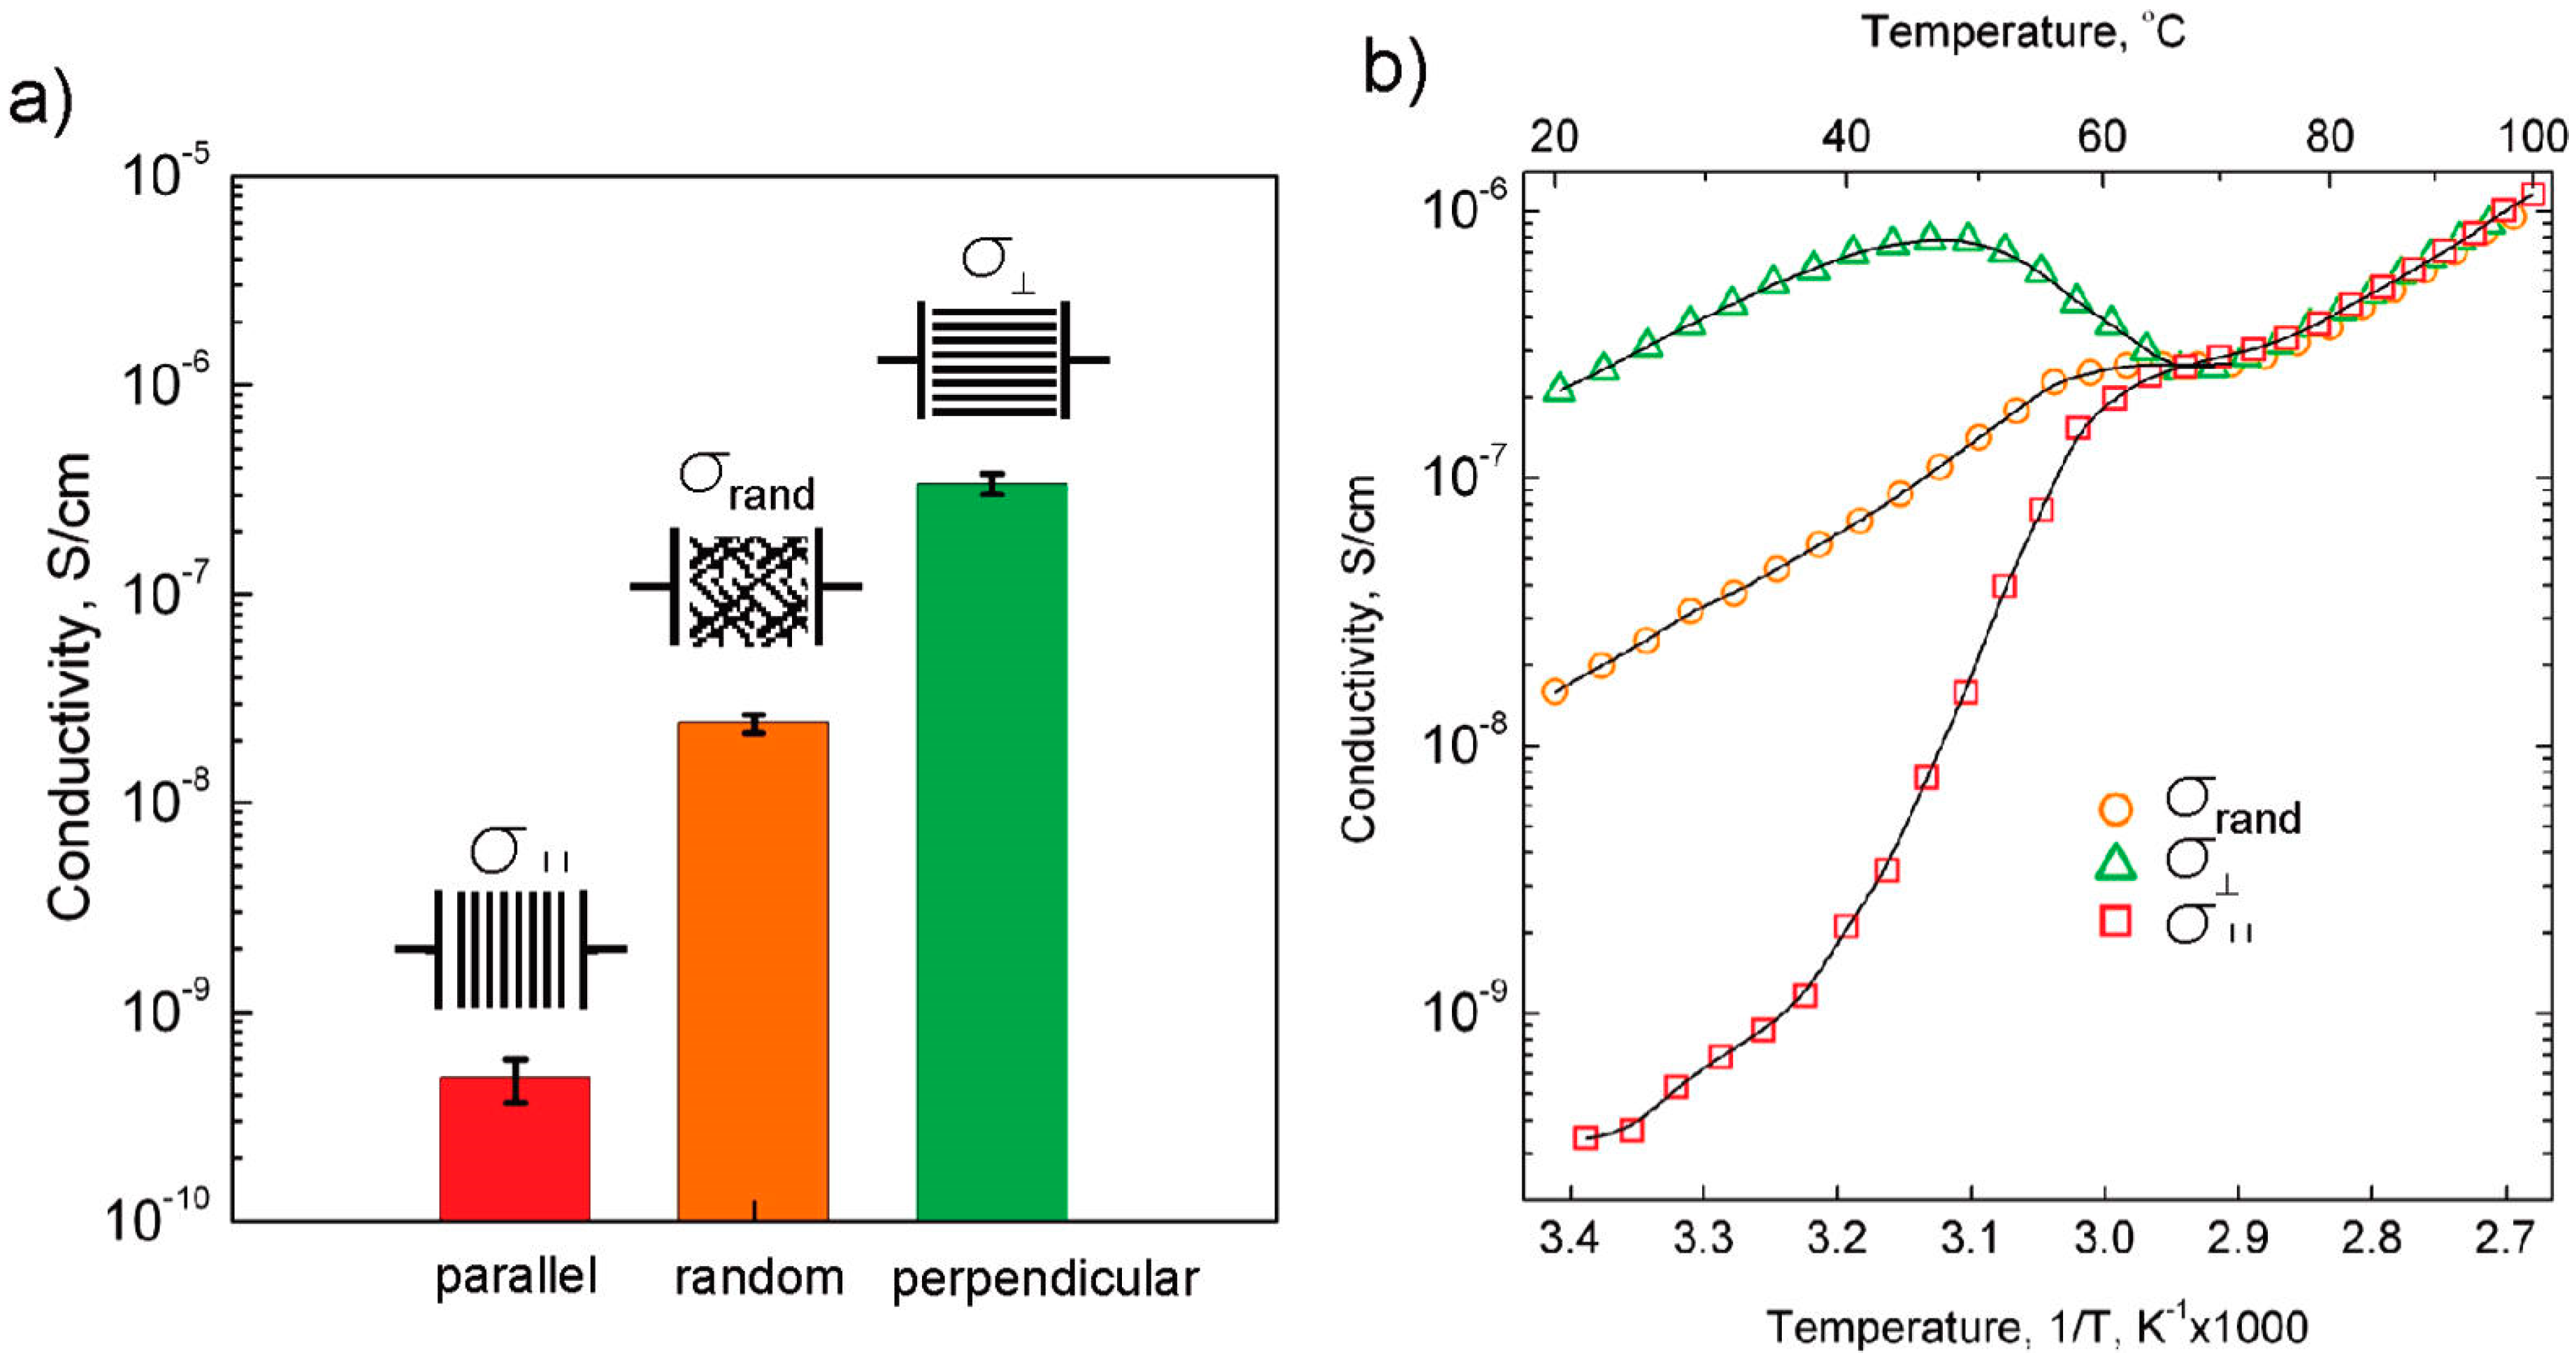
3.4. Effect of Nanoparticles on Polymer Self-Assembly and Anisotropic Conductivity
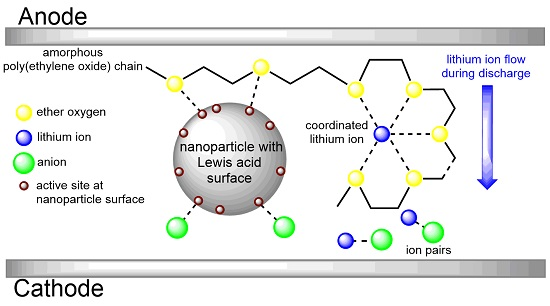
3.5. Interaction of Nanoparticles with Polymer Chains
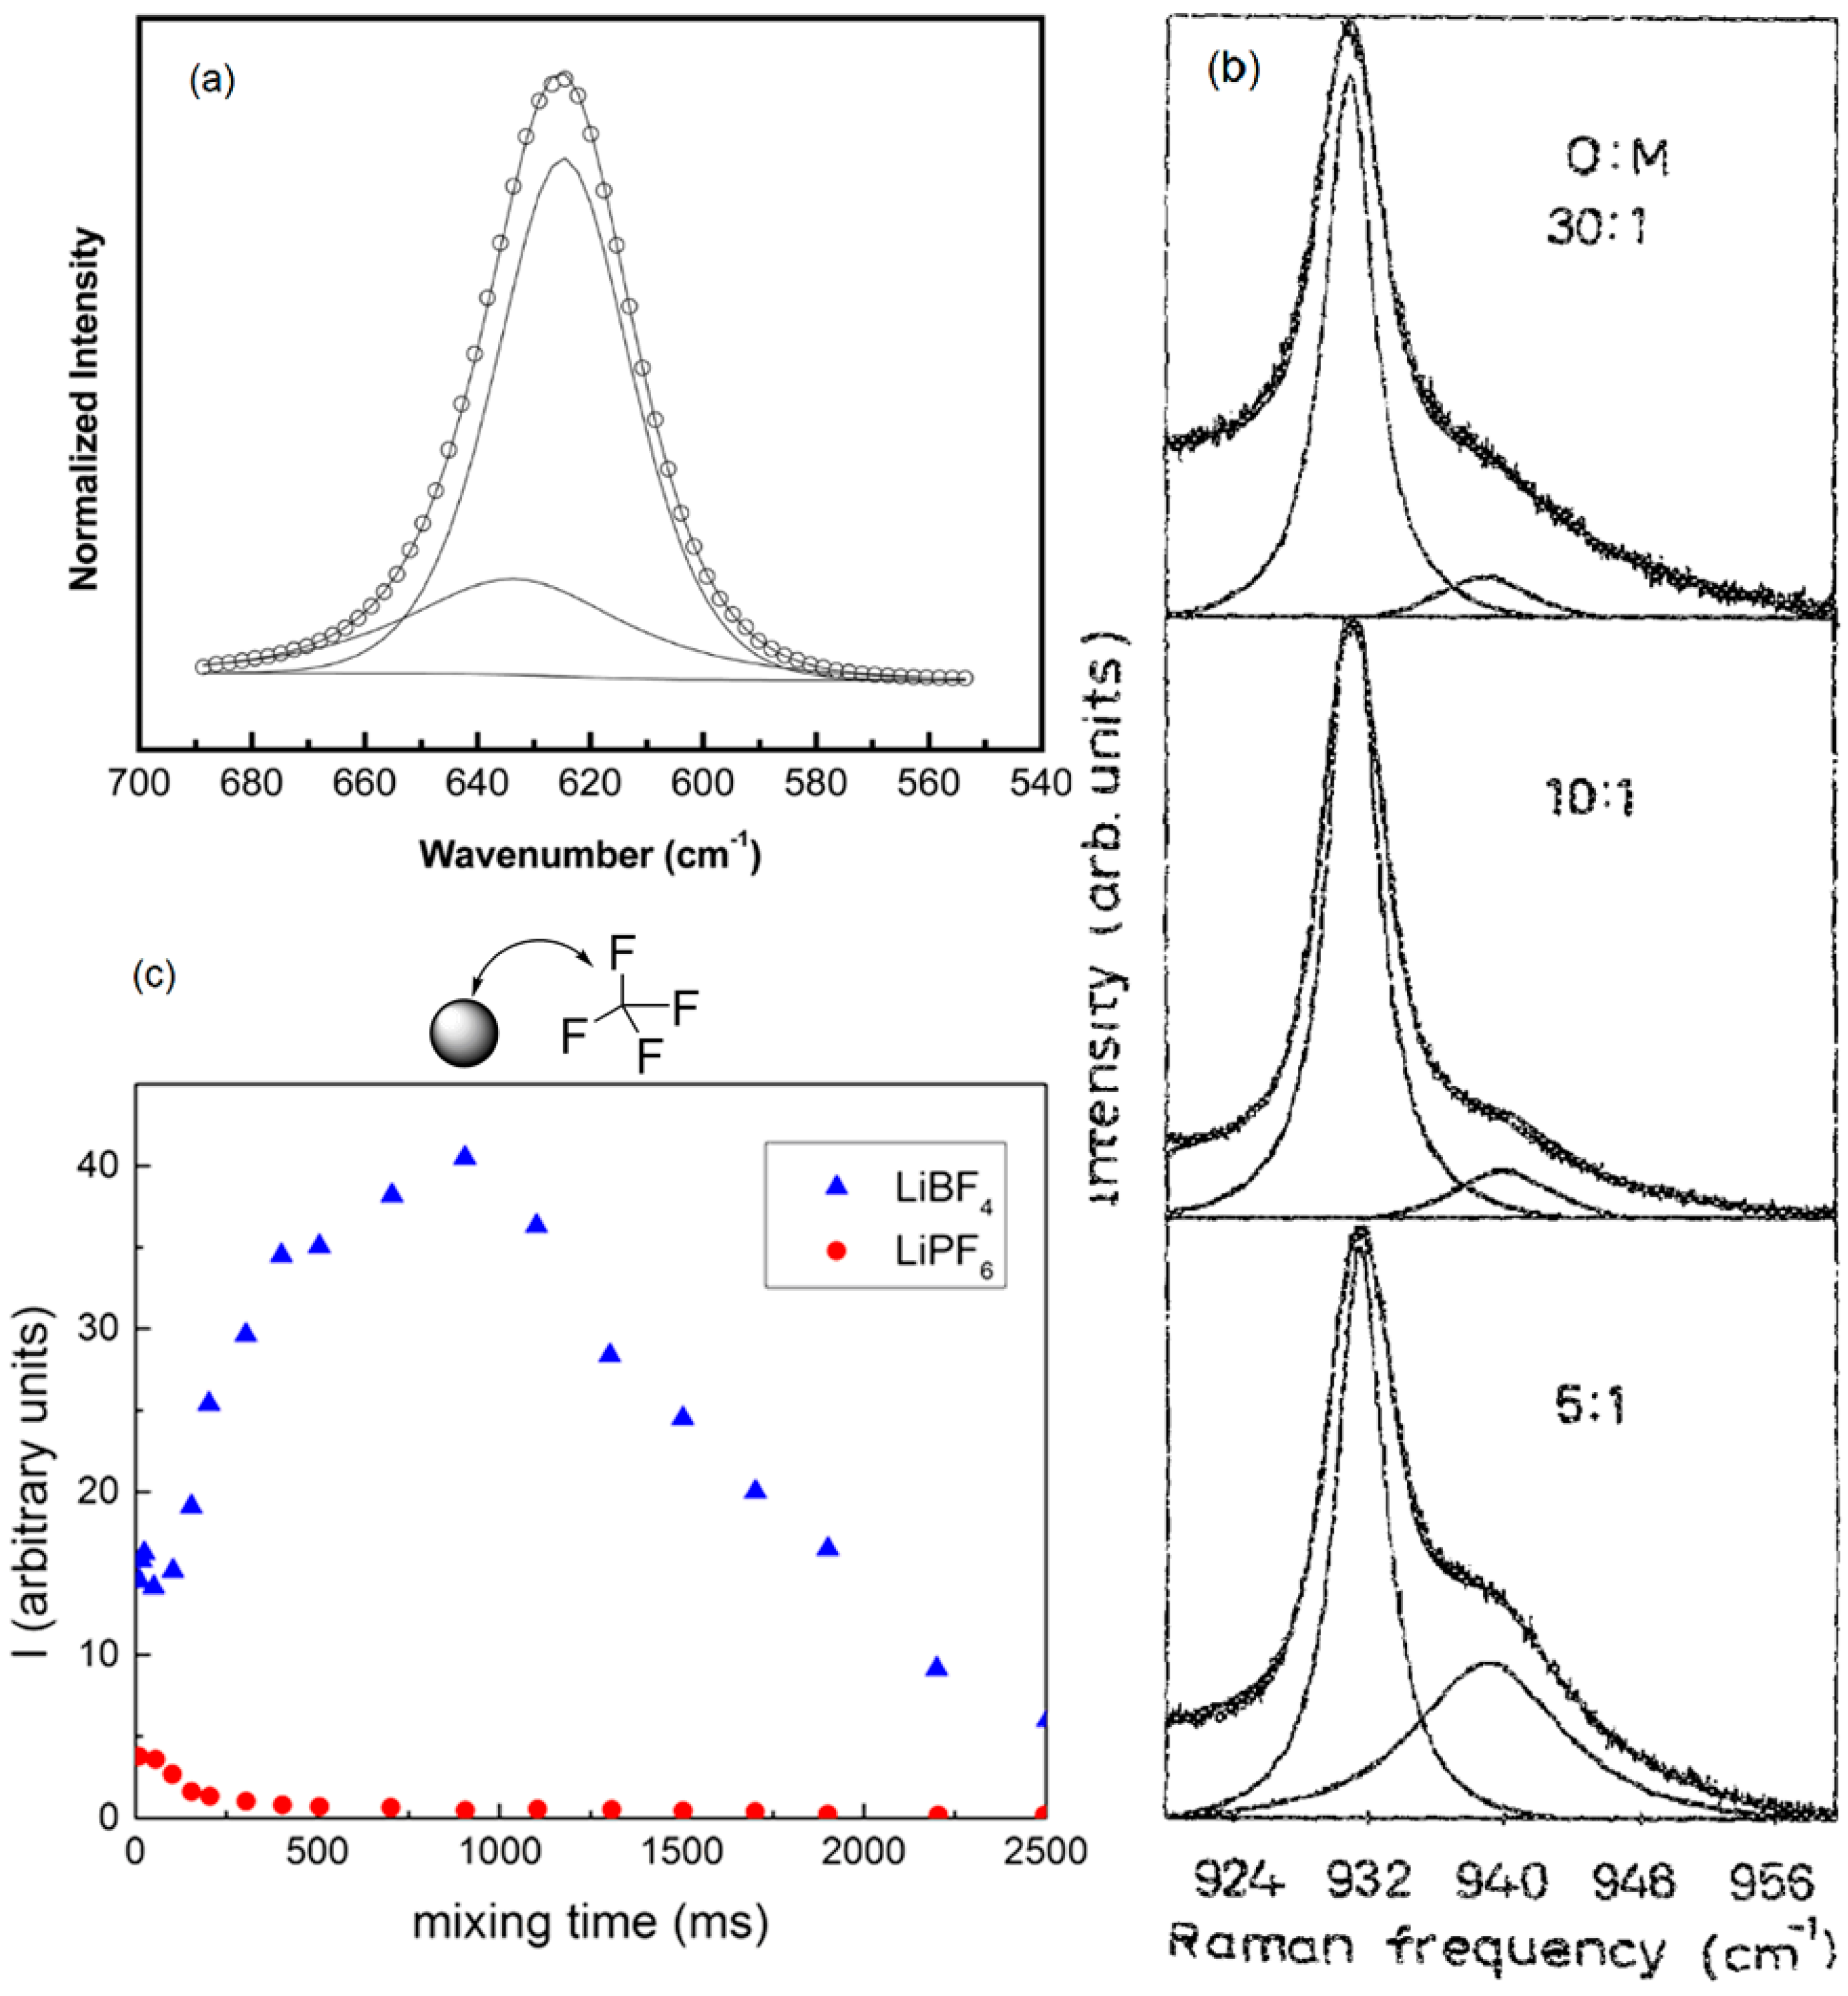
3.6. Single Ions versus Ion Pairs and Ion Aggregates within Composite Polymer Electrolytes
3.7. Effect of Nanoparticles on Transference Number of Composite Polymer Electrolytes
4. Nanoparticle Additives Affect the Polymer Electrolyte Dielectric Properties
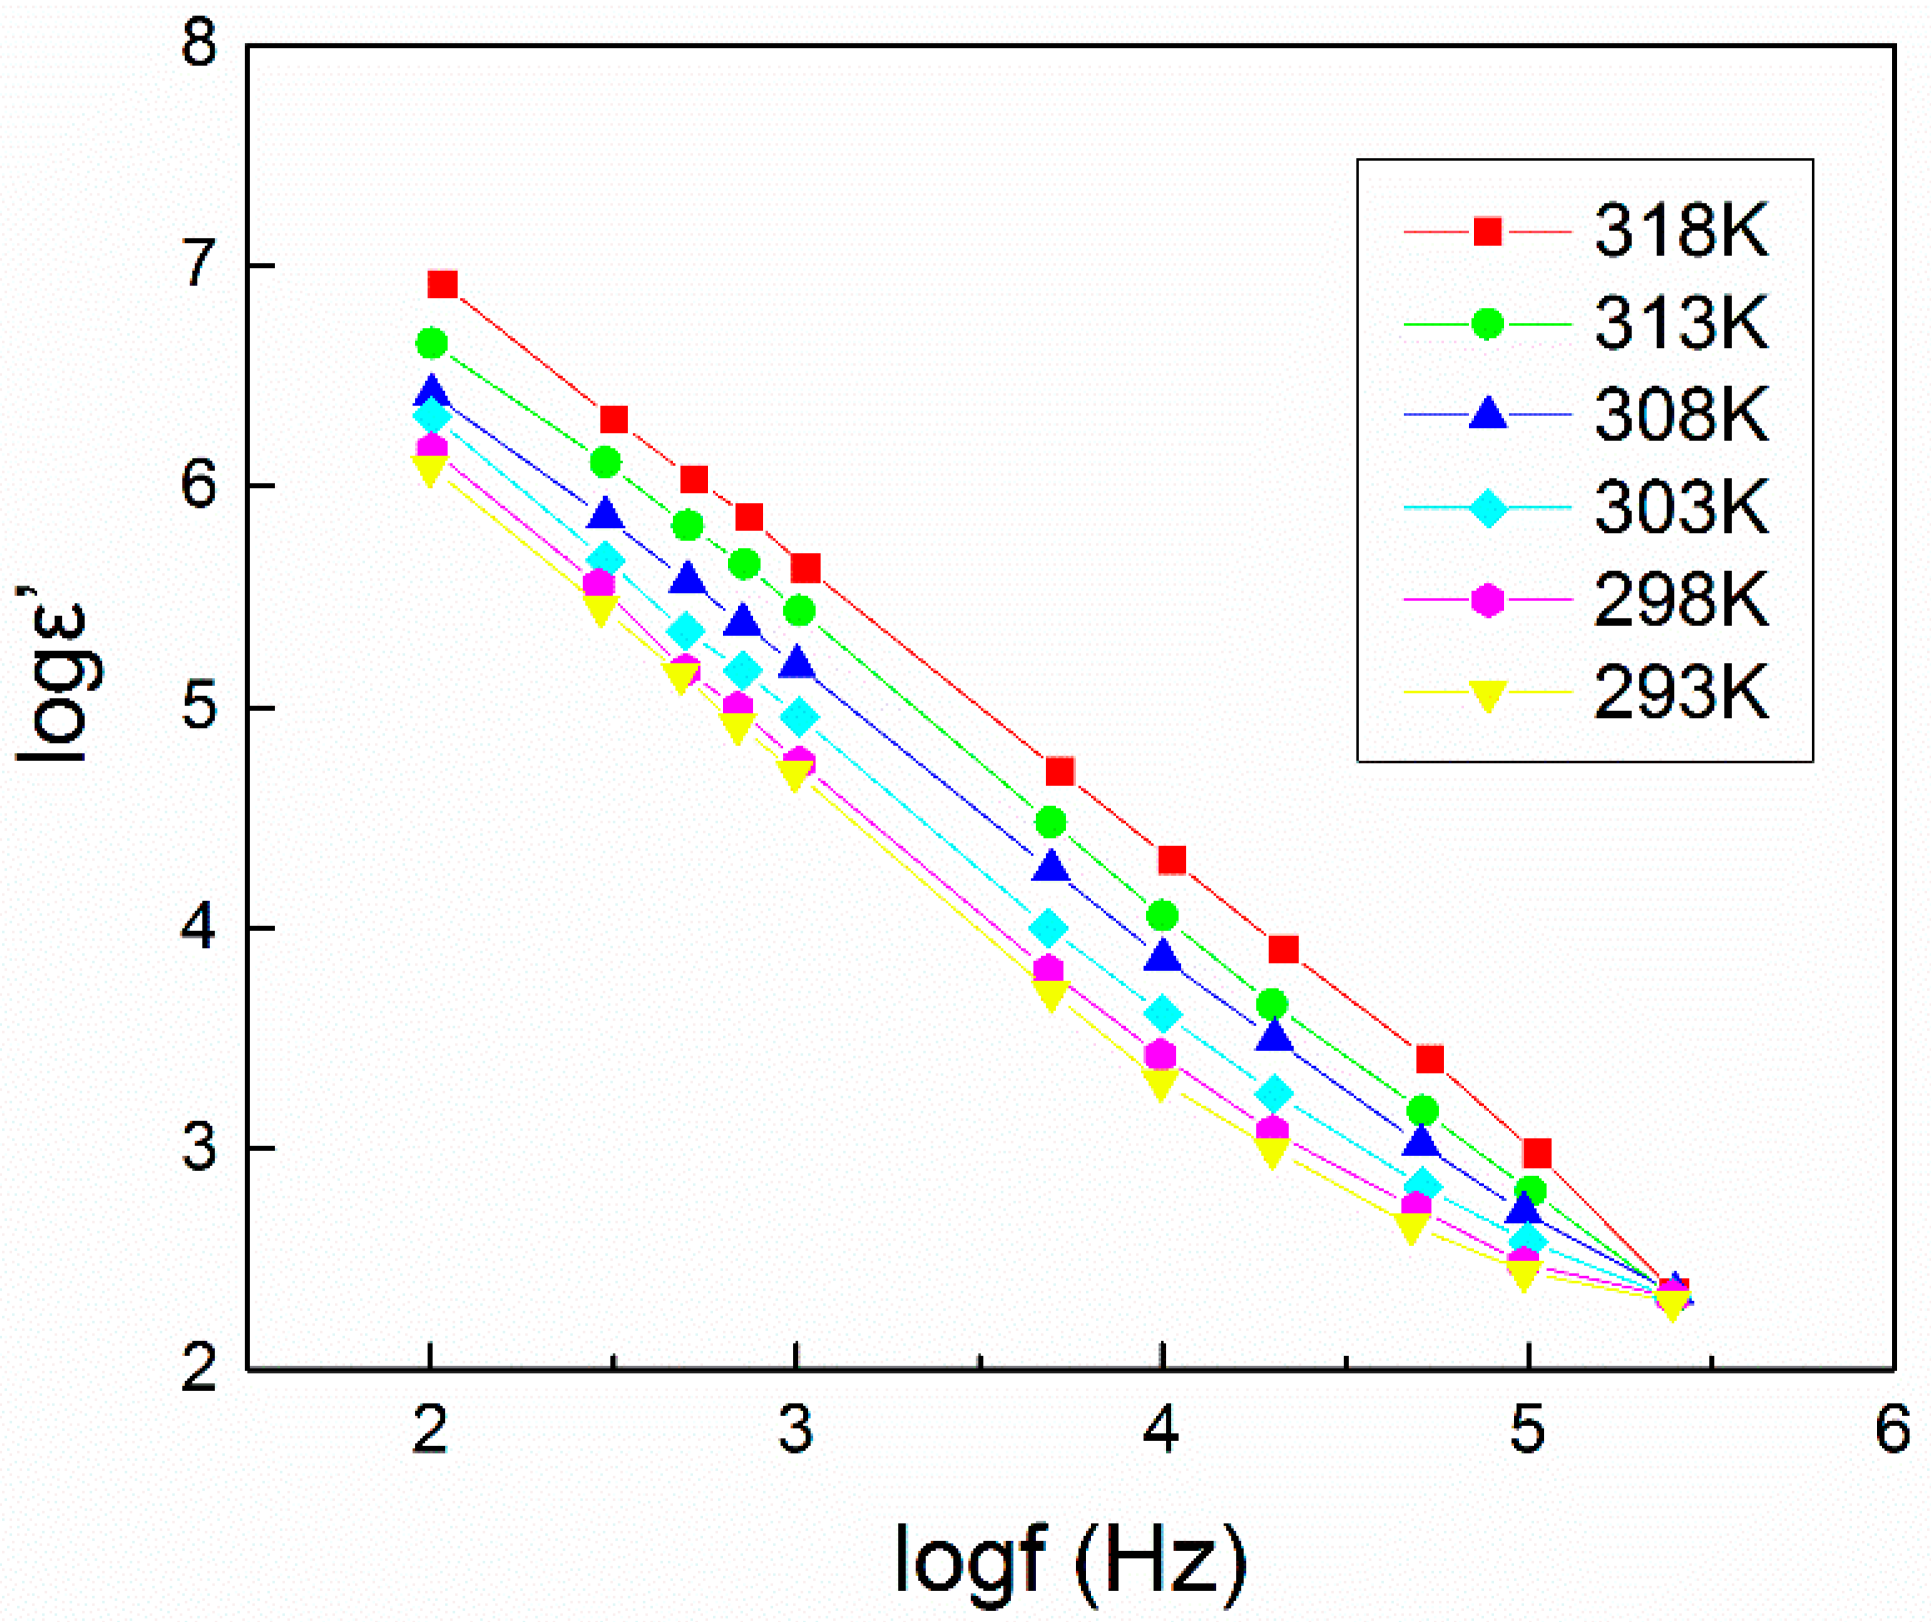
4.1. Dielectric Constant (εr or ε’) and Dielectric Loss (εi or ε”)
4.2. Dielectric Relaxation Strength (Δε), Electrical Modulus (M) and Tangent Loss (tanδ)
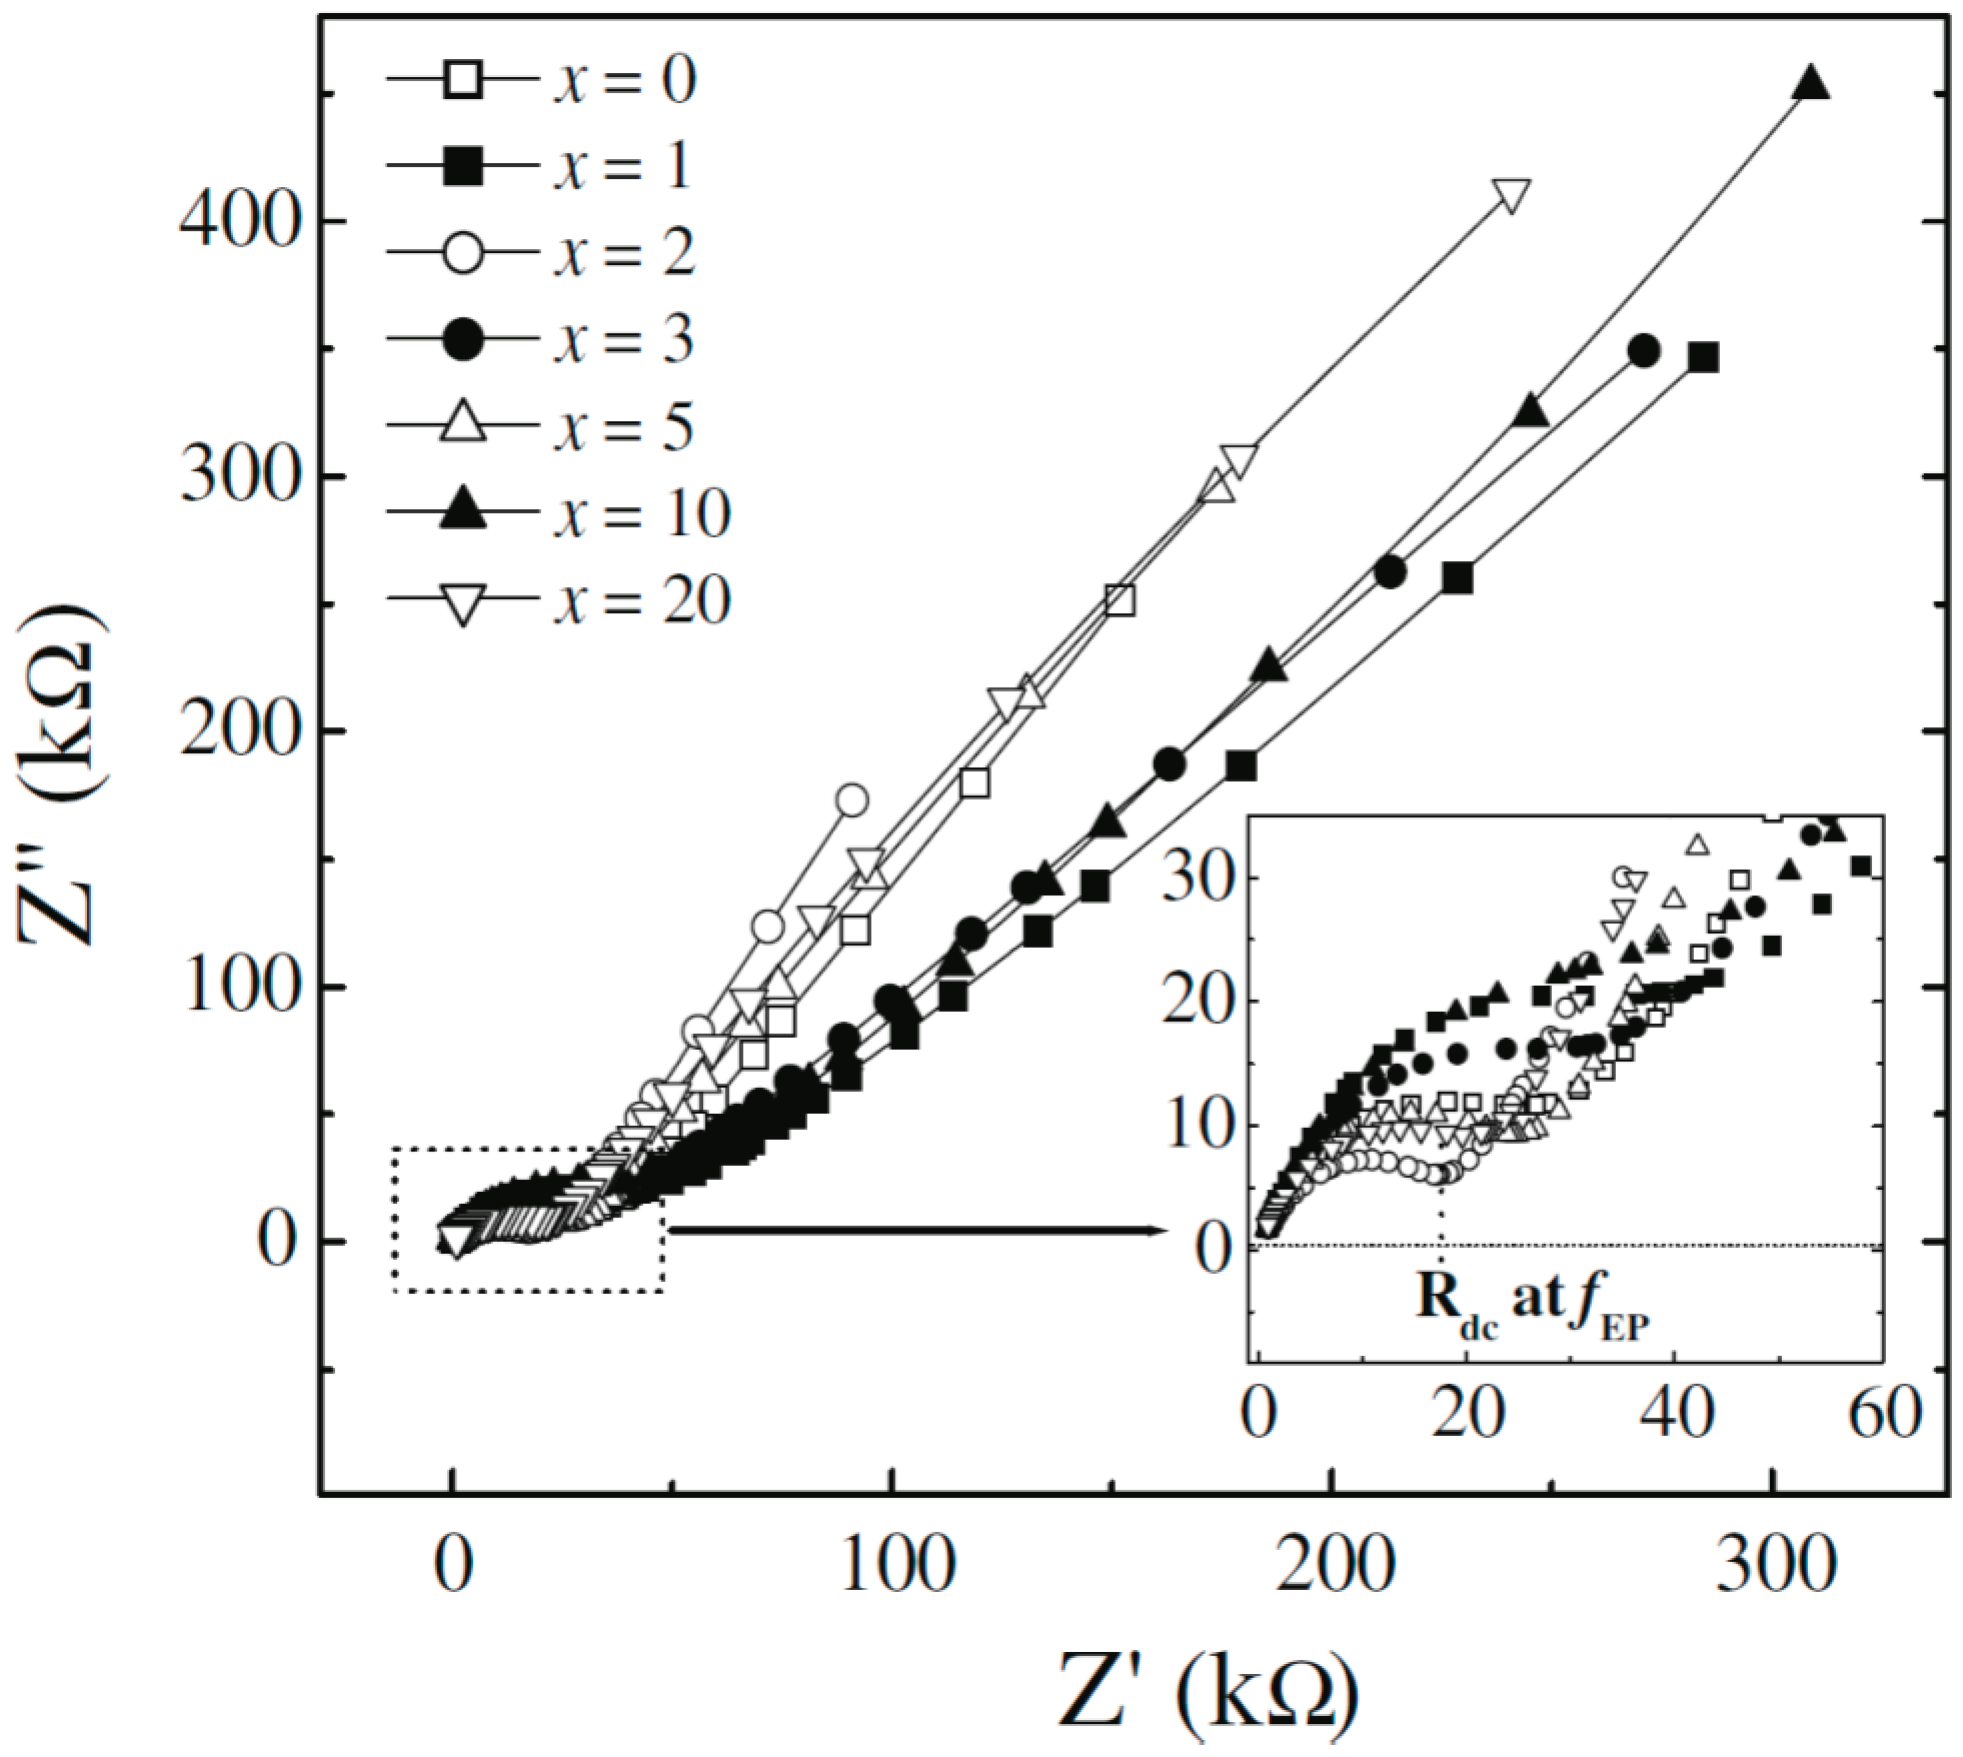
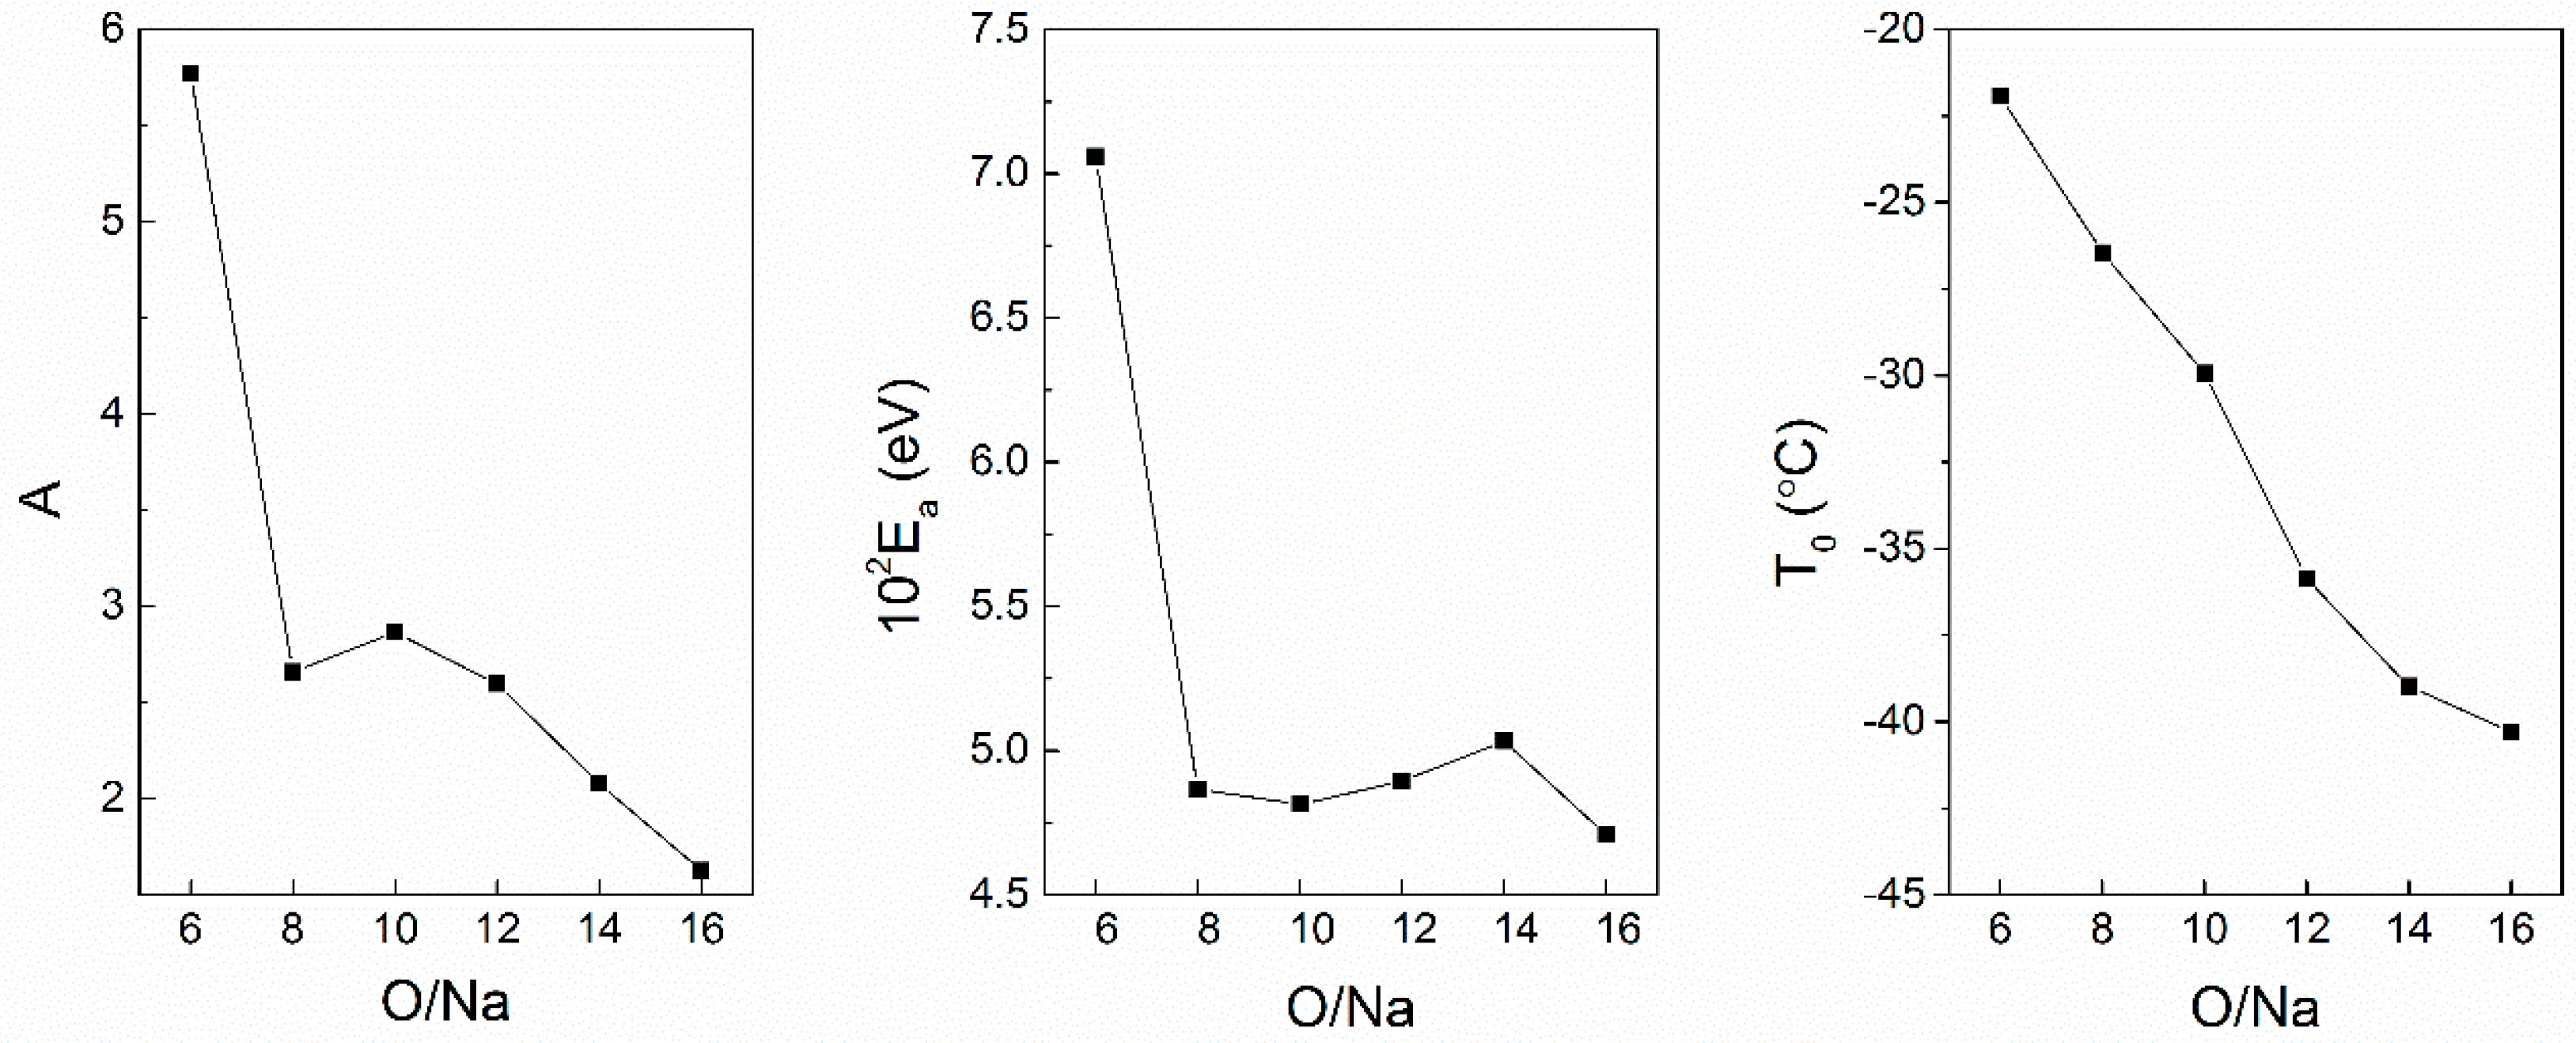
4.3 AC/DC Conductivity and Impedance Spectroscopy
5. Nanoparticle Additives Affect the Polymer Electrolyte Thermal and Mechanical Properties
5.1. Thermal Properties
5.2. Mechanical Properties
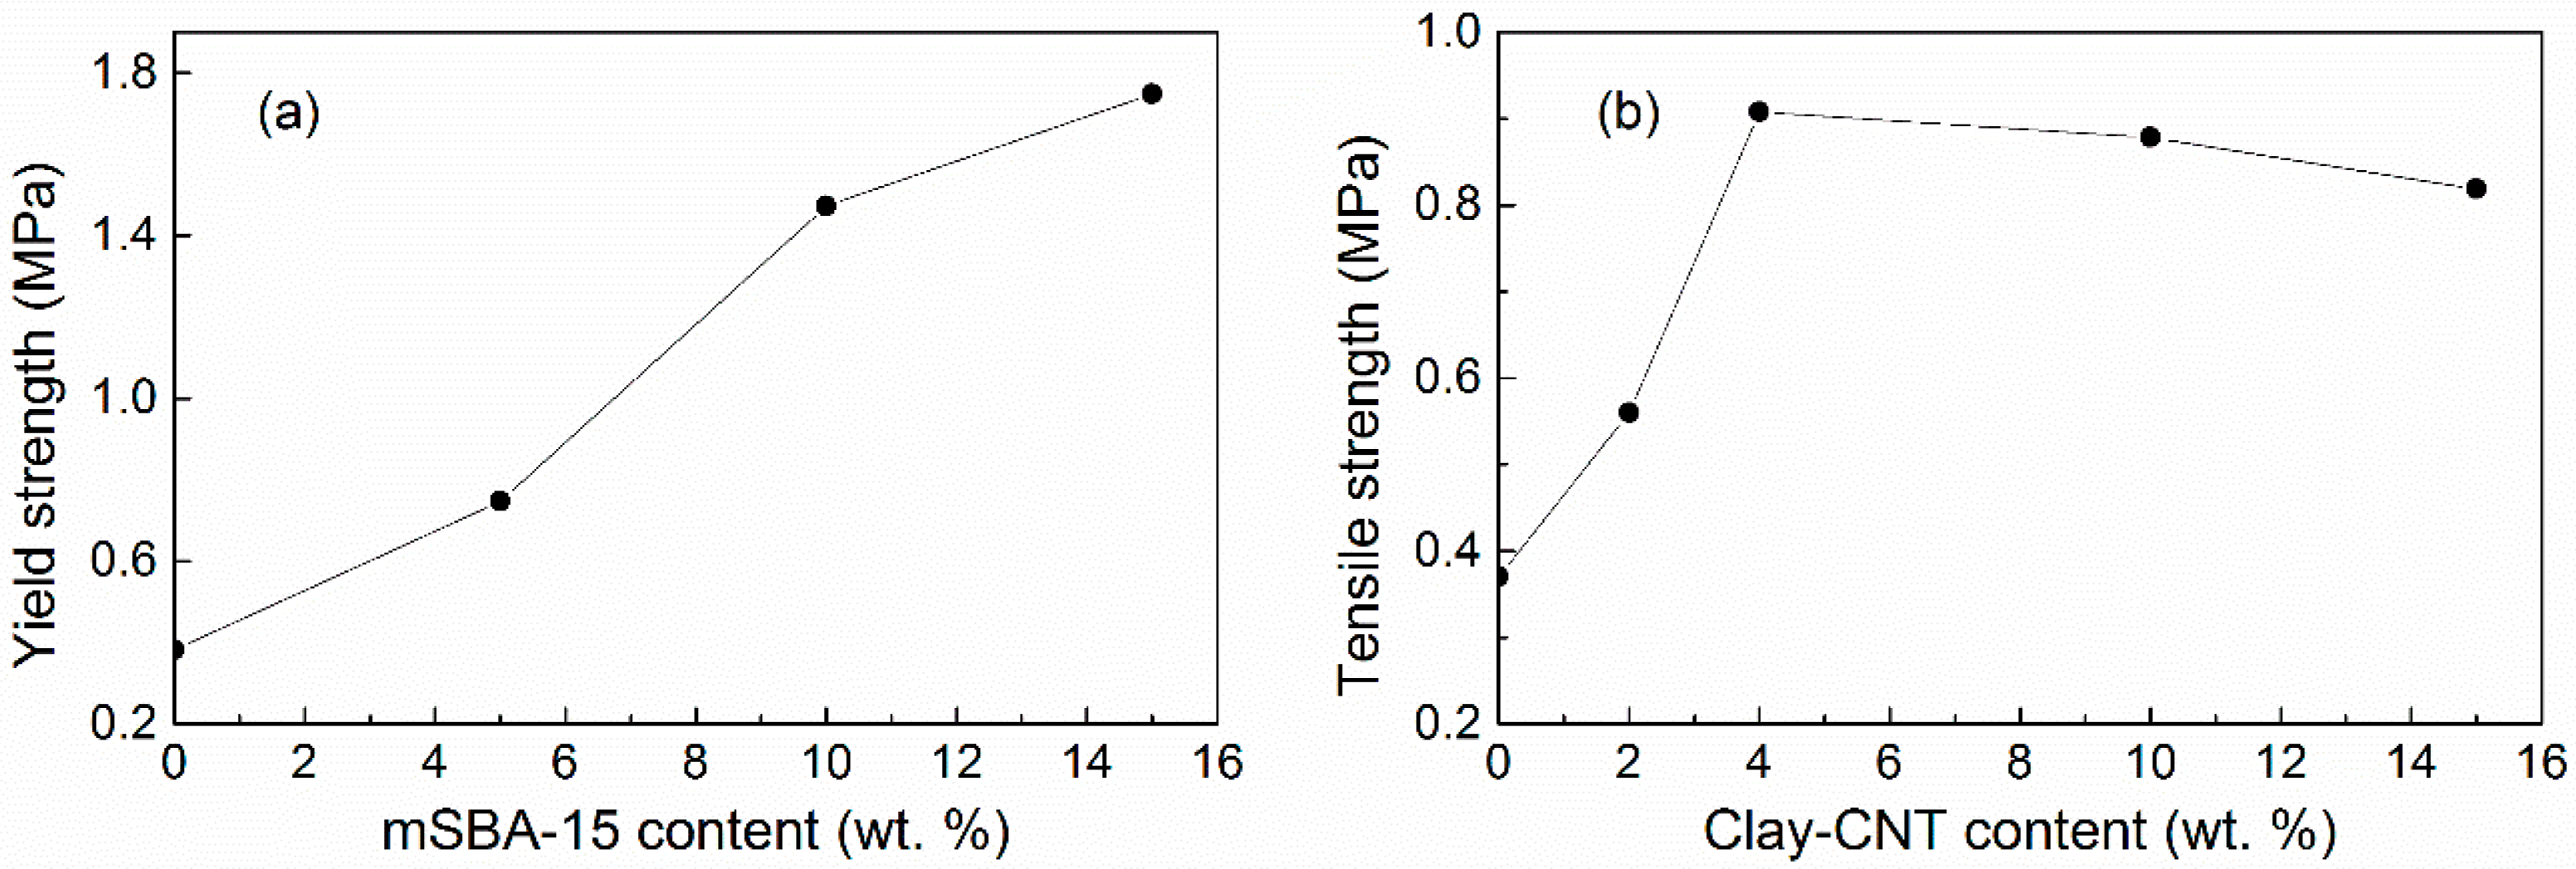
5.2.1. Tensile Strength and Yield Strength
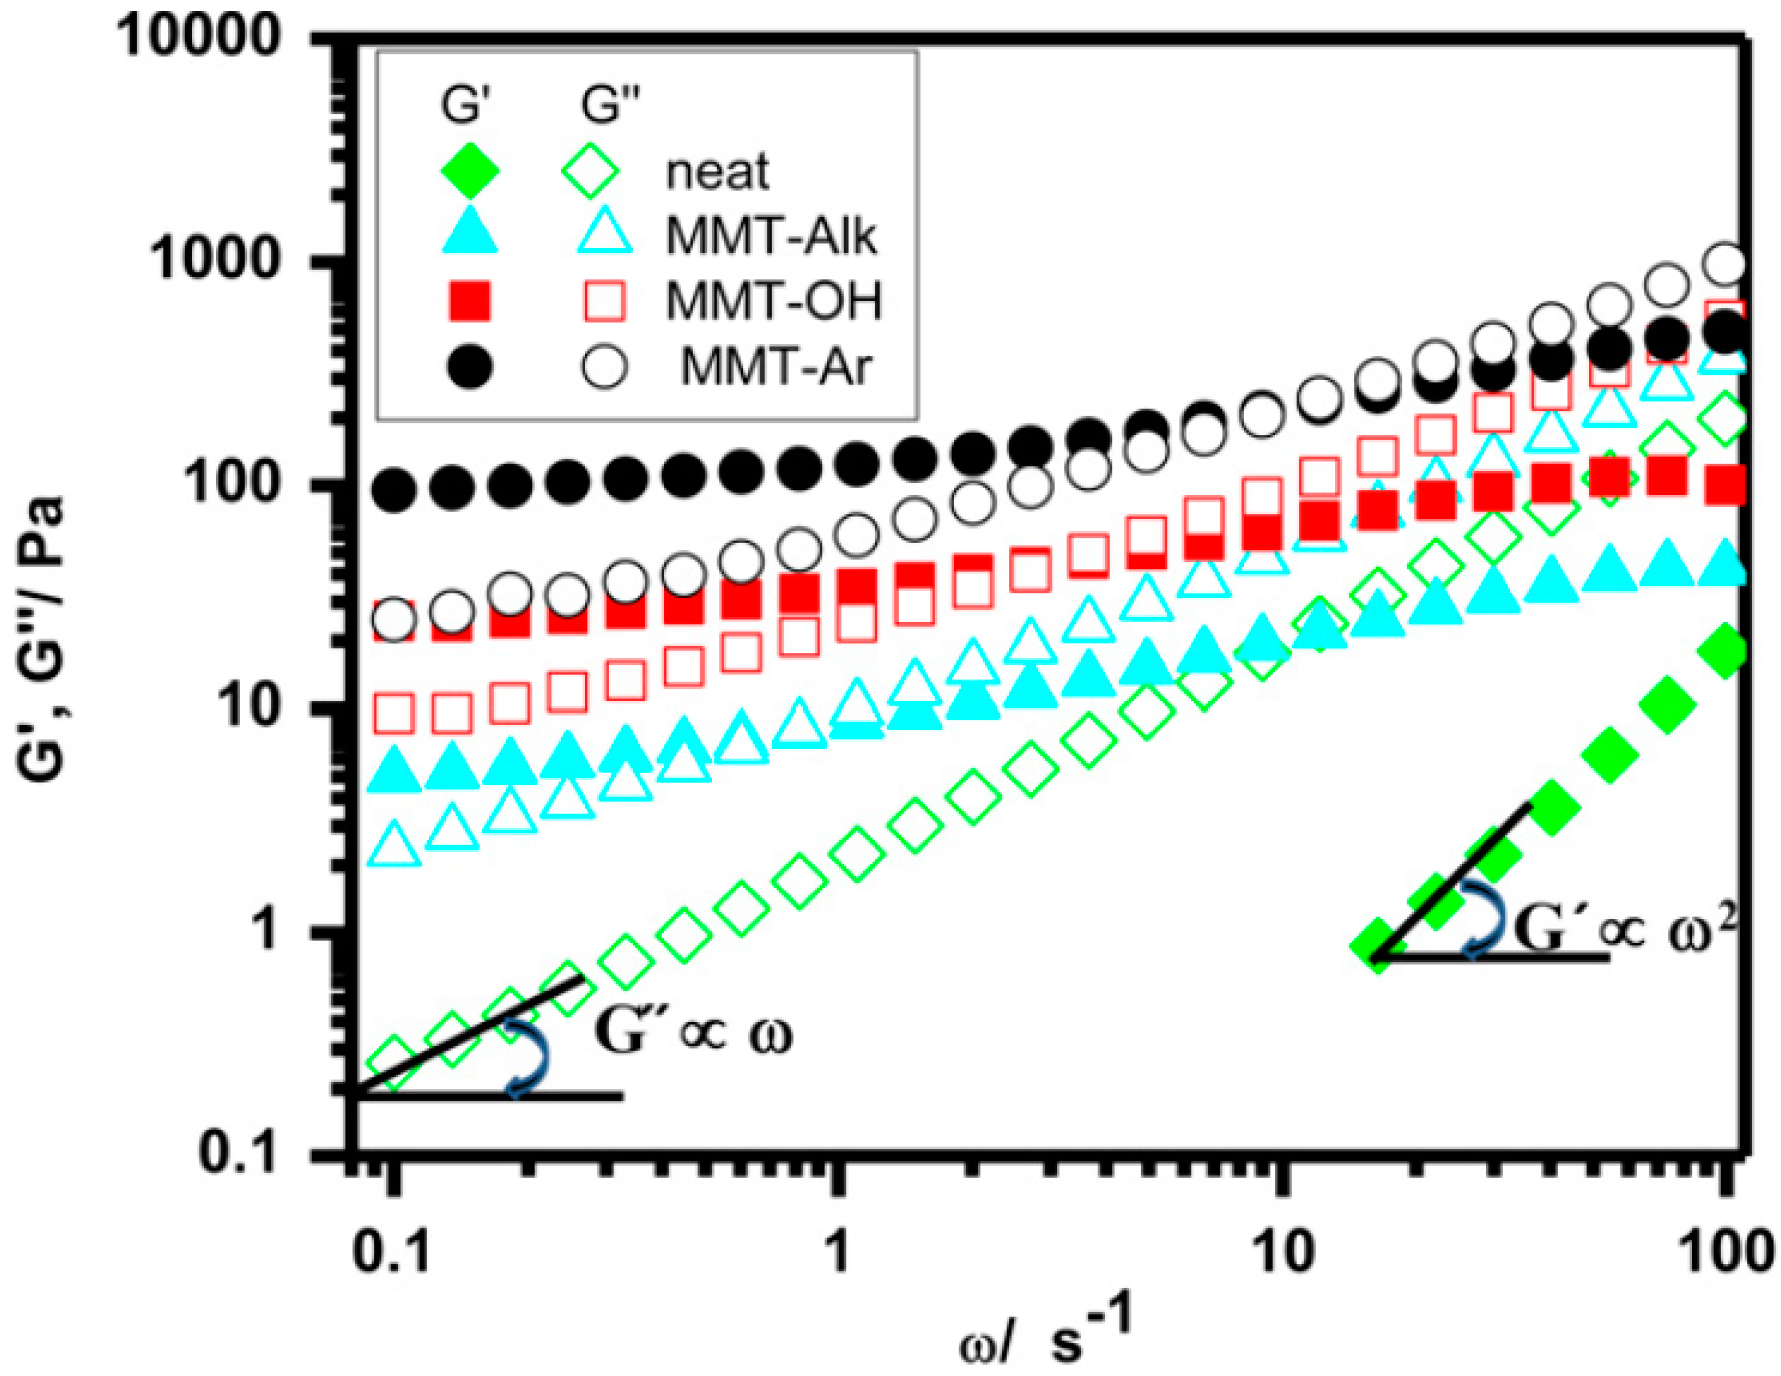
5.2.2. Rheology, Elastic and Viscous Modulus
6. Processing Conditions Affect Composite Polymer Electrolyte Properties
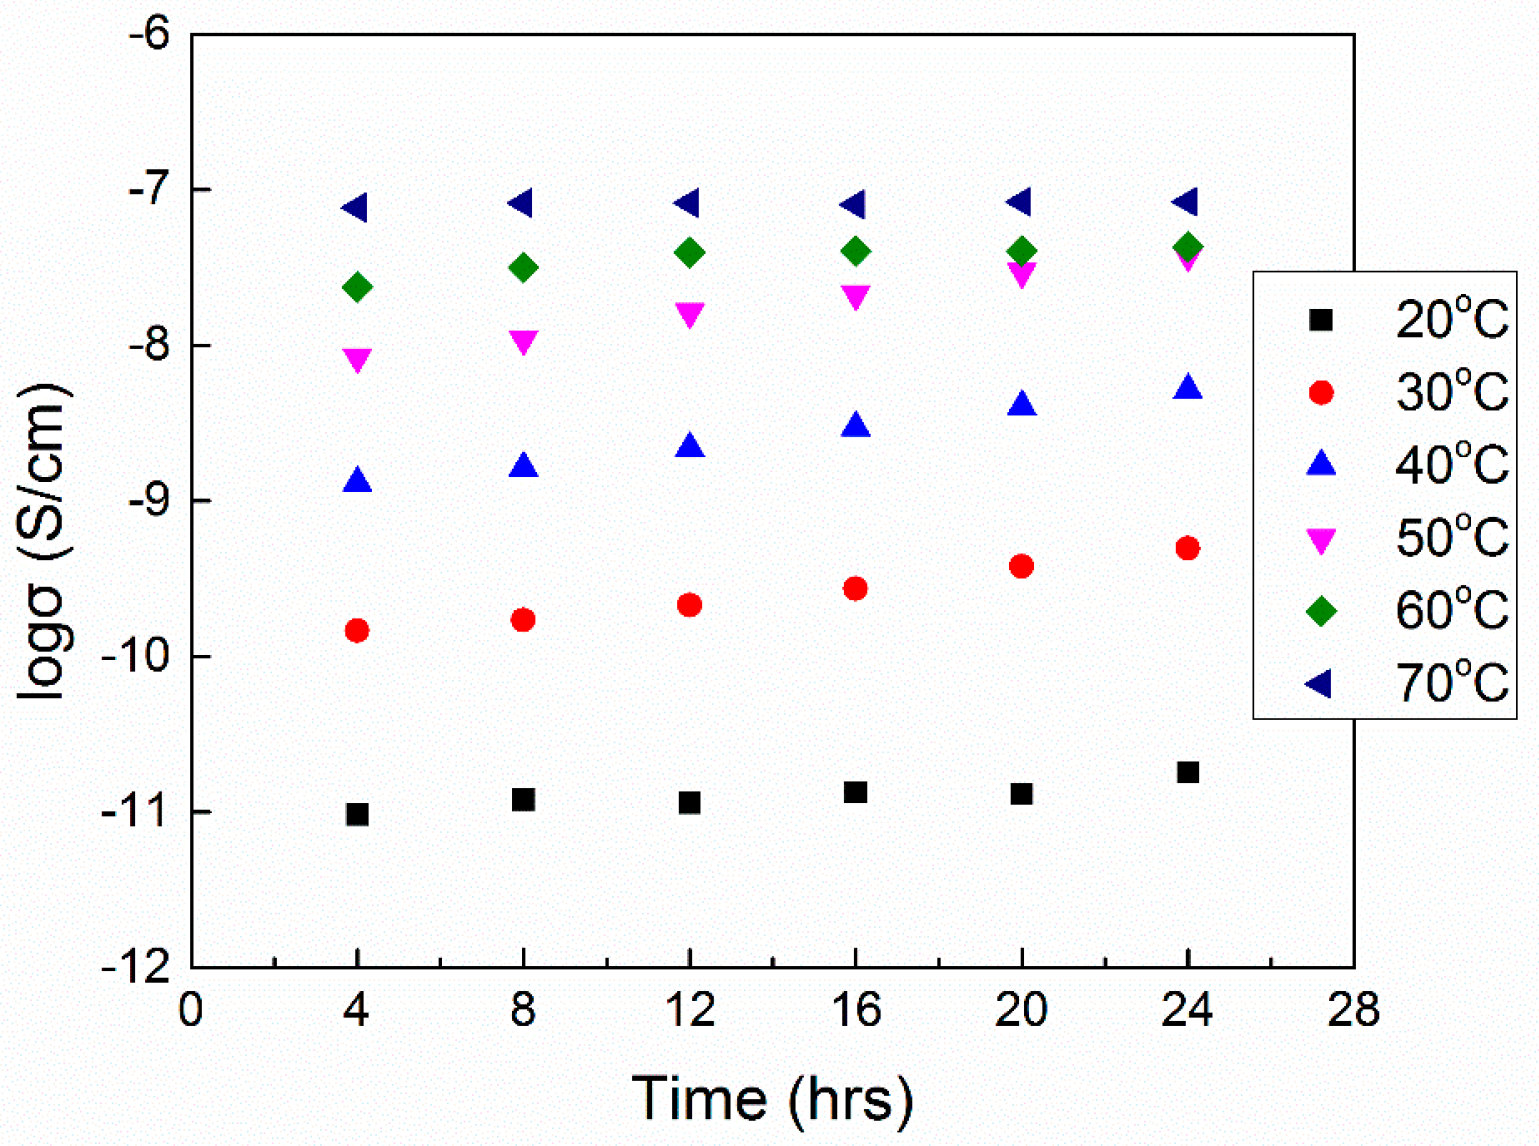
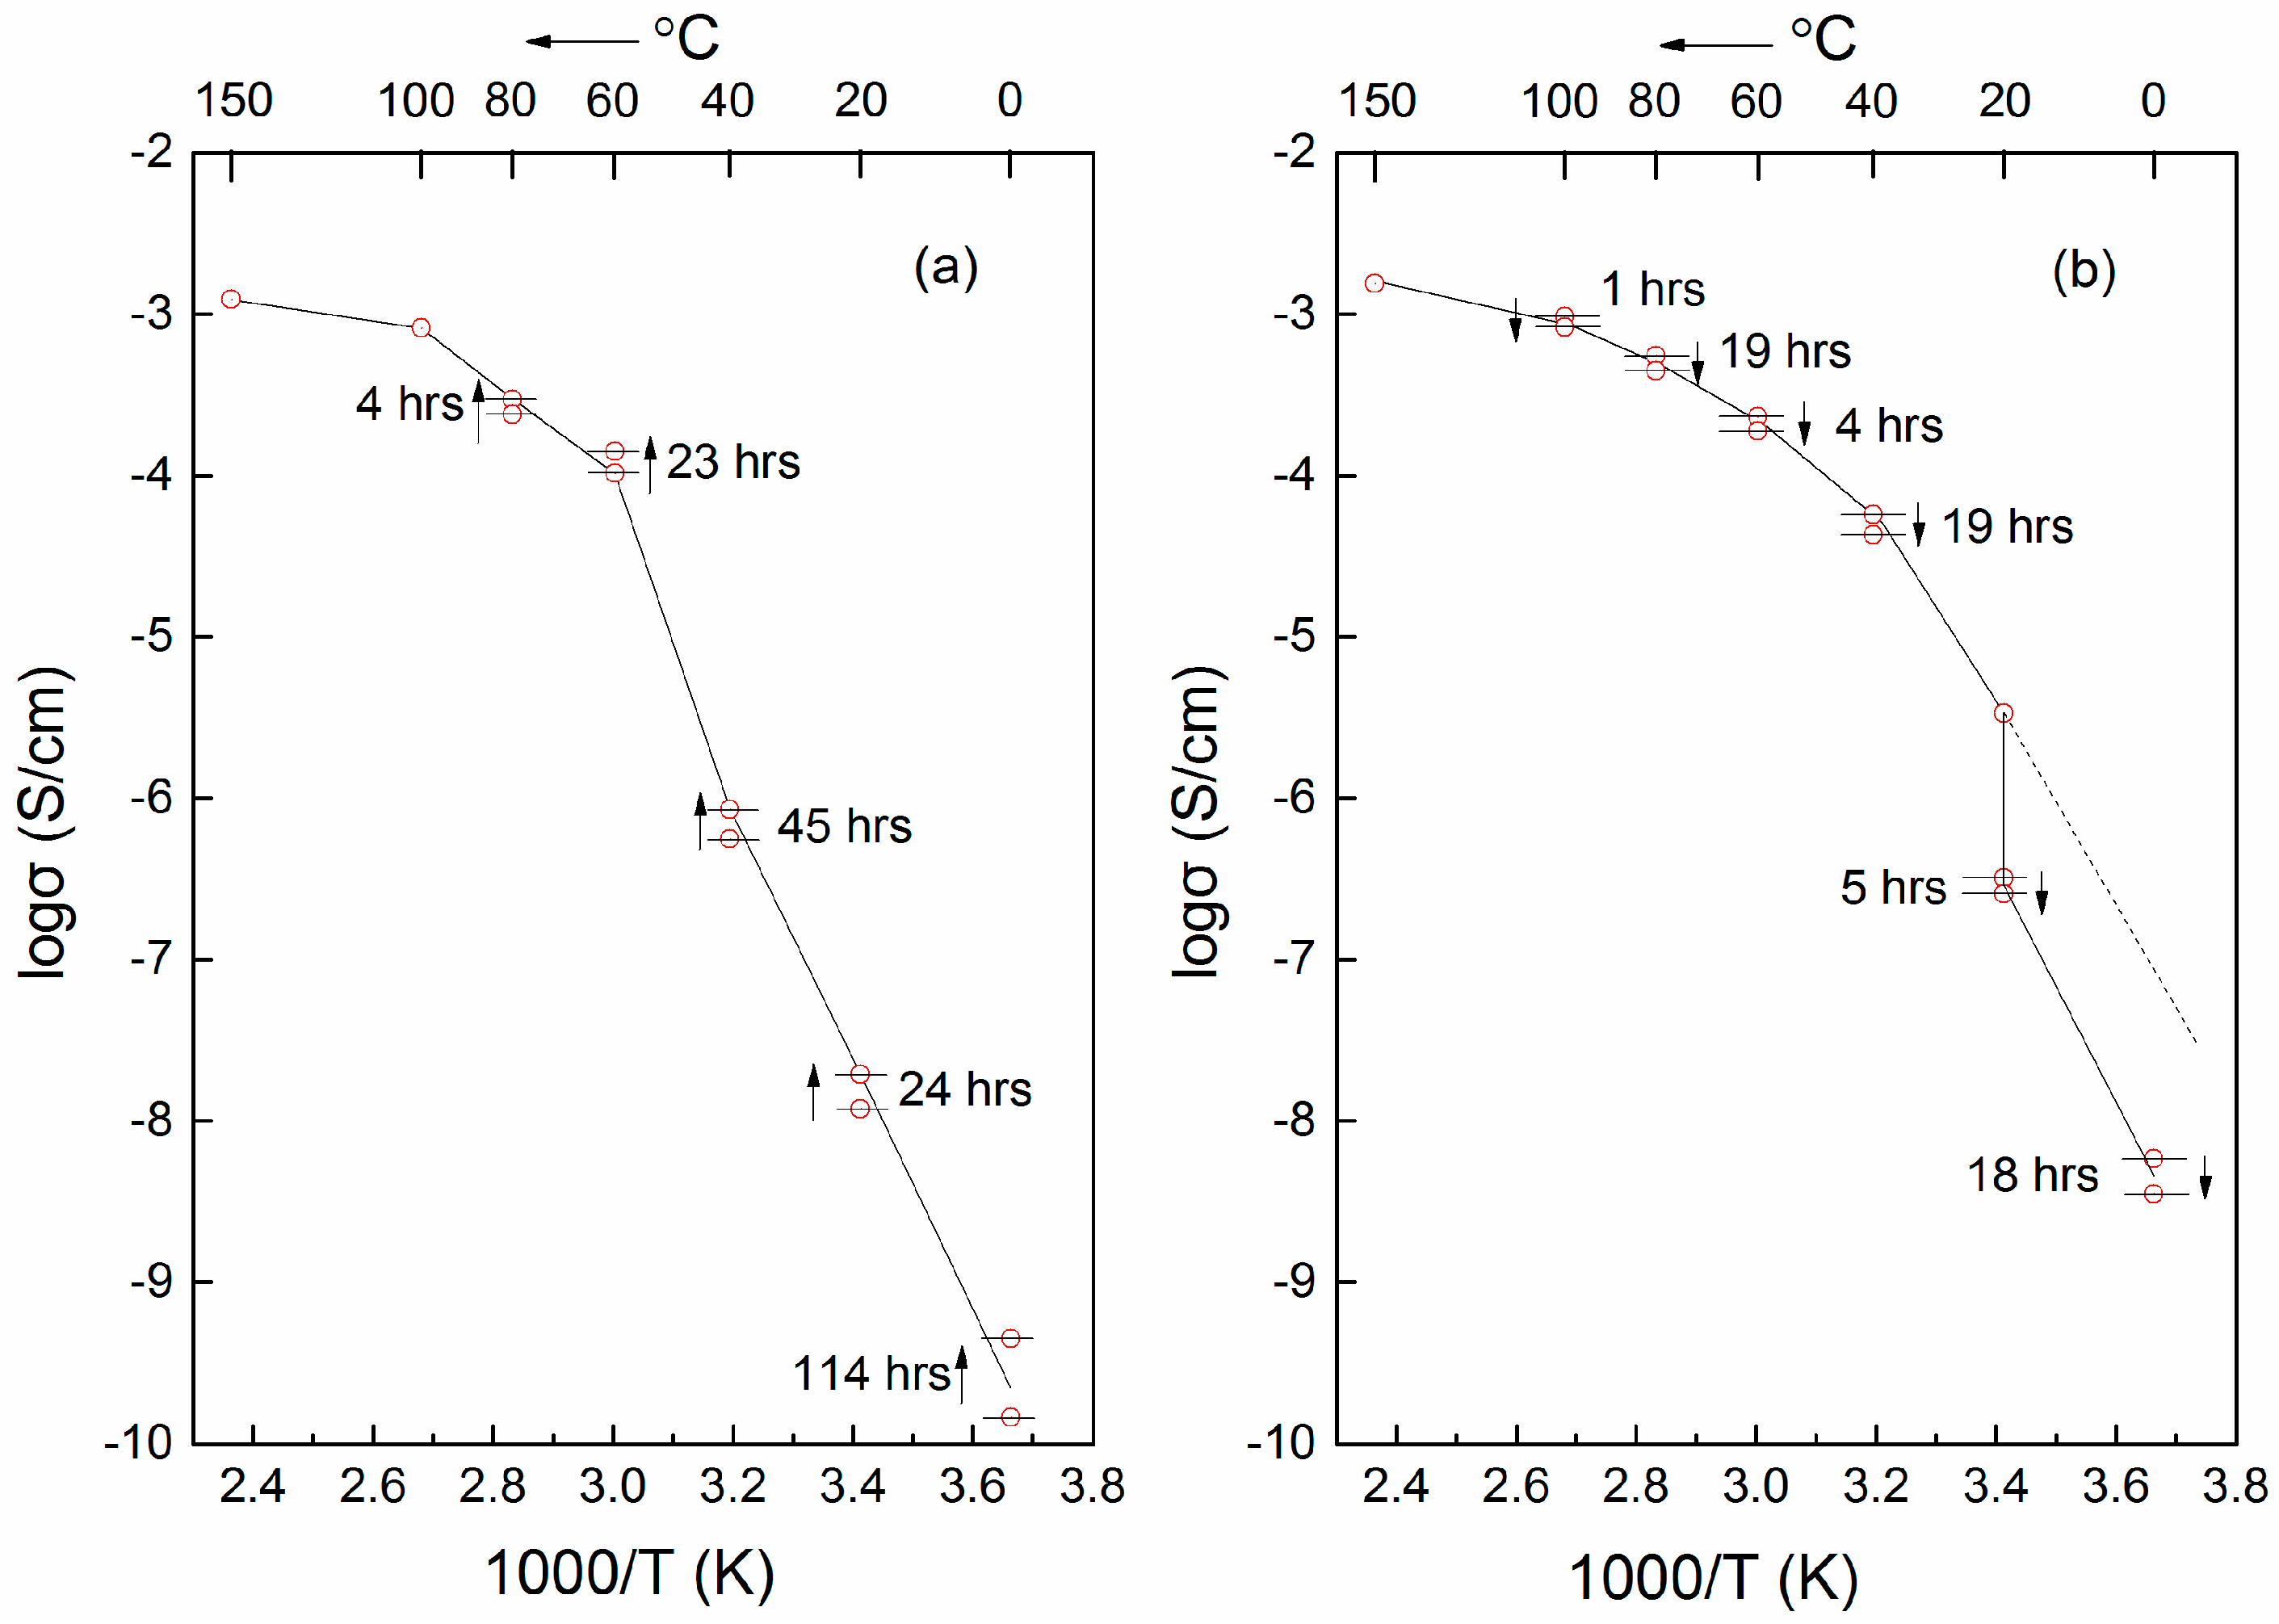
6.1. Thermal History
6.2. Physical Aging
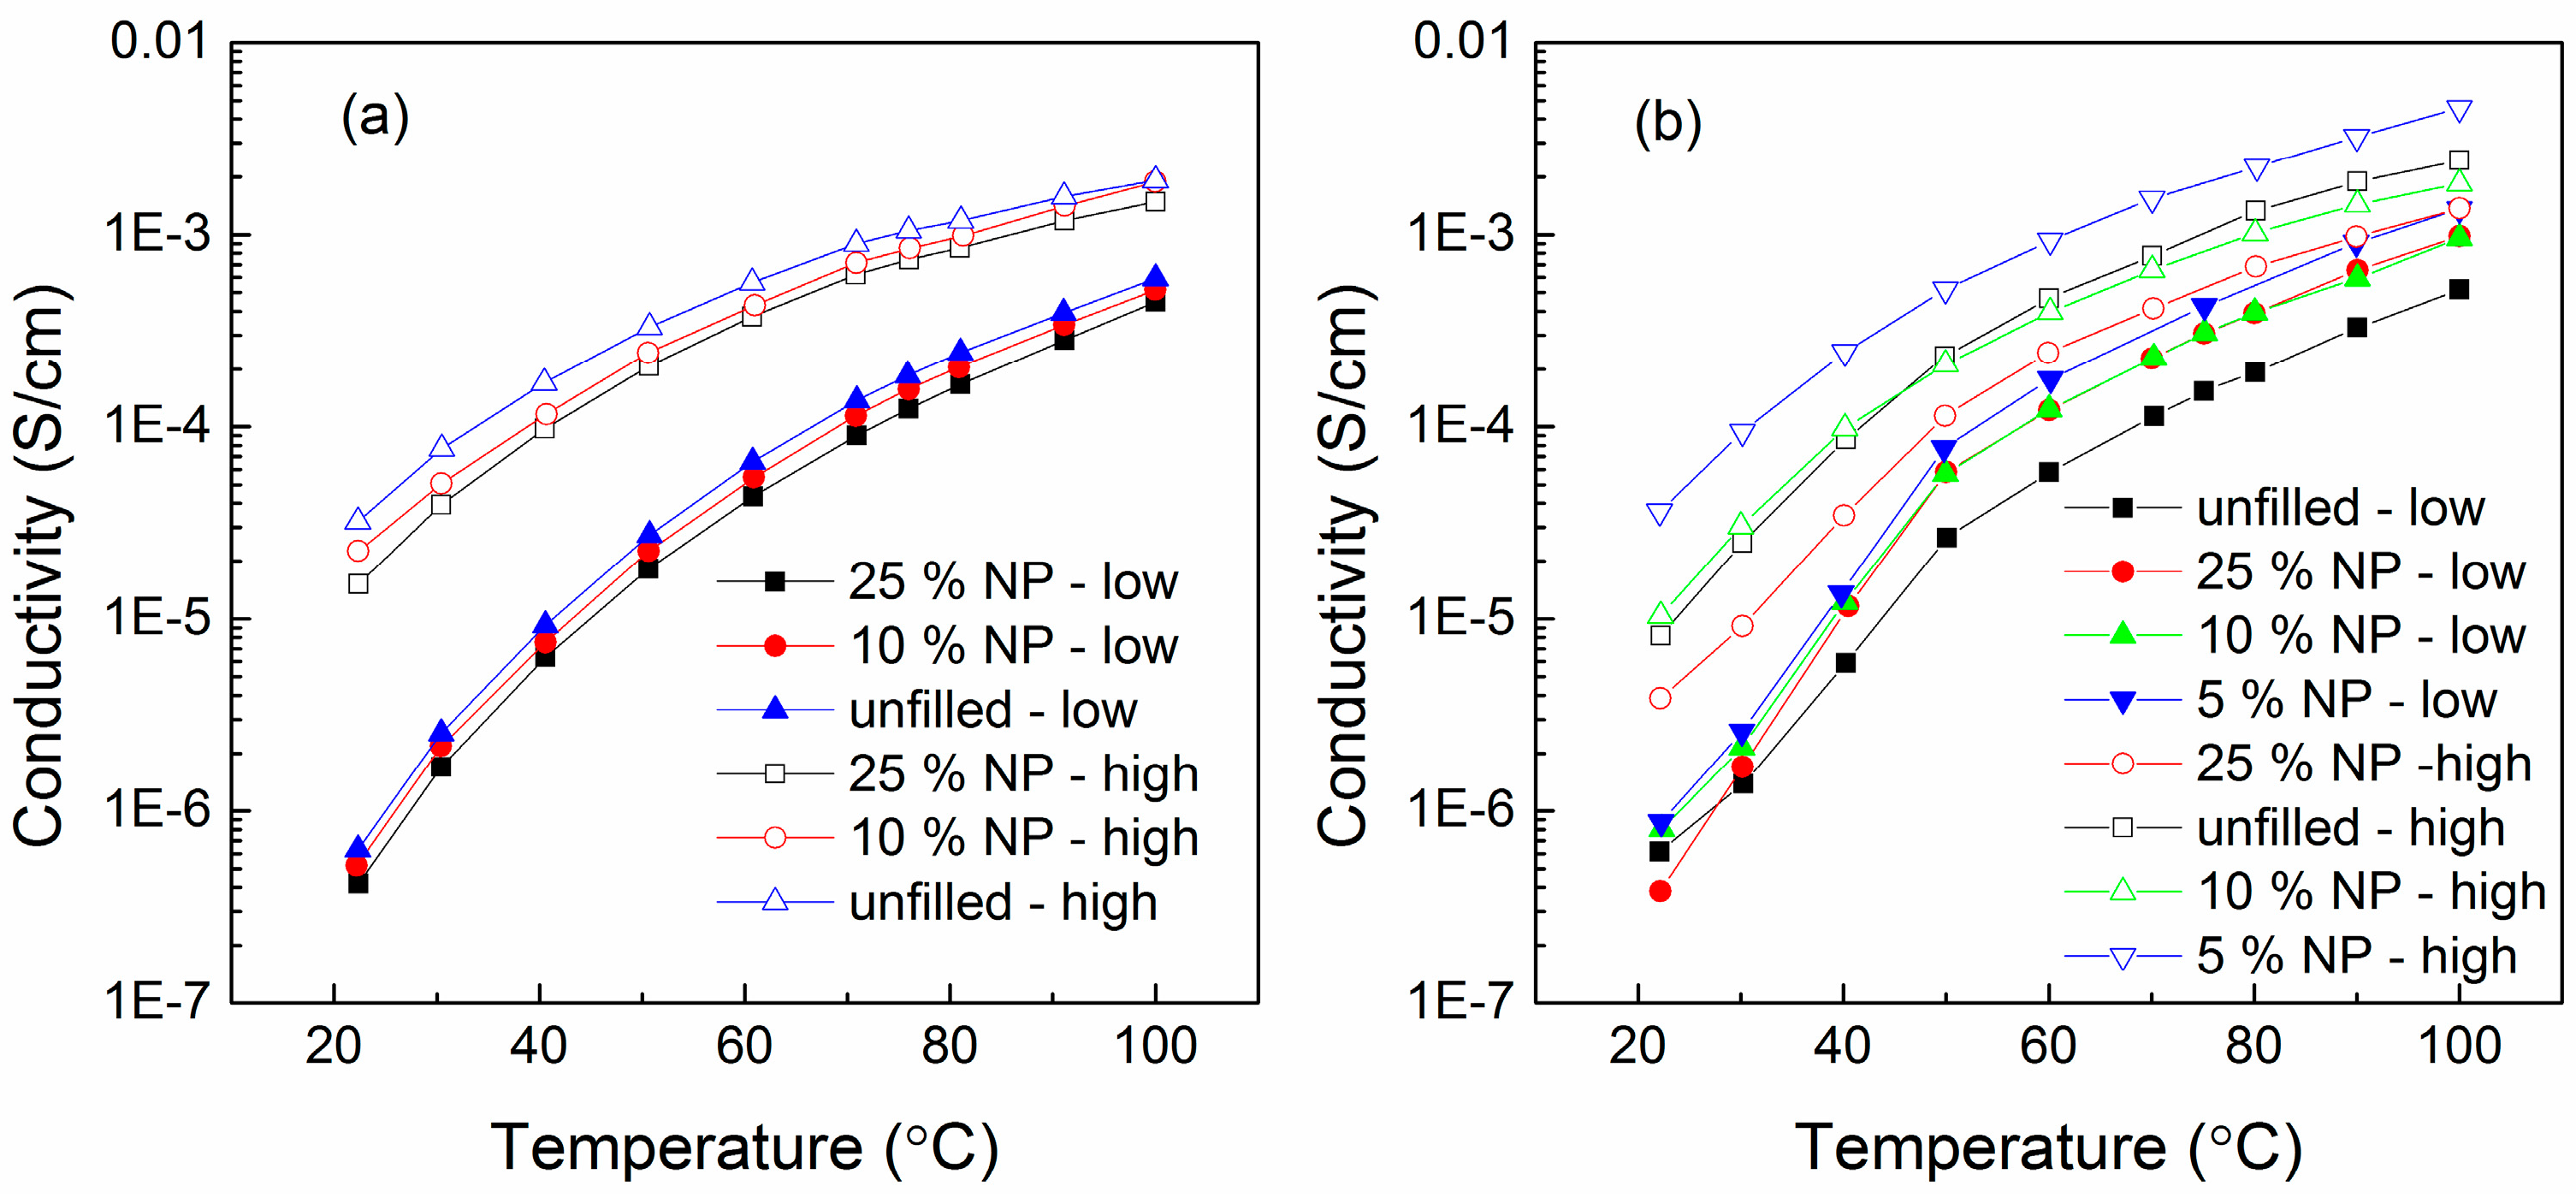
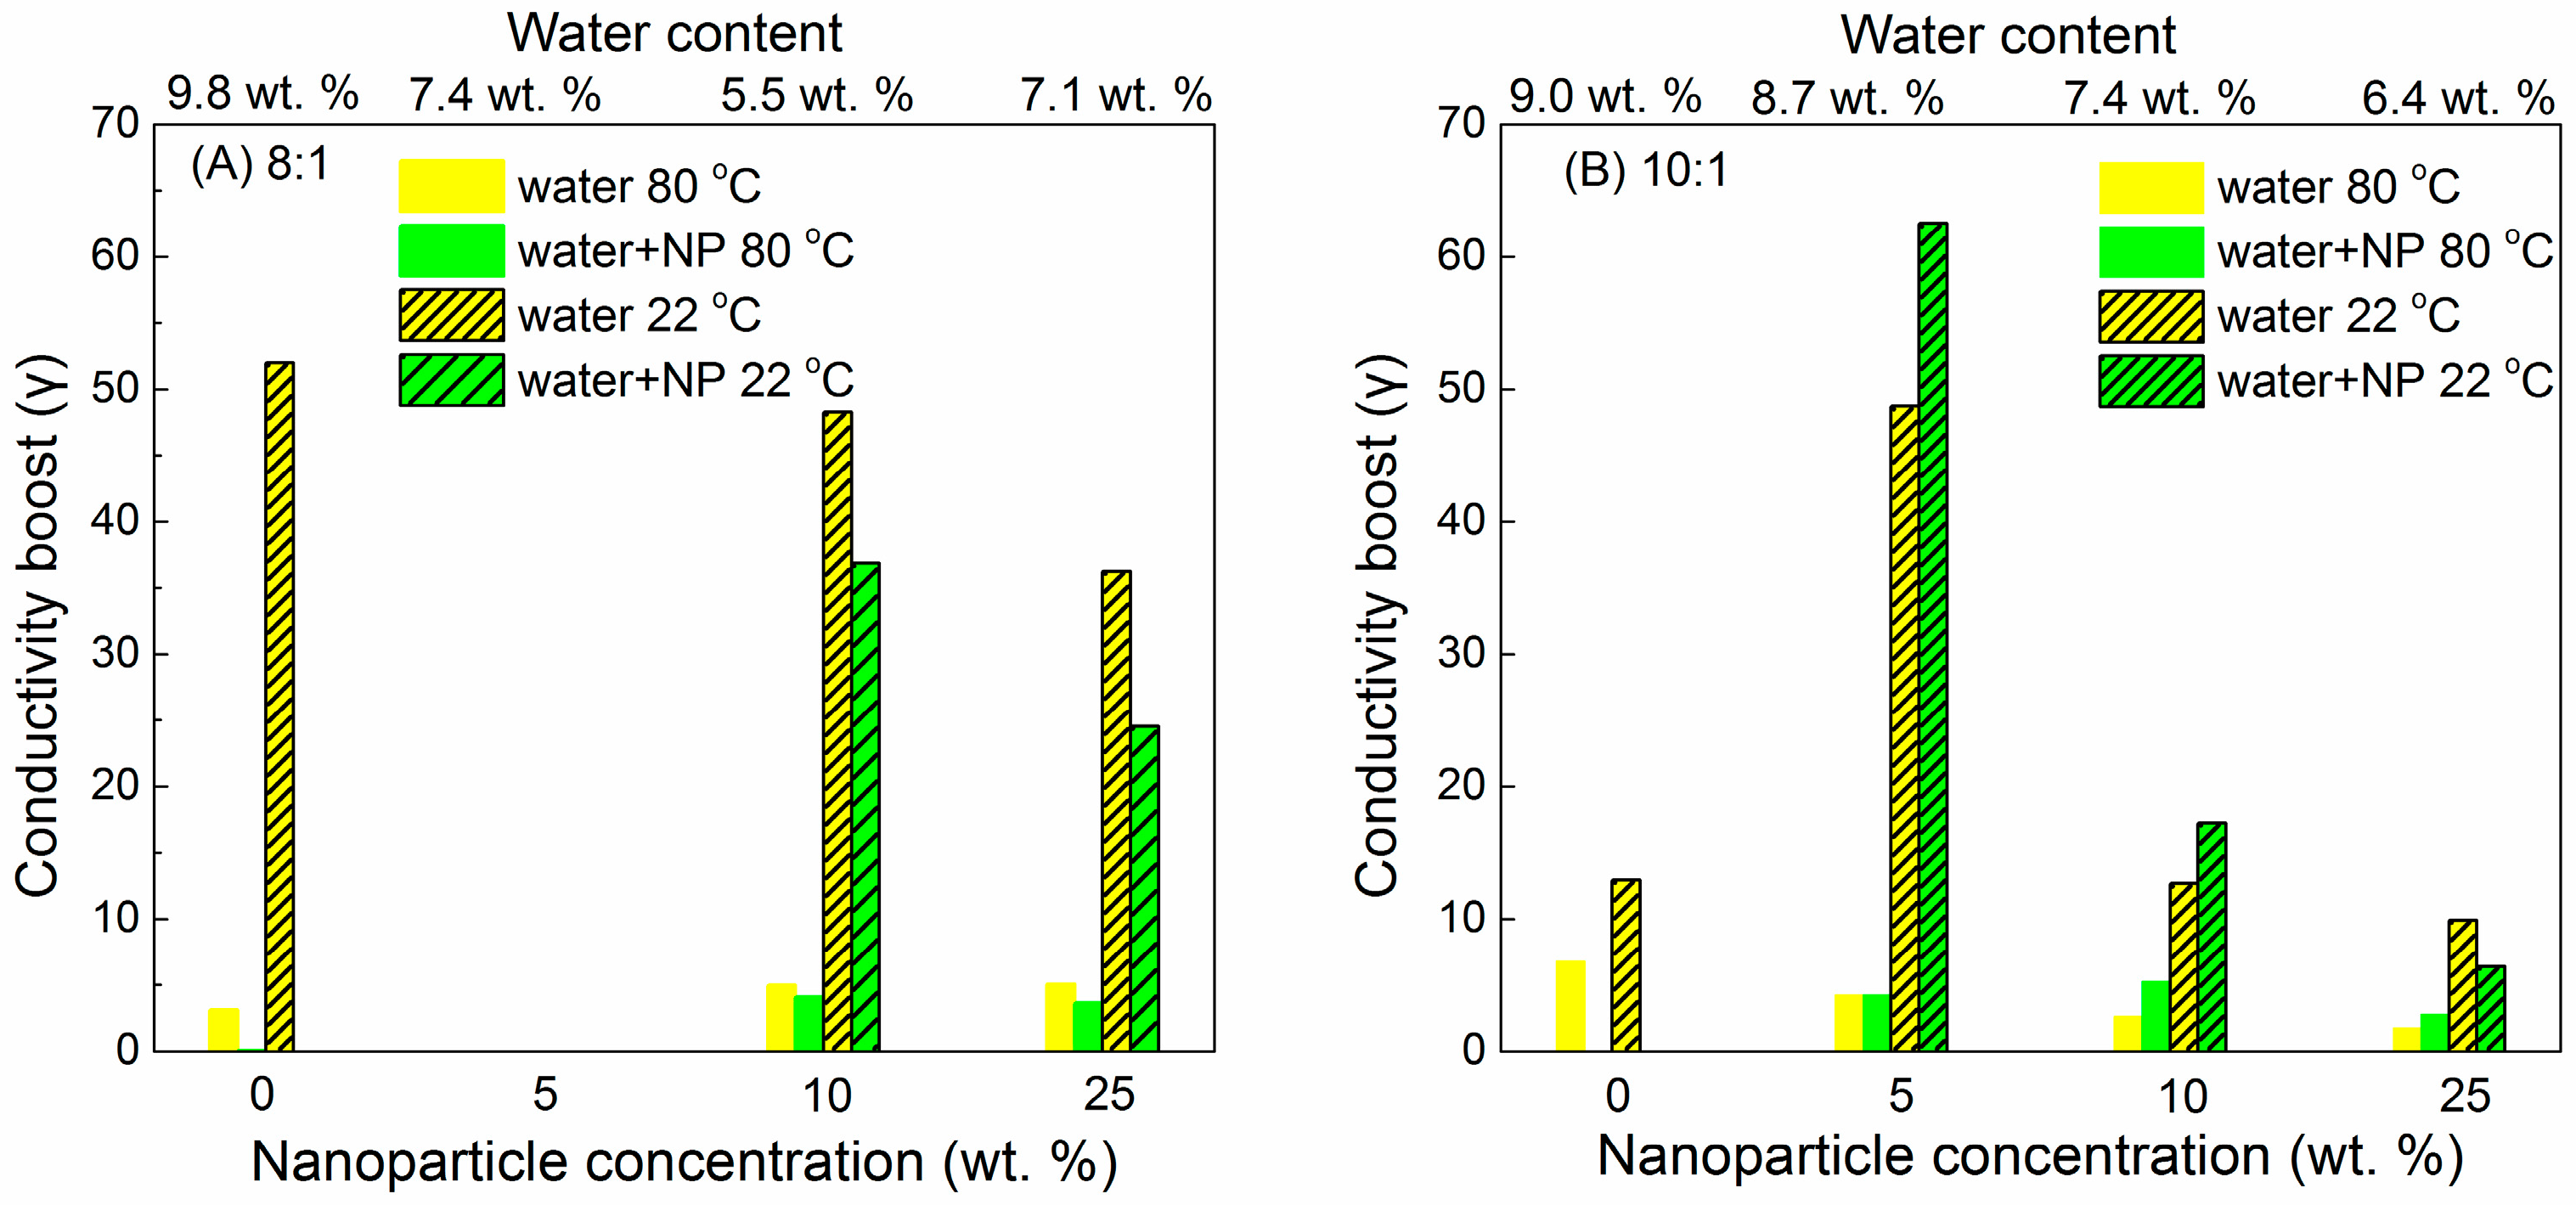
6.3. Humidity
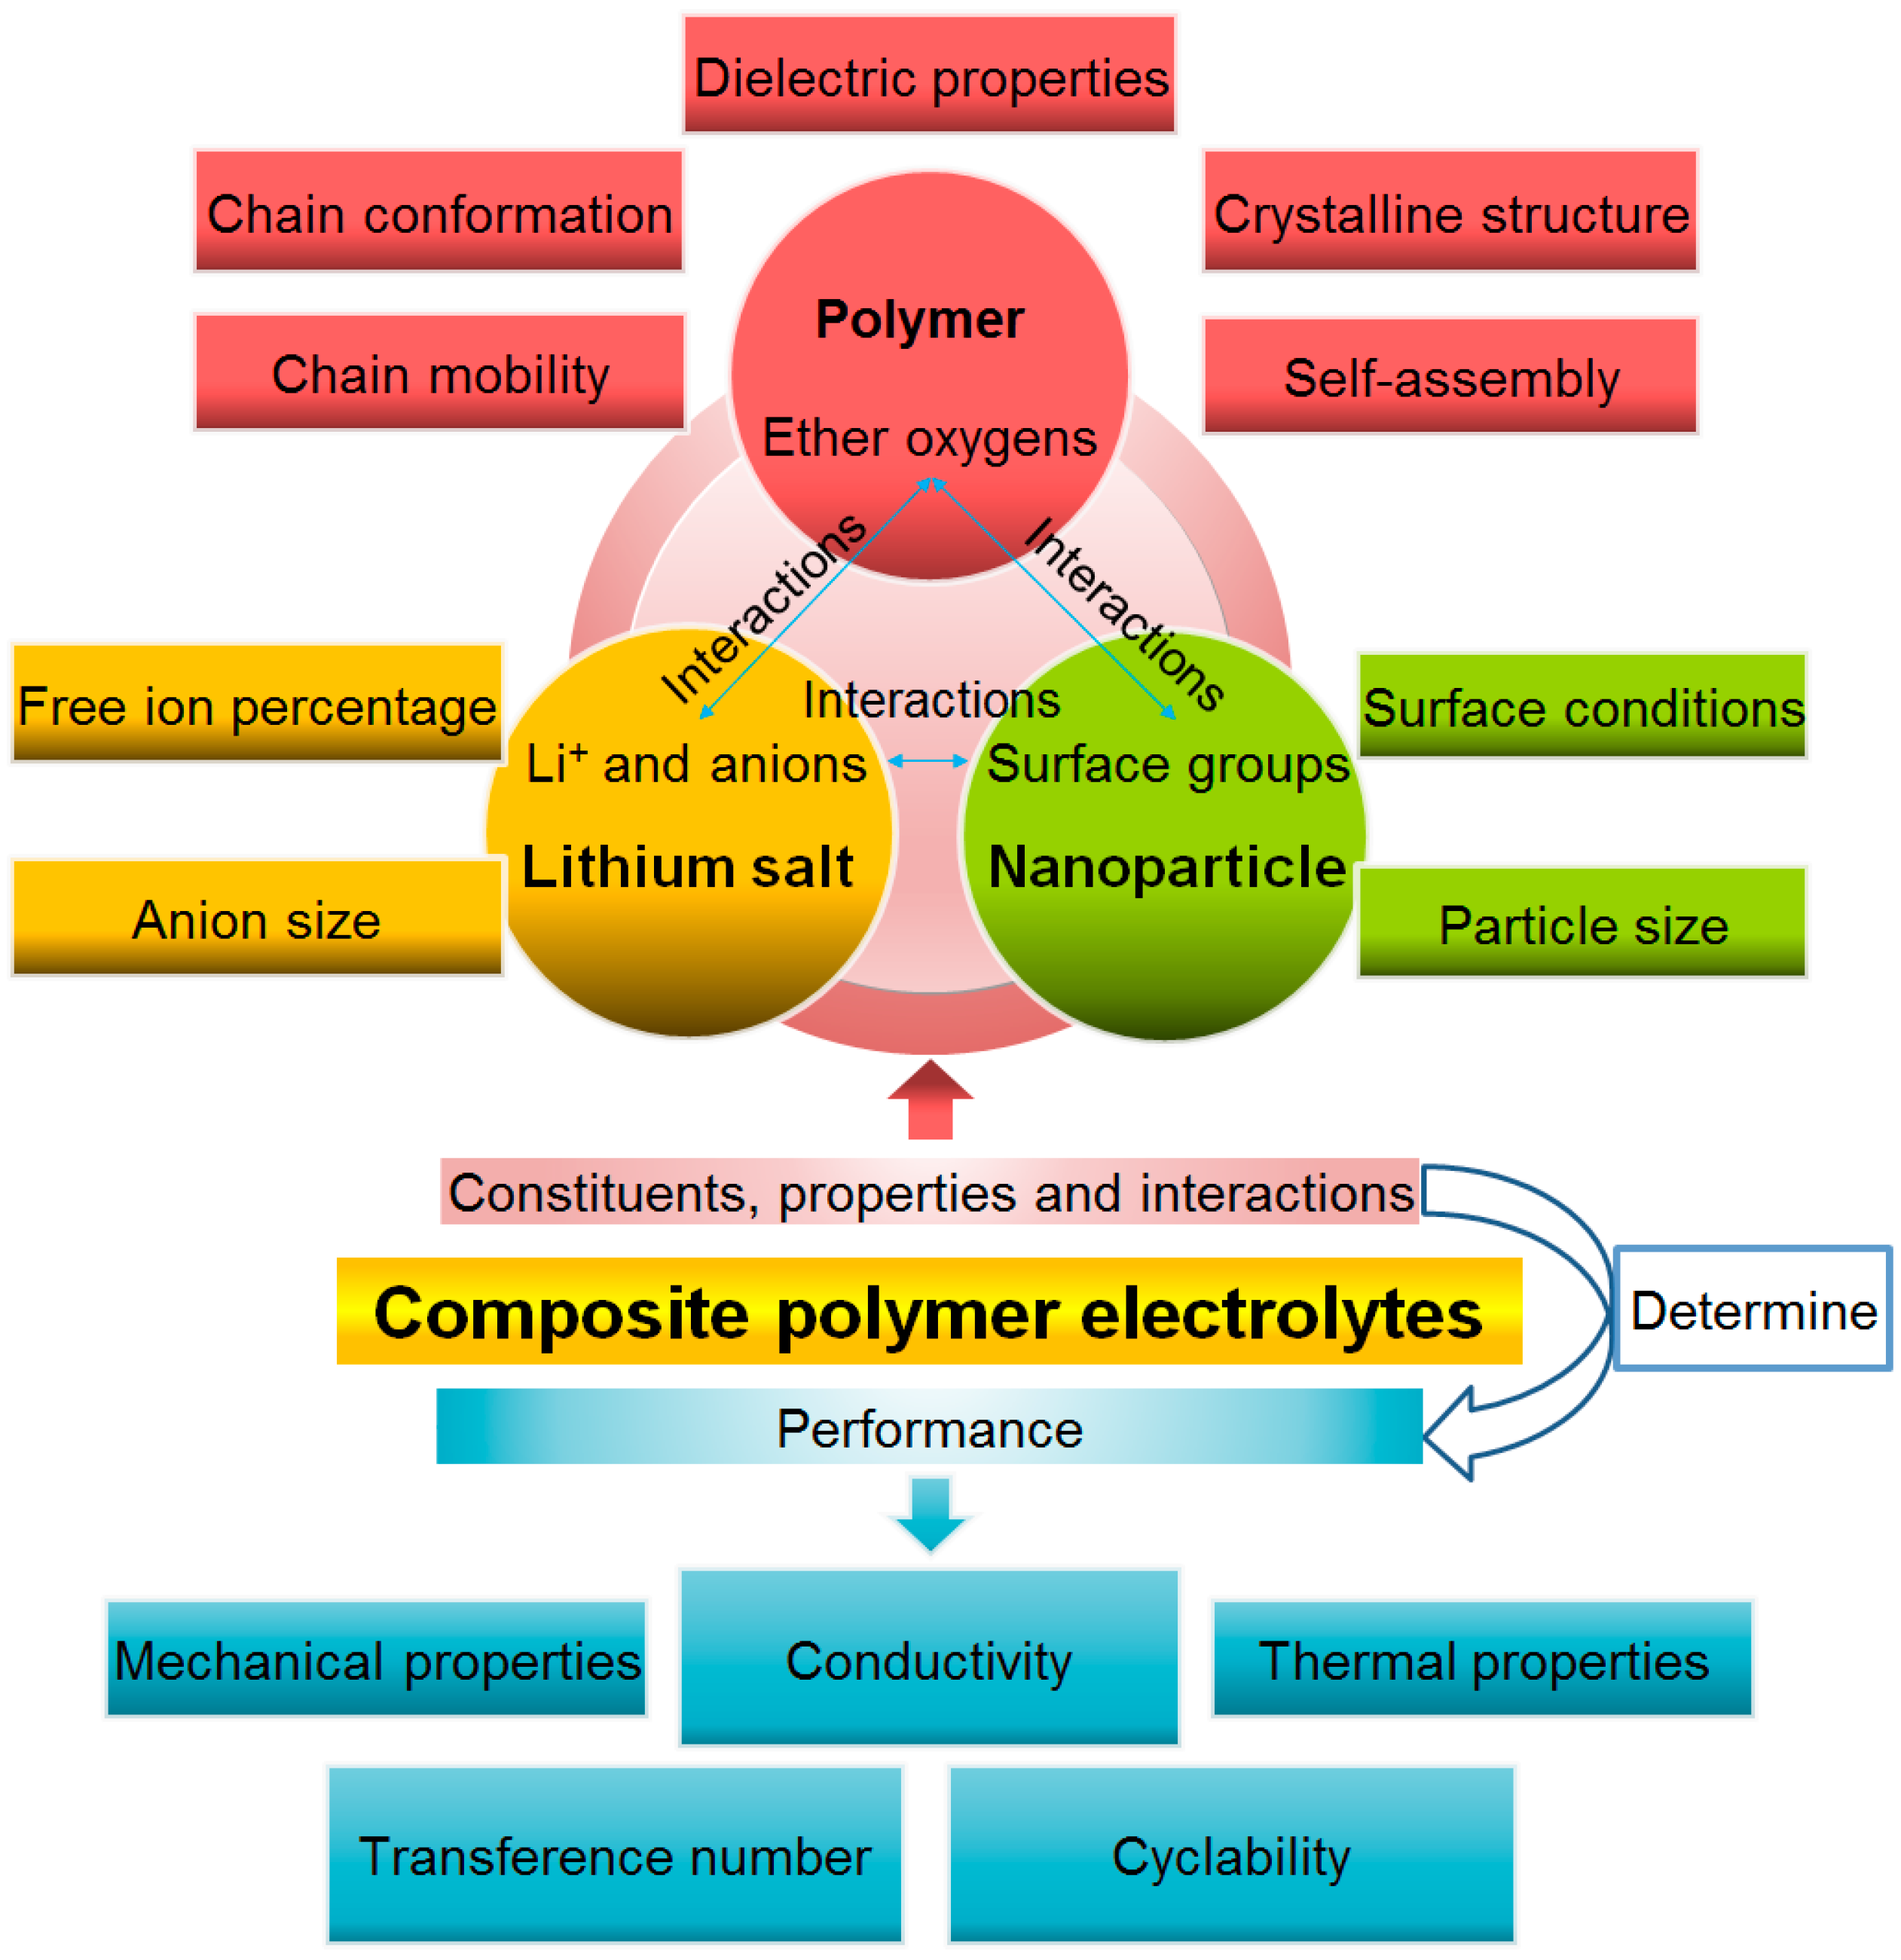
7. Summary and Outlook
Acknowledgments
Author Contributions
Conflicts of Interest
References
- Aono, M.; Ariga, K. The Way to nanoarchitectonics and the way of nanoarchitectonics. Adv. Mater. 2016, 28, 989–992. [Google Scholar] [CrossRef] [PubMed]
- Branco, C.M.; Sharma, S.; Forte, M.M.D.; Steinberger-Wilckens, R. New approaches towards novel composite and multilayer membranes for intermediate temperature-polymer electrolyte fuel cells and direct methanol fuel cells. J. Power Sources 2016, 316, 139–159. [Google Scholar] [CrossRef]
- Rydzek, G.; Ji, Q.M.; Li, M.; Schaaf, P.; Hill, J.P.; Boulmedais, F.; Ariga, K. Electrochemical nanoarchitectonics and layer-by-layer assembly: From basics to future. Nano Today 2015, 10, 138–167. [Google Scholar] [CrossRef]
- Ngai, K.S.; Ramesh, S.; Ramesh, K.; Juan, J.C. A review of polymer electrolytes: Fundamental, approaches and applications. Ionics 2016, 22, 1259–1279. [Google Scholar] [CrossRef]
- Sarkar, B.; Alexandridis, P. Block copolymer–nanoparticle composites: Structure, functional properties, and processing. Prog. Polym. Sci. 2015, 40, 33–62. [Google Scholar] [CrossRef]
- Wang, Y.J.; Zhao, N.N.; Fang, B.Z.; Li, H.; Bi, X.T.T.; Wang, H.J. Carbon-supported Pt-Based alloy electrocatalysts for the oxygen reduction reaction in polymer electrolyte membrane fuel cells: Particle size, shape, and composition manipulation and their impact to activity. Chem. Rev. 2015, 115, 3433–3467. [Google Scholar] [CrossRef] [PubMed]
- Scrosati, B. Battery technology—Challenge of portable power. Nature 1995, 373, 557–558. [Google Scholar] [CrossRef]
- Tarascon, J.M.; Armand, M. Issues and challenges facing rechargeable lithium batteries. Nature 2001, 414, 359–367. [Google Scholar] [CrossRef] [PubMed]
- Wakihara, M. Recent developments in lithium ion batteries. Mater. Sci. Eng. R Rep. 2001, 33, 109–134. [Google Scholar] [CrossRef]
- Yoo, H.D.; Markevich, E.; Salitra, G.; Sharon, D.; Aurbach, D. On the challenge of developing advanced technologies for electrochemical energy storage and conversion. Mater. Today 2014, 17, 110–121. [Google Scholar] [CrossRef]
- Nitta, N.; Wu, F.; Lee, J.T.; Yushin, G. Li-ion battery materials: Present and future. Mater. Today 2015, 18, 252–264. [Google Scholar] [CrossRef]
- Palacin, M.R. Recent advances in rechargeable battery materials: A chemist’s perspective. Chem. Soc. Rev. 2009, 38, 2565–2575. [Google Scholar] [CrossRef] [PubMed]
- Chen, J.; Cheng, F. Combination of lightweight elements and nanostructured materials for batteries. Acc. Chem. Res. 2009, 42, 713–723. [Google Scholar] [CrossRef] [PubMed]
- Xu, K. Electrolytes and interphases in Li-ion batteries and beyond. Chem. Rev. 2014, 114, 11503–11618. [Google Scholar] [CrossRef] [PubMed]
- Xu, K. Nonaqueous liquid electrolytes for lithium-based rechargeable batteries. Chem. Rev. 2004, 104, 4303–4417. [Google Scholar] [CrossRef] [PubMed]
- Quartarone, E.; Mustarelli, P. Electrolytes for solid-state lithium rechargeable batteries: Recent advances and perspectives. Chem. Soc. Rev. 2011, 40, 2525–2540. [Google Scholar] [CrossRef] [PubMed]
- He, Z.; Alexandridis, P. Ionic liquid and nanoparticle hybrid systems: Emerging applications. Adv. Colloid Interface Sci. 2016. [Google Scholar] [CrossRef] [PubMed]
- He, Z.Q.; Alexandridis, P. Nanoparticles in ionic liquids: Interactions and organization. Phys. Chem. Chem. Phys. 2015, 17, 18238–18261. [Google Scholar] [CrossRef] [PubMed]
- Berthier, C.; Gorecki, W.; Minier, M.; Armand, M.B.; Chabagno, J.M.; Rigaud, P. Microscopic investigation of ionic-conductivity in alkali-metal salts poly(ethylene oxide) adducts. Solid State Ion. 1983, 11, 91–95. [Google Scholar] [CrossRef]
- Armand, M.B. Polymer electrolytes. Annu. Rev. Mater. Sci. 1986, 16, 245–261. [Google Scholar] [CrossRef]
- Fenton, D.E.; Parker, J.M.; Wright, P.V. Complexes of alkali-metal ions with poly(ethylene oxide). Polymer 1973, 14, 589–589. [Google Scholar] [CrossRef]
- Florjanczyk, Z.; Marcinek, M.; Wieczorek, W.; Langwald, N. Review of PEO based composite polymer electrolytes. Pol. J. Chem. 2004, 78, 1279–1304. [Google Scholar]
- Quartarone, E.; Mustarelli, P.; Magistris, A. PEO-based composite polymer electrolytes. Solid State Ion. 1998, 110, 1–14. [Google Scholar] [CrossRef]
- Jung, S. Fillers for solid-state polymer electrolytes. Bull. Korean Chem. Soc. 2009, 30, 2355–2361. [Google Scholar]
- Shin, J.H.; Kim, K.W.; Ahn, H.J.; Ahn, J.H. Electrochemical properties and interfacial stability of (PEO)10LiCF3SO3-TinO2n-1 composite polymer electrolytes for lithium/sulfur battery. Mater. Sci. Eng. B Solid State Mater. Adv. Technol. 2002, 95, 148–156. [Google Scholar] [CrossRef]
- Stephan, A.M.; Nahm, K.S. Review on composite polymer electrolytes for lithium batteries. Polymer 2006, 47, 5952–5964. [Google Scholar] [CrossRef]
- Amanchukwu, C.V.; Harding, J.R.; Shao-Horn, Y.; Hammond, P.T. Understanding the chemical stability of polymers for lithium-air batteries. Chem. Mater. 2015, 27, 550–561. [Google Scholar] [CrossRef]
- Scrosati, B.; Vincent, C.A. Polymer electrolytes the key to lithium polymer batteries. MRS Bull. 2000, 25, 28–30. [Google Scholar] [CrossRef]
- Fontanella, J.J.; Wintersgill, M.C.; Smith, M.K.; Semancik, J.; Andeen, C.G. Effect of high-pressure on electrical relaxation in poly(propylene-oxide) and electrical-conductivity in poly(propylene oxide) complexed with lithium-salts. J. Appl. Phys. 1986, 60, 2665–2671. [Google Scholar] [CrossRef]
- Rae, S.G. Development of electrochemical cells based on (PEO + NaYF4) and (PEO + KYF4) polymer electrolytes. Mater. Sci. Eng. B 1995, 187, 173–177. [Google Scholar]
- Sekhon, S.S.; Sandhar, G.S. Effect of SiO2 on conductivity of PEO-AgSCN polymer electrolytes. Eur. Polym. J. 1998, 34, 435–438. [Google Scholar]
- Maitra, M.G.; Sinha, M.; Mukhopadhyay, A.K.; Middya, T.R.; De, U.; Tarafdar, S. Ion-conductivity and Young’s modulus of the polymer electrolyte PEO-ammonium perchlorate. Solid State Ion. 2007, 178, 167–171. [Google Scholar] [CrossRef]
- Ashrafi, R.; Sahu, D.K.; Kesharwani, P.; Ganjir, M.; Agrawal, R.C. Ag+-ion conducting nano-composite polymer electrolytes (NCPEs): Synthesis, characterization and all-solid-battery studies. J. Non-cryst. Sol. 2014, 391, 91–95. [Google Scholar] [CrossRef]
- Luo, H.; Liang, X.; Wang, L.; Zheng, A.; Liu, C.; Feng, J. Highly mobile segments in crystalline poly(ethylene oxide)8: NaPF6 electrolytes studied by solid-state NMR spectroscopy. J. Chem. Phys. 2014, 140, 074901. [Google Scholar] [CrossRef] [PubMed]
- Hallinan, D.T., Jr.; Balsara, N.P. Polymer electrolytes. Annu. Rev. Mater. Res. 2013, 43, 503–525. [Google Scholar] [CrossRef]
- Bruce, P.G.; Vincent, C.A. Polymer electrolytes. J. Chem. Soc. Faraday Trans. 1993, 89, 3187–3203. [Google Scholar] [CrossRef]
- Williams, M.L.; Landel, R.F.; Ferry, J.D. The temperature dependence of relaxation mechanisms in amorphous polymers and other glass-forming liquids. J. Am. Chem. Soc. 1955, 77, 3701–3707. [Google Scholar] [CrossRef]
- Rietman, E.A.; Kaplan, M.L.; Cava, R.J. Lithium ion-poly(ethylene-oxide) complexes 1. Effect of anion on conductivity. Solid State Ion. 1985, 17, 67–73. [Google Scholar] [CrossRef]
- Bandara, L.R.A.K.; Dissanayake, M.A.K.L.; Furlani, M.; Mellander, B.E. Broad band dielectric behavior of plasticized PEO-based solid polymer electrolytes. Ionics 2000, 6, 239–247. [Google Scholar] [CrossRef]
- Robitaille, C.D.; Fauteux, D. Phase diagrams and conductivity characterization of some PEO-lix electrolytes. J. Electrochem. Soc. 1986, 133, 315–325. [Google Scholar] [CrossRef]
- Fulcher, G.S. Analysis of recent measurements of the viscosity of glasses. J. Am. Ceram. Soc. 1925, 8, 339–355. [Google Scholar] [CrossRef]
- Polymer Electrolyte Reviews; MacCallum, J.R.; Vincent, C.A. (Eds.) Elsevier Applied Science: London, UK, 1987.
- Cohen, M.H.; Turnbull, D. Molecular transport in liquids and glasses. J. Chem. Phys. 1959, 31, 1164–1169. [Google Scholar] [CrossRef]
- Cohen, M.H.; Grest, G.S. Liquid-glass transition, a free-volume approach. Phys. Rev. B Condens. Matter 1979, 20, 1077–1098. [Google Scholar] [CrossRef]
- Broadbent, S.R.; Hammersley, J.M. Percolation processes. I. Crystals and mazes. Proc. Camb. Philos. Soc. 1957, 53, 629–641. [Google Scholar] [CrossRef]
- Hammersley, J.M. Percolation processes. II. The connective constant. Proc. Camb. Philos. Soc. 1957, 53, 642–645. [Google Scholar] [CrossRef]
- Druger, S.D.; Nitzan, A.; Ratner, M.A. Dynamic bond percolation theory—A microscopic model for diffusion in dynamically disordered-systems 1. Definition and one-dimensional case. J. Chem. Phys. 1983, 79, 3133–3142. [Google Scholar] [CrossRef]
- Zhang, H.J.; Kulkarni, S.; Wunder, S.L. Polyethylene glycol functionalized polyoctahedral silsesquioxanes as electrolytes for lithium batteries. J. Electrochem. Soc. 2006, 153, A239–A248. [Google Scholar] [CrossRef]
- Dienes, G.J. Frequency factor and activation energy for the volume diffusion of metals. J. Appl. Phys. 1950, 21, 1189–1192. [Google Scholar] [CrossRef]
- Weinstein, L.; Shustorovich, E. Coherence, competence, and confusion in narratives of middle childhood. In Psychoanalytic Study of the Child; Abrams, S., Dowling, A.S., King, R.A., Brinich, P.M., Eds.; Yale University Press: Yale, CT, USA, 2011. [Google Scholar]
- Shustorovich, E. Metal Effects in the Fischer-Tropsch Synthesis—Bond-Order-Conservation-Morse-Potential Approach. Catal. Lett. 1991, 7, 107–118. [Google Scholar] [CrossRef]
- Wieczorek, W. Entropy effects on conductivity of the blend-based and composite polymer solid electrolytes. Solid State Ion. 1992, 53, 1064–1070. [Google Scholar] [CrossRef]
- Wieczorek, W. Temperature-dependence of conductivity of mixed-phase composite polymer solid electrolytes. Mater. Sci. Eng. B 1992, 15, 108–114. [Google Scholar] [CrossRef]
- Cheng, S.; Smith, D.M.; Li, C.Y. How does nanoscale crystalline structure affect ion transport in solid polymer electrolytes? Macromolecules 2014, 47, 3978–3986. [Google Scholar] [CrossRef]
- Susan, K. Effect of LiClO4 on the structure and mobility of PEO-based solid polymer electrolytes. Macromolecules 2009, 42, 2142–2156. [Google Scholar]
- Petersen, G.; Jacobsson, P.; Torell, L.M. A raman-study of ion polymer and ion-ion interactions in low-molecular-weight polyether-LiCF3SO3 complexes. Electrochim. Acta 1992, 37, 1495–1497. [Google Scholar] [CrossRef]
- Bloise, A.C.; Donoso, J.P.; Magon, C.J.; Rosario, A.V.; Pereira, E.C. NMR and conductivity study of PEO-based composite polymer electrolytes. Electrochim. Acta 2003, 48, 2239–2246. [Google Scholar] [CrossRef]
- Chandrasekhar, V. Polymer Solid electrolytes: Synthesis and structure. Adv. Polym. Sci. 1998, 135, 139–205. [Google Scholar]
- Kohjiya, S.; Ikeda, Y. Polymer solid electrolytes from poly(oxyethylene) derivatives. Mater. Sci. Res. Int. 1998, 4, 73–78. [Google Scholar] [CrossRef]
- Gadjourova, Z.; Andreev, Y.G.; Tunstall, D.P.; Bruce, P.G. Ionic conductivity in crystalline polymer electrolytes. Nature 2001, 412, 520–523. [Google Scholar] [CrossRef] [PubMed]
- Lilley, S.J. Ionic conductivity in crystalline PEO6:Li(AsF6)1−x(SbF6)x. J. Am. Chem. Soc. 2006, 128, 12036–12037. [Google Scholar] [CrossRef] [PubMed]
- Chrissopoulou, K.; Andrikopoulos, K.S.; Fotiadou, S.; Bollas, S.; Karageorgaki, C.; Christofilos, D.; Voyiatzis, G.A.; Anastasiadis, S.H. Crystallinity and chain conformation in PEO/Layered silicate nanocomposites. Macromolecules 2011, 44, 9710–9722. [Google Scholar] [CrossRef]
- Karmakar, A.; Ghosh, A. Poly ethylene oxide (PEO)-LiI polymer electrolytes embedded with CdO nanoparticles. J. Nanopart. Res. 2011, 13, 2989–2996. [Google Scholar] [CrossRef]
- Wang, X.L.; Mei, A.; Li, M.; Lin, Y.H.; Nan, C.W. Polymer composite electrolytes containing ionically active mesoporous SiO2 particles. J. Appl. Phys. 2007, 102, 054907. [Google Scholar] [CrossRef]
- Xi, J.Y.; Qiu, X.P.; Zheng, S.X.; Tang, X.Z. Nanocomposite polymer electrolyte comprising PEO/LiClO4 and solid super acid: Effect of sulphated-zirconia on the crystallization kinetics of PEO. Polymer 2005, 46, 5702–5706. [Google Scholar] [CrossRef]
- Xi, J.; Qiu, X.; Wang, J.; Bai, Y.; Zhu, W.; Chen, L. Effect of molecular sieves ZSM-5 on the crystallization behavior of PEO-based composite polymer electrolyte. J. Power Sources 2006, 158, 627–634. [Google Scholar] [CrossRef]
- Dey, A.; Ghoshal, T.; Karan, S.; De, S.K. Size effect of cubic ZrO2 nanoparticles on ionic conductivity of polyethylene oxide-based composite. J. Appl. Phys. 2011, 110, 043707. [Google Scholar] [CrossRef]
- Syzdek, J.; Armand, M.; Marcinek, M.; Zalewska, A.; Żukowska, G.; Wieczorek, W. Detailed studies on the fillers modification and their influence on composite, poly(oxyethylene)-based polymeric electrolytes. Electrochim. Acta 2010, 55, 1314–1322. [Google Scholar] [CrossRef]
- Hanson, B.; Pryamitsyn, V.; Ganesan, V. Mechanisms underlying ionic mobilities in nanocomposite polymer electrolytes. ACS Macro Lett. 2013, 2, 1001–1005. [Google Scholar] [CrossRef]
- Borodin, O.; Smith, G.D. Molecular dynamics simulations of poly(ethylene oxide)/LiI melts. 1. Structural and conformational properties. Macromolecules 1998, 31, 8396–8406. [Google Scholar] [CrossRef]
- Kesavan, K.; Mathew, C.M.; Rajendran, S.; Ulaganathan, M. Preparation and characterization of novel solid polymer blend electrolytes based on poly(vinyl pyrrolidone) with various concentrations of lithium perchlorate. Mater. Sci. Eng. B Adv. Funct. Solid State Mater. 2014, 184, 26–33. [Google Scholar] [CrossRef]
- Patil, S.U.; Yawale, S.S.; Yawale, S.P. Conductivity study of PEO-LiClO4 polymer electrolyte doped with ZnO nanocomposite ceramic filler. Bull. Mater. Sci. 2014, 37, 1403–1409. [Google Scholar] [CrossRef]
- Costa, L.T.; Ribeiro, M.C. Molecular dynamics simulation of polymer electrolytes based on poly(ethylene oxide) and ionic liquids. I. Structural properties. J. Chem. Phys. 2006, 124, 184902. [Google Scholar] [CrossRef] [PubMed]
- Diddens, D.; Heuer, A. Lithium ion transport mechanism in ternary polymer electrolyte-ionic liquid mixtures: A molecular dynamics simulation study. ACS Macro Lett. 2013, 2, 322–326. [Google Scholar] [CrossRef]
- Voigt, N.; van Wuellen, L. The effect of plastic-crystalline succinonitrile on the electrolyte system PEO:LiBF4: Insights from solid state NMR. Solid State Ion. 2014, 260, 65–75. [Google Scholar] [CrossRef]
- Mello, N.C.; Bonagamba, T.J.; Panepucci, H.; Dahmouche, K.; Judeinstein, P.; Aegerter, M.A. NMR study of ion-conducting organic-inorganic nanocomposites poly(ethylene glycol)-Silica-LiClO4. Macromolecules 2000, 33, 1280–1288. [Google Scholar] [CrossRef]
- De Souza, P.H.; Bianchi, R.F.; Dahmouche, K.; Judeinstein, P.; Faria, R.M.; Bonagamba, T.J. Solid-state NMR, ionic conductivity, and thermal studies of lithium-doped siloxane-poly(propylene glycol) organic-inorganic nanocomposites. Chem. Mater. 2001, 13, 3685–3692. [Google Scholar] [CrossRef]
- Judeinstein, P.; Titman, J.; Stamm, M.; Schmidt, H. Investigation of ion-conducting ormolytes: Structure-property relationships. Chem. Mater. 1994, 6, 127–134. [Google Scholar] [CrossRef]
- Chung, S.H.; Jeffrey, K.R.; Stevens, J.R. A 7Li nuclear-magnetic-resonance study of LiCF3SO3 complexed in poly(propylene-glycol). J. Chem. Phys. 1991, 94, 1803–1811. [Google Scholar] [CrossRef]
- Ayandele, E.; Sarkar, B.; Alexandridis, P. Polyhedral oligomeric silsesquioxane (POSS)-containing polymer nanocomposites. Nanomaterials 2012, 2, 445–475. [Google Scholar] [CrossRef]
- Alexandridis, P.; Tsianou, M. Block copolymer-directed metal nanoparticle morphogenesis and organization. Eur. Polym. J. 2011, 47, 569–583. [Google Scholar] [CrossRef]
- Spontak, R.J.; Alexandridis, P. Advances in self-ordering macromolecules and nanostructure design. Curr. Opin. Colloid Interface Sci. 1999, 4, 140–146. [Google Scholar] [CrossRef]
- Lin, Y.; Daga, V.K.; Anderson, E.R.; Gido, S.P.; Watkins, J.J. Nanoparticle-driven assembly of block copolymers: A simple route to ordered hybrid materials. J. Am. Chem. Soc. 2011, 133, 6513–6516. [Google Scholar] [CrossRef] [PubMed]
- Matsen, M.W.; Bates, F.S. Origins of complex self-assembly in block copolymers. Macromolecules 1996, 29, 7641–7644. [Google Scholar] [CrossRef]
- Jain, S.; Bates, F.S. On the origins of morphological complexity in block copolymer surfactants. Science 2003, 300, 460–464. [Google Scholar] [CrossRef] [PubMed]
- Patel, S.N.; Javier, A.E.; Beers, K.M.; Pople, J.A.; Ho, V.; Segalman, R.A.; Balsara, N.P. Morphology and thermodynamic properties of a copolymer with an electronically conducting block: Poly(3-ethylhexylthiophene)-block-poly(ethylene oxide). Nano Lett. 2012, 12, 4901–4906. [Google Scholar] [CrossRef] [PubMed]
- Ruzette, A.V.G.; Soo, P.P.; Sadoway, D.R.; Mayes, A.M. Melt-formable block copolymer electrolytes for lithium rechargeable batteries. J. Electrochem. Soc. 2001, 148, A537–A543. [Google Scholar] [CrossRef]
- Alexandridis, P.; Yang, L. Micellization of polyoxyalkylene block copolymers in formamide. Macromolecules 2000, 33, 3382–3391. [Google Scholar] [CrossRef]
- Sarkar, B.; Lakshmichand, J.; Alexandridis, P. Self-assembly of amphiphilic block copolymers in ternary solvent mixtures: Lyotropic liquid crystalline phase behavior and structure. Macromol. Chem. Phys. 2012, 213, 2514–2528. [Google Scholar] [CrossRef]
- Alexandridis, P.; Spontak, R.J. Solvent-regulated ordering in block copolymers. Curr. Opin. Colloid Interface Sci. 1999, 4, 130–139. [Google Scholar] [CrossRef]
- Alexandridis, P.; Hatton, T.A. Poly(ethylene oxide)-poly(propylene oxide)-poly(ethylene oxide) block copolymer surfactants in aqueous solutions and at interfaces: Thermodynamics, structure, dynamics, and modeling. Colloids Surf. A 1995, 96, 1–46. [Google Scholar] [CrossRef]
- Sarkar, B.; Alexandridis, P. Alkyl propoxy ethoxylate “graded” surfactants: Micelle formation and structure in aqueous solutions. J. Phys. Chem. B 2010, 114, 4485–4494. [Google Scholar] [CrossRef] [PubMed]
- Sarkar, B.; Lam, S.; Alexandridis, P. Micellization of alkyl-propoxy-ethoxylate surfactants in water-polar organic solvent mixtures. Langmuir 2010, 26, 10532–10540. [Google Scholar] [CrossRef] [PubMed]
- Epps, T.H.; Bailey, T.S.; Pham, H.D.; Bates, F.S. Phase behavior of lithium perchlorate-doped poly(styrene-b-isoprene-b-ethylene oxide) triblock copolymers. Chem. Mater. 2002, 14, 1706–1714. [Google Scholar] [CrossRef]
- Epps, T.H.; Bailey, T.S.; Waletzko, R.; Bates, F.S. Phase behavior and block sequence effects in lithium perchlorate-doped poly(isoprene-b-styrene-b-ethylene oxide) and poly(styrene-b-isoprene-b-ethylene oxide) triblock copolymers. Macromolecules 2003, 36, 2873–2881. [Google Scholar] [CrossRef]
- Chen, J.; Frisbie, C.D.; Bates, F.S. Lithium perchlorate-doped poly(styrene-b-ethylene oxide-b-styrene) lamellae-forming triblock copolymer as high capacitance, smooth, thin film dielectric. J. Phys. Chem. C 2009, 113, 3903–3908. [Google Scholar] [CrossRef]
- Daga, V.K.; Anderson, E.R.; Gido, S.P.; Watkins, J.J. Hydrogen bond assisted assembly of well-ordered polyhedral oligomeric silsesquioxane-block copolymer composites. Macromolecules 2011, 44, 6793–6799. [Google Scholar] [CrossRef]
- Castelletto, V.; Hamley, I.W. Morphologies of block copolymer melts. Curr. Opin. Solid State Mater. Sci. 2004, 8, 426–438. [Google Scholar] [CrossRef]
- Gunkel, I.; Thurn-Albrecht, T. Thermodynamic and structural changes in ion-containing symmetric diblock copolymers: A small-angle X-ray scattering study. Macromolecules 2012, 45, 283–291. [Google Scholar] [CrossRef]
- Nakamura, I.; Balsara, N.P.; Wang, Z.G. Thermodynamics of ion-containing polymer blends and block copolymers. Phys. Rev. Lett. 2011, 107, 198301. [Google Scholar] [CrossRef] [PubMed]
- Villaluenga, I.; Chen, X.C.; Devaux, D.; Hallinan, D.T.; Balsara, N.P. Nanoparticle-driven assembly of highly conducting hybrid block copolymer electrolytes. Macromolecules 2015, 48, 358–364. [Google Scholar] [CrossRef]
- Li, J.; Kamata, K.; Komura, M.; Yamada, T.; Yoshida, H.; Iyoda, T. Anisotropic ion conductivity in liquid crystalline diblock copolymer membranes with perpendicularly oriented PEO cylindrical domains. Macromolecules 2007, 40, 8125–8128. [Google Scholar] [CrossRef]
- Majewski, P.W.; Gopinadhan, M.; Jang, W.S.; Lutkenhaus, J.L.; Osuji, C.O. Anisotropic ionic conductivity in block copolymer membranes by magnetic field alignment. J. Am. Chem. Soc. 2010, 132, 17516–17522. [Google Scholar] [CrossRef] [PubMed]
- Schaetzl, D.M.; Li, P.; Chaudhari, N.; Bernstein, G.H.; Fullerton-Shirey, S.K. Magnetic alignment of gamma (core)-alpha (shell) Fe2O3 nanorods in a solid polymer electrolyte for Li-ion batteries. J. Phys. Chem. C 2014, 118, 18836–18845. [Google Scholar] [CrossRef]
- Xiong, H.M.; Zhao, K.K.; Zhao, X.; Wang, Y.W.; Chen, J.S. Elucidating the conductivity enhancement effect of nano-sized SnO2 fillers in the hybrid polymer electrolyte PEO-SnO2-LiClO4. Solid State Ion. 2003, 159, 89–95. [Google Scholar] [CrossRef]
- Martinvosshage, D.; Chowdari, B.V.R. XPS studies on PEOn-LiClO4 and PEOn-Cu(ClO4)2 polymer electrolytes. J. Electrochem. Soc. 1995, 142, 1442–1446. [Google Scholar]
- Saalwachter, K.; Schnell, I. REDOR-based heteronuclear dipolar correlation experiments in multi-spin systems: Rotor-encoding, directing, and multiple distance and angle determination. Solid State Nucl. Magn. Reson. 2002, 22, 154–187. [Google Scholar] [CrossRef] [PubMed]
- Thieme, K.; Schnell, I. Determination of long-range distances and dynamic order parameters by dipolar recoupling in high-resolution magic-angle spinning NMR spectroscopy. J. Am. Chem. Soc. 2003, 125, 12100–12101. [Google Scholar] [CrossRef] [PubMed]
- Gullion, T.; Schaefer, J. Detection of weak heteronuclear dipolar coupling by rotational-echo double-resonance nuclear magnetic resonance. In Advances in Magnetic and Optical Resonance; Warren, S.W., Ed.; Academic Press: New York, NY, USA, 1989. [Google Scholar]
- Judeinstein, P.; Reichert, D.; DeAzevedo, E.R.; Bonagamba, T.J. NMR multi-scale description of ionic conductivity mechanisms inside polymer electrolytes. Acta Chim. Slov. 2005, 52, 349–360. [Google Scholar]
- Reichert, D.; Pascui, O.; Judeinstein, P.; Gullion, T. Determination of intermolecular distances in solid polymer electrolytes by 13C-7Li REDOR NMR. Chem. Phys. Lett. 2005, 402, 43–47. [Google Scholar] [CrossRef]
- Gadjourova, Z.; Marero, D.M.; Andersen, K.H.; Andreev, Y.G.; Bruce, P.G. Structures of the polymer electrolyte complexes PEO6:LiXF6 (X = P, Sb), determined from neutron powder diffraction data. Chem. Mater. 2001, 13, 1282–1285. [Google Scholar] [CrossRef]
- Schantz, S.; Torell, L.M.; Stevens, J.R. Raman and brillouin-scattering of LiClO4 complexed in poly(propylene-glycol). J. Appl. Phys. 1988, 64, 2038–2043. [Google Scholar] [CrossRef]
- Wieczorek, W.; Raducha, D.; Zalewska, A.; Stevens, J.R. Effect of salt concentration on the conductivity of PEO-based composite polymeric electrolytes. J. Phys. Chem. B 1998, 102, 8725–8731. [Google Scholar] [CrossRef]
- Salomon, M.; Xu, M.Z.; Eyring, E.M.; Petrucci, S. Molecular structure and dynamics of LiClO4-polyethylene oxide-400 (dimethyl ether and diglycol systems) at 25 °C. J. Phys. Chem. 1994, 98, 8234–8244. [Google Scholar] [CrossRef]
- Ni’mah, Y.L.; Cheng, M.-Y.; Cheng, J.H.; Rick, J.; Hwang, B.-J. Solid-state polymer nanocomposite electrolyte of TiO2/PEO/NaClO4 for sodium ion batteries. J. Power Sources 2015, 278, 375–381. [Google Scholar] [CrossRef]
- Zugmann, S.; Gores, H. Transference Numbers of Ions in Electrolytes. In Encyclopedia of Applied Electrochemistry; Kreysa, G., Ota, K.-I., Savinell, R., Eds.; Springer: New York, NY, USA, 2014; pp. 2086–2091. [Google Scholar]
- Gorecki, W.; Andreani, R.; Berthier, C.; Armand, M.; Mali, M.; Roos, J.; Brinkmann, D. NMR, DSC and conductivity study of a poly(ethylene oxide) complex electrolyte: PEO(LiClO4)x. Solid State Ion. 1986, 18–19, 295–299. [Google Scholar] [CrossRef]
- McLin, M.G.; Angell, C.A. Probe ion diffusivity measurements in salt-in-polymer electrolytes: Stokes radii and the transport number problem. J. Phys. Chem. 1996, 100, 1181–1188. [Google Scholar] [CrossRef]
- Abbrent, S.; Greenbaum, S. Recent progress in NMR spectroscopy of polymer electrolytes for lithium batteries. Curr. Opin. Colloid Interface Sci. 2013, 18, 228–244. [Google Scholar] [CrossRef]
- Volkov, V.I.; Marinin, A.A. NMR methods for studying ion and molecular transport in polymer electrolytes. Russ. Chem. Rev. 2013, 82, 248–272. [Google Scholar] [CrossRef]
- Golodnitsky, D.; Ardel, G.; Peled, E. Ion-transport phenomena in concentrated PEO-based composite polymer electrolytes. Solid State Ion. 2002, 147, 141–155. [Google Scholar] [CrossRef]
- Ciosek, M.; Sannier, L.; Siekierski, M.; Golodnitsky, D.; Peled, E.; Scrosati, B.; Glowinkowski, S.; Wieczorek, W. Ion transport phenomena in polymeric electrolytes. Electrochim. Acta 2007, 53, 1409–1416. [Google Scholar] [CrossRef]
- Sorensen, P.R.; Jacobsen, T. Conductivity, charge-transfer and transport number—An ac-investigation of the polymer electrolyte LiSCN-poly(ethyleneoxide). Electrochim. Acta 1982, 27, 1671–1675. [Google Scholar] [CrossRef]
- Weston, J.E.; Steele, B.C.H. Effects of inert fillers on the mechanical and electrochemical properties of lithium salt poly(ethylene-oxide) polymer electrolytes. Solid State Ion. 1982, 7, 75–79. [Google Scholar] [CrossRef]
- Sorensen, P.R. Limiting currents in the polymer electrolyte: PEOxLiCF3SO3. Solid State Ion. 1983, 9–10, 1147–1153. [Google Scholar] [CrossRef]
- Clancy, S.; Shriver, D.F. DC Measurement of transference numbers in polymeric solid electrolytes. J. Electrochem. Soc. 1984, 131, C328–C328. [Google Scholar]
- Bouridah, A.; Dalard, F.; Deroo, D.; Armand, M.B. Potentiometric measurements of ionic mobilities in poly(ethyleneoxide) electrolytes. Solid State Ion. 1986, 18–19, 287–290. [Google Scholar] [CrossRef]
- Gorecki, W.; Donoso, P.; Berthier, C.; Mali, M.; Roos, J.; Brinkmann, D.; Armand, M.B. NMR, DSC and conductivity study of the polymer solid electrolytes P(EO)-(LiCp+1F2p+3SO3)x. Solid State Ion. 1988, 28, 1018–1022. [Google Scholar] [CrossRef]
- Gorecki, W.; Roux, C.; Clemancey, M.; Armand, M.; Belorizky, E. NMR and conductivity study of polymer electrolytes in the imide family: P(EO)/Li[N(SO2CnF2n+1)(SO2CmF2m+1)]. ChemPhysChem 2002, 3, 620–625. [Google Scholar] [CrossRef]
- Bhattacharja, S.; Smoot, S.W.; Whitmore, D.H. Cation and anion diffusion in the amorphous phase of the polymer electrolyte (PEO)8-LiCF3SO3. Solid State Ion. 1986, 18–19, 306–314. [Google Scholar] [CrossRef]
- Zugmann, S.; Fleischmann, M.; Amereller, M.; Gschwind, R.M.; Wiemhofer, H.D.; Gores, H.J. Measurement of transference numbers for lithium ion electrolytes via four different methods, a comparative study. Electrochim. Acta 2011, 56, 3926–3933. [Google Scholar] [CrossRef]
- Aihara, Y.; Appetecchi, G.B.; Scrosati, B.; Hayamizu, K. Investigation of the ionic conduction mechanism of composite poly(ethyleneoxide) PEO-based polymer gel electrolytes including nano-size SiO2. Phys. Chem. Chem. Phys. 2002, 4, 3443–3447. [Google Scholar] [CrossRef]
- Croce, F.; Persi, L.; Scrosati, B.; Serraino-Fiory, F.; Plichta, E.; Hendrickson, M.A. Role of the ceramic fillers in enhancing the transport properties of composite polymer electrolytes. Electrochim. Acta 2001, 46, 2457–2461. [Google Scholar] [CrossRef]
- Baldwin, R.S. The NASA “PERS” Program: Solid Polymer Electrolyte Development for Advanced Lithium-Based Batteries; National Aeronautics and Space Administration (NASA): Moffett Field, CA, USA, 2007.
- Polymer Electrolyte Reviews—2; MacCallum, J.R.; Vincent, C.A. (Eds.) Elsevier Applied Science: London, UK, 1989.
- Atkins, P.W. Physical Chemistry; Oxford: New York, NY, USA, 1982. [Google Scholar]
- Porter, C.H.; Boyd, R.H. Dielectric study of effects of melting on molecular relaxation in poly(ethylene oxide) and polyoxymethylene. Macromolecules 1971, 4, 589–594. [Google Scholar] [CrossRef]
- Karan, N.K.; Pradhan, D.K.; Thomas, R.; Natesan, B.; Katiyar, R.S. Solid polymer electrolytes based on polyethylene oxide and lithium trifluoro-methane sulfonate (PEO-LiCF3SO3): Ionic conductivity and dielectric relaxation. Solid State Ion. 2008, 179, 689–696. [Google Scholar] [CrossRef]
- McKenzie, I.; Harada, M.; Kiefl, R.F.; Levy, C.D.P.; MacFarlane, W.A.; Morris, G.D.; Ogata, S.-I.; Pearson, M.R.; Sugiyama, J. β-NMR measurements of lithium ion transport in thin films of pure and lithium-salt-doped poly(ethylene oxide). J. Am. Chem. Soc. 2014, 136, 7833–7836. [Google Scholar] [CrossRef] [PubMed]
- Money, B.K.; Hariharan, K.; Swenson, J. A dielectric relaxation study of nanocomposite polymer electrolytes. Solid State Ion. 2012, 225, 346–349. [Google Scholar] [CrossRef]
- Ganapatibhotla, L.V.N.R.; Maranas, J.K. Interplay of surface chemistry and ion content in nanoparticle-filled solid polymer electrolytes. Macromolecules 2014, 47, 3625–3634. [Google Scholar] [CrossRef]
- Bartolotta, A.; Dimarco, G.; Galli, G.; Lanza, M.; Salvato, G. Dielectric γ-relaxation in NaSCN salt complexed PEO. Colloid Polym. Sci. 1993, 271, 726–730. [Google Scholar] [CrossRef]
- Masoud, E.M.; El-Bellihi, A.A.; Bayoumy, W.A.; Mousa, M.A. Effect of LiAlO2 nanoparticle filler concentration on the electrical properties of PEO-LiClO4 composite. Mater. Res. Bull. 2013, 48, 1148–1154. [Google Scholar] [CrossRef]
- Awadhia, A.; Patel, S.K.; Agrawal, S.L. Dielectric investigations in PVA based gel electrolytes. Prog. Cryst. Growth Charact. Mater. 2006, 52, 61–68. [Google Scholar] [CrossRef]
- Xiong, H.M.; Zhao, X.; Chen, J.S. New polymer-inorganic nanocomposites: PEO-ZnO and PEO-ZnO-LiClO4 films. J. Phys. Chem. B 2001, 105, 10169–10174. [Google Scholar] [CrossRef]
- Finch, C.A. Polyvinyl Alcohol: Properties and Applications; Wiley: London, UK, 1973. [Google Scholar]
- Ibrahim, S.; Yasin, S.M.M.; Nee, N.M.; Ahmad, R.; Johan, M.R. Conductivity and dielectric behaviour of PEO-based solid nanocomposite polymer electrolytes. Solid State Commun. 2012, 152, 426–434. [Google Scholar] [CrossRef]
- Choudhary, S.; Sengwa, R.J. Dielectric properties and structural conformation of melt compounded PEO-LiCF3SO3-MMT nanocomposite electrolytes. Indian J. Pure Appl. Phys. 2011, 49, 602–607. [Google Scholar]
- Choudhary, S.; Bald, A.; Sengwa, R.J. Dielectric behaviour, ionic conductivity and structure of high energy ball mill blended melt pressed and solution cast solid polymeric nanocomposite electrolytes. Indian J. Pure Appl. Phys. 2013, 51, 769–779. [Google Scholar]
- Choudhary, S.; Sengwa, R.J. Ionic conduction and relaxation processes in melt compounded poly(ethylene oxide)-lithium perchlorate trihydrate-montmorillonite nanocomposite electrolyte. Indian J. Eng. Mater. Sci. 2011, 18, 147–156. [Google Scholar]
- Ravi, M.; Pavani, Y.; Kumar, K.K.; Bhavani, S.; Sharma, A.K.; Rao, V. Studies on electrical and dielectric properties of PVP:KBrO4 complexed polymer electrolyte films. Mater. Chem. Phys. 2011, 130, 442–448. [Google Scholar] [CrossRef]
- Kumar, K.K.; Ravi, M.; Pavani, Y.; Bhavani, S.; Sharma, A.K.; Rao, V. Electrical conduction mechanism in NaCl complexed PEO/PVP polymer blend electrolytes. J. Non-cryst. Solids 2012, 358, 3205–3211. [Google Scholar]
- Karmakar, A.; Ghosh, A. A comparison of ion transport in different polyethylene oxide-lithium salt composite electrolytes. J. Appl. Phys. 2010, 107, 104113. [Google Scholar] [CrossRef]
- Choudhary, S.; Sengwa, R.J. Dielectric spectroscopy and confirmation of ion conduction mechanism in direct melt compounded hot-press polymer nanocomposite electrolytes. Ionics 2011, 17, 811–819. [Google Scholar] [CrossRef]
- Sharma, A.L.; Thakur, A.K. AC conductivity and relaxation behavior in ion conducting polymer nanocomposite. Ionics 2011, 17, 135–143. [Google Scholar] [CrossRef]
- Sengwa, R.J.; Choudhary, S. Dielectric relaxations and structures of nanoclay in solution cast poly(ethylene oxide)-montmorillonite clay nanocomposites. J. Macromol. Sci. Part B Phys. 2011, 50, 1313–1324. [Google Scholar] [CrossRef]
- Sengwa, R.J.; Sankha, S. Dielectric dispersion study of coexisting phases of aqueous polymeric solution: Poly(vinyl alcohol) plus poly(vinyl pyrrolidone) two-phase systems. Polymer 2007, 48, 2737–2744. [Google Scholar] [CrossRef]
- Klein, R.J.; Zhang, S.H.; Dou, S.; Jones, B.H.; Colby, R.H.; Runt, J. Modeling electrode polarization in dielectric spectroscopy: Ion mobility and mobile ion concentration of single-ion polymer electrolytes. J. Chem. Phys. 2006. [Google Scholar] [CrossRef] [PubMed]
- Sengwa, R.J.; Sankhla, S.; Choudhary, S. Effect of melt compounding temperature on dielectric relaxation and ionic conduction in PEO-NaClO4-MMT nanocomposite electrolytes. Ionics 2010, 16, 697–707. [Google Scholar] [CrossRef]
- Choudhary, S.; Sengwa, R.J. Effect of different anions of lithium salt and MMT nanofiller on ion conduction in melt-compounded PEO-LiX-MMT electrolytes. Ionics 2012, 18, 379–384. [Google Scholar] [CrossRef]
- Choudhary, S.; Sengwa, R.J. Dielectric relaxation spectroscopy and ion conduction in poly(ethylene oxide)-blend salts-montmorillonite nanocomposite electrolytes. Indian J. Pure Appl. Phys. 2011, 49, 204–213. [Google Scholar]
- Sengwa, R.J.; Choudhary, S. Dielectric relaxation spectroscopy and X-ray diffraction studies of poly(ethylene oxide)-lithium perchlorate electrolytes. Indian J. Phys. 2014, 88, 461–470. [Google Scholar] [CrossRef]
- Money, B.K.; Hariharan, K.; Swenson, J. Relation between structural and conductivity relaxation in PEO and PEO based electrolytes. Solid State Ion. 2014, 262, 785–789. [Google Scholar] [CrossRef]
- Choudhary, S.; Sengwa, R.J. Structural and dielectric studies of amorphous and semicrystalline polymers blend-based nanocomposite electrolytes. J. Appl. Polym. Sci. 2015, 132, 41311. [Google Scholar] [CrossRef]
- Li, X.; Hsu, S.L. An analysis of the crystallization behavior of poly(ethylene oxide)/poly(methyl methacrylate) blends by spectroscopic and calorimetric techniques. J. Polym. Sci. Part B 1984, 22, 1331–1342. [Google Scholar] [CrossRef]
- Croce, F.; Appetecchi, G.B.; Persi, L.; Scrosati, B. Nanocomposite polymer electrolytes for lithium batteries. Nature 1998, 394, 456–458. [Google Scholar]
- Fullerton-Shirey, S.K.; Maranas, J.K. Structure and mobility of PEO/LiClO4 solid polymer electrolytes filled with Al2O3 nanoparticles. J. Phys. Chem. C 2010, 114, 9196–9206. [Google Scholar] [CrossRef]
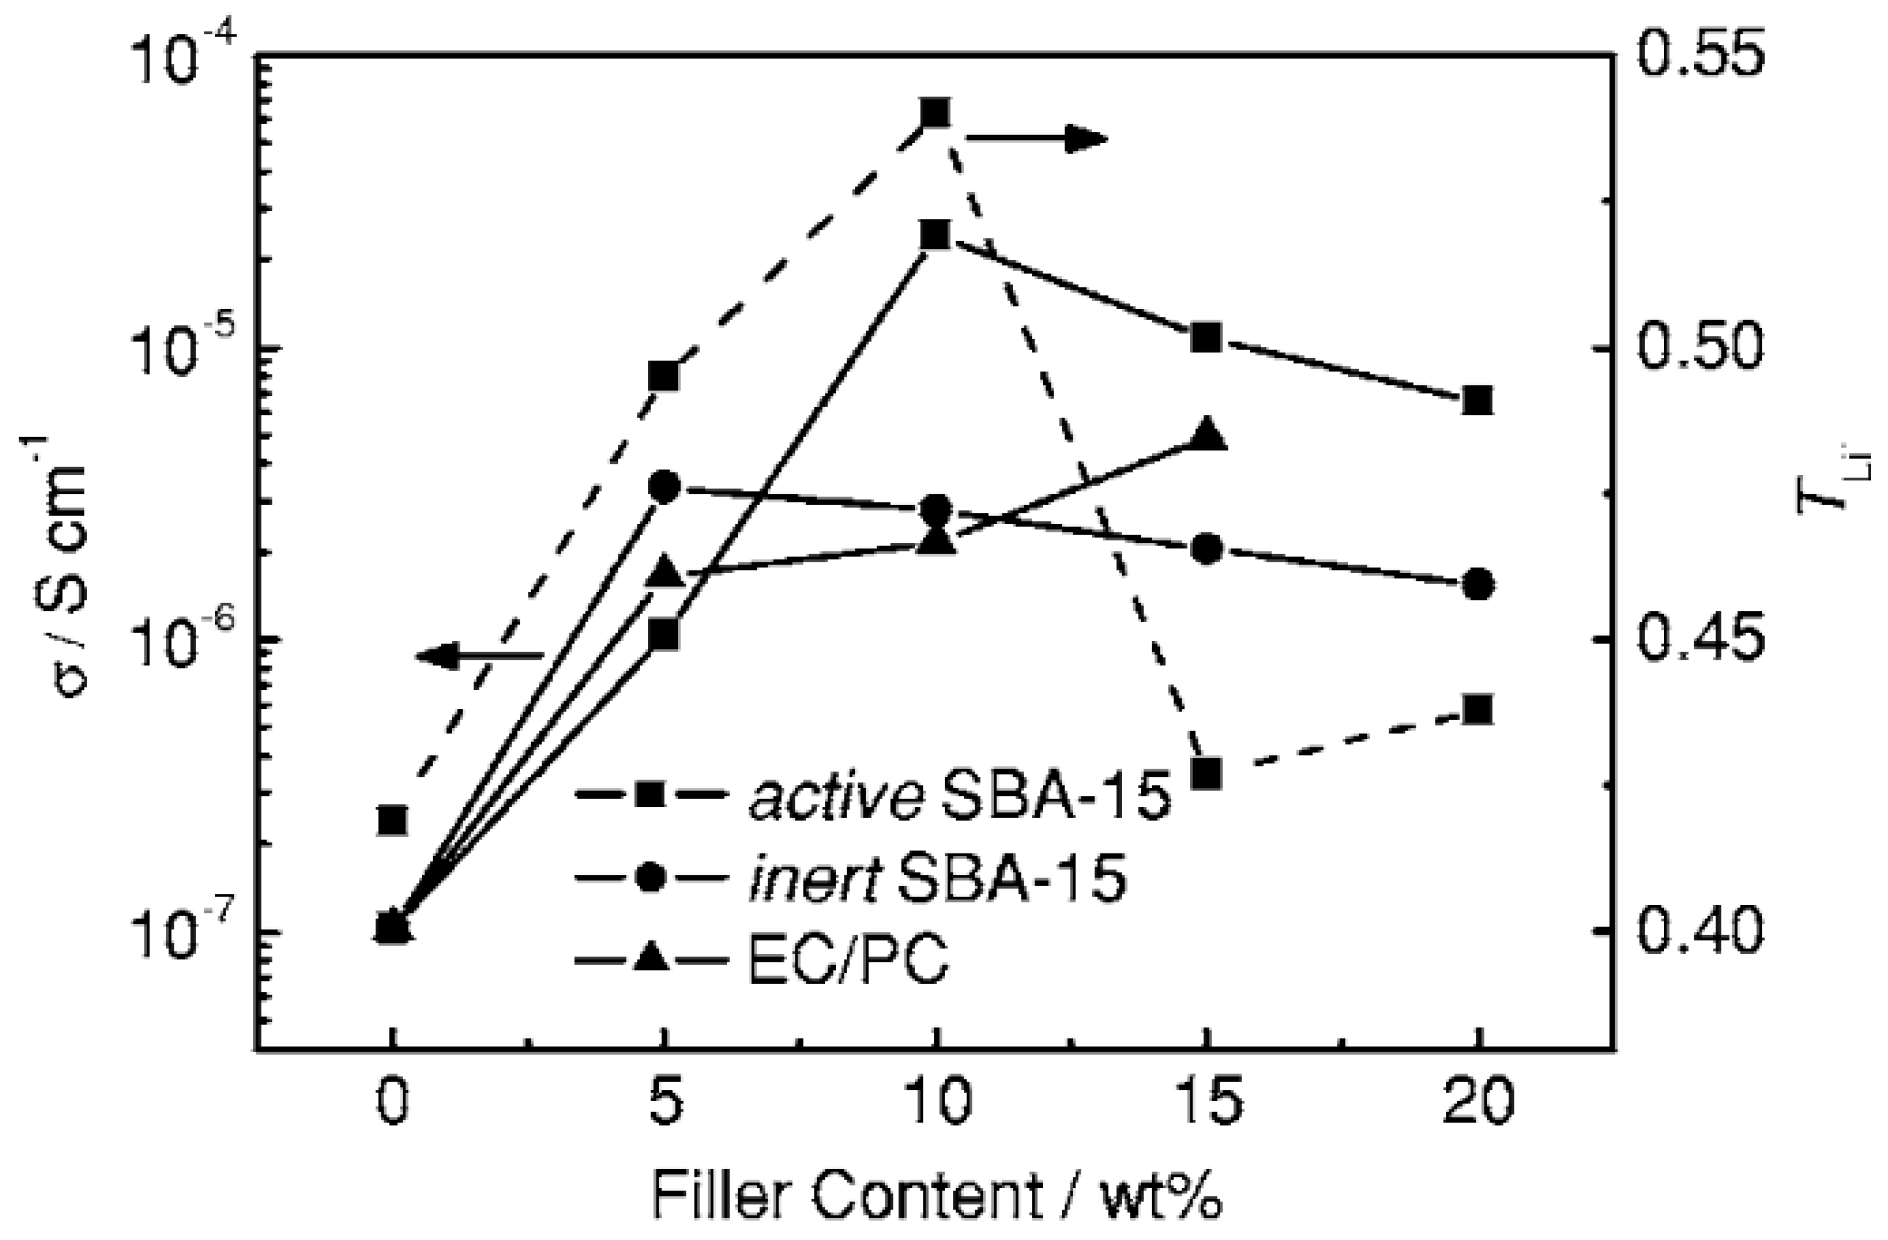
- Wang, X.L.; Mei, A.; Li, M.; Lin, Y.H.; Nan, C.W. Effect of silane-functionalized mesoporous silica SBA-15 on performance of PEO-based composite polymer electrolytes. Solid State Ion. 2006, 177, 1287–1291. [Google Scholar] [CrossRef]
- Appetecchi, G.B.; Carewska, M.; Alessandrini, F.; Prosini, P.P.; Passerini, S. Characterization of PEO-based composite cathodes—I. Morphological, thermal, mechanical, and electrical properties. J. Electrochem. Soc. 2000, 147, 451–459. [Google Scholar] [CrossRef]
- Tang, C.Y.; Hackenberg, K.; Fu, Q.; Ajayan, P.M.; Ardebili, H. High ion conducting polymer nanocomposite electrolytes using hybrid nanofillers. Nano Lett. 2012, 12, 1152–1156. [Google Scholar] [CrossRef] [PubMed]
- Schaefer, J.L.; Moganty, S.S.; Yanga, D.A.; Archer, L.A. Nanoporous hybrid electrolytes. J. Mater. Chem. 2011, 21, 10094–10101. [Google Scholar] [CrossRef]
- Malathi, M.; Tamilarasan, K. Synthesis and characterization of polyethylene oxide based nano composite electrolyte. Sadhana Acad. Proc. Eng. Sci. 2014, 39, 999–1007. [Google Scholar] [CrossRef]
- Kelarakis, A.; Giannelis, E.P. Crystallization and unusual rheological behavior in poly(ethylene oxide)-clay nanocomposites. Polymer 2011, 52, 2221–2227. [Google Scholar] [CrossRef]
- Booth, C. Thermodynamics of mixtures of poly(ethylene oxide) and benzene. Polymer 1971, 12, 309–319. [Google Scholar] [CrossRef]
- Krishnamoorti, R.; Giannelis, E.P. Rheology of end-tethered polymer layered silicate nanocomposites. Macromolecules 1997, 30, 4097–4102. [Google Scholar] [CrossRef]
- Hoffmann, B.; Dietrich, C.; Thomann, R.; Friedrich, C.; Mulhaupt, R. Morphology and rheology of polystyrene nanocomposites based upon organoclay. Macromol. Rapid Commun. 2000, 21, 57–61. [Google Scholar] [CrossRef]
- Krishnamoorti, R.; Giannelis, E.P. Strain hardening in model polymer brushes under shear. Langmuir 2001, 17, 1448–1452. [Google Scholar] [CrossRef]
- Krishnamoorti, R.; Yurekli, K. Rheology of polymer layered silicate nanocomposites. Curr. Opin. Colloid Interface Sci. 2001, 6, 464–470. [Google Scholar] [CrossRef]
- Kelarakis, A.; Yoon, K.; Somani, R.H.; Chen, X.M.; Hsiao, B.S.; Chu, B. Rheological study of carbon nanofiber induced physical gelation in polyolefin nanocomposite melt. Polymer 2005, 46, 11591–11599. [Google Scholar] [CrossRef]
- Fan, J.; Raghavan, S.R.; Yu, X.Y.; Khan, S.A.; Fedkiw, P.S.; Hou, J.; Baker, G.L. Composite polymer electrolytes using surface-modified fumed silicas: Conductivity and rheology. Solid State Ion. 1998, 111, 117–123. [Google Scholar] [CrossRef]
- Kumar, B.; Scanlon, L.G. Polymer-ceramic composite electrolytes: Conductivity and thermal history effects. Solid State Ion. 1999, 124, 239–254. [Google Scholar] [CrossRef]
- Kumar, B. From colloidal to composite electrolytes: Properties, peculiarities, and possibilities. J. Power Sources 2004, 135, 215–231. [Google Scholar] [CrossRef]
- Kumar, B.; Scanlon, L.G.; Spry, R.J. On the origin of conductivity enhancement in polymer-ceramic composite electrolytes. J. Power Sources 2001, 96, 337–342. [Google Scholar] [CrossRef]
- Fullerton-Shirey, S.K.; Ganapatibhotla, L.V.N.R.; Shi, W.J.; Maranas, J.K. Influence of thermal history and humidity on the ionic conductivity of nanoparticle-filled solid polymer electrolytes. J. Polym. Sci. Part B 2011, 49, 1496–1505. [Google Scholar] [CrossRef]
- Ji, J.Y.; Keen, J.; Zhong, W.H. Simultaneous improvement in ionic conductivity and mechanical properties of multi-functional block-copolymer modified solid polymer electrolytes for lithium ion batteries. J. Power Sources 2011, 196, 10163–10168. [Google Scholar] [CrossRef]
- Qi, D.J.; Ru, H.Q.; Bi, X.G.; Yang, X.H.; Ma, Z.N. A novel PEO-based composite polymer electrolyte with NaAlOSiO molecular sieves powders. Ionics 2012, 18, 267–273. [Google Scholar] [CrossRef]
- Angulakshmi, N.; Kumar, R.S.; Kulandainathan, M.A.; Stephan, A.M. Composite polymer electrolytes encompassing metal organic frame works: A new strategy for all-solid-state lithium batteries. J. Phys. Chem. C 2014, 118, 24240–24247. [Google Scholar] [CrossRef]
- Kumar, R.S.; Raja, M.; Kulandainathan, M.A.; Stephan, A.M. Metal organic framework-laden composite polymer electrolytes for efficient and durable all-solid-state-lithium batteries. RSC Adv. 2014, 4, 26171–26175. [Google Scholar] [CrossRef]
- Pitawala, H.; Dissanayake, M.; Seneviratne, V.A. Combined effect of Al2O3 nano-fillers and EC plasticizer on ionic conductivity enhancement in the solid polymer electrolyte (PEO)9LiTf. Solid State Ion. 2007, 178, 885–888. [Google Scholar] [CrossRef]
- Johan, M.R.; Ting, L.M. Structural, Thermal and electrical properties of nano manganese-composite polymer electrolytes. Int. J. Electrochem. Sci. 2011, 6, 4737–4748. [Google Scholar]
- Vignarooban, K.; Dissanayake, M.A.K.L.; Albinsson, I.; Mellander, B.E. Effect of TiO2 nano-filler and EC plasticizer on electrical and thermal properties of poly(ethylene oxide) (PEO) based solid polymer electrolytes. Solid State Ion. 2014, 266, 25–28. [Google Scholar] [CrossRef]
- Wang, Y.; Li, B.; Ji, J.; Zhong, W.-H. Controlled Li+ conduction pathway to achieve enhanced ionic conductivity in polymer electrolytes. J. Power Sources 2014, 247, 452–459. [Google Scholar] [CrossRef]
- Li, H.; Zhang, H.; Liang, Z.Y.; Chen, Y.M.; Zhu, B.K.; Zhu, L.P. Preparation and properties of poly (vinylidene fluoride)/poly(dimethylsiloxane) graft (poly(propylene oxide)-block-poly(ethylene oxide)) blend porous separators and corresponding electrolytes. Electrochim. Acta 2014, 116, 413–420. [Google Scholar] [CrossRef]
- Jankowsky, S.; Hiller, M.M.; Wiemhoefer, H.D. Preparation and electrochemical performance of polyphosphazene based salt-in-polymer electrolyte membranes for lithium ion batteries. J. Power Sources 2014, 253, 256–262. [Google Scholar] [CrossRef]
- Kwon, S.-J.; Kim, D.-G.; Shim, J.; Lee, J.H.; Baik, J.-H.; Lee, J.-C. Preparation of organic/inorganic hybrid semi-interpenetrating network polymer electrolytes based on poly(ethylene oxide-co-ethylene carbonate) for all-solid-state lithium batteries at elevated temperatures. Polymer 2014, 55, 2799–2808. [Google Scholar] [CrossRef]
- Kuo, P.-L.; Wu, C.-A.; Lu, C.-Y.; Tsao, C.-H.; Hsu, C.-H.; Hou, S.-S. High performance of transferring lithium ion for polyacrylonitrile-interpenetrating crosslinked polyoxyethylene network as gel polymer electrolyte. ACS Appl. Mater. Interfaces 2014, 6, 3156–3162. [Google Scholar] [CrossRef] [PubMed]
- Huang, J.; Wang, R.Y.; Tong, Z.Z.; Xu, J.T.; Fan, Z.Q. Influence of ionic species on the microphase separation behavior of PCL-b-PEO/salt hybrids. Macromolecules 2014, 47, 8359–8367. [Google Scholar] [CrossRef]
- Zhou, D.; Mei, X.G.; Ouyang, J.Y. Ionic Conductivity enhancement of polyethylene oxide-LiClO4 electrolyte by adding functionalized multi-walled carbon nanotubes. J. Phys. Chem. C 2011, 115, 16688–16694. [Google Scholar] [CrossRef]


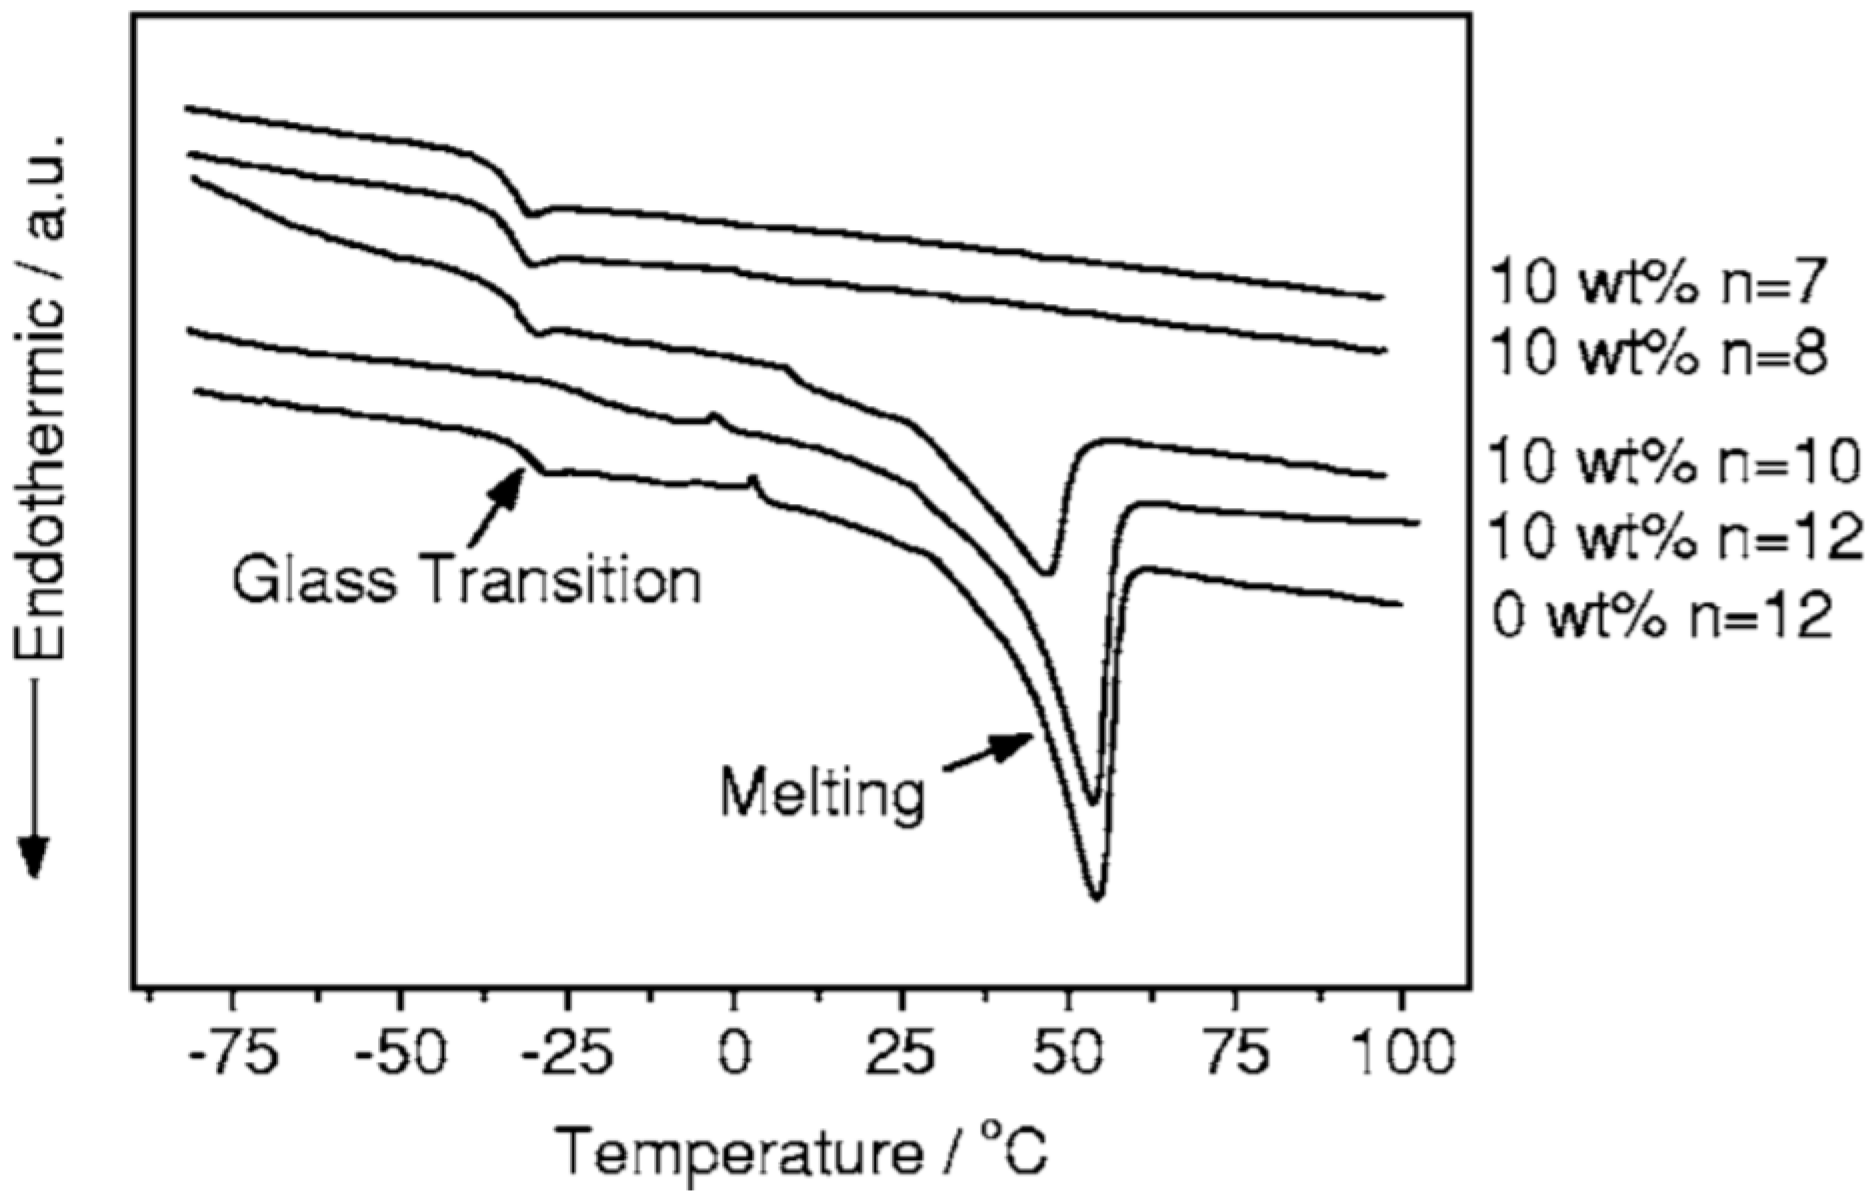
| CdO (wt %) | Tg (°C) (±2) | Tm (°C) (±2) | ΔH (J·g−1) | χc (%) |
|---|---|---|---|---|
| 0 | −36.4 | 55.9 | 51.9 | 24.3 |
| 0.05 | −49.6 | 46.8 | 28.8 | 13.4 |
| 0.10 | −48.9 | 45.1 | 25.3 | 11.8 |
| 0.15 | −49.9 | 51.2 | 39.3 | 18.4 |
| 0.20 | −49.6 | 53.2 | 41.0 | 19.2 |
| Series 1 | Series 2 | Series 3 | Series 4 | |
|---|---|---|---|---|
| Composition | [41]6[4]-I | [58]6[4]-I | [58]6[4]-I | [76]17[4]-II |
| [58]6[4]-I | [58]12[4]-I | [58]6[8]-I | [76]17[8]-II | |
| [73]6[4]-I | [58]20[4]-I | [58]6[10]-I | [76]17[10]-II | |
| [78]6[4]-I | [58]6[15]-I | [76]17[15]-II | ||
| [83]6[4]-I | [58]6[30]-I | [76]17[30]-II | ||
| [91]6[4]-I | [58]6[80]-I | |||
| [95]6[4]-I | ||||
| TgNMR (°C) | Approximately constant X < 80: −32 ± 5 X > 80: −48 ± 5 | Increase −37 → −28 | Approximately constant −38 ± 5 | Decrease 7 → −16 |
| Tmax (°C) | Approximately constant X < 80: 30 ± 5 X > 80: 21 ± 5 | Increase 26 → 46 | Approximately constant 19 ± 5 | Decrease 81 → 43 |
| Δυ (kHz) | Increase 5.4 → 8.0 | Approximately constant 6.4 ± 0.3 | Decrease 6.4 → 2.7 | Increase 5.7 → 6.7 |
| Sample | A | B | C | D |
|---|---|---|---|---|
| Structural O atoms | 86% | 87% | 89% | 83% |
| Adsorbed O atoms | 45% | 39% | 36% | 44% |
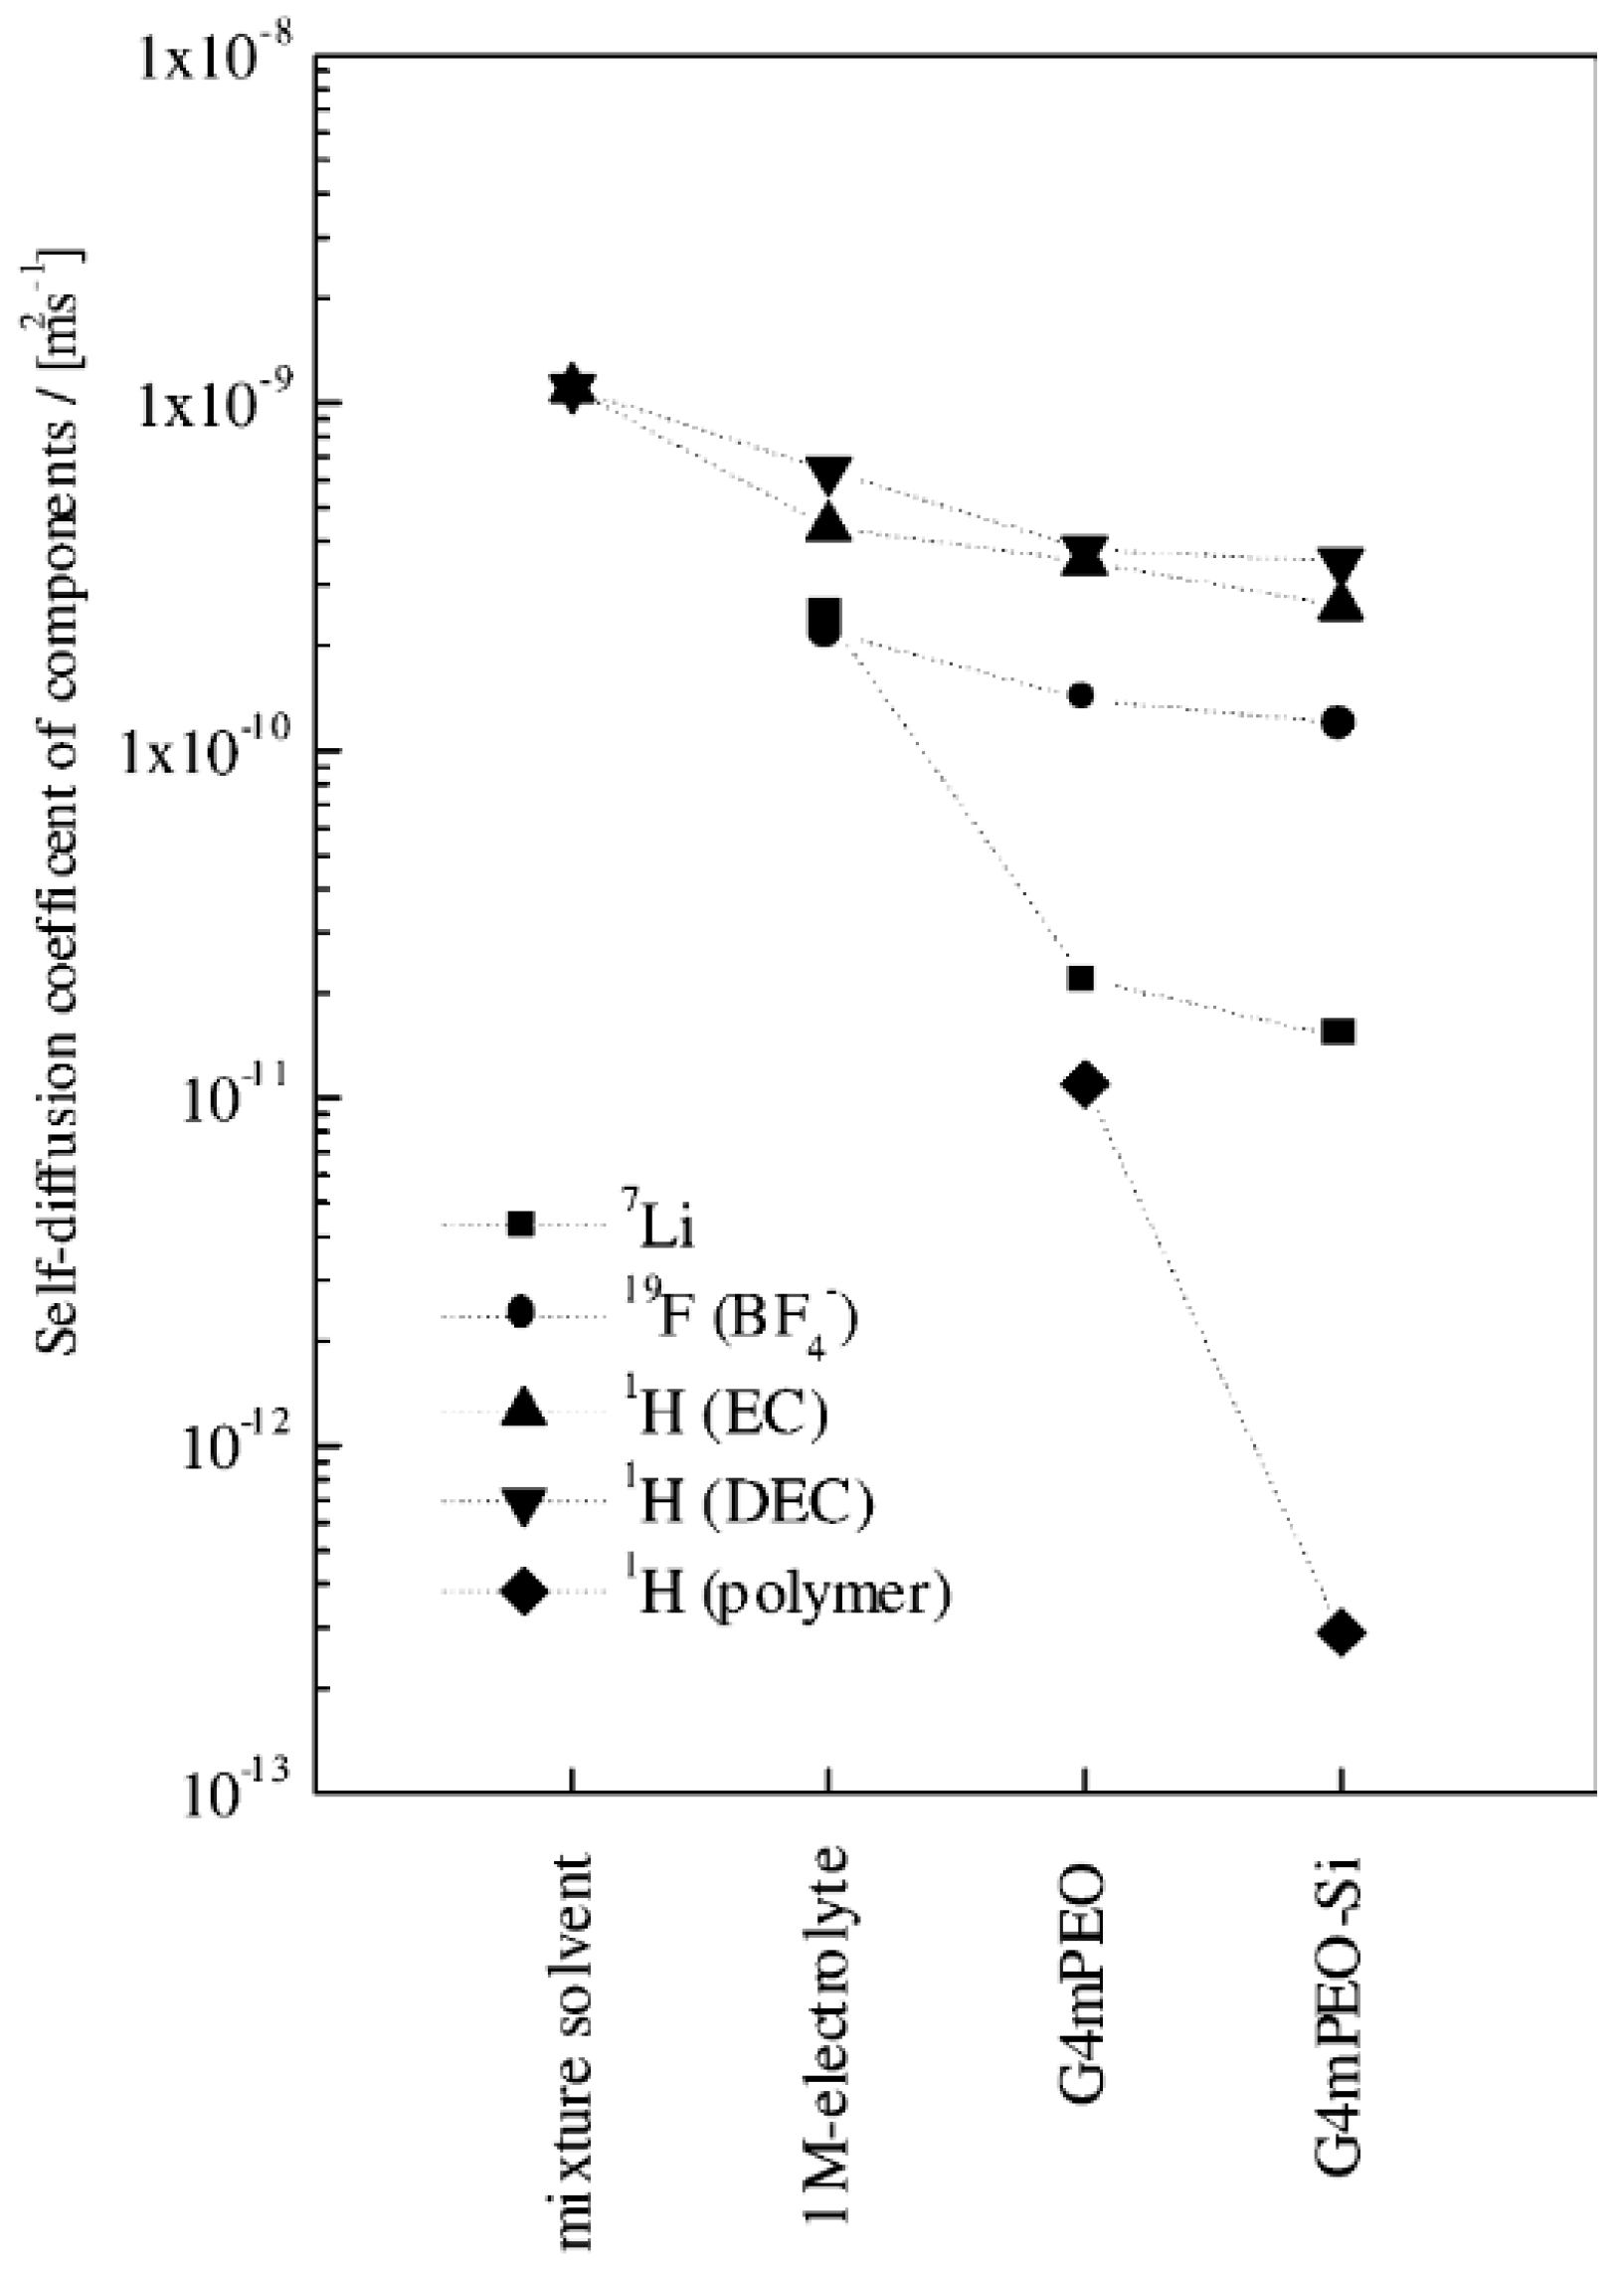
| Sample | t+NMR a | t+pol b |
|---|---|---|
| 1M LiBF4 in EC–DEC | 0.52 | - |
| G4mPEO swelled by EC–DEC | 0.14 | 0.34 |
| G4mPEO–10 wt % SiO2, swelled by EC–DEC | 0.11 | 0.40 |
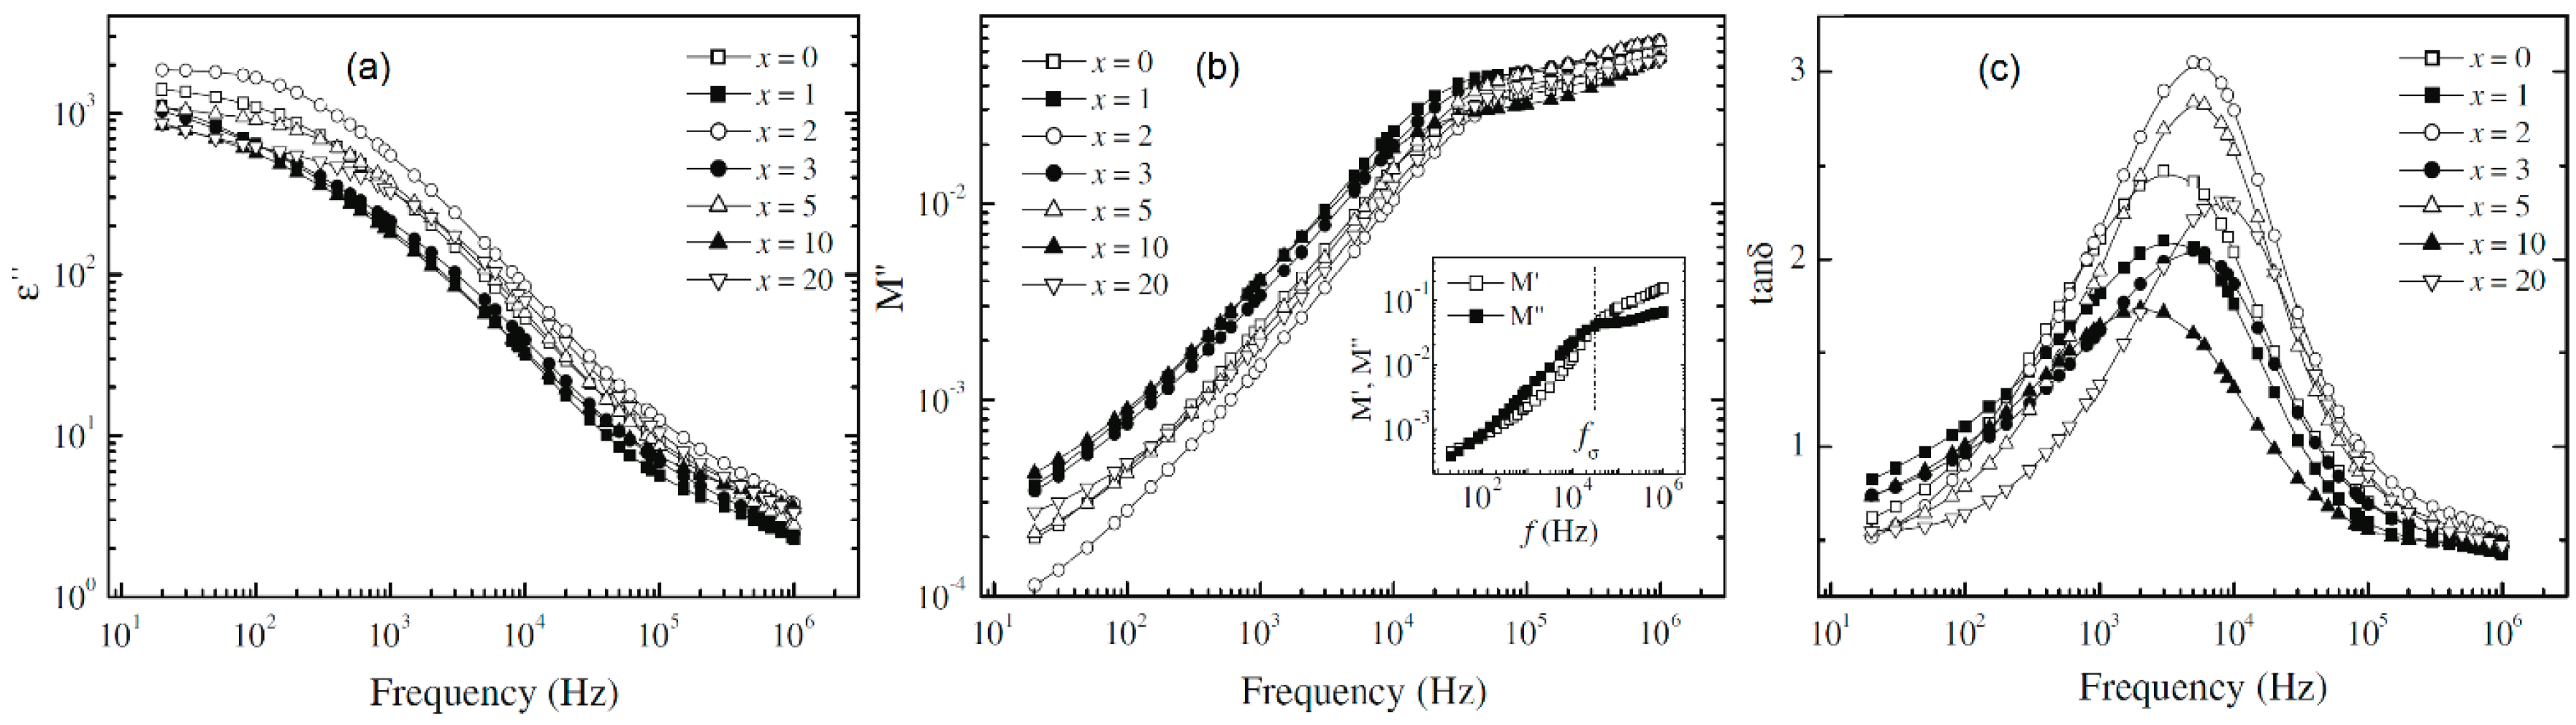
| x wt % MMT | Δε | τε (μs) | τtanδ (μs) | τσ (μs) | σdc × 107 (S/cm) |
|---|---|---|---|---|---|
| 0 | 18.39 | 17.11 | 7.58 | 3.46 | 0.54 |
| 1 | 21.19 | 11.58 | 5.35 | 2.24 | 0.66 |
| 2 | 29.14 | 7.99 | 3.42 | 1.47 | 1.62 |
| 3 | 29.45 | 9.53 | 4.00 | 1.64 | 1.60 |
| 5 | 94.59 | 9.29 | 2.71 | 0.10 | 3.91 |
| Lithium trifluoromethanesulfonate, lithium triflate (CF3SO3Li) |  |
| Lithium bis(trifluoromethanesulfonyl) imide [LiN(SO2CF3)2] |  |
| Lithium tetrafluoroborate (LiBF4) |  |
| Lithium hexafluorophosphate (LiPF6) |  |
| Lithium perchlorate (LiClO4) |  |
| Lithium iodide (LiI) |  |
| Ethylene carbonate (EC), (CH2O)2CO |  |
| Propylene carbonate (PC), CH3C2H3O2CO |  |
| Diethyl carbonate (EDC), OC(OCH2CH3)2 |  |
© 2016 by the authors. Licensee MDPI, Basel, Switzerland. This article is an open access article distributed under the terms and conditions of the Creative Commons Attribution (CC-BY) license ( http://creativecommons.org/licenses/by/4.0/).
Share and Cite
Wang, W.; Alexandridis, P. Composite Polymer Electrolytes: Nanoparticles Affect Structure and Properties. Polymers 2016, 8, 387. https://doi.org/10.3390/polym8110387
Wang W, Alexandridis P. Composite Polymer Electrolytes: Nanoparticles Affect Structure and Properties. Polymers. 2016; 8(11):387. https://doi.org/10.3390/polym8110387
Chicago/Turabian StyleWang, Wei, and Paschalis Alexandridis. 2016. "Composite Polymer Electrolytes: Nanoparticles Affect Structure and Properties" Polymers 8, no. 11: 387. https://doi.org/10.3390/polym8110387
APA StyleWang, W., & Alexandridis, P. (2016). Composite Polymer Electrolytes: Nanoparticles Affect Structure and Properties. Polymers, 8(11), 387. https://doi.org/10.3390/polym8110387