
Development and Characterization of PBS/EA Cellulose and PCL/EA Cellulose Biocomposites: Structural, Morphological, and Thermal Insights for Sustainable Applications

 ,
, 
Abstract
1. Introduction
2. Materials and Methods
2.1. Materials
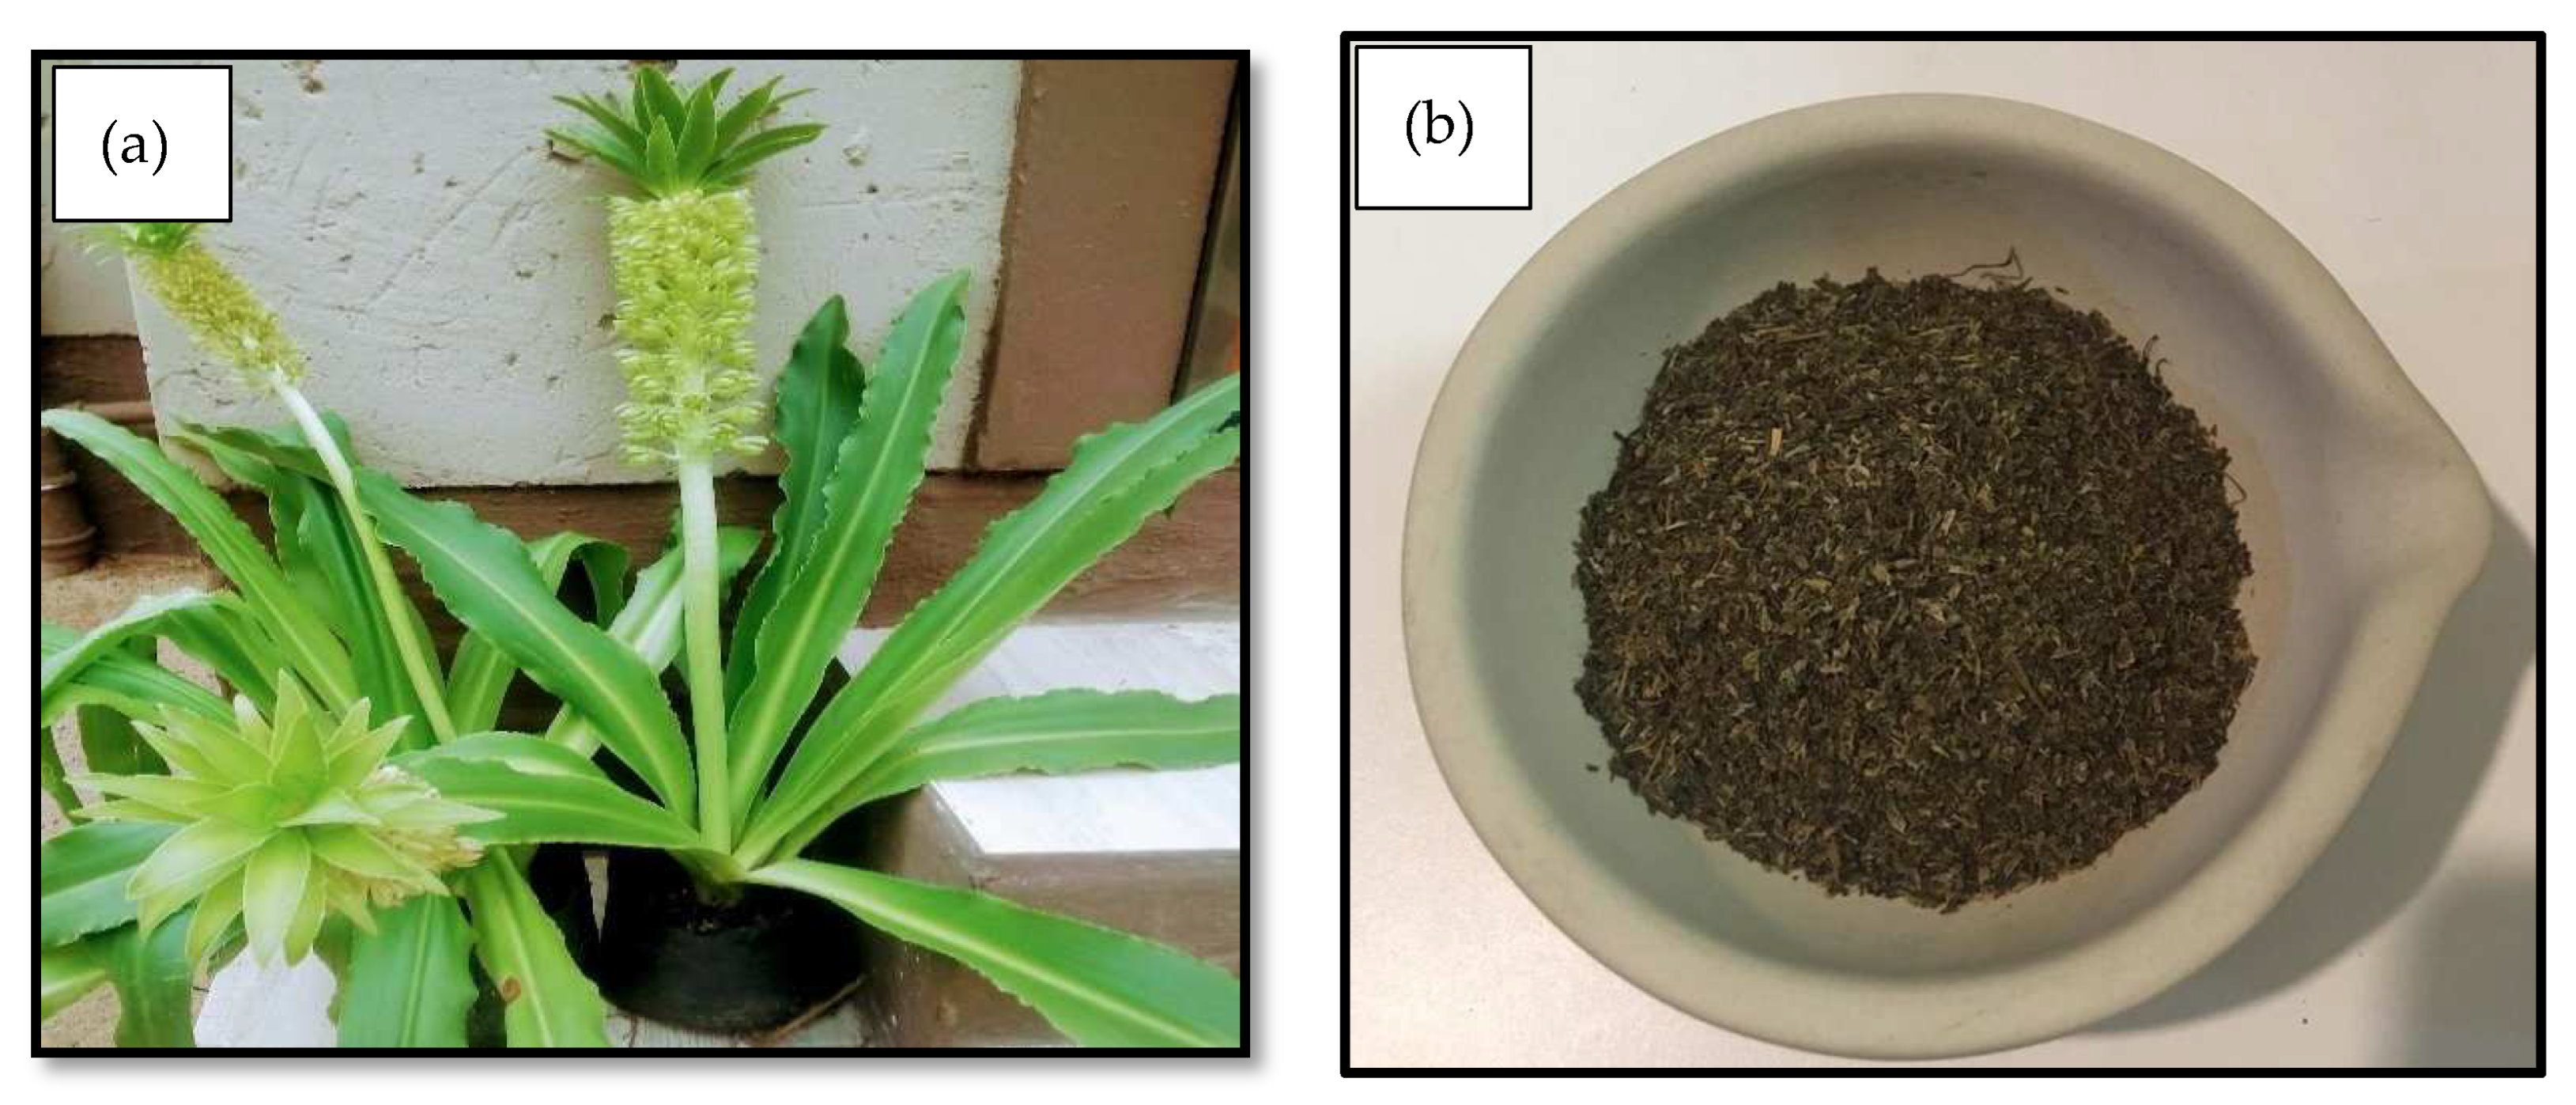
2.1.1. Eucomis autumnalis
Extraction of Cellulose from Eucomis autumnalis Plant Leaves
Delignification and Hemicellulose Removal
Isolation of Cellulose
2.1.2. Poly(Butylene Succinate) (PBS)
2.1.3. Poly(ε-Caprolactone) (PCL)
2.2. Sample Preparation
2.3. Sample Characterization
2.3.1. Fourier-Transform Infrared (FTIR) Spectroscopy
2.3.2. X-Ray Diffraction (XRD)
2.3.3. Scanning Electron Microscopy (SEM)
2.3.4. Differential Scanning Calorimetry (DSC)
2.3.5. Thermogravimetric Analysis (TGA)
3. Results and Discussion
3.1. Structural Properties
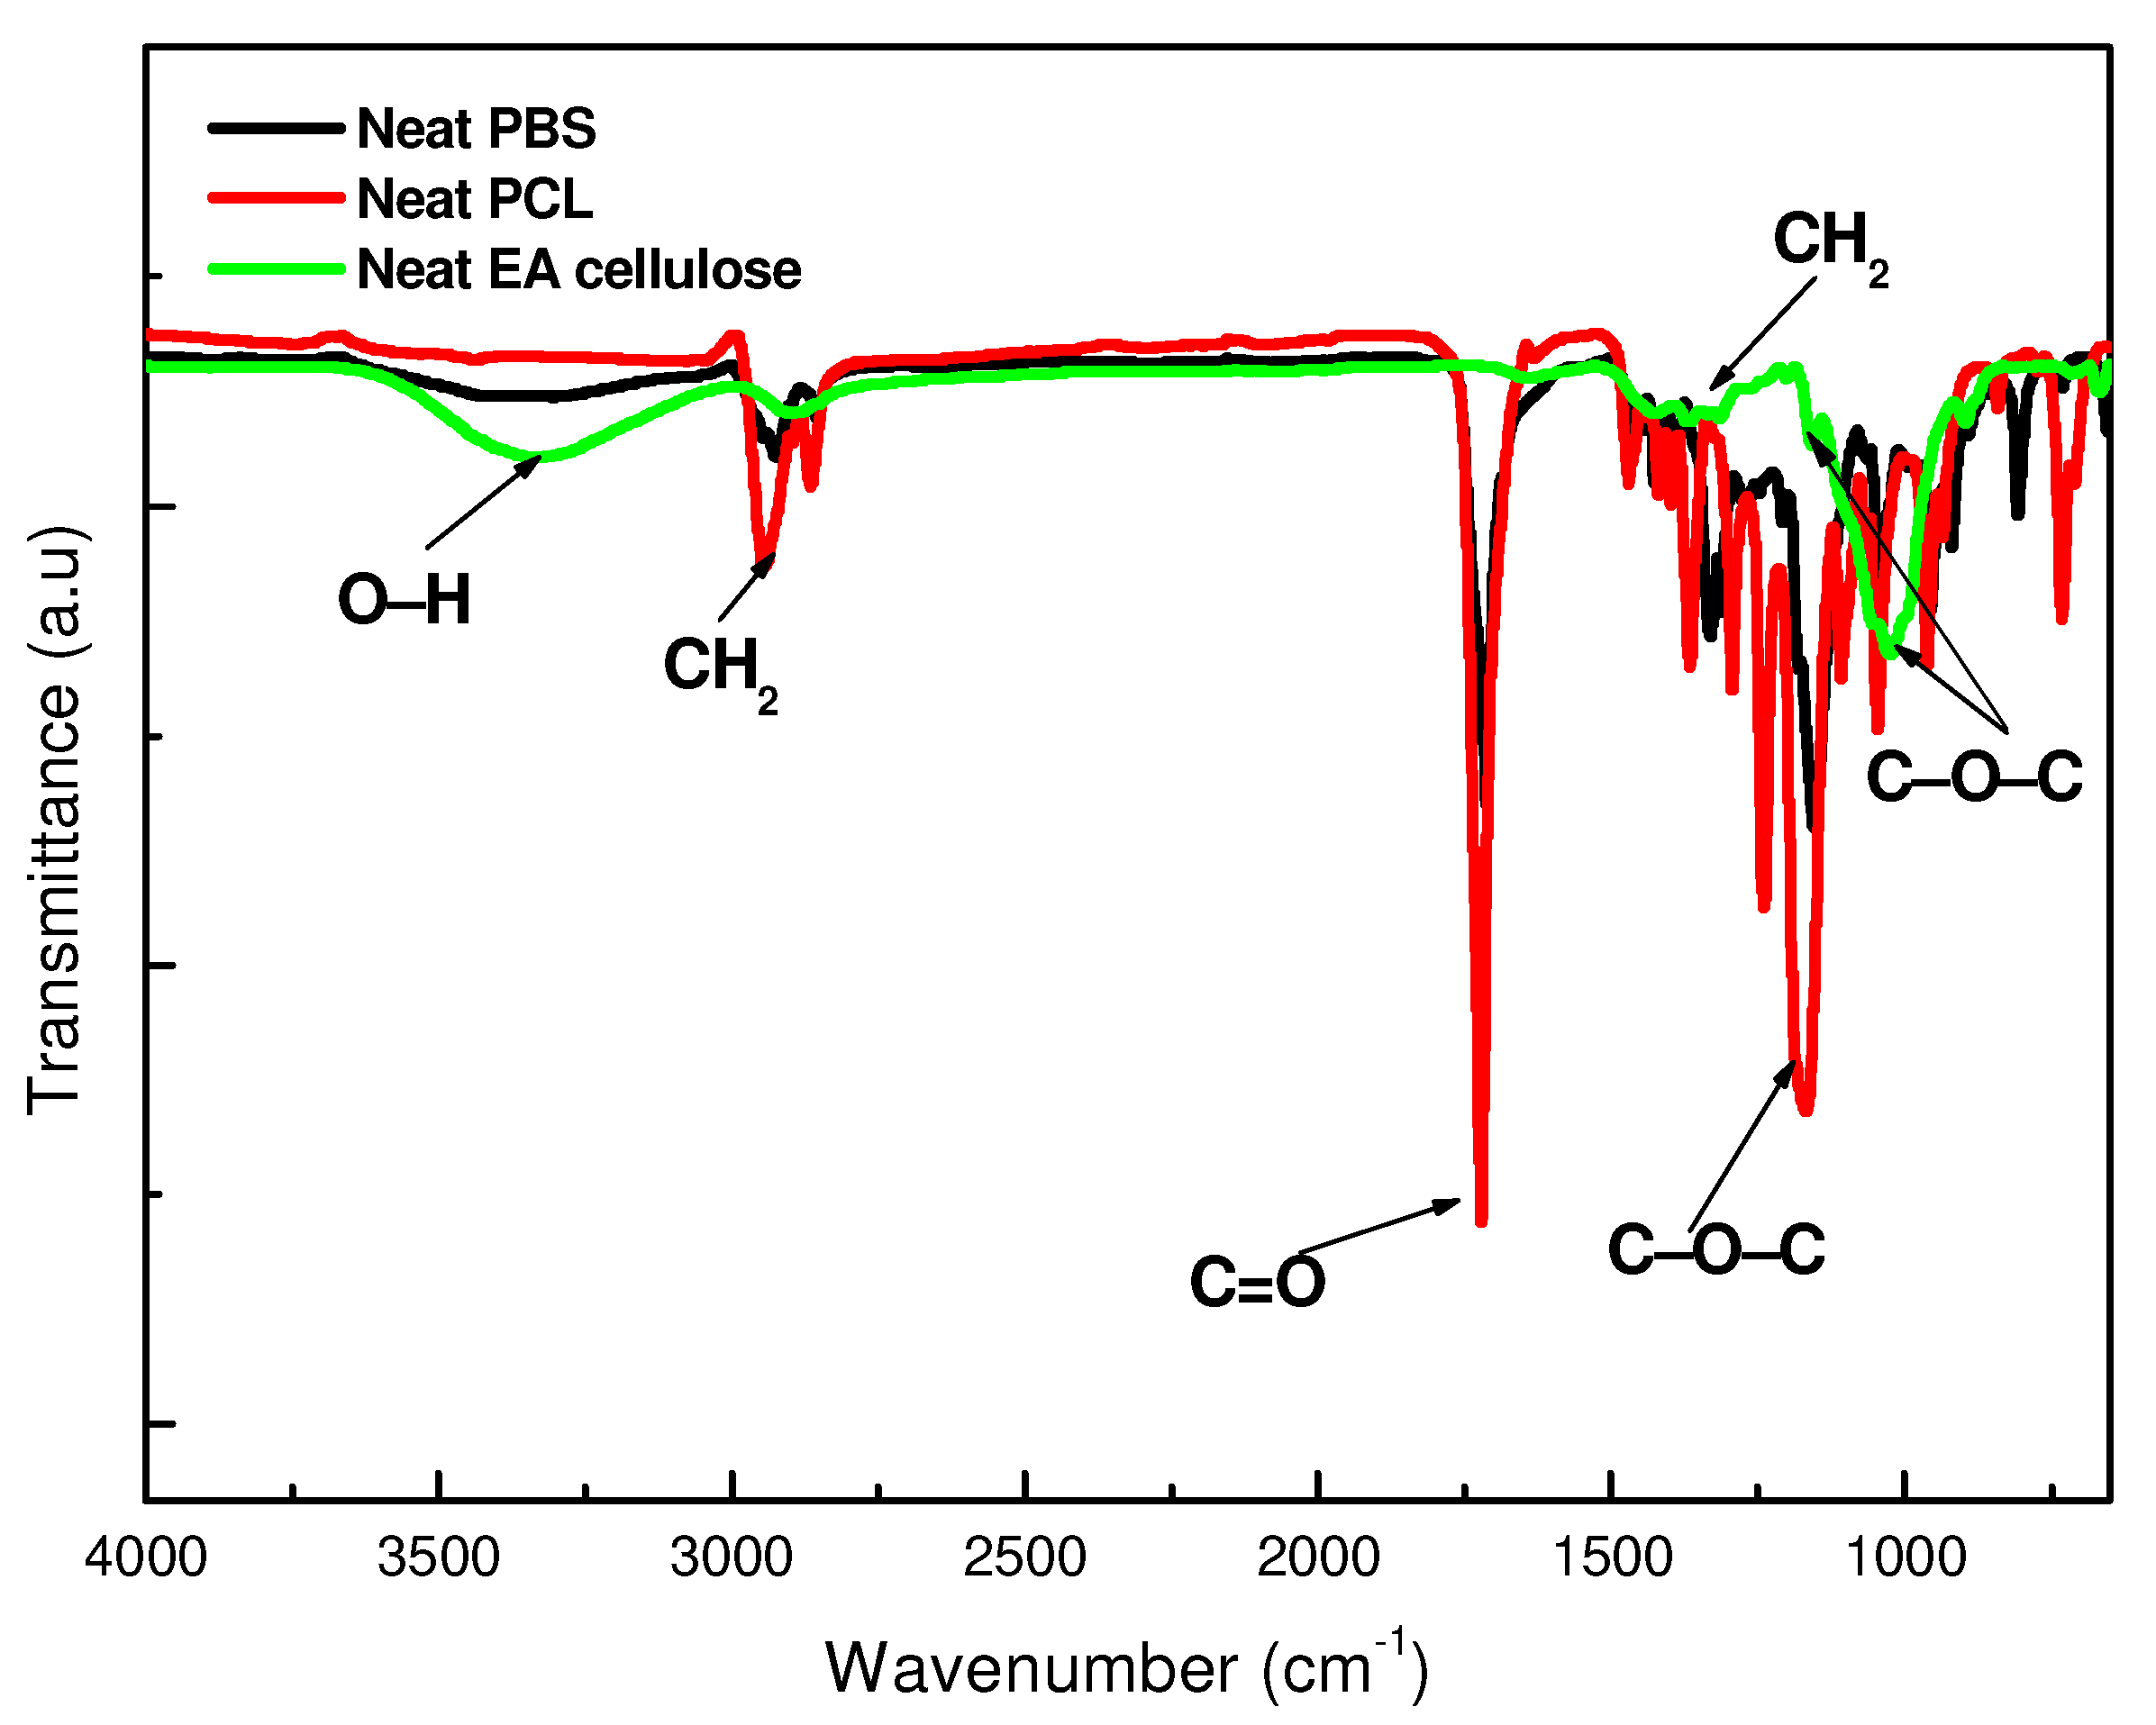
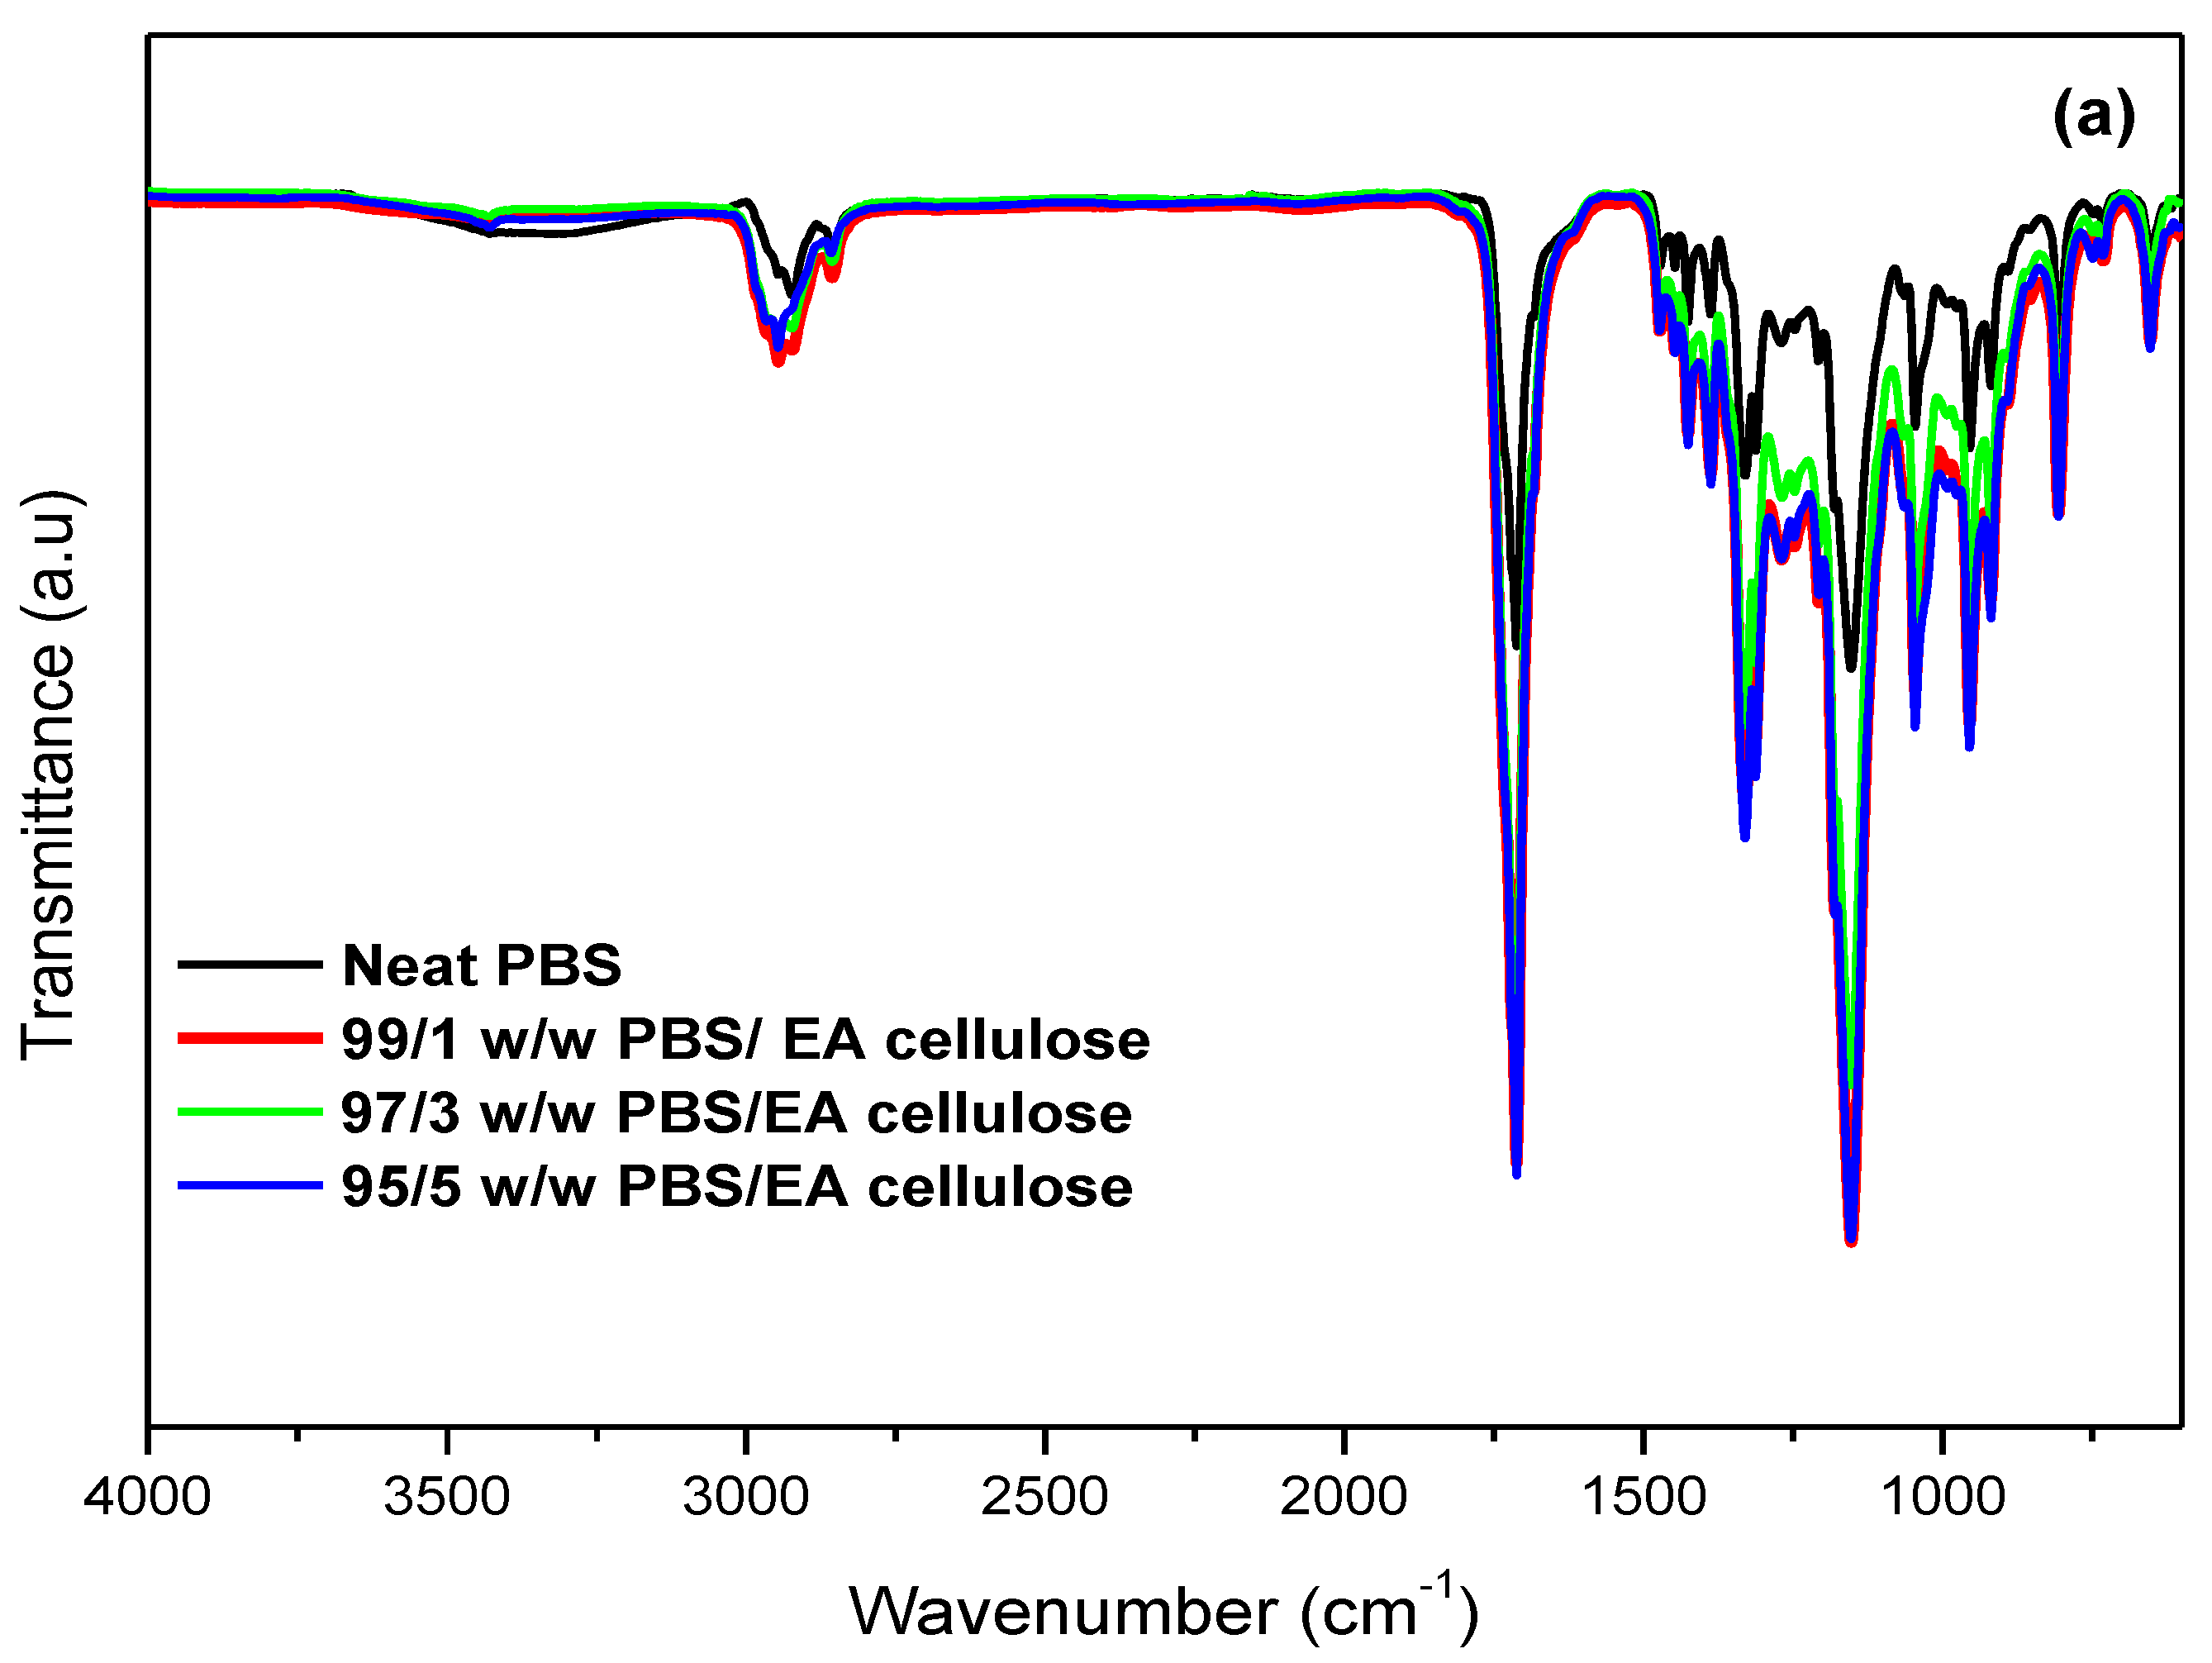
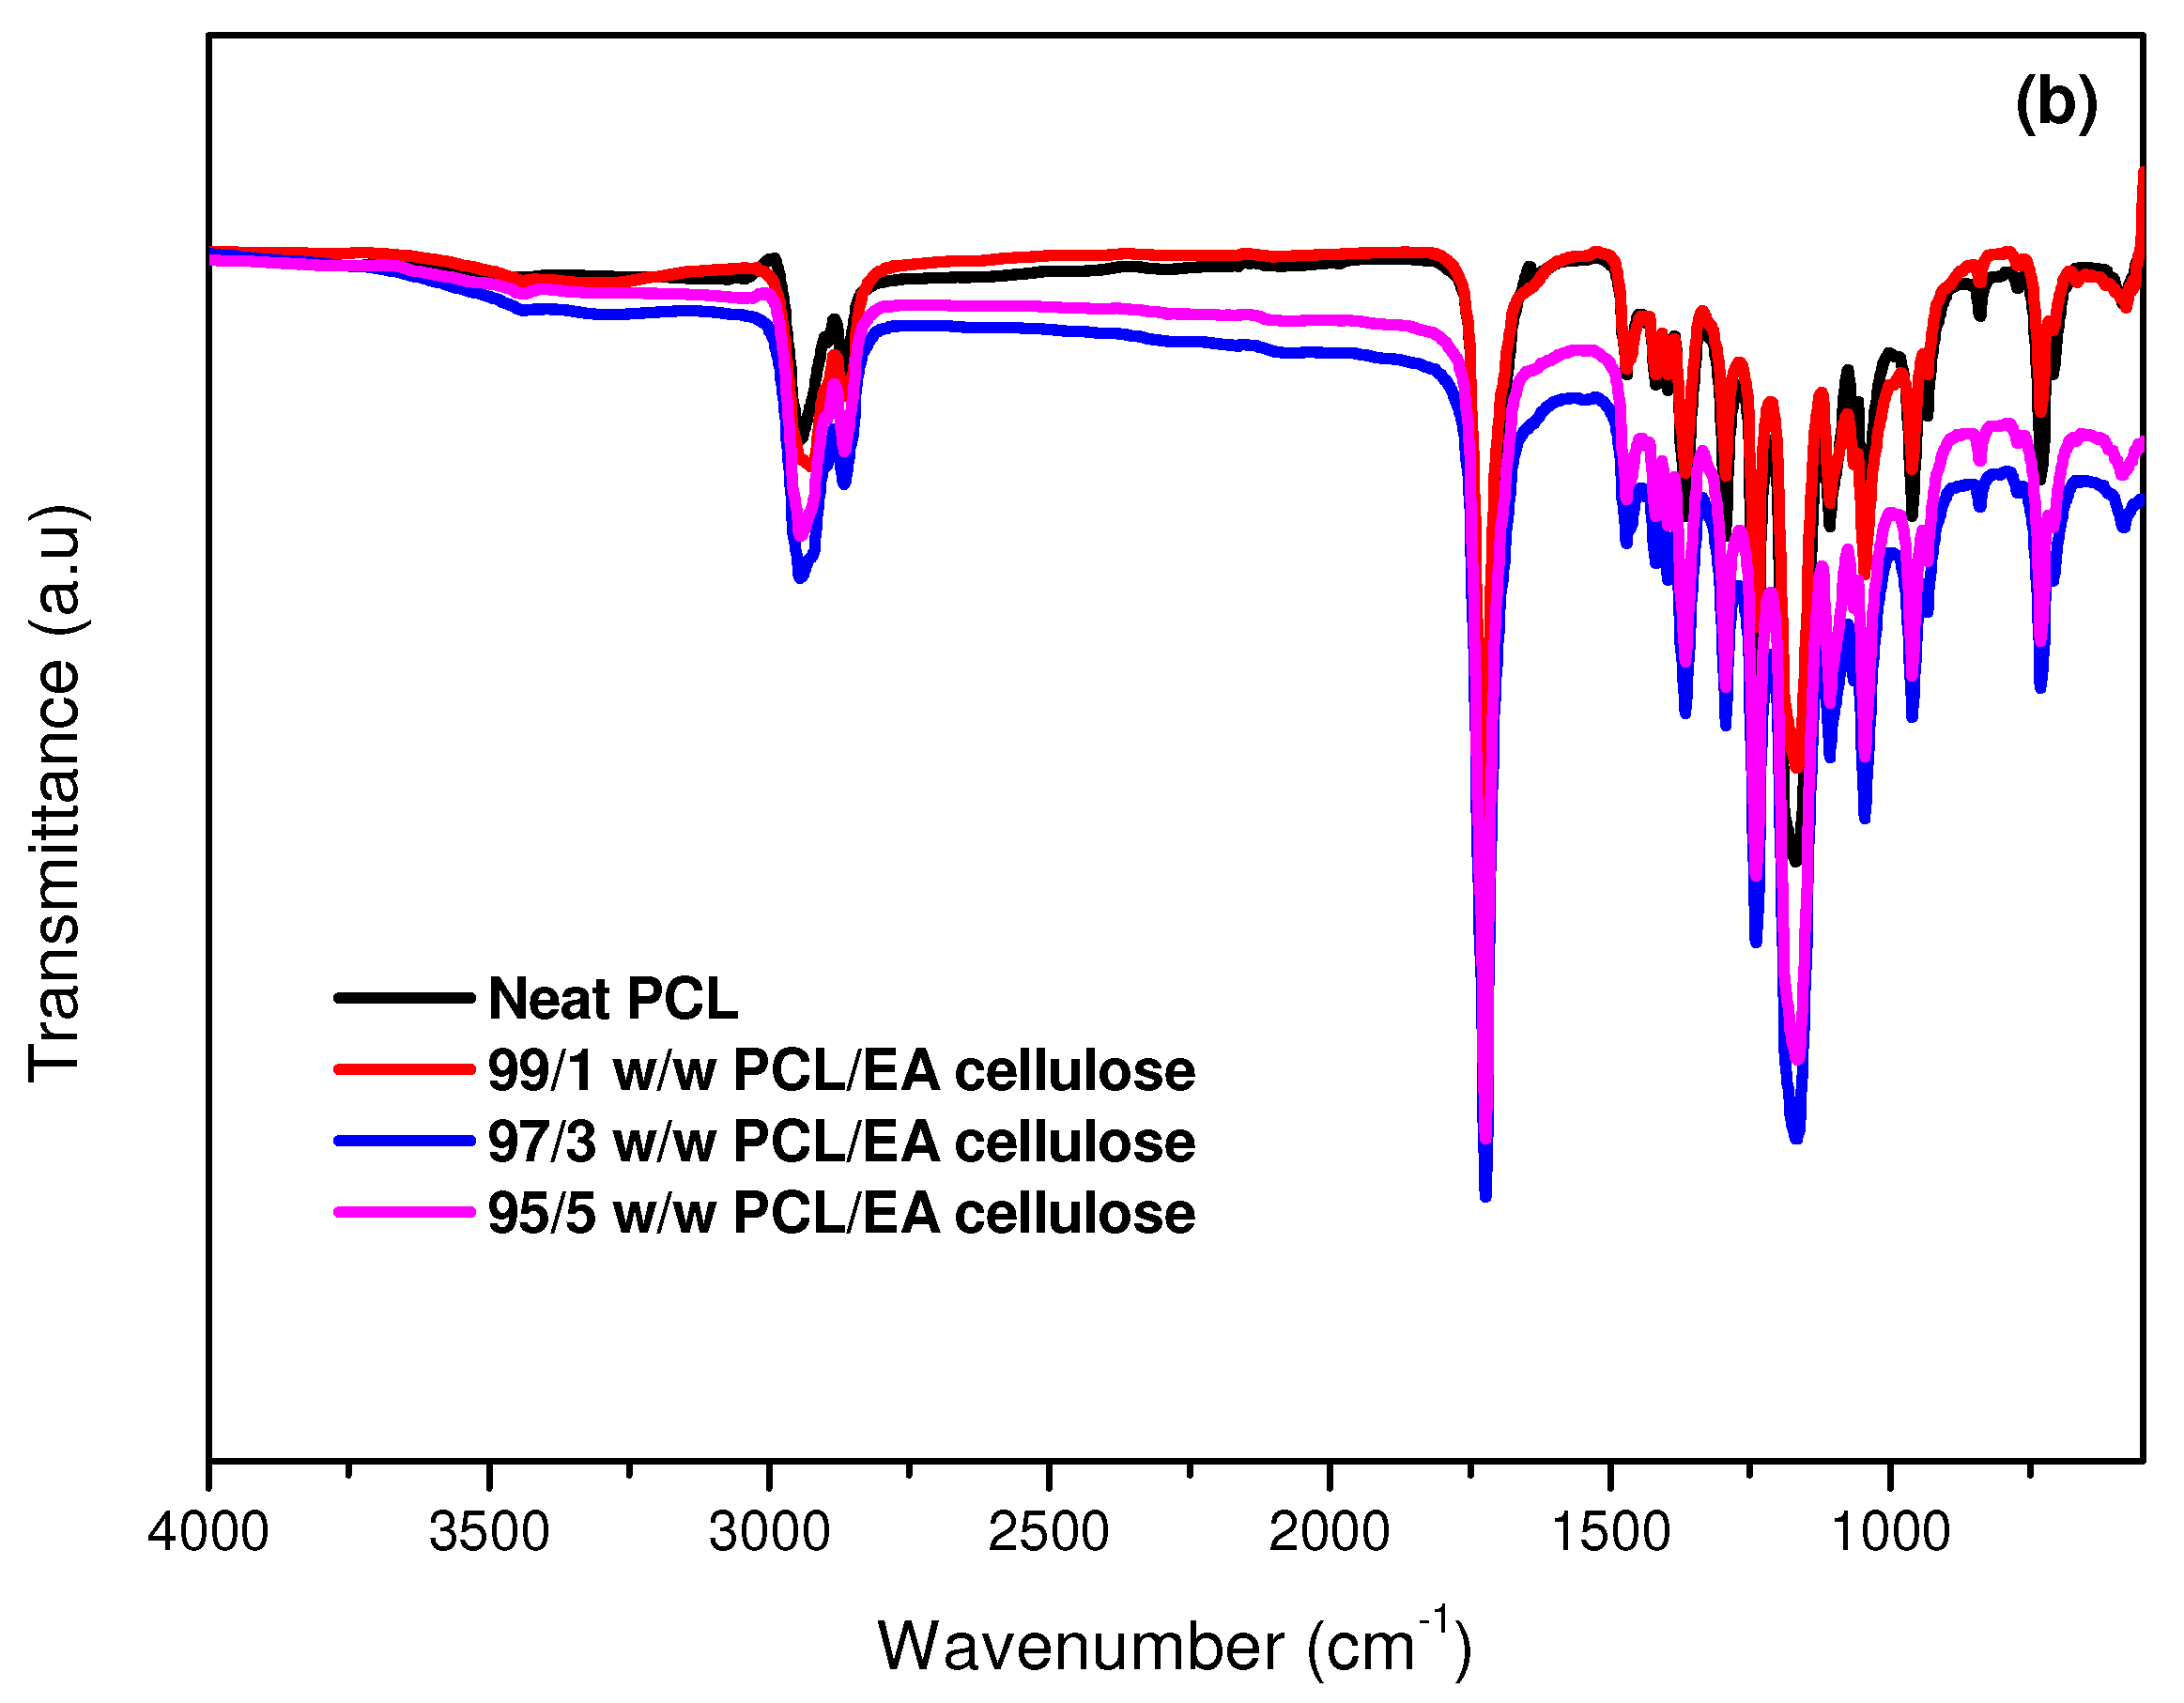
3.1.1. Fourier-Transform Infrared (FTIR) Spectroscopy
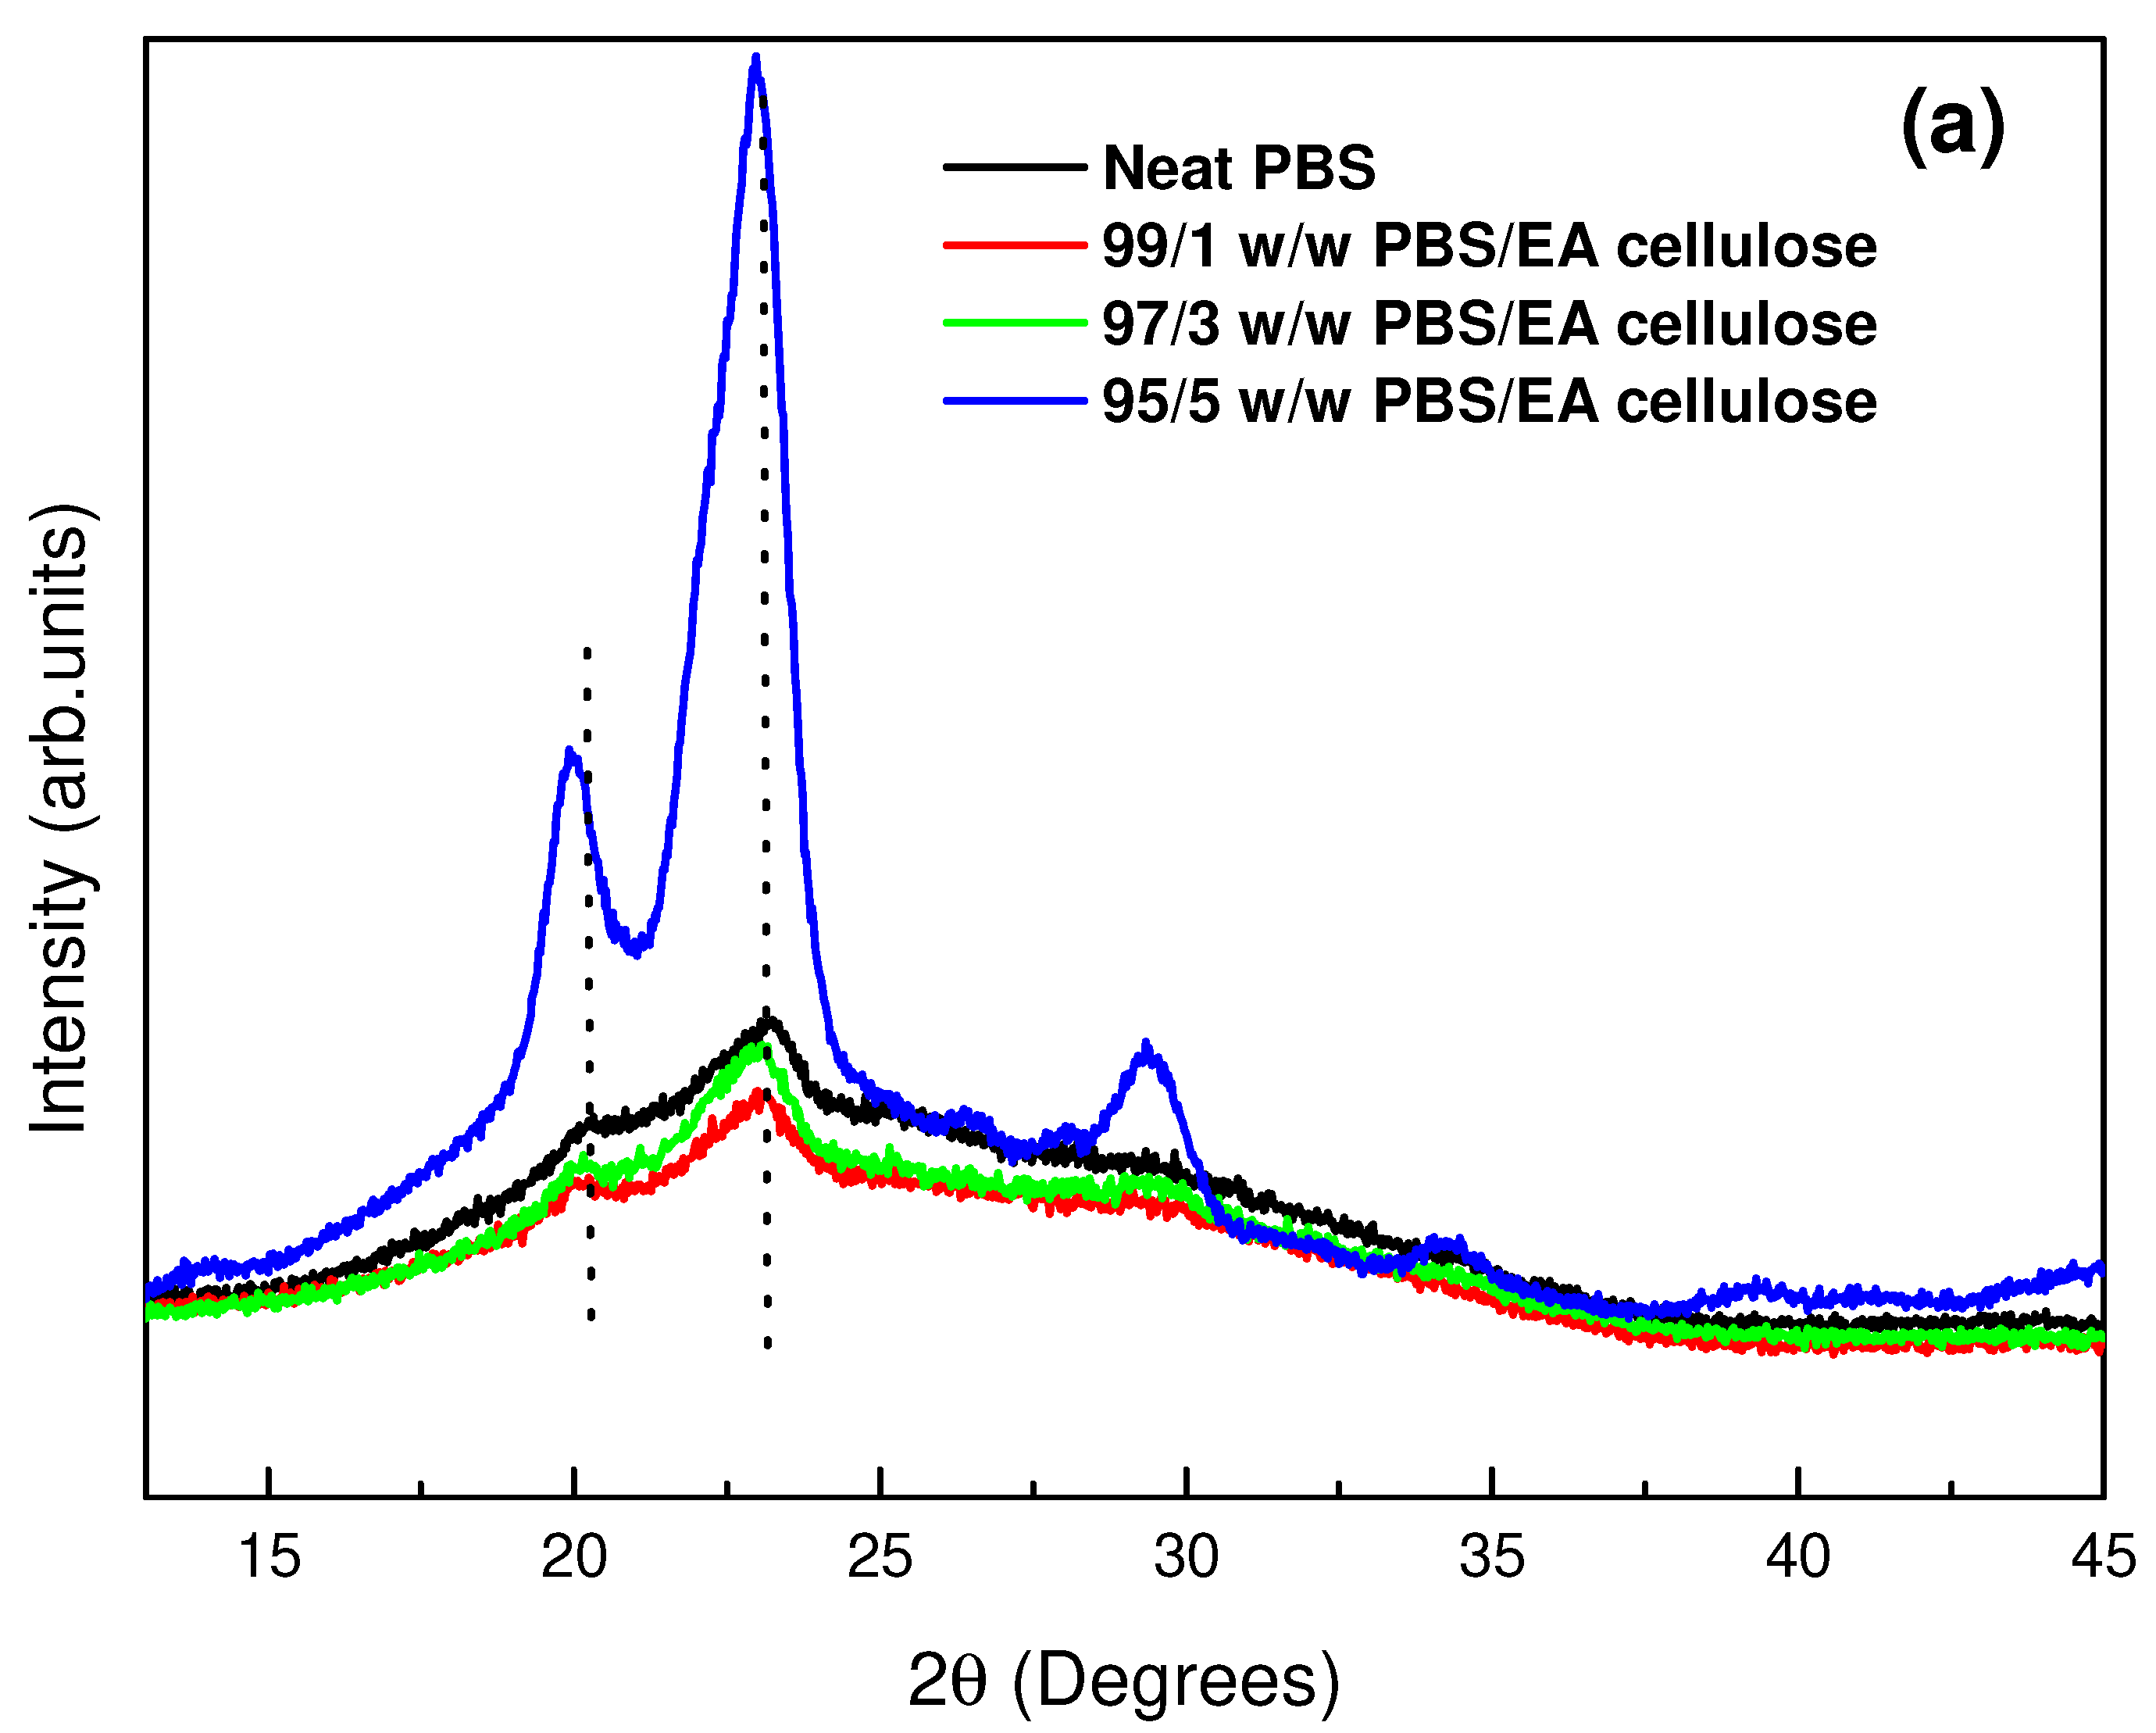
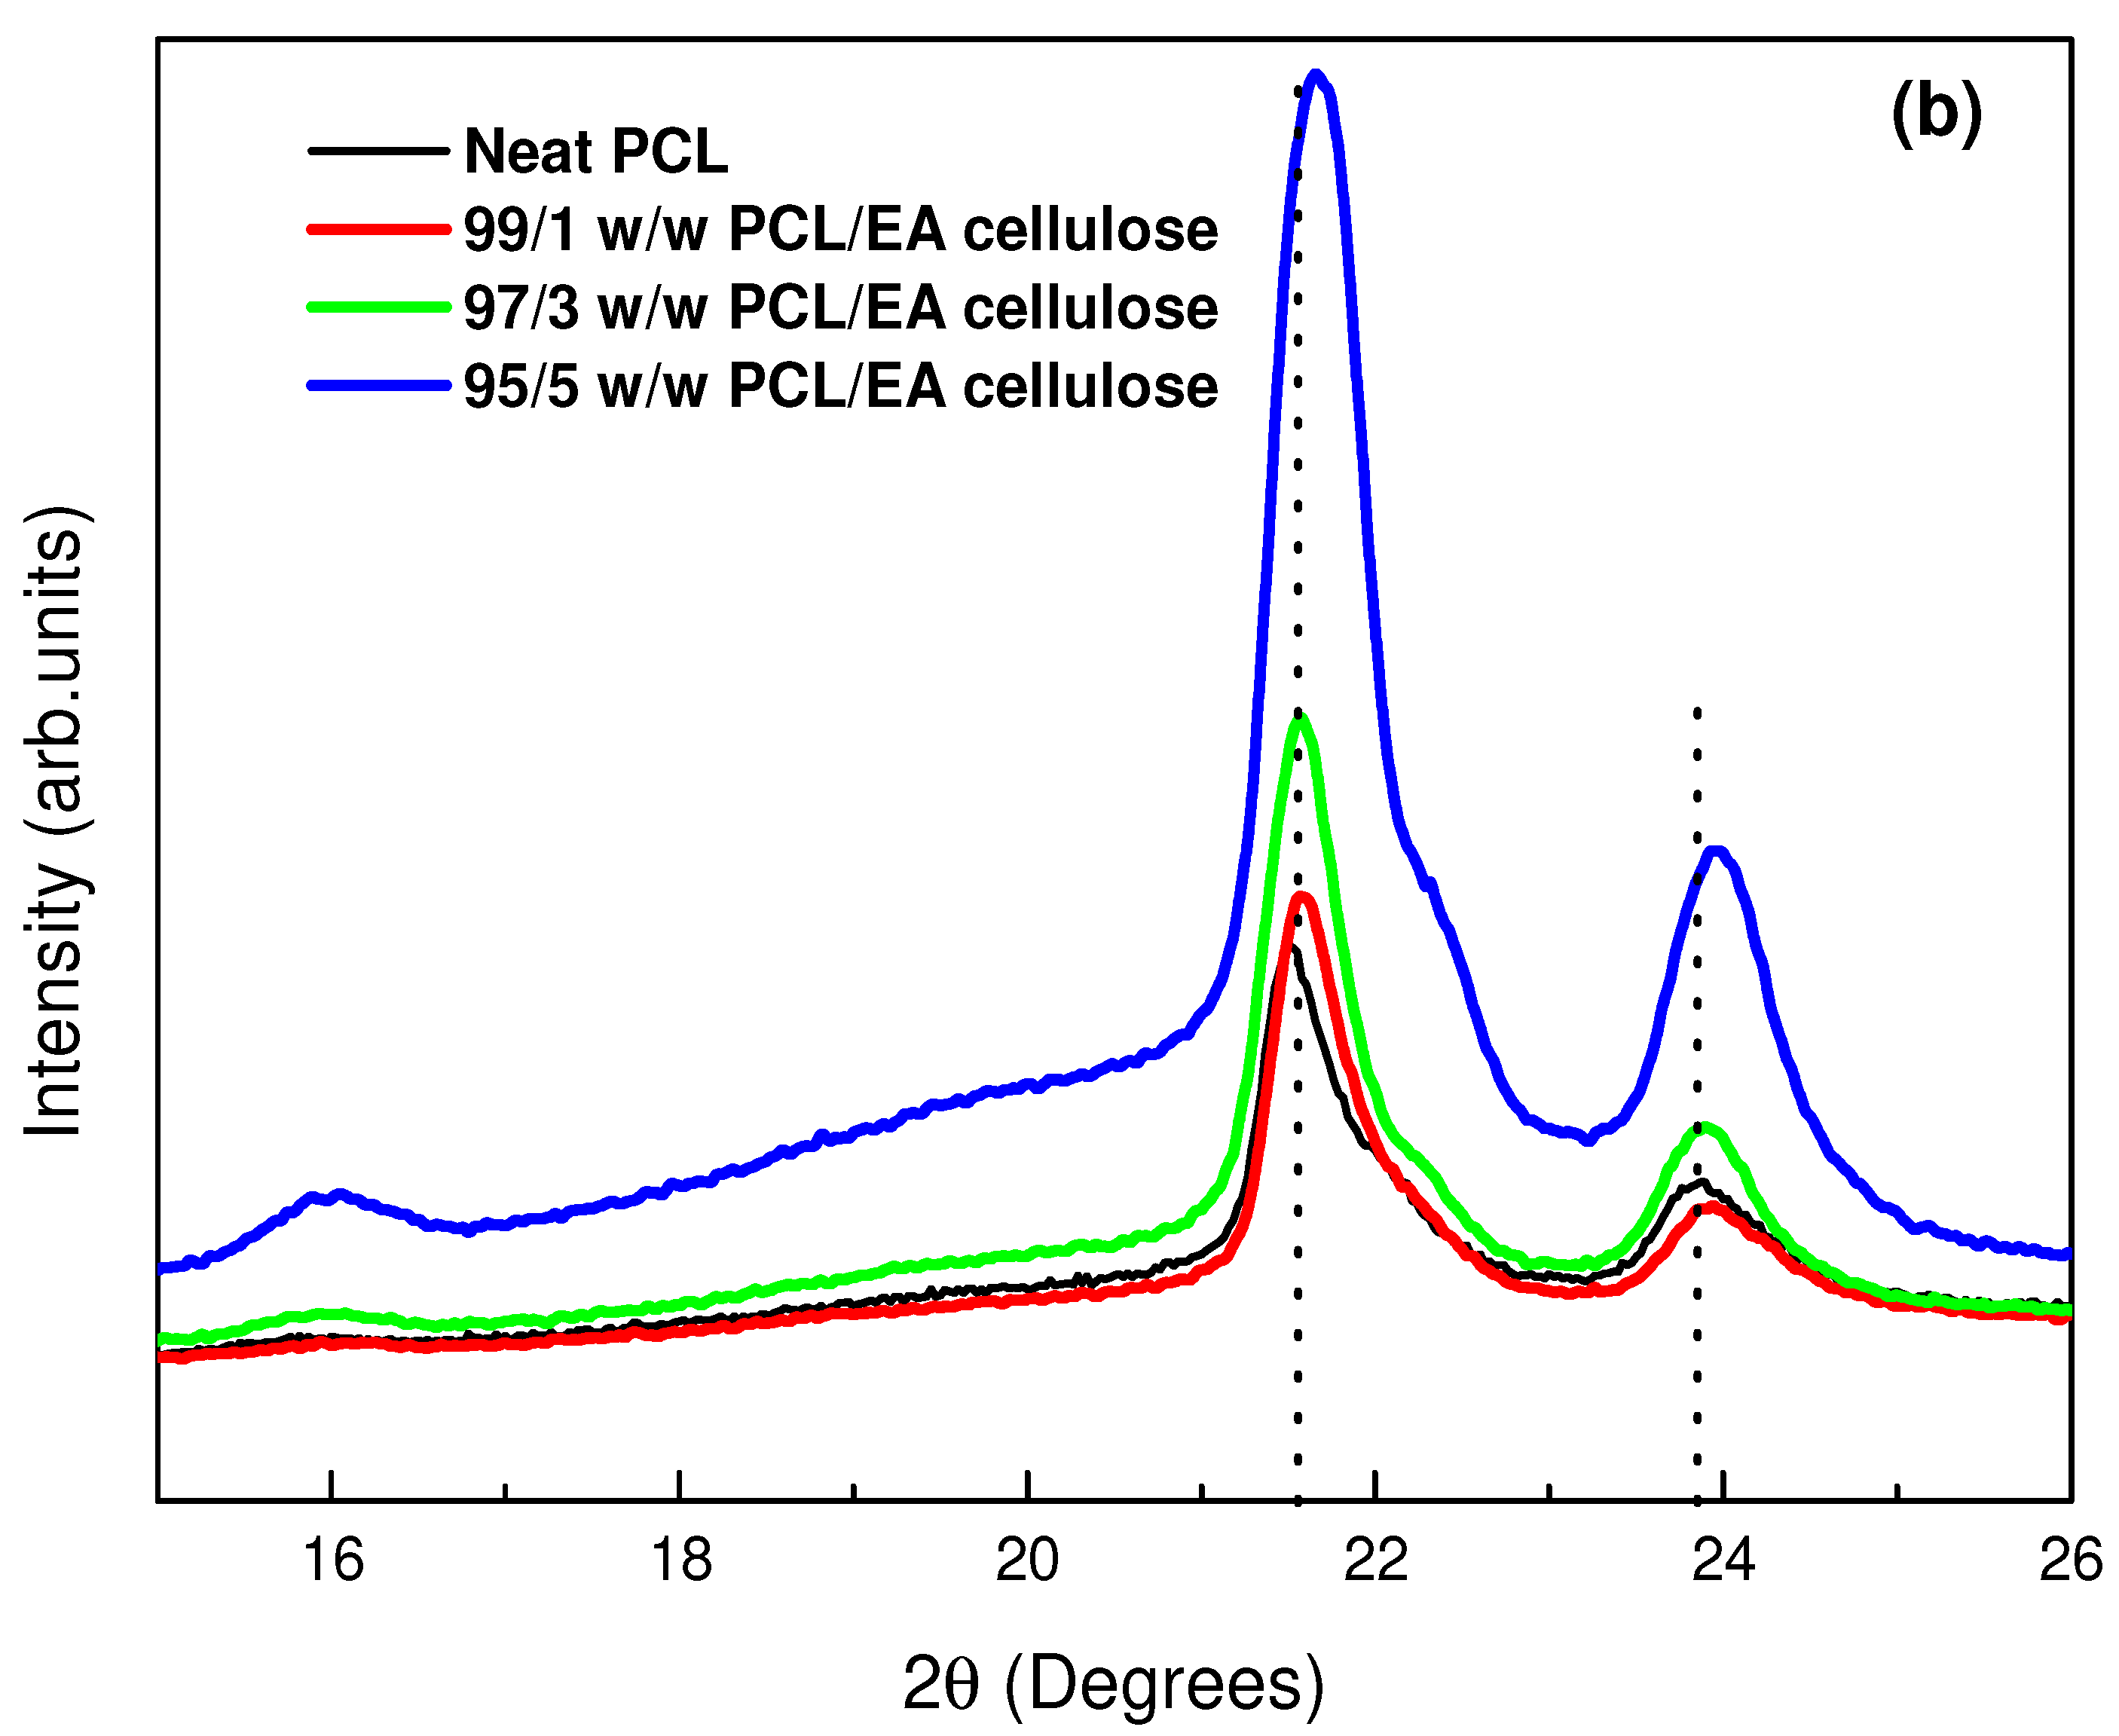
3.1.2. X-Ray Diffraction (XRD)
3.2. Morphological Properties
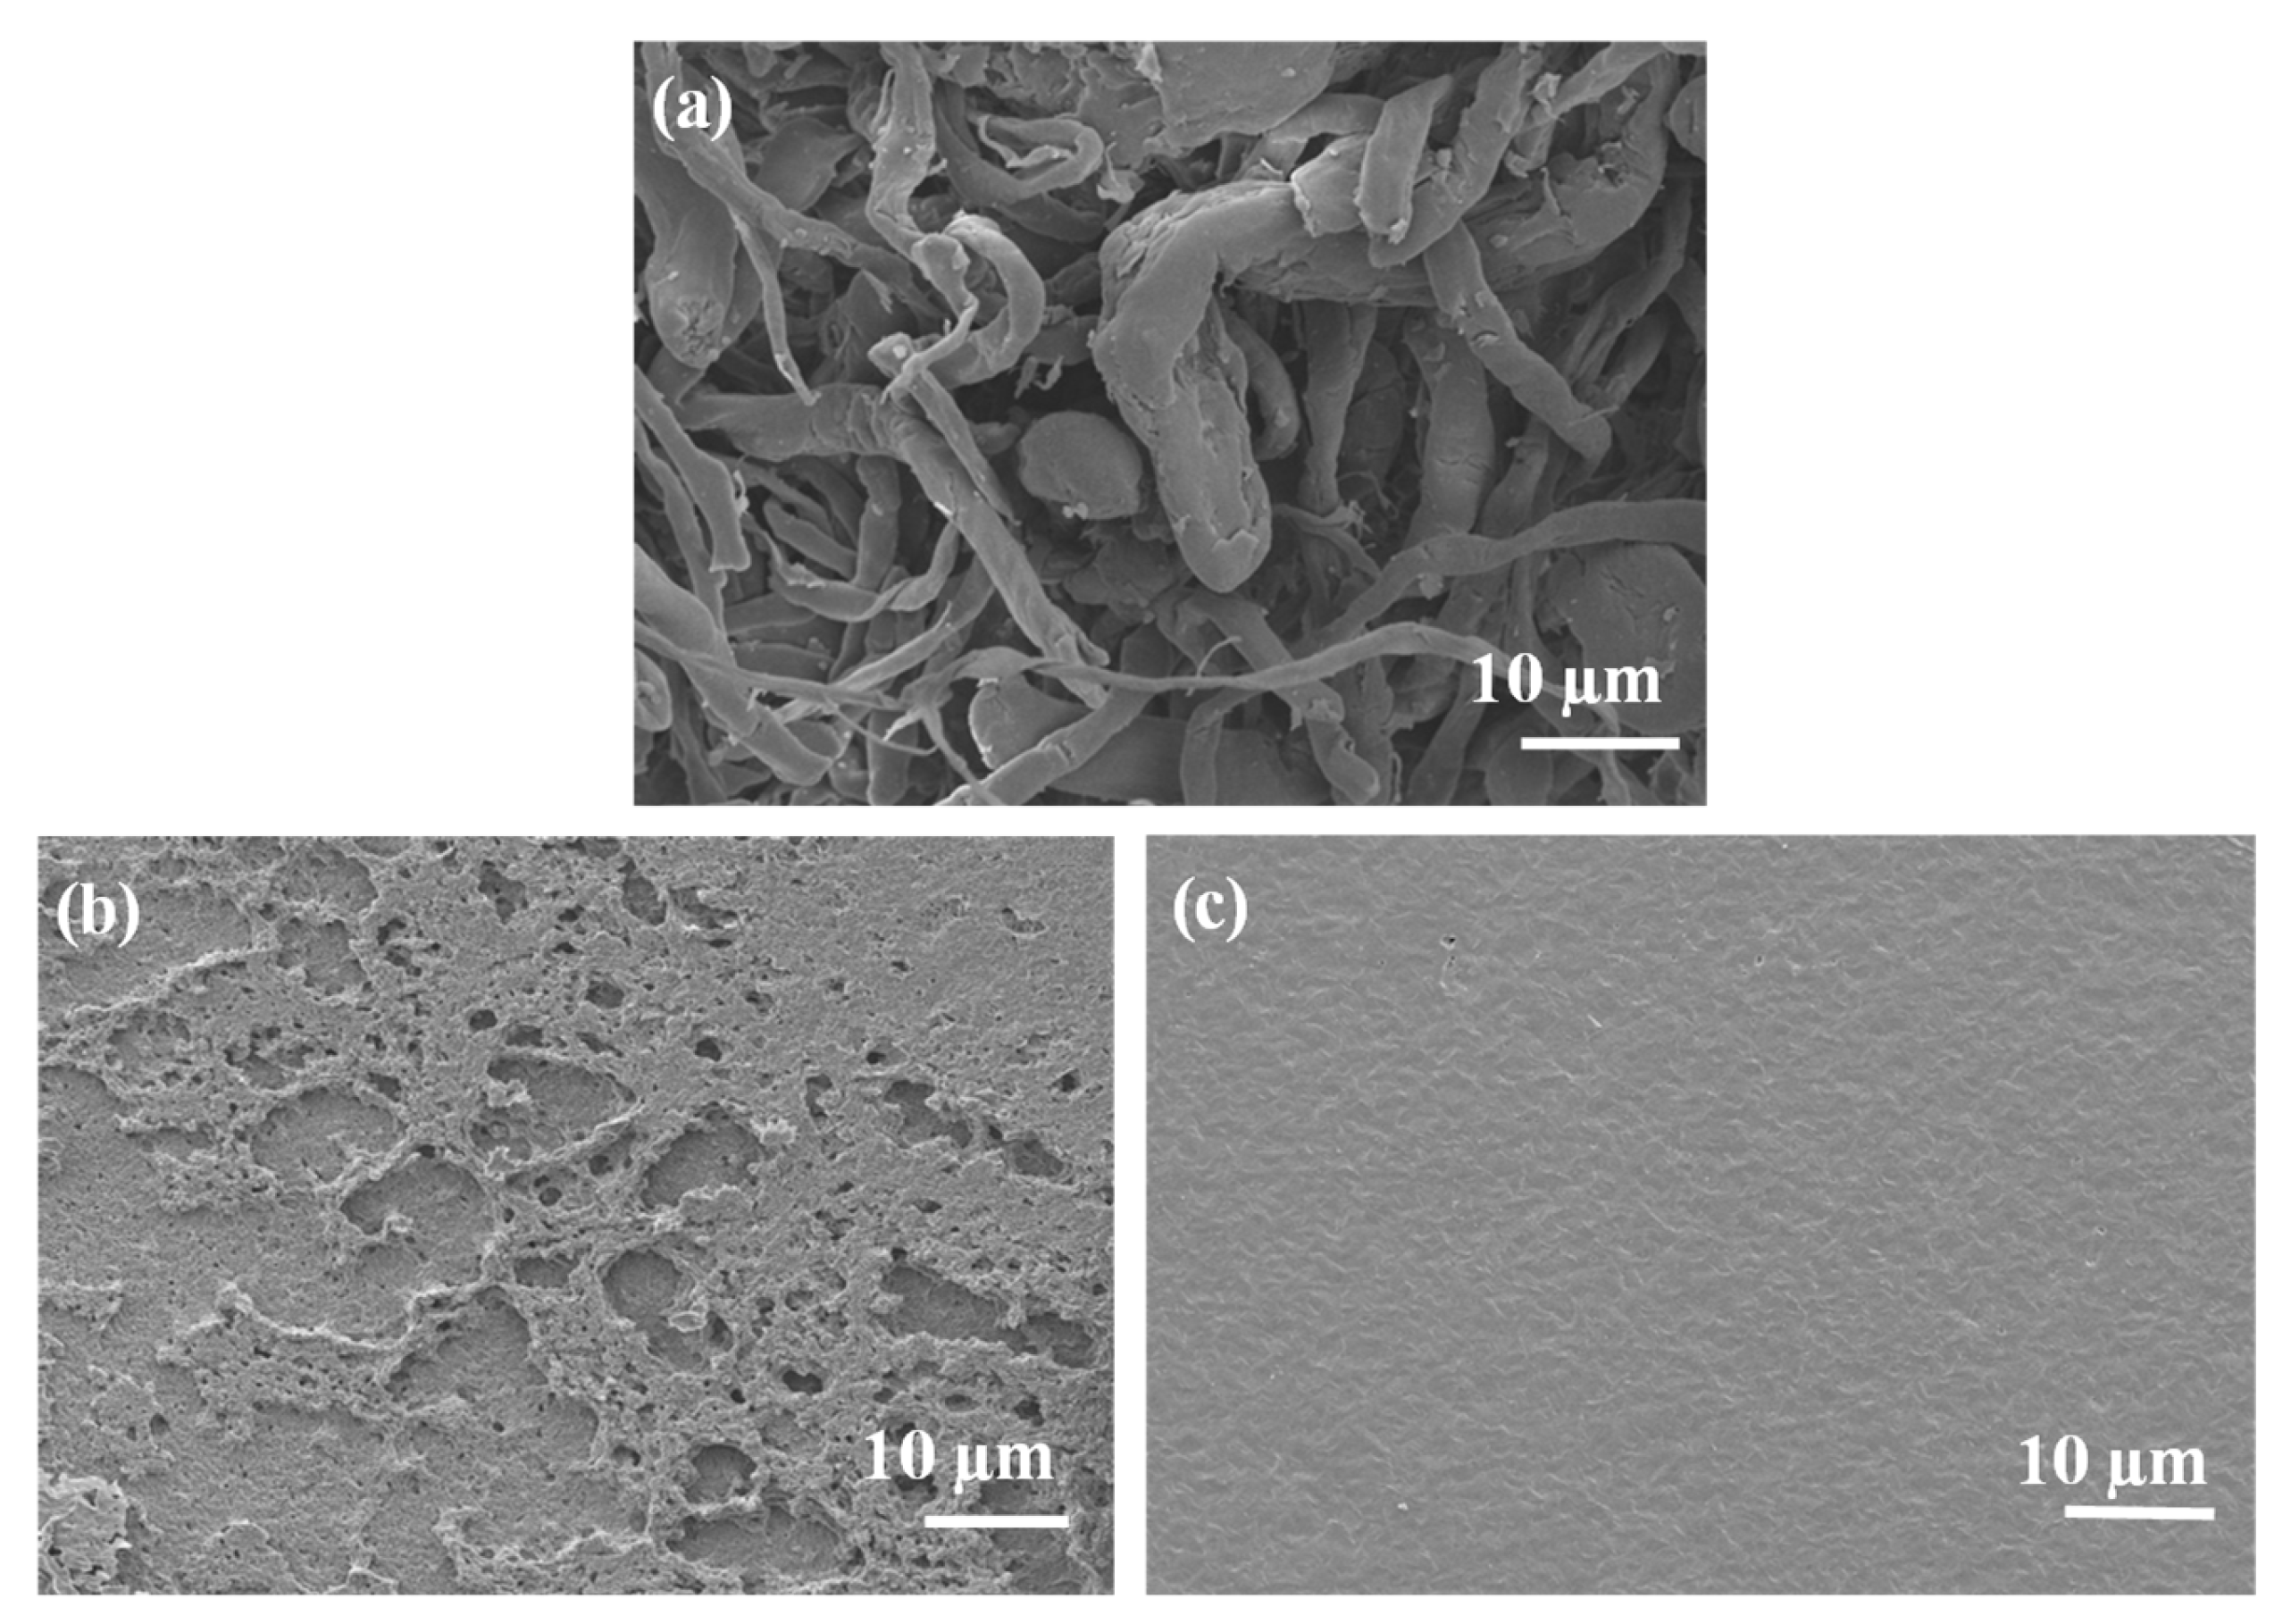
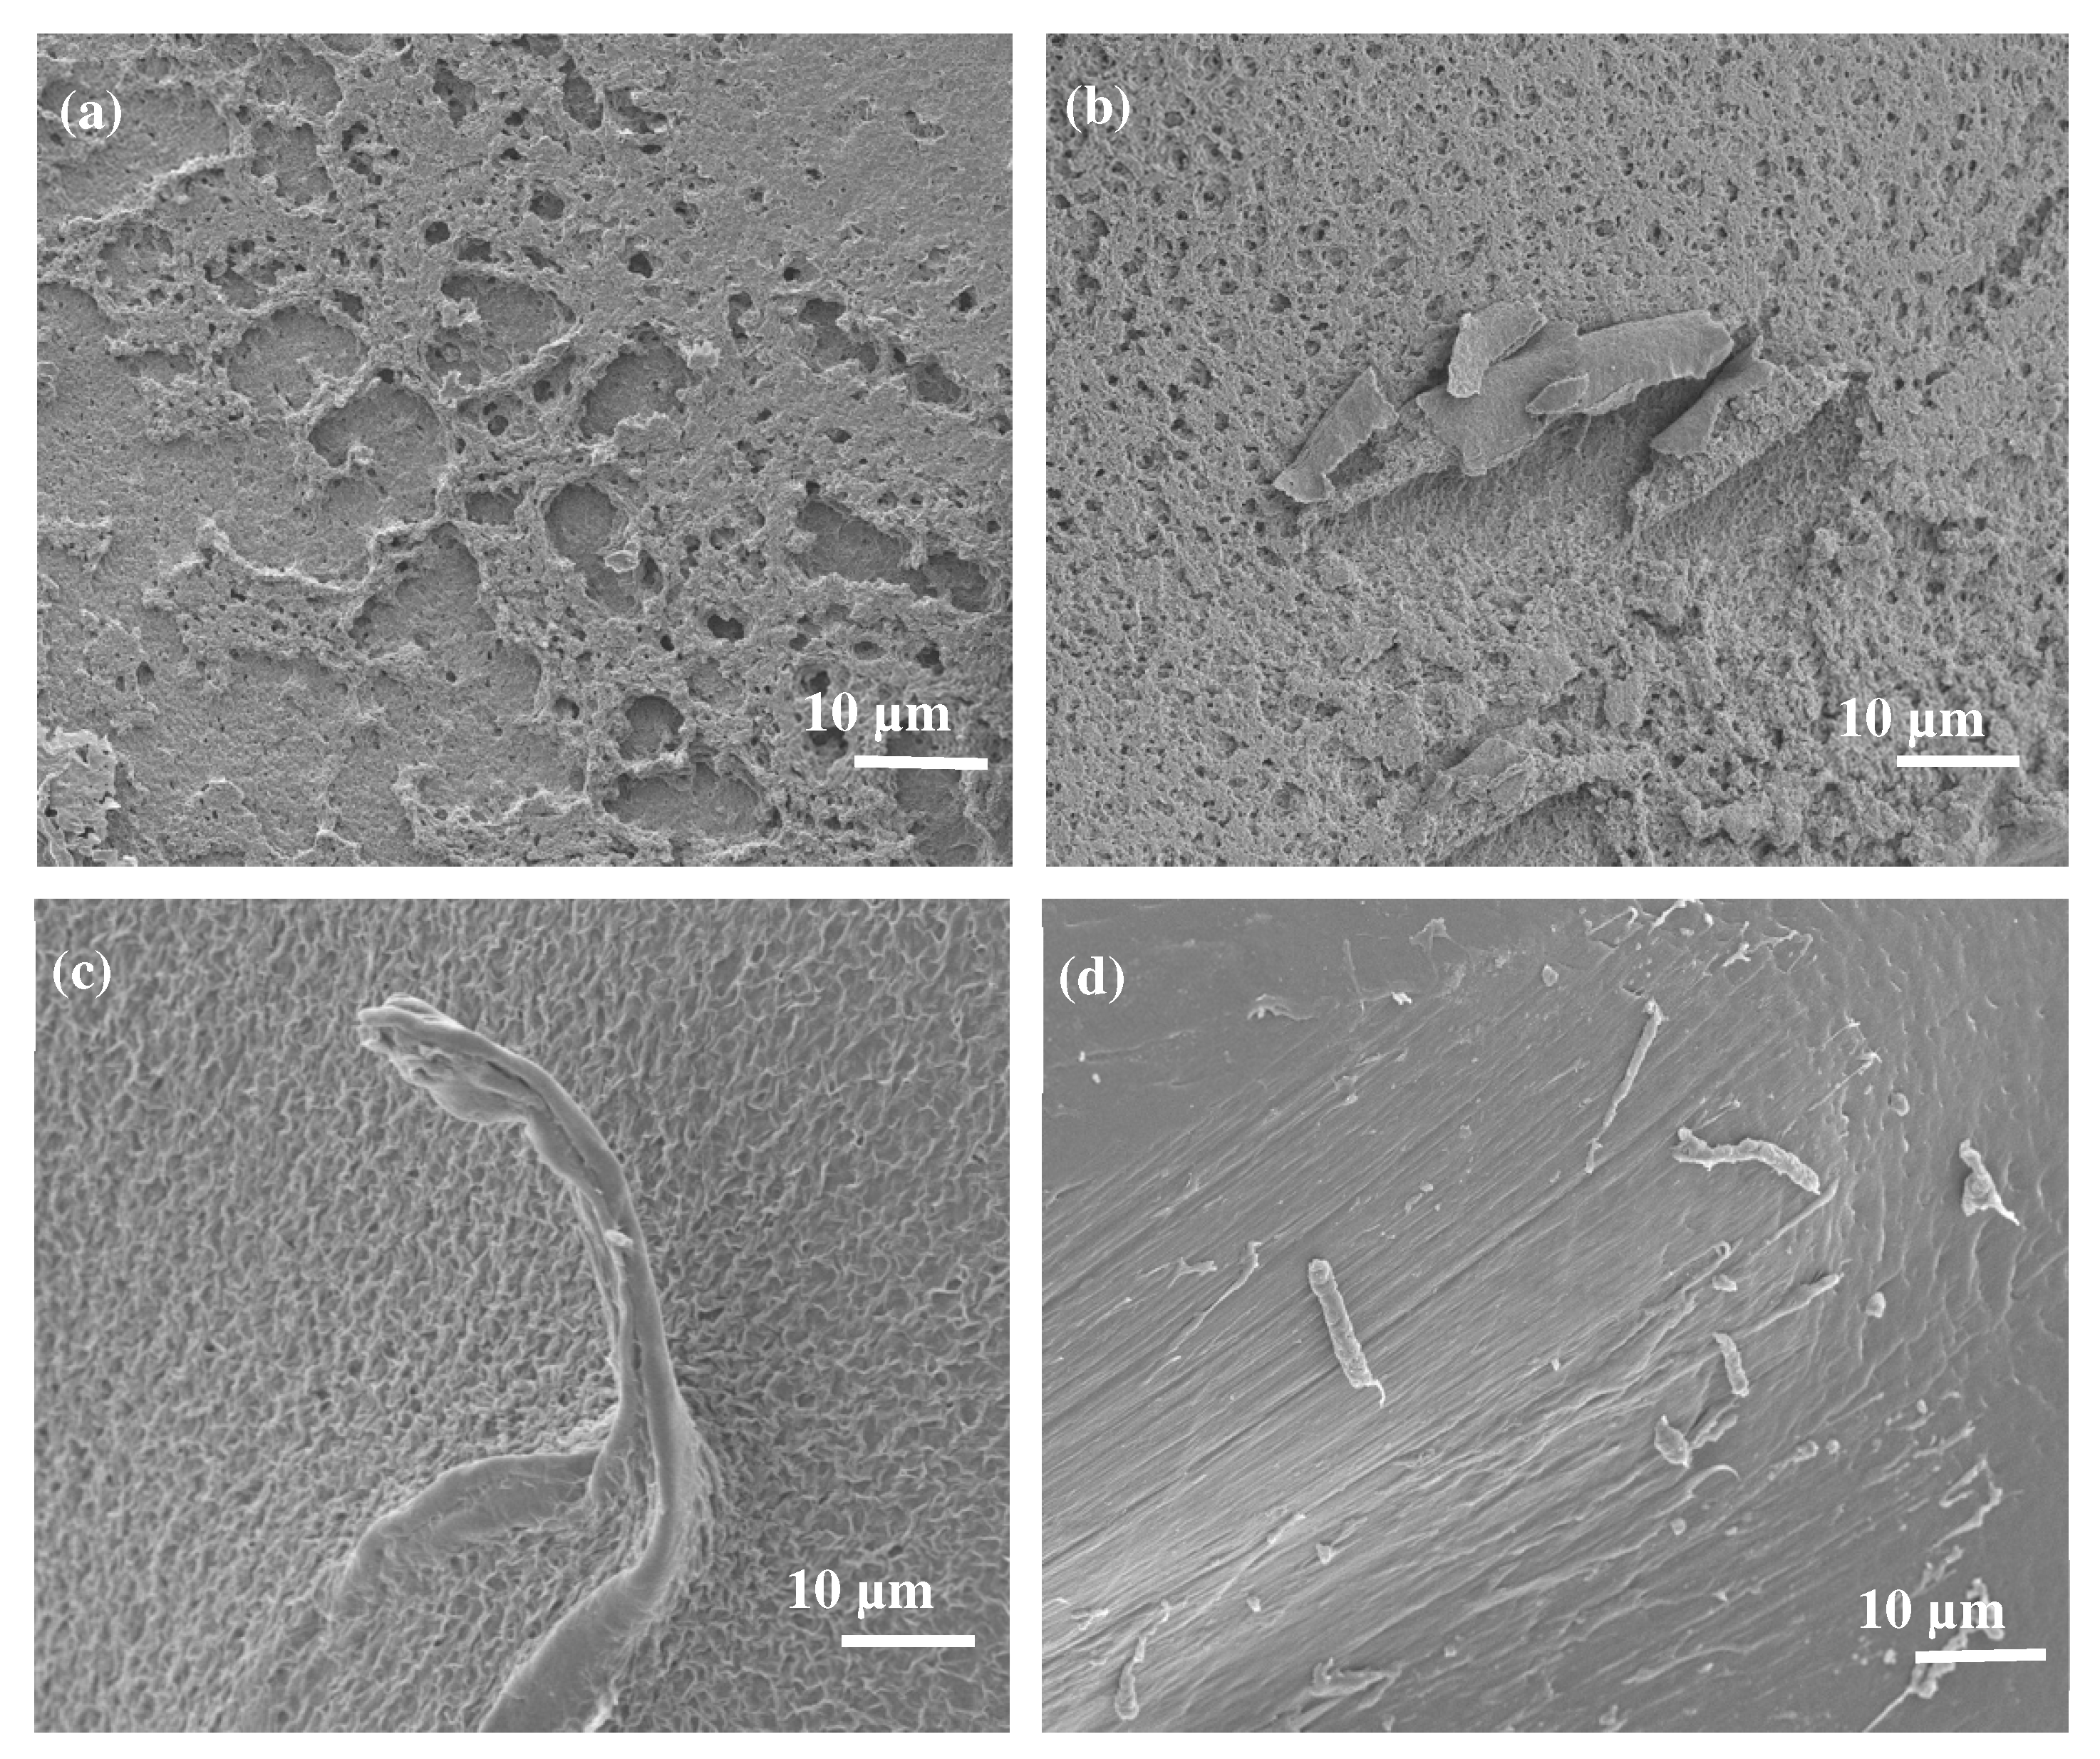
Scanning Electron Microscopy (SEM)
3.3. Thermal Properties
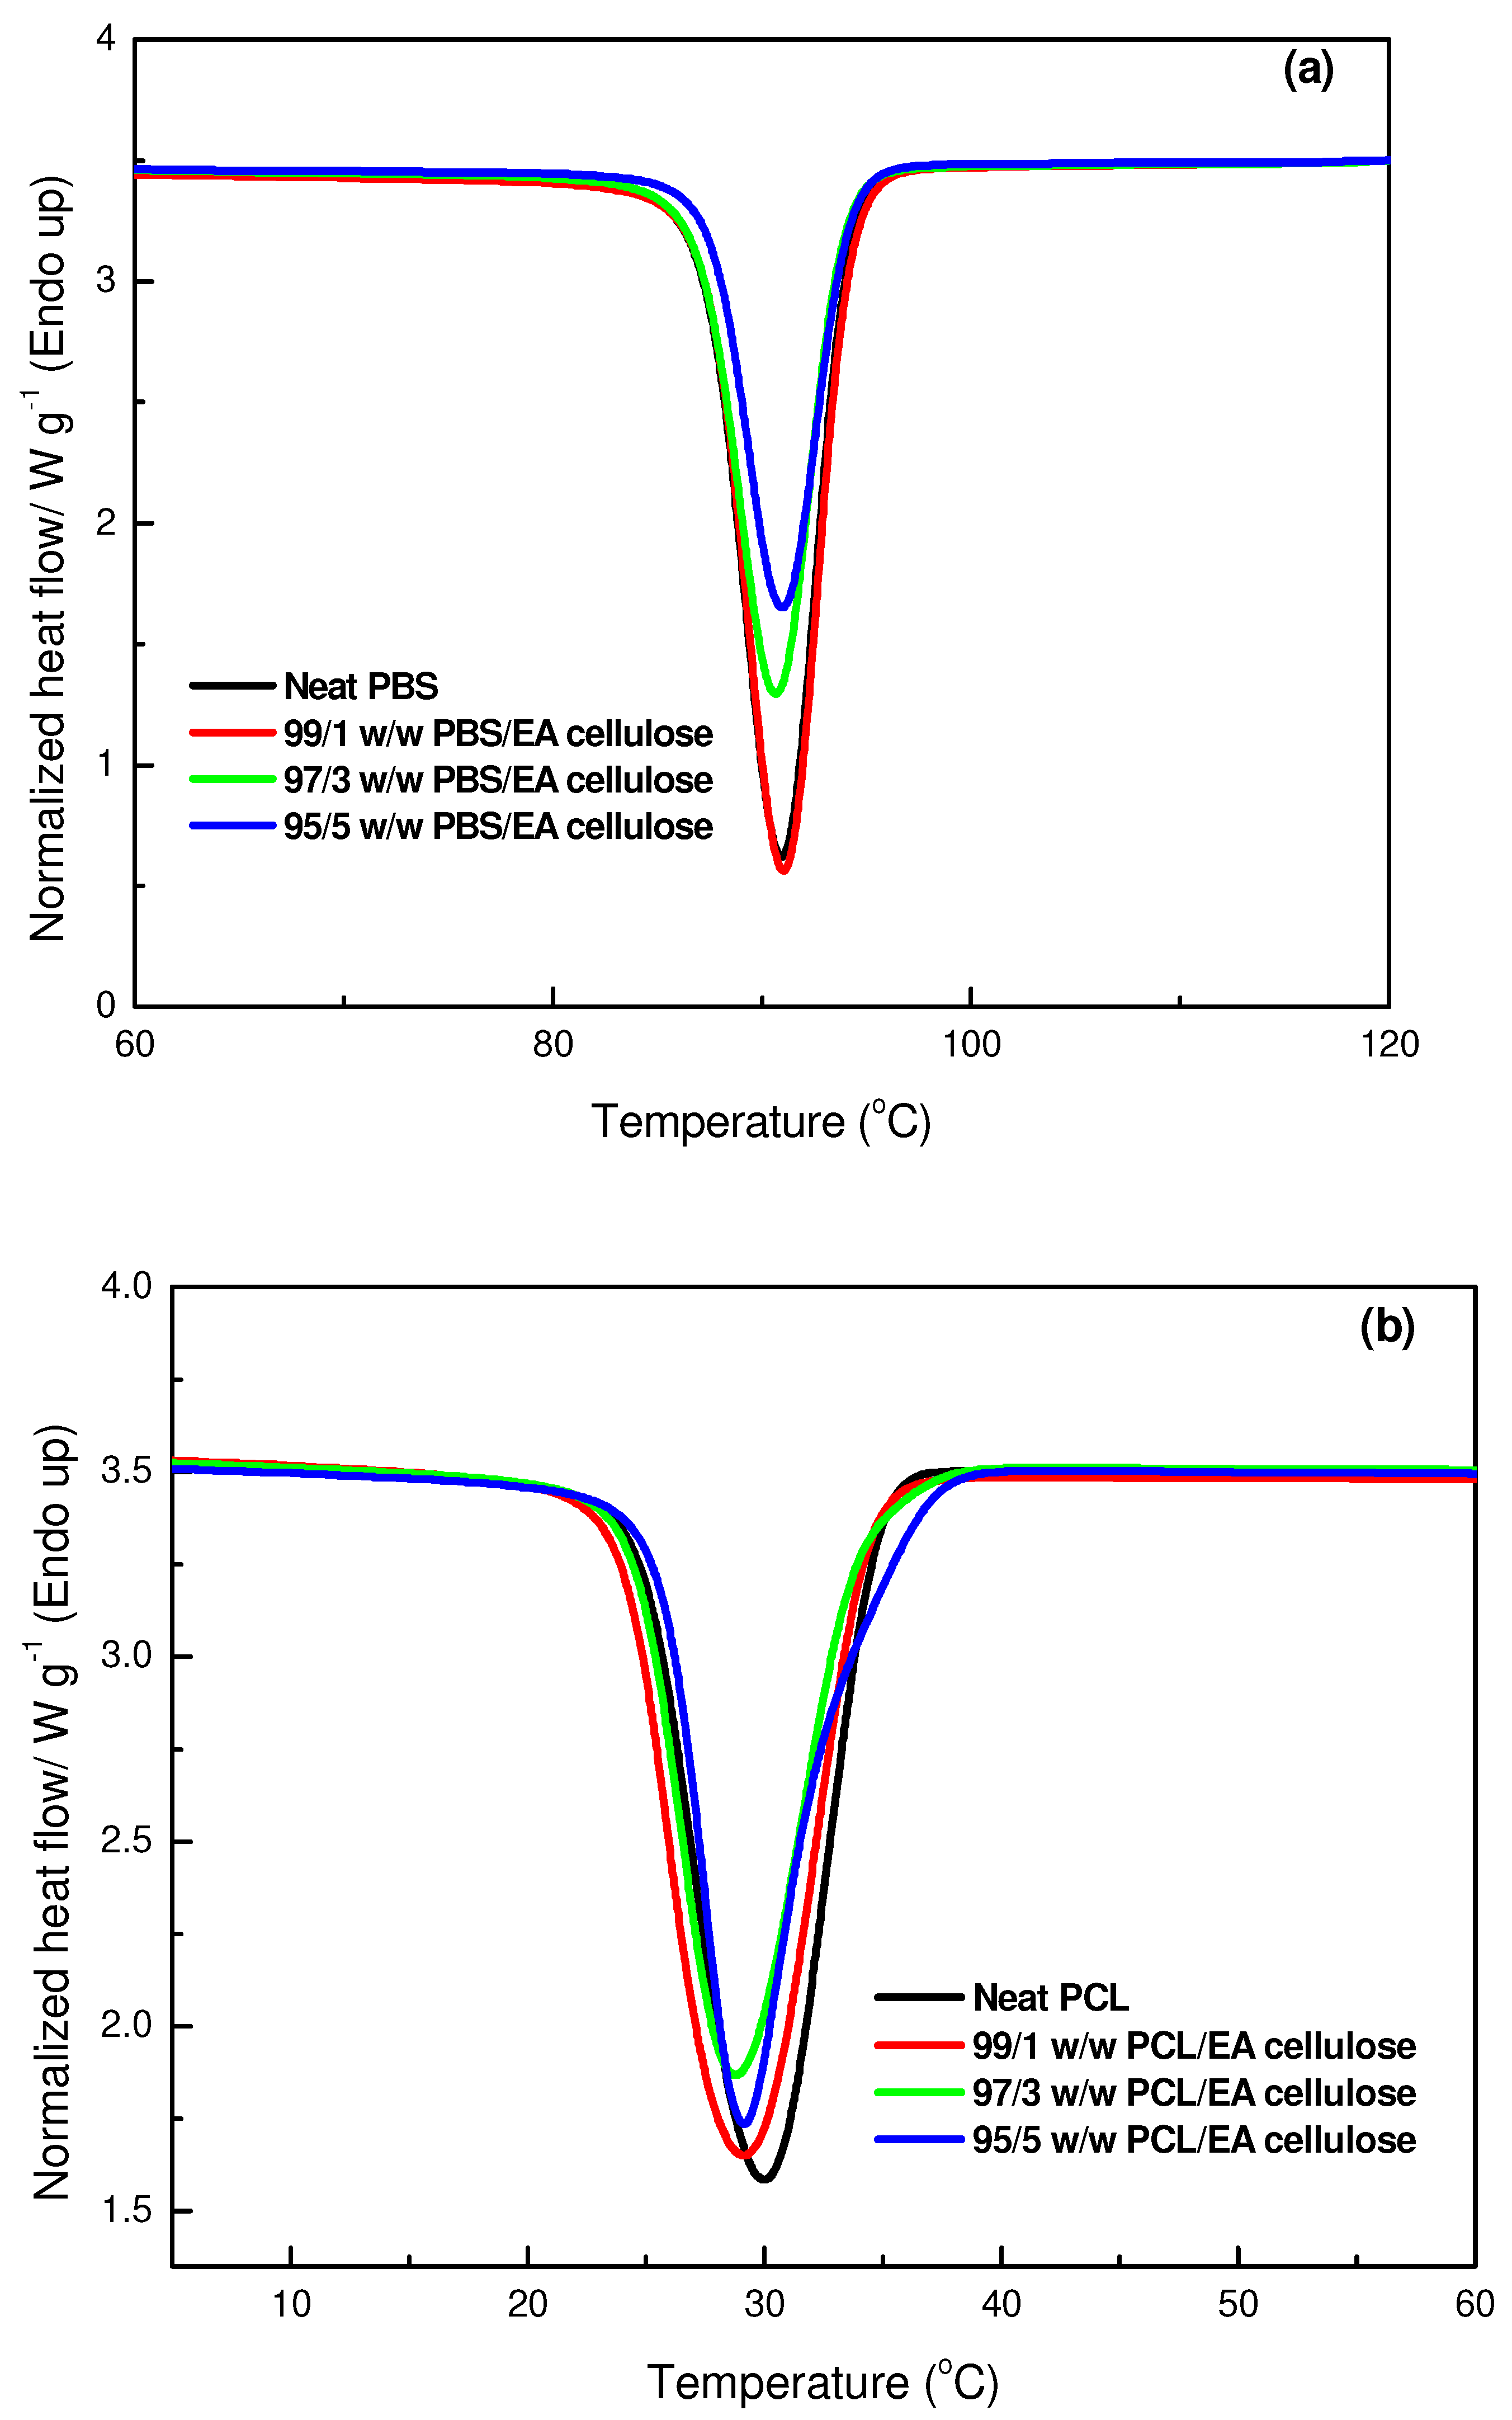
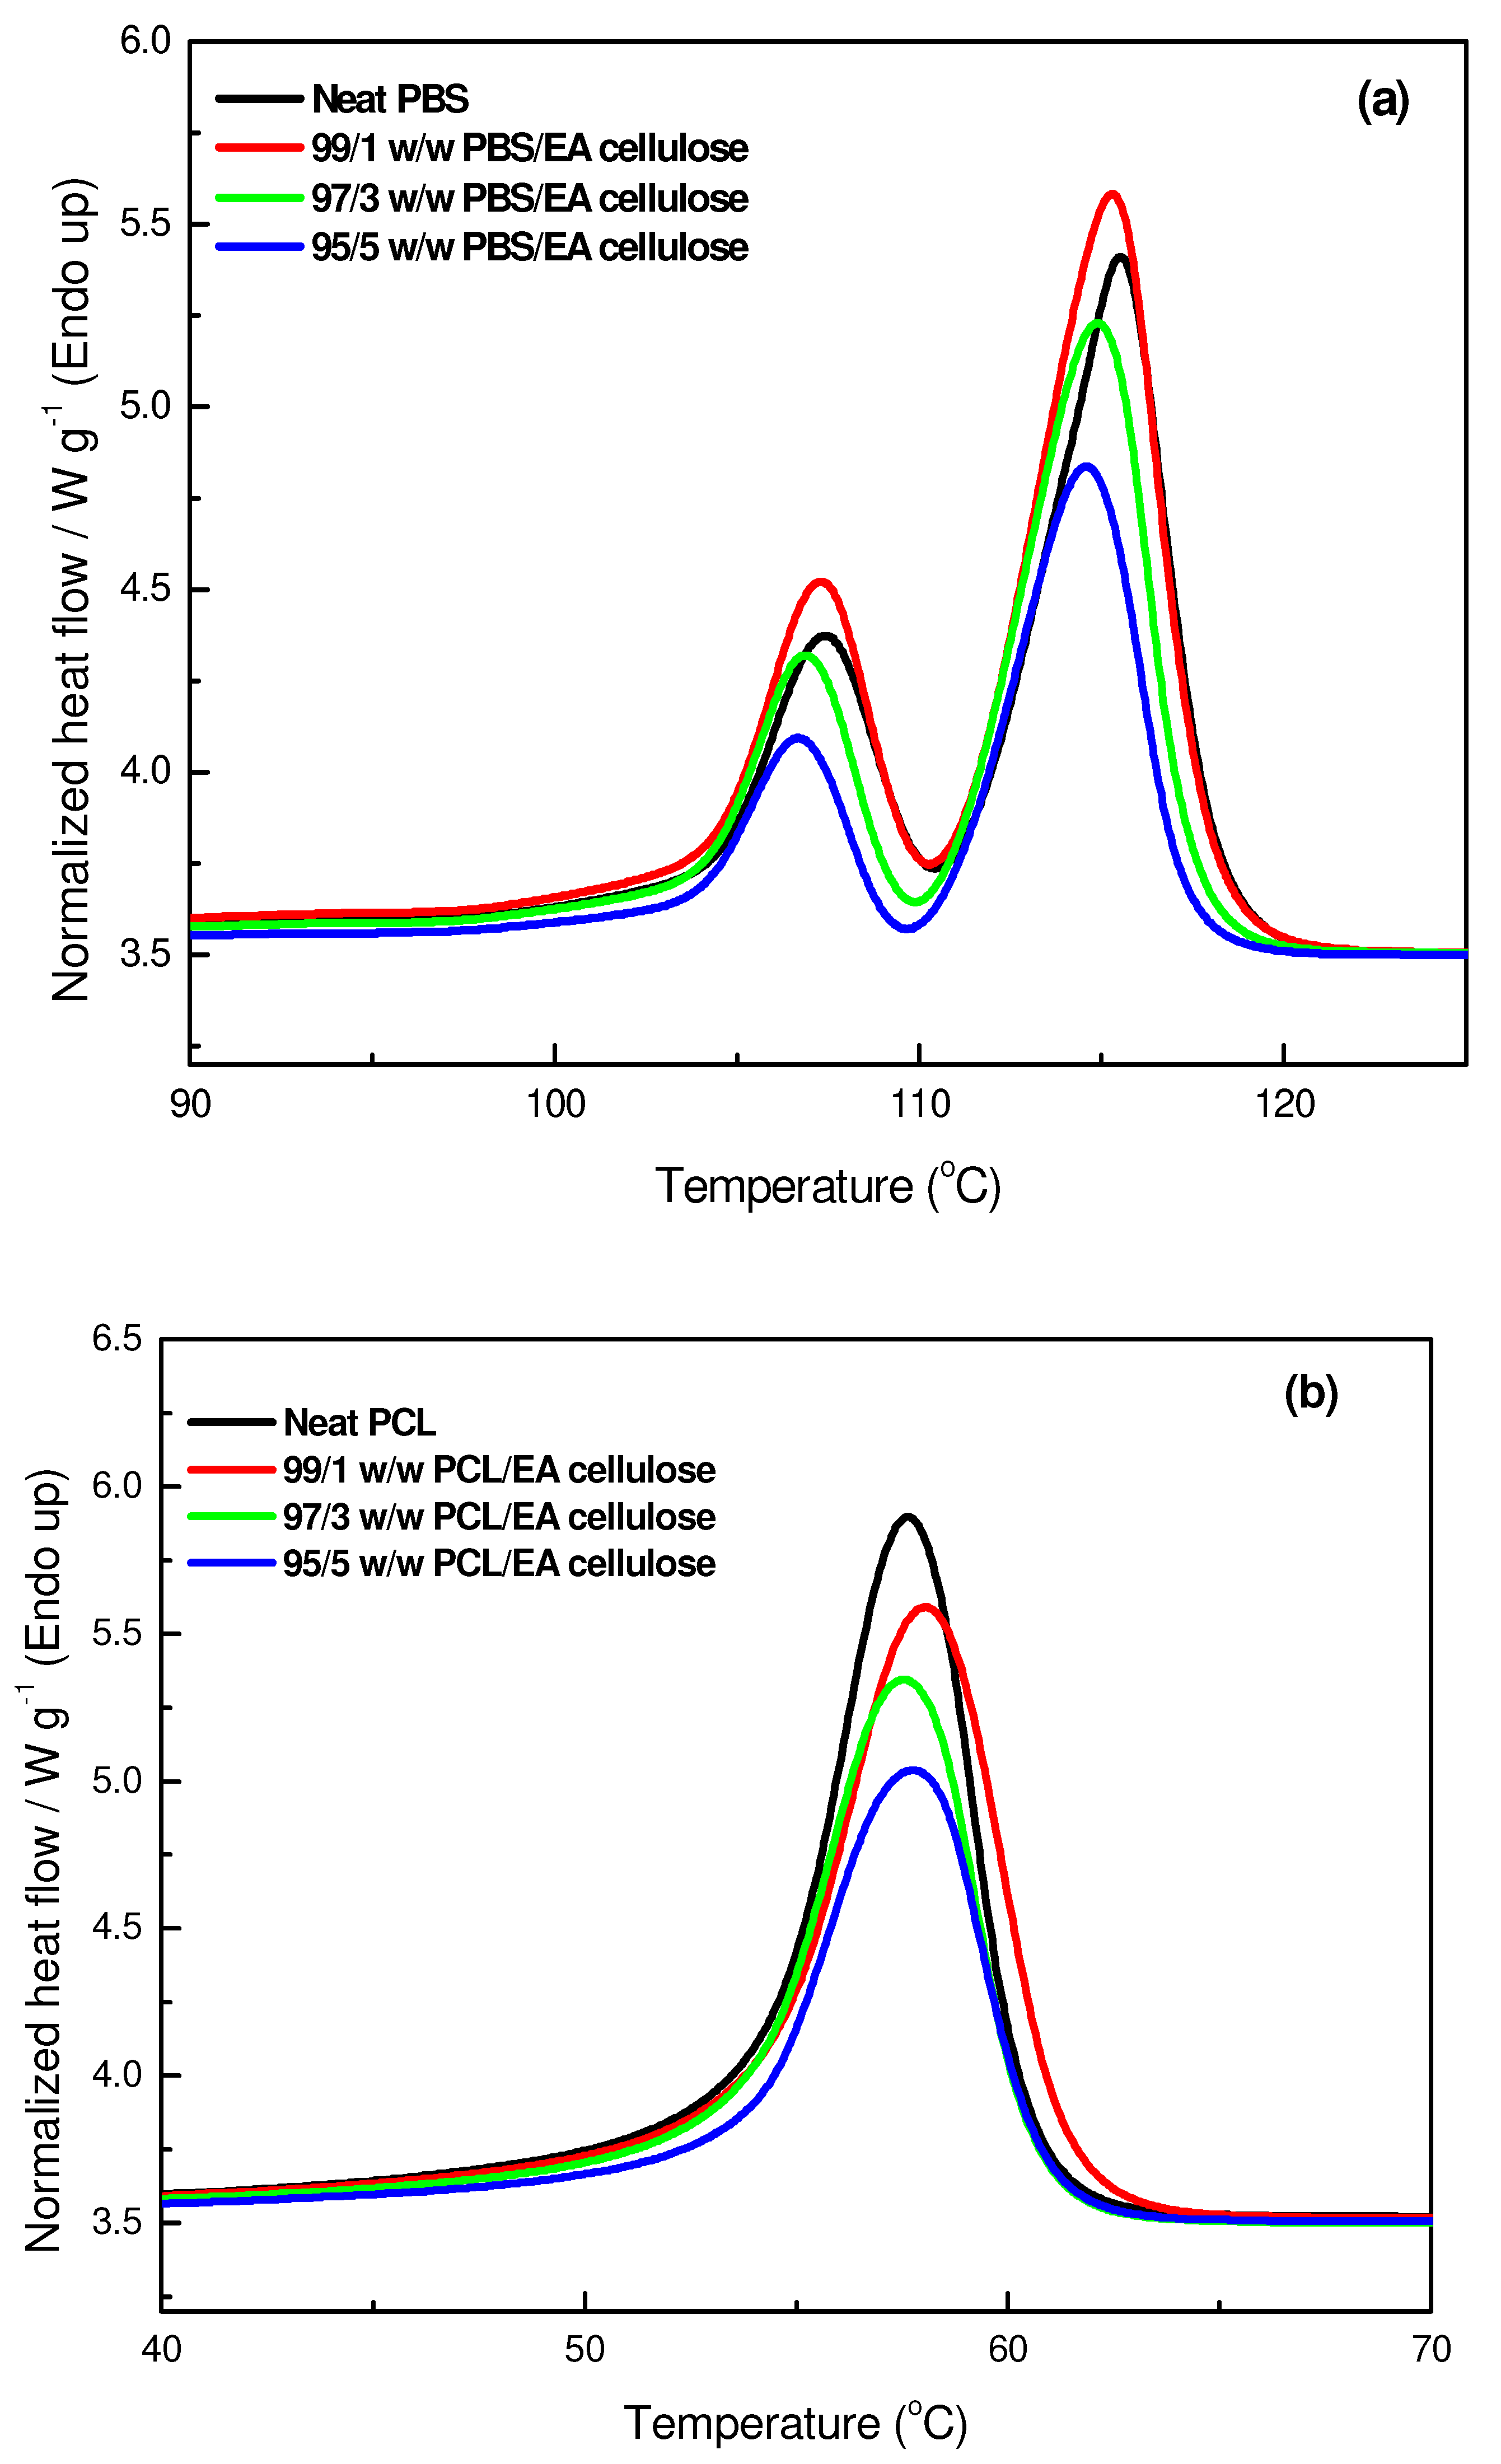
3.3.1. Differential Scanning Microscopy (DSC)
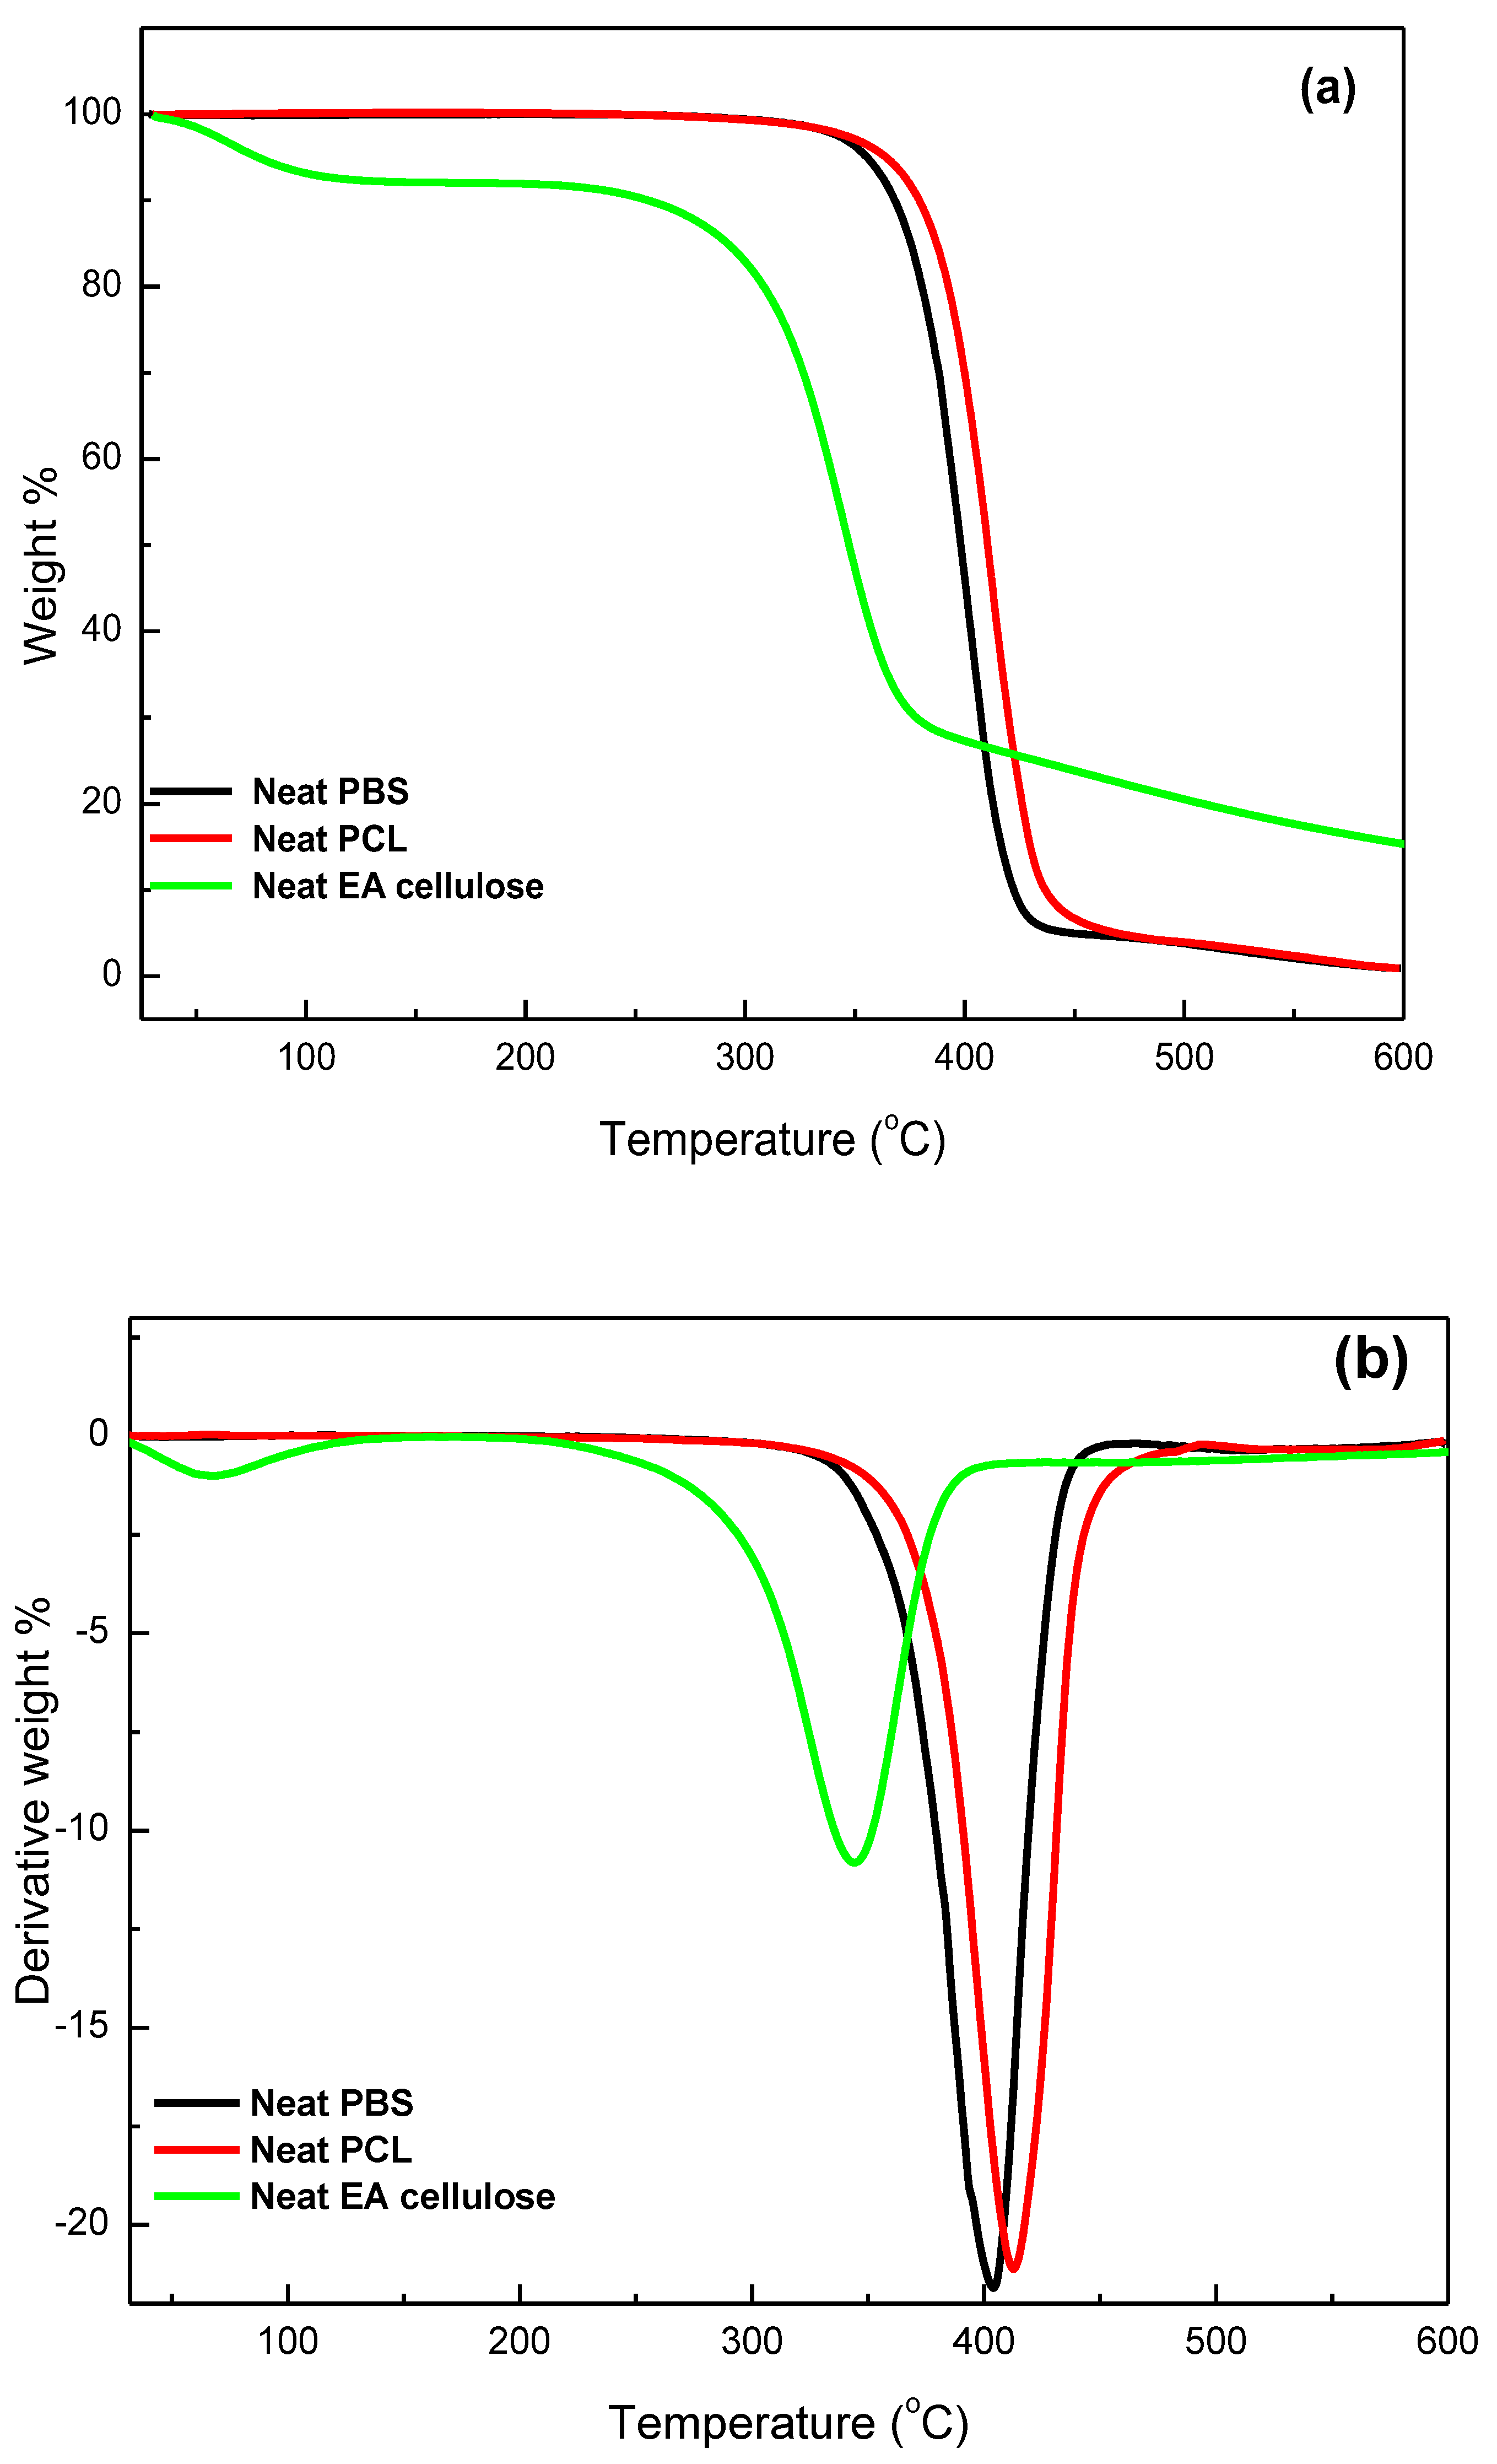
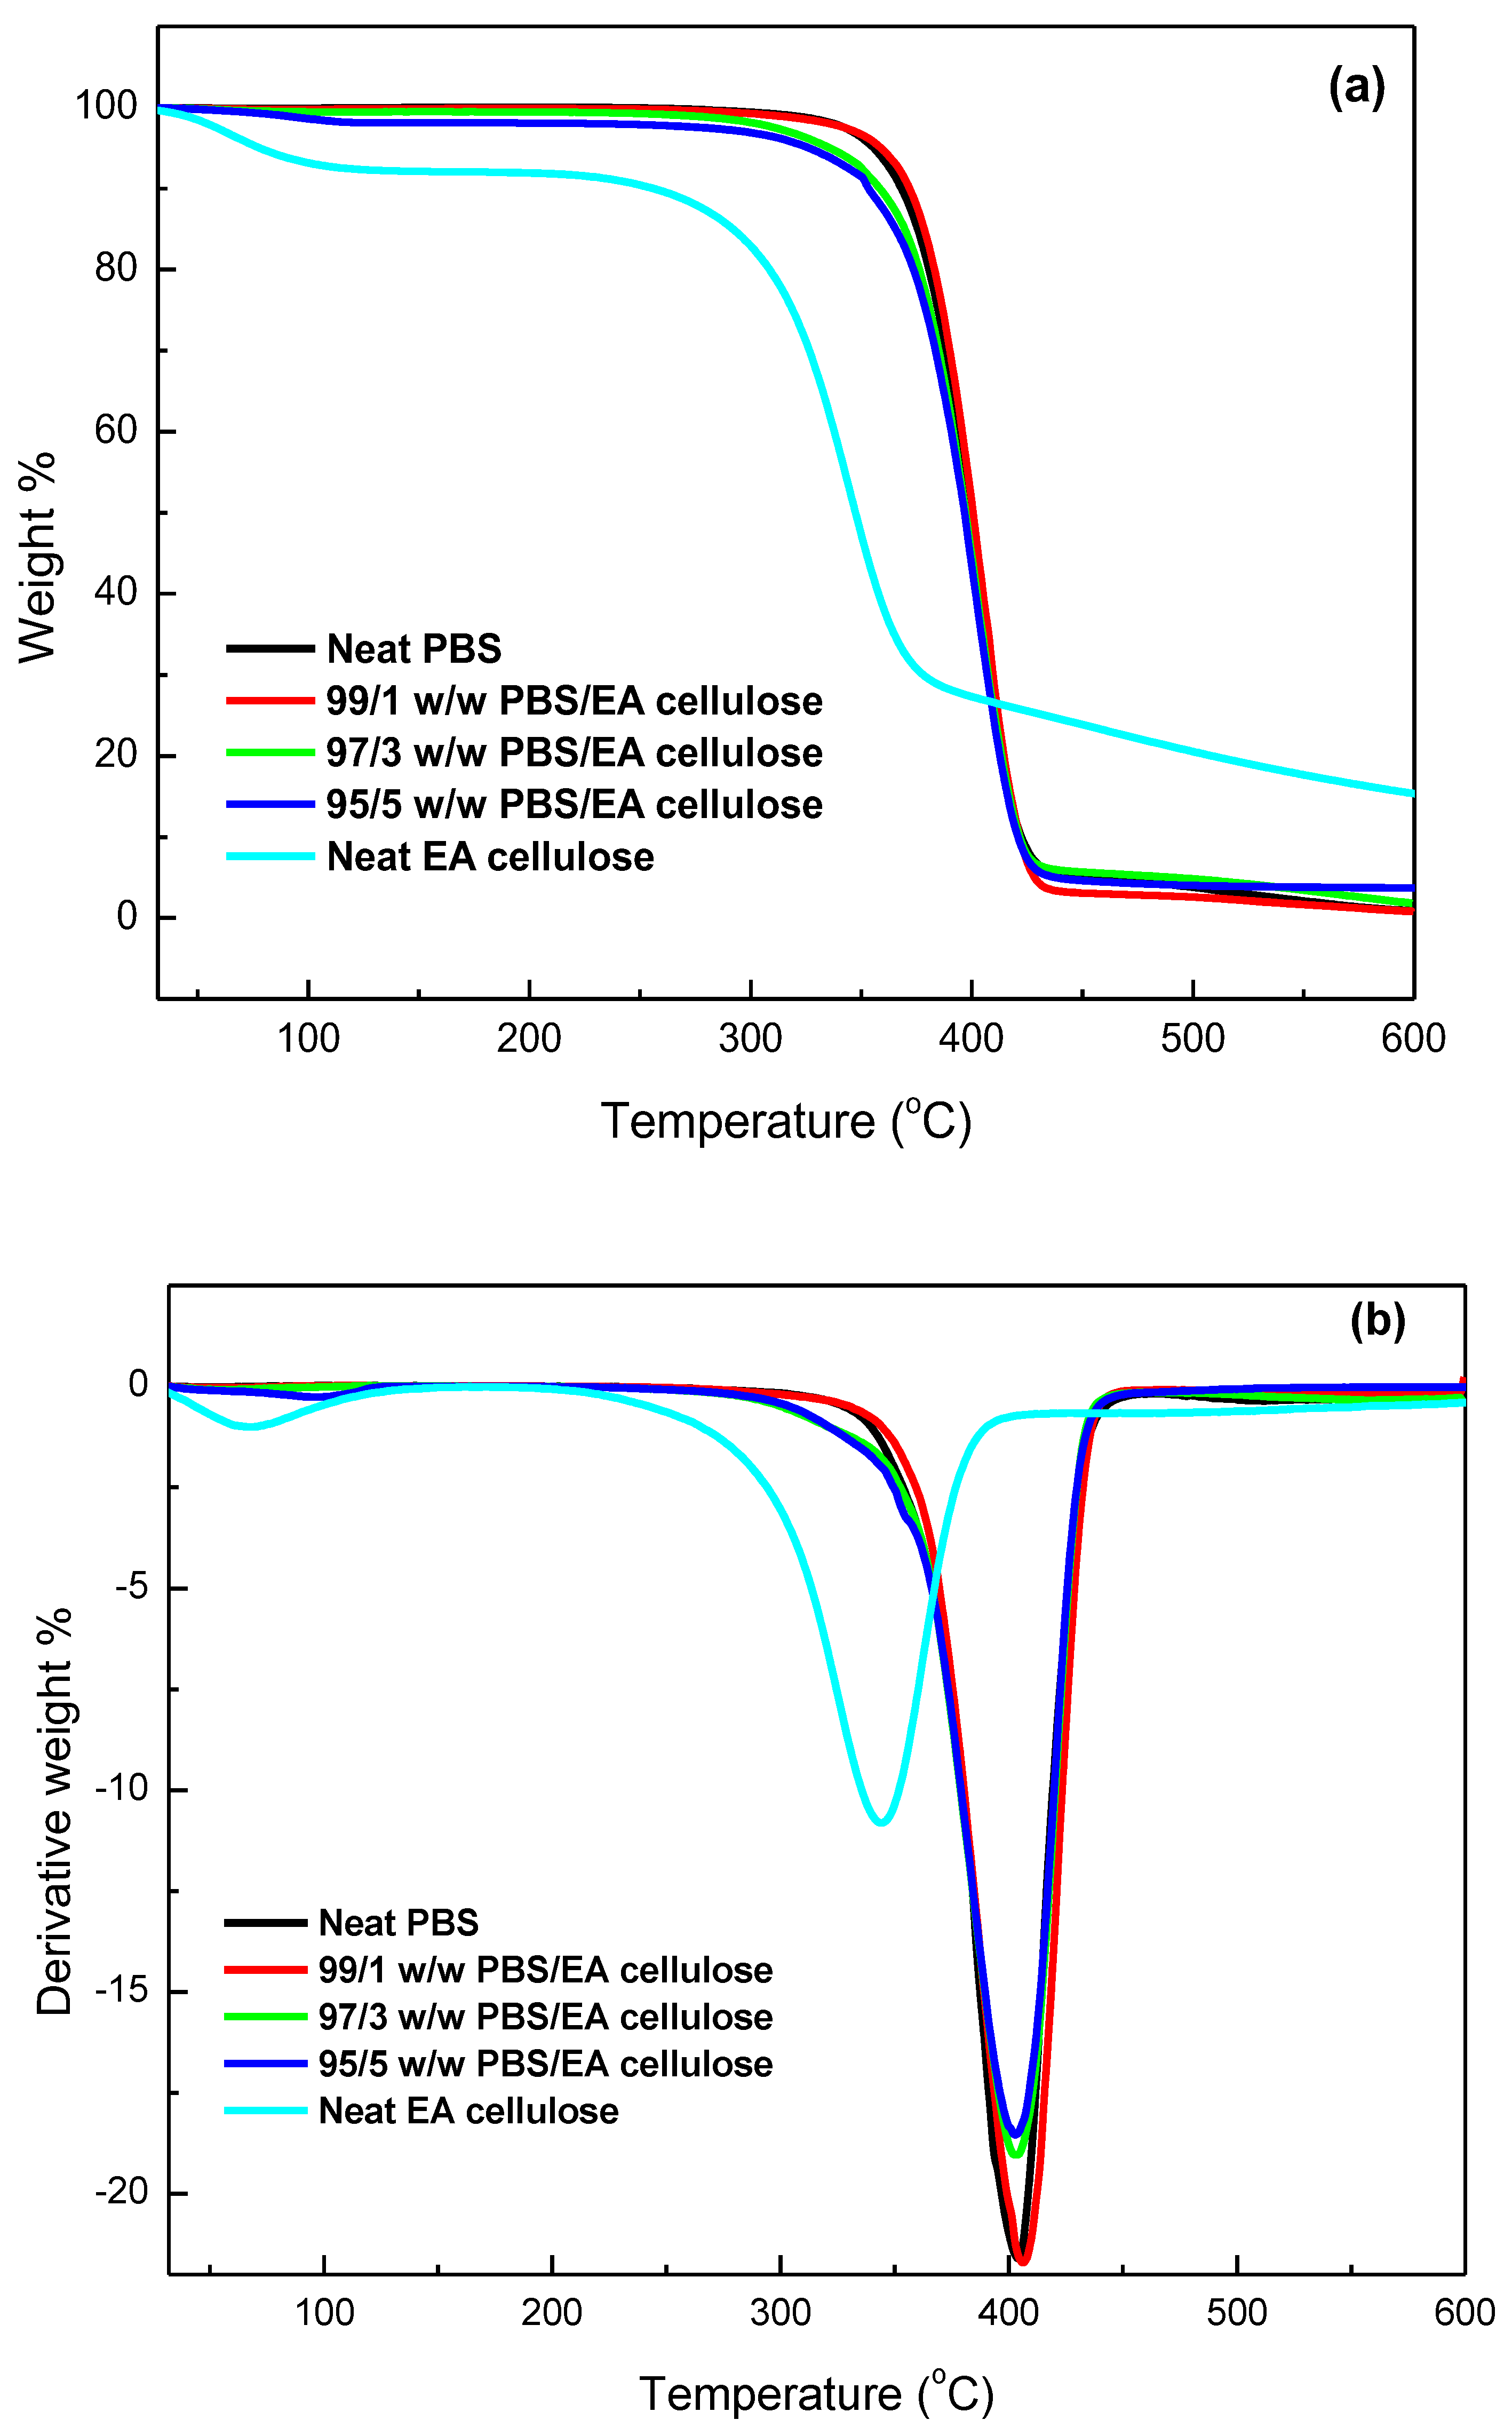
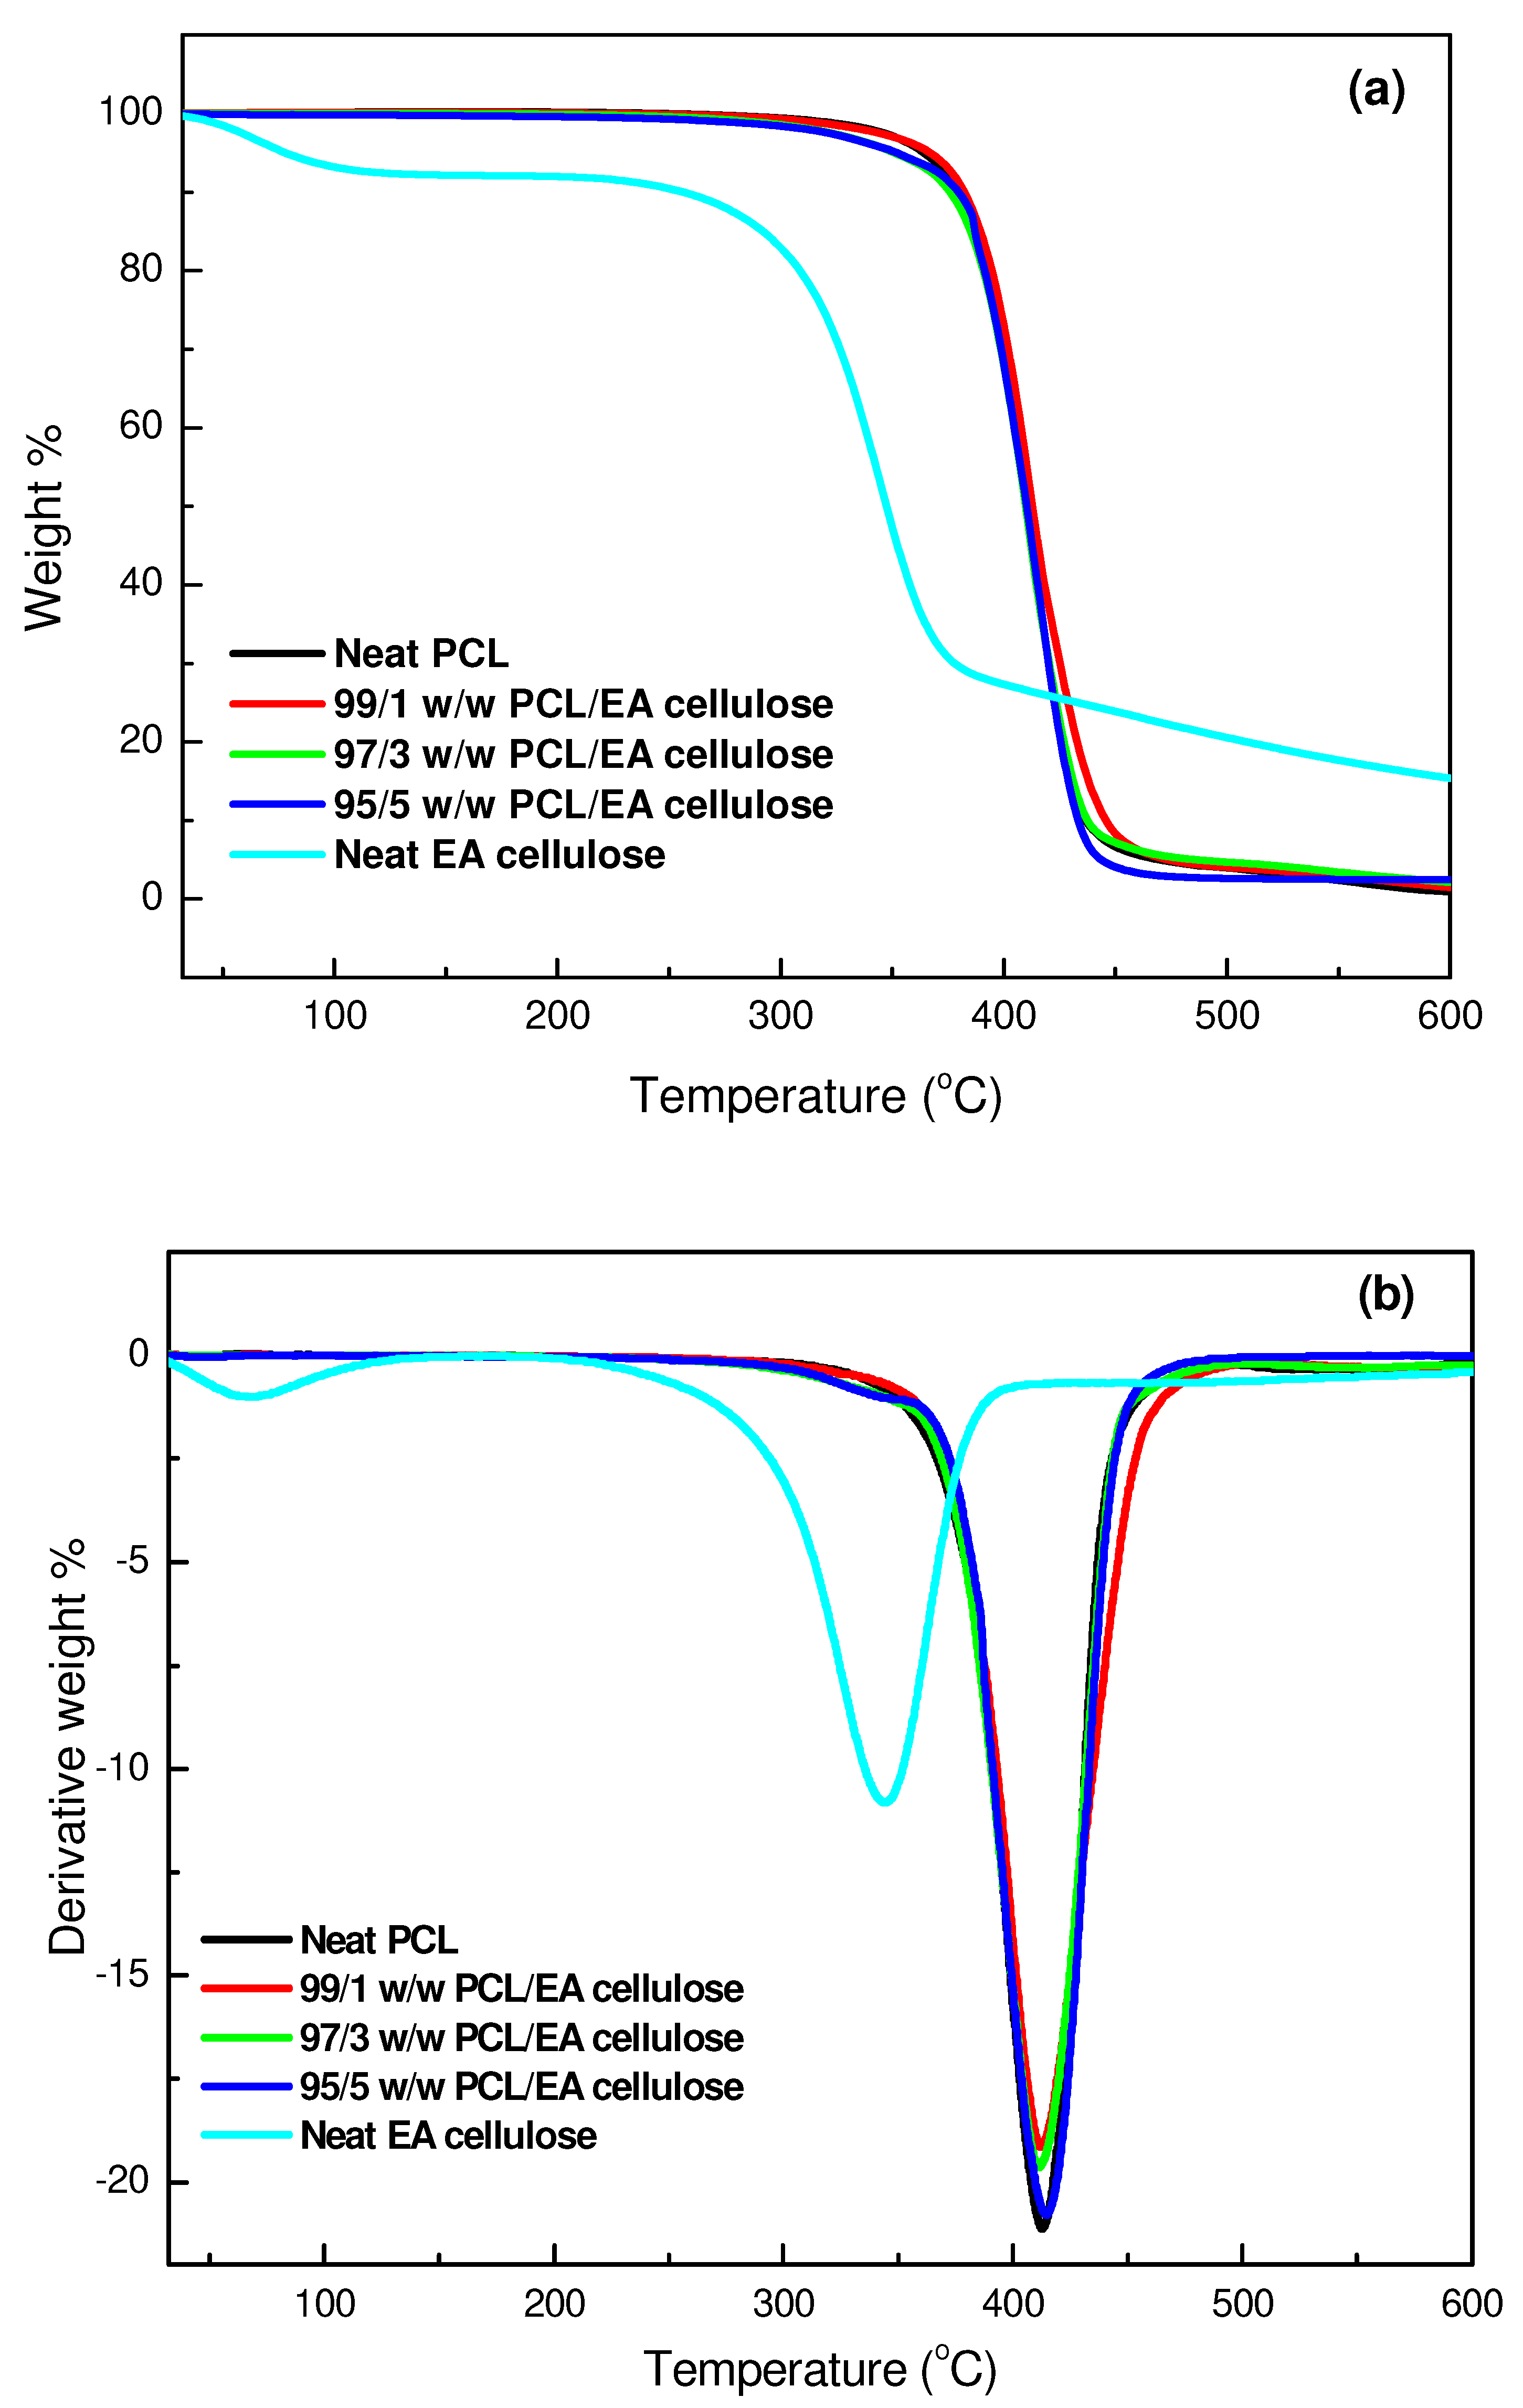
3.3.2. Thermogravimetric Analysis (TGA)
4. Conclusions
Author Contributions
Funding
Institutional Review Board Statement
Data Availability Statement
Conflicts of Interest
Abbreviations
| EA | Eucomis autumnalis |
| PBS | Poly (butylene succinate) |
| PCL | Poly(caprolactone) |
| FTIR | Fourier-transform infrared spectroscopy |
| XRD | X-ray Diffraction |
| SEM | Scanning electron microscopy |
| DSC | Differential scanning calorimetry |
| TGA | Thermogravimetric analysis |
References
- Filiciotto, L.; Rothenberg, G. Biodegradable Plastics: Standards, Policies, and Impacts. ChemSusChem 2021, 14, 56–72. [Google Scholar] [CrossRef] [PubMed]
- Bartl, A. Textile Waste. In Waste: A Handbook Management; Academic Press: Cambridge, MA, USA, 2011; pp. 167–179. [Google Scholar] [CrossRef]
- Samir, A.; Ashour, F.H.; Hakim, A.A.A.; Bassyouni, M. Recent Advances in Biodegradable Polymers for Sustainable Applications. npj Mater. Degrad. 2022, 6, 1. [Google Scholar] [CrossRef]
- Peñas, M.I.; Pérez-Camargo, R.A.; Hernández, R.; Müller, A.J. A Review on Current Strategies for the Modulation of Thermomechanical, Barrier, and Biodegradation Properties of Poly (Butylene Succinate) (PBS) and Its Random Copolymers. Polymers 2022, 14, 1025. [Google Scholar] [CrossRef] [PubMed]
- Laura, A.; Seggiani, M.; Lazzeri, A.; Vito, G.; Patrizia, C. A Brief Review of Poly (Butylene Succinate) (PBS) and Its Main and Applications. Polymers 2022, 14, 844. [Google Scholar]
- Rafiqah, S.A.; Khalina, A.; Harmaen, A.S.; Tawakkal, I.A.; Zaman, K.; Asim, M.; Nurrazi, M.N.; Lee, C.H. A Review on Properties and Application of Bio-based Poly(Butylene Succinate). Polymers 2021, 13, 1436. [Google Scholar] [CrossRef]
- Azimi, B.; Nourpanah, P.; Rabiee, M.; Arbab, S. Poly (ε-Caprolactone) Fiber: An Overview. J. Eng. Fibers Fabr. 2014, 9, 74–90. [Google Scholar] [CrossRef]
- Mofokeng, J.P.; Luyt, A.S. Dynamic Mechanical Properties of PLA/PHBV, PLA/PCL, PHBV/PCL Blends and Their Nanocomposites with TiO2 as Nanofiller. Thermochim. Acta 2015, 613, 41–53. [Google Scholar] [CrossRef]
- Chen, J.; Huang, Y.; Deng, L.; Jiang, H.; Yang, Z.; Yang, R.; Wu, D. Preparation and Research of PCL/Cellulose Composites: Cellulose Derived from Agricultural Wastes. Int. J. Biol. Macromol. 2023, 235, 123785. [Google Scholar] [CrossRef]
- Sikhosana, S.T.; Gumede, T.P.; Malebo, N.J.; Ogundeji, A.O.; Motloung, B. The Influence of Cellulose Content on the Morphology, Thermal, and Mechanical Properties of Poly(Lactic Acid)/Eucomis autumnalis Cellulose Biocomposites. Polym. Eng. Sci. 2023, 63, 1411–1422. [Google Scholar] [CrossRef]
- Celebi, H.; Ilgar, M.; Seyhan, A.T. Evaluation of the Effect of Isocyanate Modification on the Thermal and Rheological Properties of Poly(ε-Caprolactone)/Cellulose Composites. Polym. Bull. 2022, 79, 4941–4955. [Google Scholar] [CrossRef]
- Seddiqi, H.; Oliaei, E.; Honarkar, H.; Jin, J.; Geonzon, L.C.; Bacabac, R.G.; Klein-Nulend, J. Cellulose and Its Derivatives: Towards Biomedical Applications; Springer: Dordrecht, The Netherlands, 2021; Volume 28, ISBN 1057002003. [Google Scholar]
- Müller, A.; Zink, M.; Hessler, N.; Wesarg, F.; Müller, F.A.; Kralisch, D.; Fischer, D. Bacterial Nanocellulose with a Shape-Memory Effect as Potential Drug Delivery System. RSC Adv. 2014, 4, 57173–57184. [Google Scholar] [CrossRef]
- Sikhosana, S.T.; Gumede, T.P.; Malebo, N.J.; Ogundeji, A.O.; Motloung, B. Medicinal Plants as a Cellulose Source for the Fabrication of Poly(Lactic Acid) Composites: A Mini-Review. Polym. Renew. Resour. 2023, 14, 44–57. [Google Scholar] [CrossRef]
- Taylor, J.L.S.; van Staden, J. The Effect of Age, Season and Growth Conditions on Anti-Inflammatory Activity in Eucomis autumnalis (Mill.) Chitt. Plant Extracts. Plant Growth Regul. 2001, 34, 39–47. [Google Scholar] [CrossRef]
- Ndhlala, A.R.; Mulaudzi, R.B.; Kulkarni, M.G.; Van Staden, J. Effect of Environmental Factors on Seedling Growth, Bulb Development and Pharmacological Properties of Medicinal Eucomis autumnalis. S. Afr. J. Bot. 2012, 79, 1–8. [Google Scholar] [CrossRef]
- Selikane, D.G.A.; Gumede, T.P.; Shingange, K.; Malevu, T.D. A Brief Overview on the Extraction of Cellulose from Medicinal Plants for Advanced Applications. Mater. Sci. Forum 2022, 1059, 81–85. [Google Scholar] [CrossRef]
- Selikane, D.G.; Gumede, T.P.; Shingange, K.; Malevu, T.D.; Ngwenya, M.; Kumalo, F. Characterization of Polycaprolactone/Eucomis autumnalis Cellulose Composite: Structural, Thermal, and Mechanical Analysis. J. Biomim. Biomater. Biomed. Eng. 2024, 65, 45–58. [Google Scholar]
- Gumede, T.P.; Luyt, A.S.; Tercjak, A.; Müller, A.J. Isothermal Crystallization Kinetics and Morphology of Double Crystalline PCL/PBS Blends Mixed with a Polycarbonate/MWCNTs Masterbatch. Polymers 2019, 11, 682. [Google Scholar] [CrossRef]
- Platnieks, O.; Gaidukovs, S.; Barkane, A.; Sereda, A.; Gaidukova, G.; Grase, L.; Thakur, V.K.; Filipova, I.; Fridrihsone, V.; Skute, M.; et al. Bio-Based Poly(Butylene Succinate)/Microcrystalline Cellulose/Nanofibrillated Cellulose-Based Sustainable Polymer Composites: Thermo-Mechanical and Biodegradation Studies. Polymers 2020, 12, 1472. [Google Scholar] [CrossRef] [PubMed]
- Wang, S.; Xing, Q. Study on Properties and Biocompatibility of Poly (Butylene Succinate) and Sodium Alginate Biodegradable Composites for Biomedical Applications. Mater. Res. Express 2022, 9, 85403. [Google Scholar] [CrossRef]
- de Matos Costa, A.R.; Crocitti, A.; de Carvalho, L.H.; Carroccio, S.C.; Cerruti, P.; Santagata, G. Properties of Biodegradable Films Based on Poly(Butylene Succinate) (Pbs) and Poly(Butylene Adipate-Co-Terephthalate) (Pbat) Blends. Polymers 2020, 12, 2317. [Google Scholar] [CrossRef]
- Hospodarova, V.; Singovszka, E.; Stevulova, N. Characterization of Cellulosic Fibers by FTIR Spectroscopy for Their Further Implementation to Building Materials. Am. J. Anal. Chem. 2018, 9, 303–310. [Google Scholar] [CrossRef]
- Shi, K.; Liu, Y.; Hu, X.; Su, T.; Li, P.; Wang, Z. Preparation, Characterization, and Biodegradation of Poly(Butylene Succinate)/Cellulose Triacetate Blends. Int. J. Biol. Macromol. 2018, 114, 373–380. [Google Scholar] [CrossRef]
- Phiri, M.J.; Mofokeng, J.P.; Phiri, M.M.; Mngomezulu, M.; Tywabi-Ngeva, Z. Effect of PCL and Compatibility Contents on the Morphology, Crystallization and Mechanical Properties of PLA/PCL Blends. Heliyon 2023, 9, e21238. [Google Scholar] [CrossRef]
- Radhakrishnan, S.; Thorat, S.; Desale, A.; Desai, P.; Kulkarni, M.B. Structure and Properties of PBS/PBAT Blends and Nanocomposites. IOP Conf. Ser. Mater. Sci. Eng. 2022, 1248, 012013. [Google Scholar] [CrossRef]
- Yu, H.Y.; Qin, Z.Y.; Liu, Y.N.; Chen, L.; Liu, N.; Zhou, Z. Simultaneous Improvement of Mechanical Properties and Thermal Stability of Bacterial Polyester by Cellulose Nanocrystals. Carbohydr. Polym. 2012, 89, 971–978. [Google Scholar] [CrossRef] [PubMed]
- Asif, M.; Arman, M.; Muzamil, L.; Khan, A.; Ahmed, H.; Quddusi, M. Studying the Effect of NHAP on the Mechanical and Surface Properties of PBS Matrix. J. Polym. Res. 2021, 28, 349. [Google Scholar] [CrossRef]
- Yoo, E.S.; Im, S.S. Melting Behavior of Poly(Butylene Succinate) during Heating Scan by DSC. J. Polym. Sci. B Polym. Phys. 1999, 37, 1357–1366. [Google Scholar] [CrossRef]
- Young, R.J.; Lovell, P.A. Introduction to Polymers, 3rd ed.; CRC Press: New York, NY, USA, 2011. [Google Scholar]
- de Oliveira Aguiar, V.; de Fatima Vieira Marques, M. Composites of Polycaprolactone with Cellulose Fibers: Morphological and Mechanical Evaluation. Macromol. Symp. 2016, 367, 101–112. [Google Scholar] [CrossRef]
- Mi, H.Y.; Jing, X.; Peng, J.; Salick, M.R.; Peng, X.F.; Turng, L.S. Poly(ε-Caprolactone) (PCL)/Cellulose Nano-Crystal (CNC) Nanocomposites and Foams. Cellulose 2014, 21, 2727–2741. [Google Scholar] [CrossRef]


| Sample | Mass of the Ground Powder (g) | Mass of Cellulose (g) | % Yield of Cellulose |
|---|---|---|---|
| Cellulose from the leaves | 60.02 | 23.02 | 38 |
| PBS | PCL | EA Cellulose |
|---|---|---|
| 100 | 0 | 0 |
| 99 | 0 | 1 |
| 97 | 0 | 3 |
| 95 | 0 | 5 |
| 0 | 100 | 0 |
| 0 | 99 | 1 |
| 0 | 97 | 3 |
| 0 | 95 | 5 |
| Materials | Assignment | Wavenumber (cm−1) |
|---|---|---|
| PBS | C-H stretching | 2926 |
| C=O stretching vibration | 1711 | |
| -CH2 stretching | 1327 | |
| -C-O-C symmetrical vibration | 1158 | |
| C-OH bending | 917 | |
| PCL | -CH2 stretching | 3000–2840 |
| C=O stretching | 1730–1715 | |
| C-C and C-O stretching | 1291 and 1179 | |
| -C-O-C, asymmetrical and symmetrical | 1190 and 1170 | |
| EA cellulose | -OH stretching | 4000–2995 |
| C-H stretching | 2890 | |
| C-O-C stretching | 1162–1022 |
| SAMPLES | Tm/°C | ∆Hm/J/g | Tc/°C | ∆Hc/J/g | Xc/% |
|---|---|---|---|---|---|
| Neat PBS | 107.4 b ± 0.1 115.7 c ± 0.2 | 14 b ± 0.6 39 c ± 2.9 | 90.2 b ± 0.0 | 70 b ± 2.4 | 27.5 b |
| 99/1 w/w PBS/EA cellulose | 107.3 b ± 0.1 115.5 c ± 0.2 | 15 b ± 0.8 41 c ± 1.6 | 92.0 b ± 0.3 | 72 b ± 2.5 | 28.4 b |
| 97/3 w/w PBS/EA cellulose | 107.2 b ± 0.2 115.4 c ± 0.2 | 11 b ± 1.1 31 c ± 1.7 | 90.9 b ± 0.2 | 57 b ± 2.6 | 21.3 b |
| 95/5 w/w PBS/EA cellulose | 106.9 b ± 0.2 114.9 c ± 0.1 | 12 b ± 1.3 32 c ± 3.0 | 91.0 b ± 0.2 | 56 b ± 1.4 | 23.0 b |
| Neat PCL | 57.6 a ± 0.2 | 56 a ± 2.6 | 29.8 a ± 0.4 | 68 a ± 1.8 | 40.0 a |
| 99/1 w/w PCL/EA cellulose | 57.8 a ± 0.2 | 55 a ± 0.6 | 28.9 a ± 1.5 | 64 a ± 1.5 | 39.7 a |
| 97/3 w/w PCL/EA cellulose | 57.4 a ± 0.2 | 51 a ± 4.7 | 28.6 a ± 0.2 | 62 a ± 4.2 | 38.0 a |
| 95/5 w/w PCL/EA cellulose | 57.9 a ± 0.4 | 48 a ± 4.5 | 29.3 a ± 0.6 | 53 a ± 0.9 | 36.0 a |
| SAMPLES | Tonset/°C | T50%/°C | Tmax/°C | Char/mass% |
|---|---|---|---|---|
| Neat EA cellulose | 85.69 309.03 | 344.16 | 83.42 344.79 | 15.3 |
| Neat PBS | 347.85 | 397.03 | 402.17 | 0.8 |
| 99/1 w/w PBS/EA cellulose | 374.78 | 401.03 | 406.16 | 0.2 |
| 97/3 w/w PBS/EA cellulose | 372.13 | 397.01 | 403.81 | 1.4 |
| 95/5 w/w PBS/EA cellulose | 371.79 | 394.25 | 403.08 | 4.2 |
| Neat PCL | 360.87 | 409.65 | 413.17 | 0.9 |
| 99/1 w/w PCL/EA cellulose | 368.59 | 410.20 | 411.80 | 1.4 |
| 97/3 w/w PCL/EA cellulose | 373.74 | 410.57 | 412.08 | 1.8 |
| 95/5 w/w PCL/EA cellulose | 382.30 | 409.31 | 414.55 | 3.0 |
Disclaimer/Publisher’s Note: The statements, opinions and data contained in all publications are solely those of the individual author(s) and contributor(s) and not of MDPI and/or the editor(s). MDPI and/or the editor(s) disclaim responsibility for any injury to people or property resulting from any ideas, methods, instructions or products referred to in the content. |
© 2025 by the authors. Licensee MDPI, Basel, Switzerland. This article is an open access article distributed under the terms and conditions of the Creative Commons Attribution (CC BY) license (https://creativecommons.org/licenses/by/4.0/).
Share and Cite
Kumalo, F.I.; Malimabe, M.A.; Mosoabisane, M.F.T.; Gumede, T.P. Development and Characterization of PBS/EA Cellulose and PCL/EA Cellulose Biocomposites: Structural, Morphological, and Thermal Insights for Sustainable Applications. Polymers 2025, 17, 971. https://doi.org/10.3390/polym17070971
Kumalo FI, Malimabe MA, Mosoabisane MFT, Gumede TP. Development and Characterization of PBS/EA Cellulose and PCL/EA Cellulose Biocomposites: Structural, Morphological, and Thermal Insights for Sustainable Applications. Polymers. 2025; 17(7):971. https://doi.org/10.3390/polym17070971
Chicago/Turabian StyleKumalo, Fisokuhle Innocentia, Moipone Alice Malimabe, Mafereka Francis Tyson Mosoabisane, and Thandi Patricia Gumede. 2025. "Development and Characterization of PBS/EA Cellulose and PCL/EA Cellulose Biocomposites: Structural, Morphological, and Thermal Insights for Sustainable Applications" Polymers 17, no. 7: 971. https://doi.org/10.3390/polym17070971
APA StyleKumalo, F. I., Malimabe, M. A., Mosoabisane, M. F. T., & Gumede, T. P. (2025). Development and Characterization of PBS/EA Cellulose and PCL/EA Cellulose Biocomposites: Structural, Morphological, and Thermal Insights for Sustainable Applications. Polymers, 17(7), 971. https://doi.org/10.3390/polym17070971