Article

Effect of UV Radiation Exposure and Simulated Particle Erosion Damage on the Mechanical Behavior of Carbon/Glass Hybrid Composites

by
Marcello de Vasconcelos Porto Hermanny Tostes
and
José Roberto Moraes d’Almeida
*
Chemical and Materials Engineering Department, Pontifical Catholic University of Rio de Janeiro, Rio de Janeiro 22451-900, Brazil
*
Author to whom correspondence should be addressed.
Polymers 2025, 17(7), 861; https://doi.org/10.3390/polym17070861
Submission received: 29 January 2025 / Revised: 7 March 2025 / Accepted: 20 March 2025 / Published: 24 March 2025
(This article belongs to the Special Issue Mechanical Behavior of Polymer Composites)

Abstract

:
The environments found in space research pose numerous challenges to the materials used in aerospace structures, such as high incidence of ultraviolet radiation (UV) and micrometeorite impacts. Therefore, this work analyzes the combined effects of exposure to UV radiation and damage caused by sandblasting on the mechanical performance of a hybrid composite of epoxy matrix reinforced with carbon and glass fibers to simulate service conditions both in low Earth orbit (LEO) and in exoplanet environments. The blasting was carried out with silica particles with dimensions compatible with those found in the dust of the Martian atmosphere, and the damage produced by these particles has dimensions similar to those observed in several impact/wear events of structures exposed to LEO conditions. A qualitative analysis of the effect of UV radiation carried out by colorimetry showed a significant change in the color of the material, which became more greenish and yellowish. This color change is indicative of degradation processes in the polymer matrix. FT-IR analysis showed an increase in the carbonyl band with increasing aging time, which is consistent with the color change measured in the material. However, the interlaminar shear strength was not affected by UV radiation in the time used in this work. This behavior was attributed to the fact that UV radiation initially causes deterioration only on the surface of the material. From the results of the bending tests, both the three-point bending test and impulse excitation test, it was found that the effect of UV radiation on the elastic modulus of the composites was more important than the effect of blasting damage. It was also observed that initial UV exposure, prior to sandblasting, has a synergistic effect on the deterioration of flexural strength.

1. Introduction

Fiber-reinforced polymer composites have numerous applications in various industrial areas, from repairs for the oil and gas industry [1] to structural components of satellites and aircraft [2,3,4,5]. In space exploration, composites are, in fact, materials with great prospects for increased employment due to their great design versatility and also due to their various recurring advantages, widely discussed in the literature, such as low density [3,6]. The design flexibility characteristics of composites have led to the development of aerospace structures capable of delivering the best performance, adaptability, safety, and functionality possible. Recent examples of the use of composites in space applications include structural supercapacitors [7] and various structural components of reentry vehicles [8]. The environments found in space research pose numerous challenges to the various materials used in aerospace structures. For example, in the low Earth orbit region, satellites are exposed to high incidences of ultraviolet radiation (UV) and micrometeorite impacts [4,9,10,11]. Temperature variations and the presence of atomic oxygen can also affect the performance of materials and/or devices in a satellite [4,9,12]. In the environment of nearby celestial bodies, such as Mars, exposure to UV and also continuous exposure to winds and dust can cause deterioration of the properties of materials used in the structures of the various equipment being placed on the planet’s surface, as well as in future permanent installations. Indeed, prolonged exposure to UV radiation on the surface of Mars can cause structural changes even in rocks or minerals [13,14], and sandstorms with winds of up to 20 m/s have been recorded in the vicinity of the Perseverance rover [15].
UV radiation is known to be a factor that causes high degradation and, consequently, compromises the properties of polymers [12,16] and polymer composites [17,18]. The energy of UV radiation that reaches the Earth’s surface varies between 290 and 460 kJ/mol, equivalent to the energy required for the dissociation of covalent bonds in polymer molecules [19]. Consequently, there may be chain scission, formation of double bonds, or unwanted cross-links [16]. Another possible effect of UV degradation is the formation of microcracks on the surface of the material, contributing to lower mechanical resistance and a non-uniform distribution of thermal stresses in the thickness of the material [20,21].
Although the isolated effects of UV exposure and dust on the behavior of polymers and polymer composites are known, their combined effect is less studied. Thus, this work aims to analyze, as a novelty approach, the combined effects of exposure to UV radiation and damage caused by sandblasting on the mechanical performance of a hybrid composite of epoxy matrix reinforced with carbon and glass fibers in order to simulate service conditions both in low Earth orbit and in exoplanet environments.

2. Materials and Experimental Methods

2.1. Material

The material used in this work was a hybrid composite of epoxy matrix reinforced with carbon and glass fibers. The glass fiber layers are nominally arranged at ±45°, while the carbon fiber layers are placed in a 0/90° configuration. This laminate configuration was manufactured to be symmetrical, with the fiberglass layers placed outside, and also to simulate a quasi-isotropic configuration. Thus, the coupling matrix ([B]ij) is zero, and the coupling terms of the stretching ([A]ij) and bending ([D]ij) matrices are, ideally, zero [22]. The laminate was manufactured using a mixed compression molding/manual lay-up technique. The fiber layers were manually placed inside the mold cavity, and the resin was poured and spread with a roller. After lamination, and to control the thickness of the manufactured laminate, the mold, coated with high-density polyethylene that served as a mold release agent, was closed and placed in a hydraulic press under a pressure of 4 tons, being kept under this pressure for 24 h. The nominal fiber ratio in the composite was 30% carbon fibers/70% glass fibers.
From the composite plates received, flexural test specimens (length: L = 110 mm, width: w = 25.8 mm and thickness: d = 5.3 mm) and interlaminar shear (ILSS) test specimens (length: L = 40 mm, width: w = 12 mm and thickness: d = 5.3 mm) were machined.
The microstructure of the material was analyzed by optical microscopy using the standard sample preparation procedure. That is, a cross-sectional sample of the composite was embedded, sanded using 200, 400, 600, and 800 mesh sandpaper, and then polished with alumina (0.3 μm). A Zeiss AxioCAM ICC-1 (Carl Zeiss, Jena, Germany) optical microscope was used for microstructure analysis.

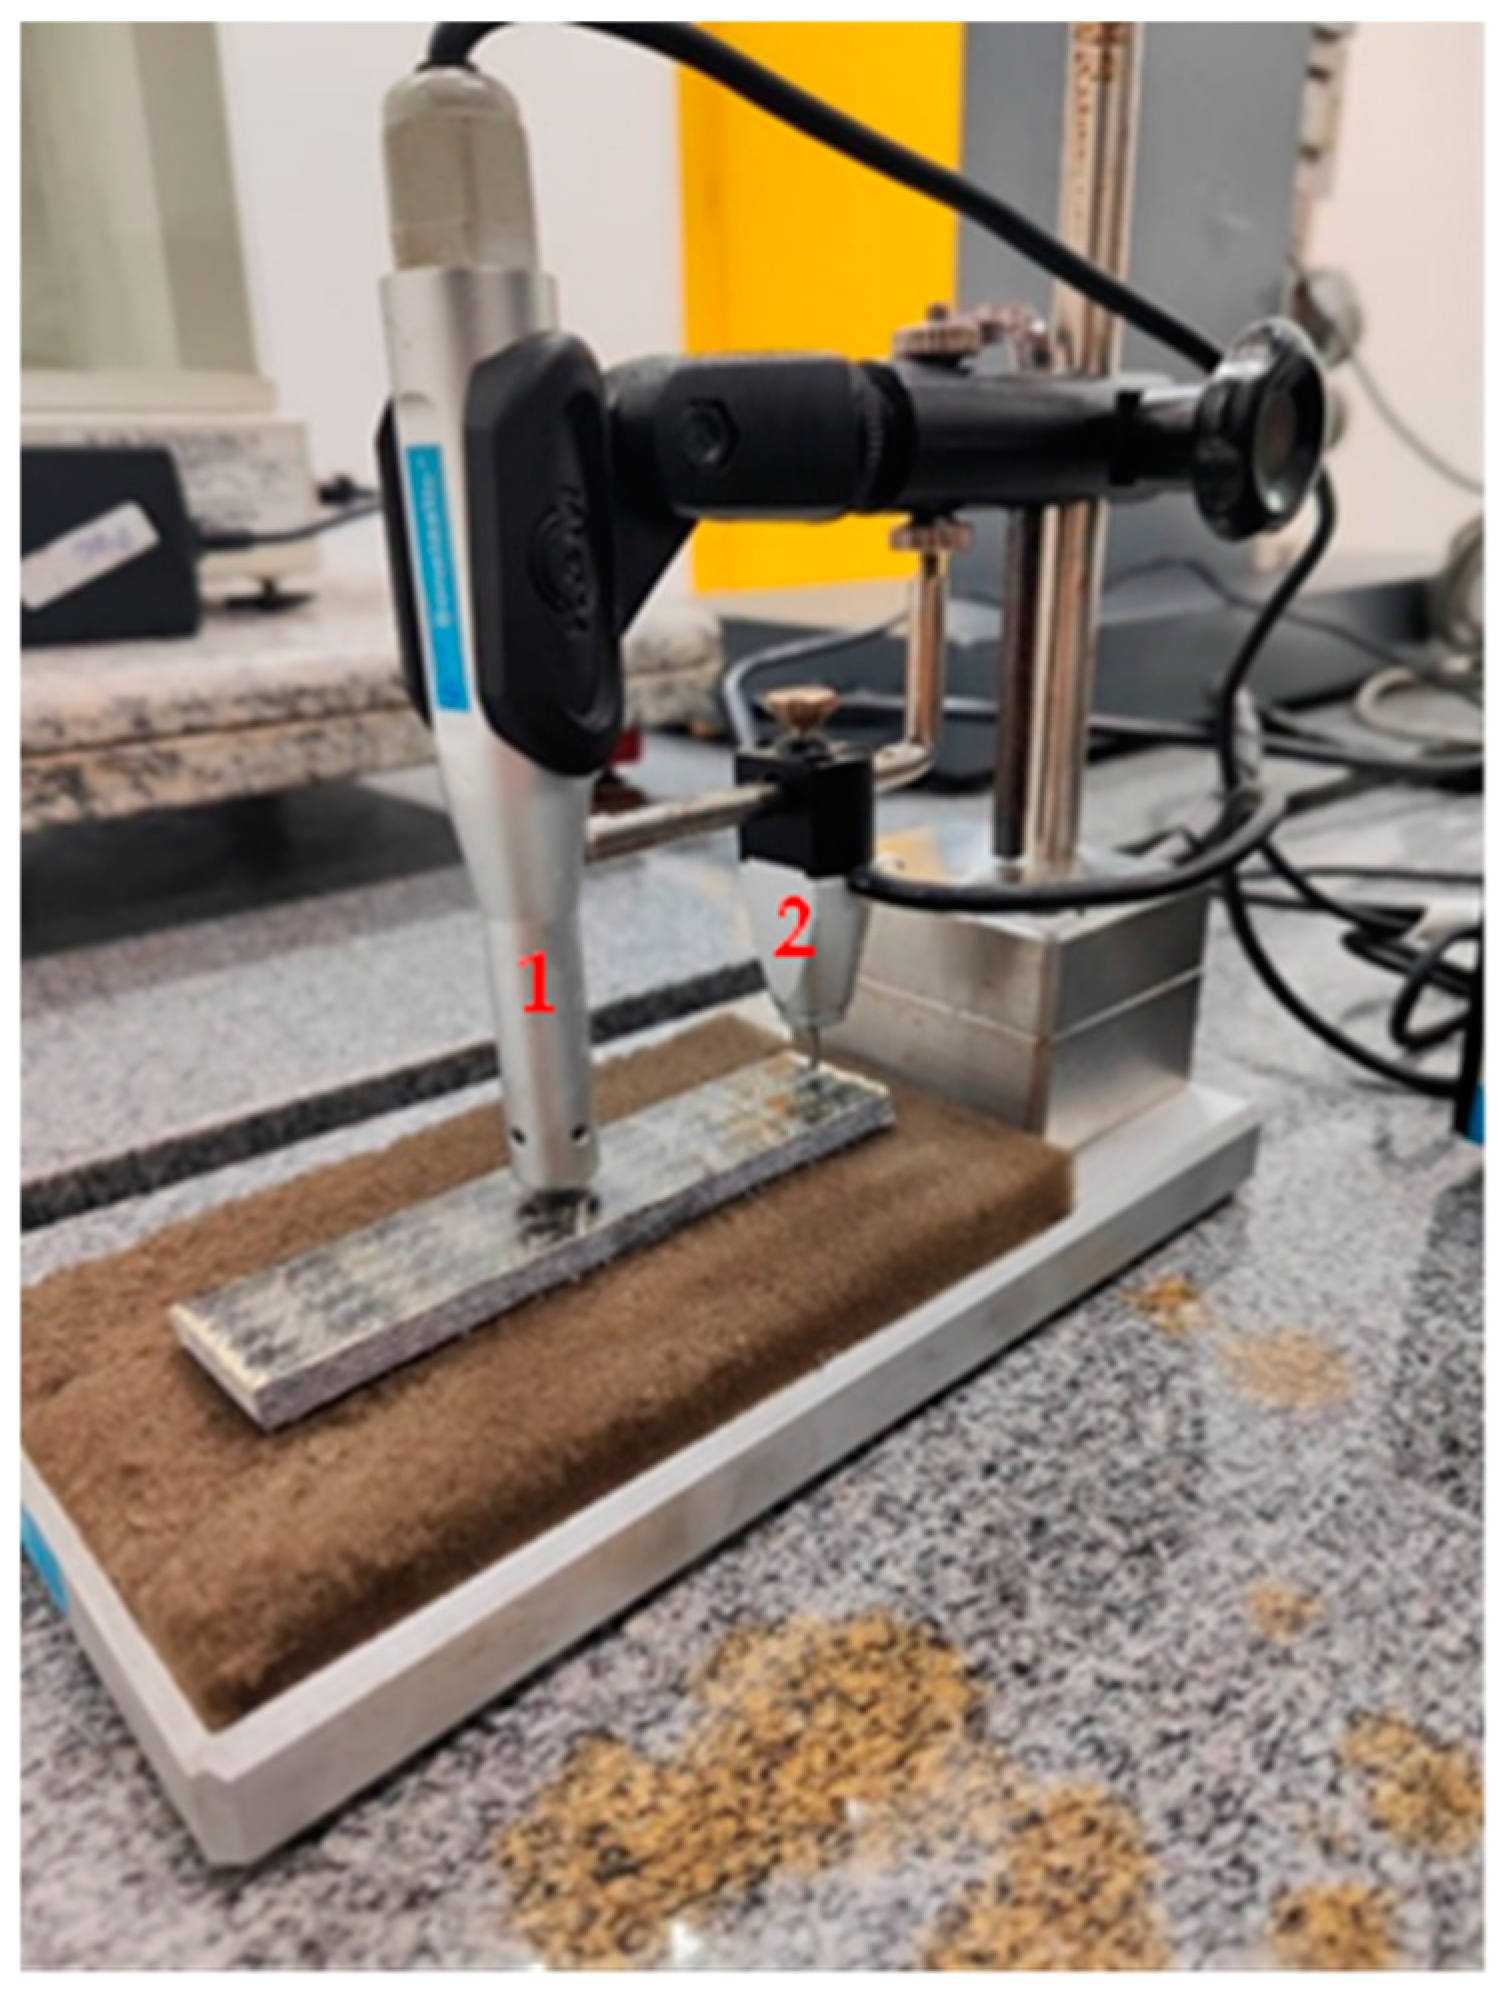
2.2. Aging, Damage Introduction and Characterization Methods

The flexural and ILSS test specimens were subjected to UV aging in two chambers using a lamp with a wavelength of 234 nm and a power of 8 W. The samples were exposed on only one side to simulate a real application situation for periods of 60, 120, and 180 days. The effect of UV exposure was analyzed by FT-IR in the mid-infrared range (400 and 4000 cm−1), with a resolution of 4 cm−1 and 32 scans. The samples were analyzed using a Bruker Alpha II spectrometer (Bruker Corporation, Billerica, MA, USA) using the Attenuated total reflectance (ATR) technique.
A qualitative analysis of the effect of UV was also performed by colorimetry. In the context of composite aging, analyzing changes in color due to exposure to different environmental conditions can contextualize changes in the physical and mechanical properties of the material [23]. Color readings were performed on both the surface and the side of the test specimens. The colorimeter used was the Delta Color 450 G (Delta Color, São Leopoldo, Brazil), with an analysis field opening of 4 mm, standard illuminant D65, and standard observer at 10°. Six measurements were taken at each analysis point (surface or side) for each specimen. The CIELAB system was used, which considers the colorimetric coordinates L*, a*, and b*; where L* is the luminosity, a* and b* represent, respectively, the spectrum between shades of red to green and yellow to blue. The color difference was quantified by the parameter ΔE*, which summarizes the difference between all the coordinates of the CIELAB system, namely [23]:
Δ E * = Δ L * 2 + Δ a * 2 + Δ b * 2   1 / 2
Due to the variation in color perception by the human eye, some intervals can be adopted to characterize the degree of color change; thus, if ΔE* < 1, the color change is not perceptible to human vision. For values between 1 < ΔE* < 3.3, only trained people can perceive it, and it is not noticed by the general public. For values of ΔE* > 3.3, the change becomes perceptible to the naked eye for any individual [24].
Flexural test specimens were sandblasted on the surface exposed to UV to simulate the surface damage process of composites by external factors, such as erosion and abrasion due to exposure of the composite to a continuous flow of wind with sand. The blasting was carried out in the mid-section of the length of the flexural specimen. The specimens were blasted using the Peenmatic Micro 750S (Iepco Ag, Leuggern, Switzerland) equipment using silicon dioxide as the blasting agent for 2 min, under an outtake pressure of 3.2 bar. This time was chosen experimentally to simulate surface abrasion/erosion and generate damage similar to that reported by micrometeorite impacts [25] or due to continued abrasion [26,27]. The particle size of silicon dioxide was determined using the Malvern Morphology 4-particle analyzer (Malvern Panalytical Ltd, Malvern, UK). The particles were pulverized and dispersed on a slide and were analyzed to obtain their size distribution. The number of particles analyzed was 86,183.
The damage caused by sandblasting was assessed using the technique of reconstruction of individual images obtained by a motorized optical microscope (AxioImager.M2m, (Carl Zeiss, Jena, Germany)), which has controlled movement with respect to the x–y–z axes. Images were captured at several z-axis positions, but since optical microscopes have a low depth of focus, focus is only obtained at specific points, not for the entire surface. However, by controlling the z-axis movement, it is possible to obtain in-focus images of these small portions at various z-axis positions. A 3D representation of the surface topography is then obtained by assembling several individual images using image analysis techniques. Therefore, an image gathering all in-focus regions is obtained. A detailed explanation of the method is described elsewhere [28]. This image acquisition procedure was performed on 10 samples and was carried out using a lens with 5× magnification.
From the topographic image obtained, where the shades of gray represent height differences on the analyzed surface, roughness parameters were calculated in accordance with ISO 21920-2:2021 [29]. The parameters determined in this work were: (i) Rv, which represents the depth of the deepest valley (difference between the average height of the surface and the deepest valley); (ii) Rp, which represents the height of the highest peak (difference between the height of the highest peak and the average height of the surface); (iii) Rt, which represents the difference in total height of the texture, indicating the value of the maximum depth caused by blasting. These are amplitude parameters, which are related to the extreme characteristics of the profile [30,31].
The combined effect of UV exposure and the presence of damage caused by sandblasting, as well as the influence caused by exposure time, was analyzed by combining these effects, as shown in Table 1.

2.3. Mechanical Tests

Mechanical bending and interlaminar shear (ILSS) tests were performed on the composites as manufactured and after aging. Both tests were performed on an MTS 810 equipment (MTS Systems, Eden Prairie, MN, USA) with a 5 kN load cell. The 3-point bending tests were performed according to ASTM D790 standard [32] at a test speed of 3 mm/min. The span (L) used was 86 mm, so the L/d ratio was equal to 16, as specified in the standard. Ten specimens were tested per experimental condition. ILSS tests were performed according to ASTM D2344 [33] on the as-manufactured composites and on those subjected only to UV aging; due to the ILSS specimen’s dimension, locating the blast damage was impossible. Fifteen samples were tested per experimental condition at a loading rate of 1 mm/min, using a span of 30 mm.

2.4. Non-Destructive Test

Before the destructive mechanical tests, the flexural specimens were analyzed using the non-destructive impulse excitation technique to analyze possible variations in the modulus of elasticity and damping factor due to aging/introduction of damage. The sonic test was performed using an electret microphone with a detection range from 0.5 to 20 kHz and an acquisition time of 0.6 s. A light actuator strikes the specimen surface every 30 s, and the generated signal is then processed by means of dedicated software (Sonelastic® (Sonelastic, Ribeirão Preto, Brazil)). Both the Young’s modulus and the damping factor are calculated automatically, following the procedures described by ASTM E 1876 [34]. The results reported are the average of 40 measurements. The test setup used is shown in Figure 1, where the relative position between the actuator and the microphone corresponds to the flexural-torsional boundary condition [35].

3. Results and Discussion

3.1. Characterization of Silica Particles

The analysis of the size of the silica used in the sandblasting/surface erosion process showed an average equivalent diameter of 2.39 μm, with particles ranging from 0.91 μm to 224.69 μm, with 90% of the particles having less than 3.13 μm in equivalent diameter. Although several studies report a wide range of values for the size of dust particles in the Martian atmosphere [36,37,38], the result obtained is consistent with the size of dust particles in the Martian environment. Values between <1 μm to 50–100 μm have been reported as present in the Martian atmosphere [39,40]. But are the smaller particles, ranging from approximately 1–5 µm in diameter, that can remain suspended for a long time [37,40]. It is, therefore expected that these particles are the ones that can cause the most damage to materials on the planet’s surface.

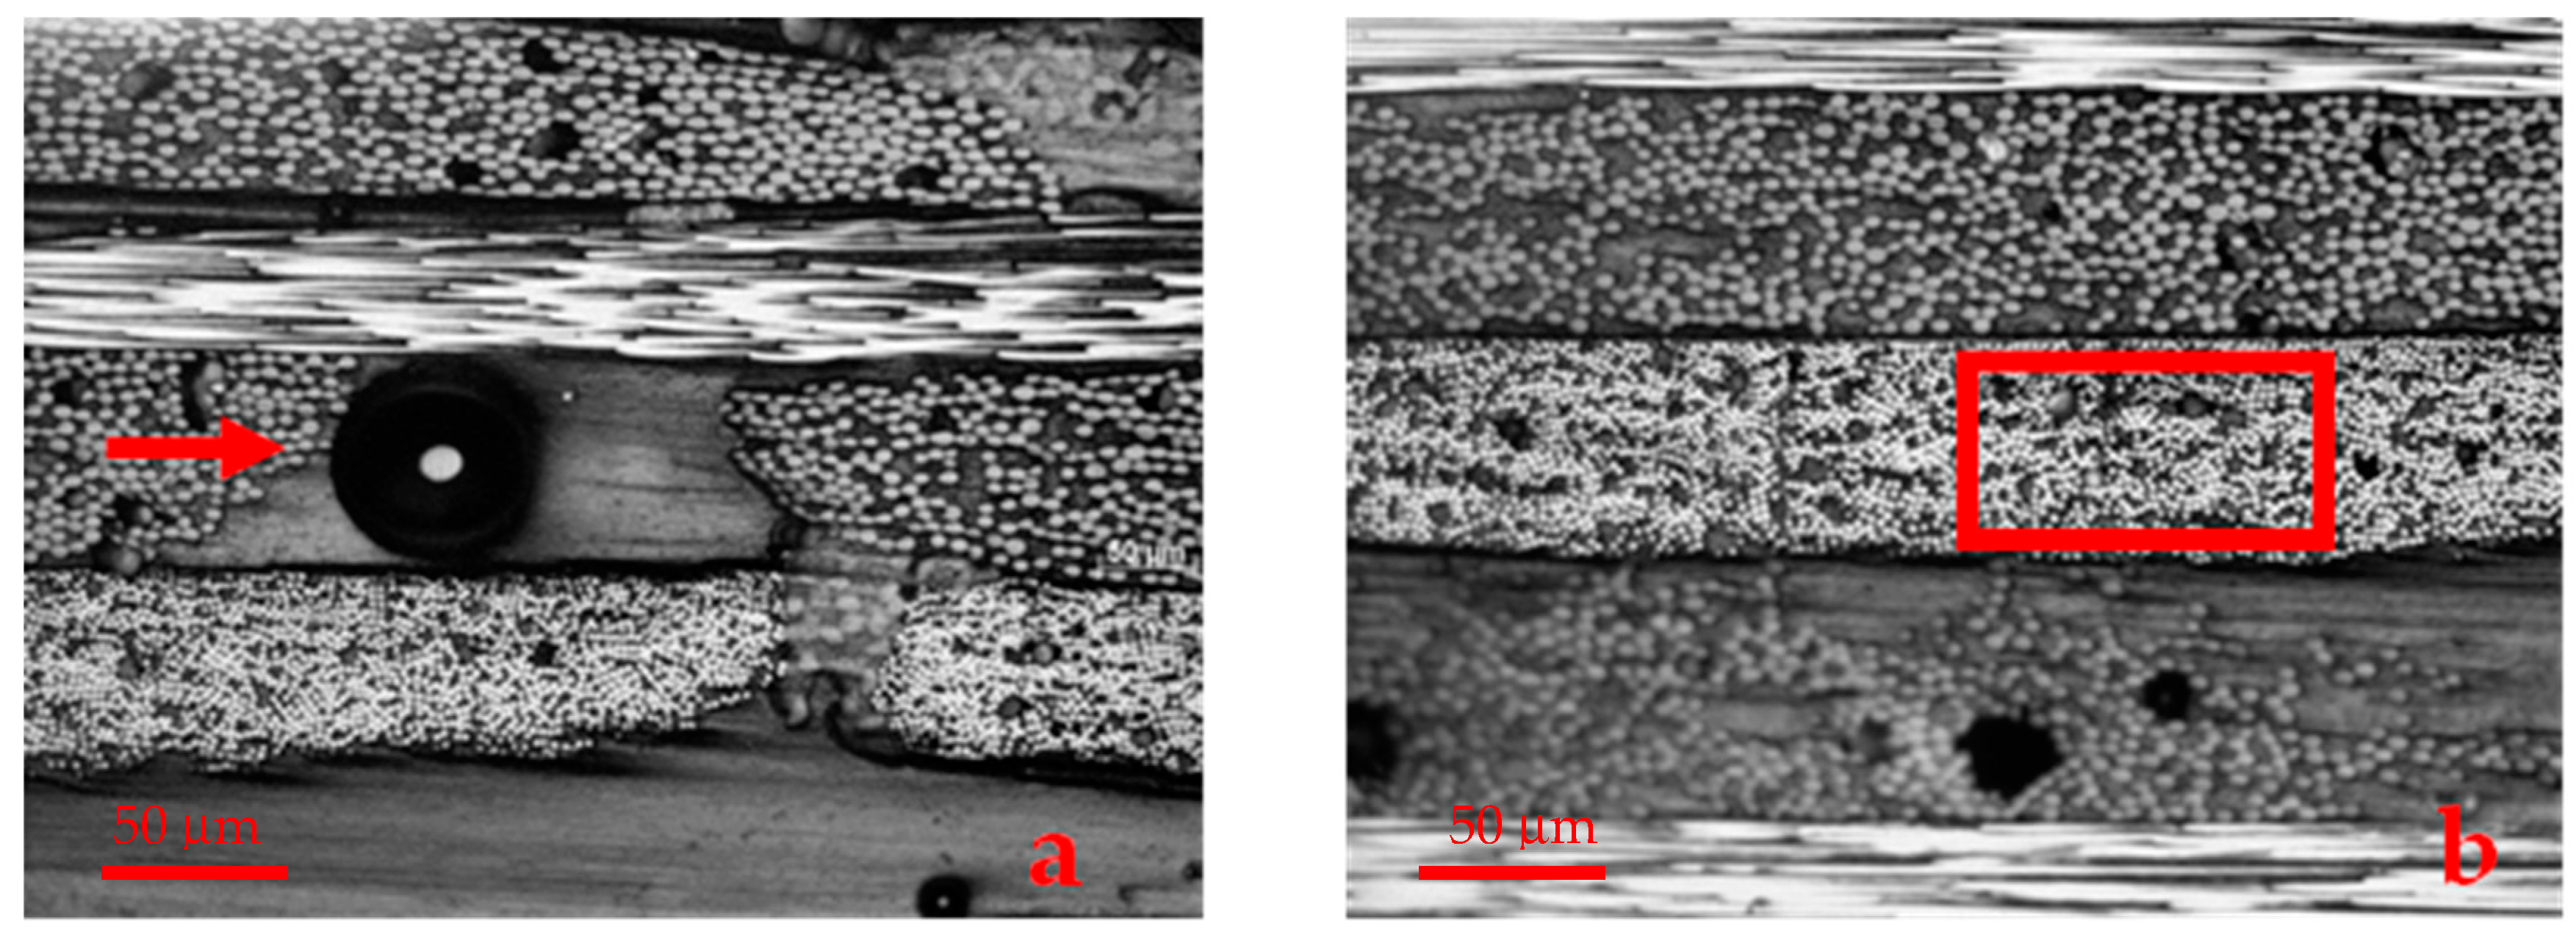
3.2. Microstructural Characterization of the Composite

Figure 2 shows a representative region of the microstructure of the composite used in this work. It is possible to observe the presence of pores in the matrix-rich regions (Figure 2a), as well as voids due to lack of impregnation in the fiber layers (Figure 2b).

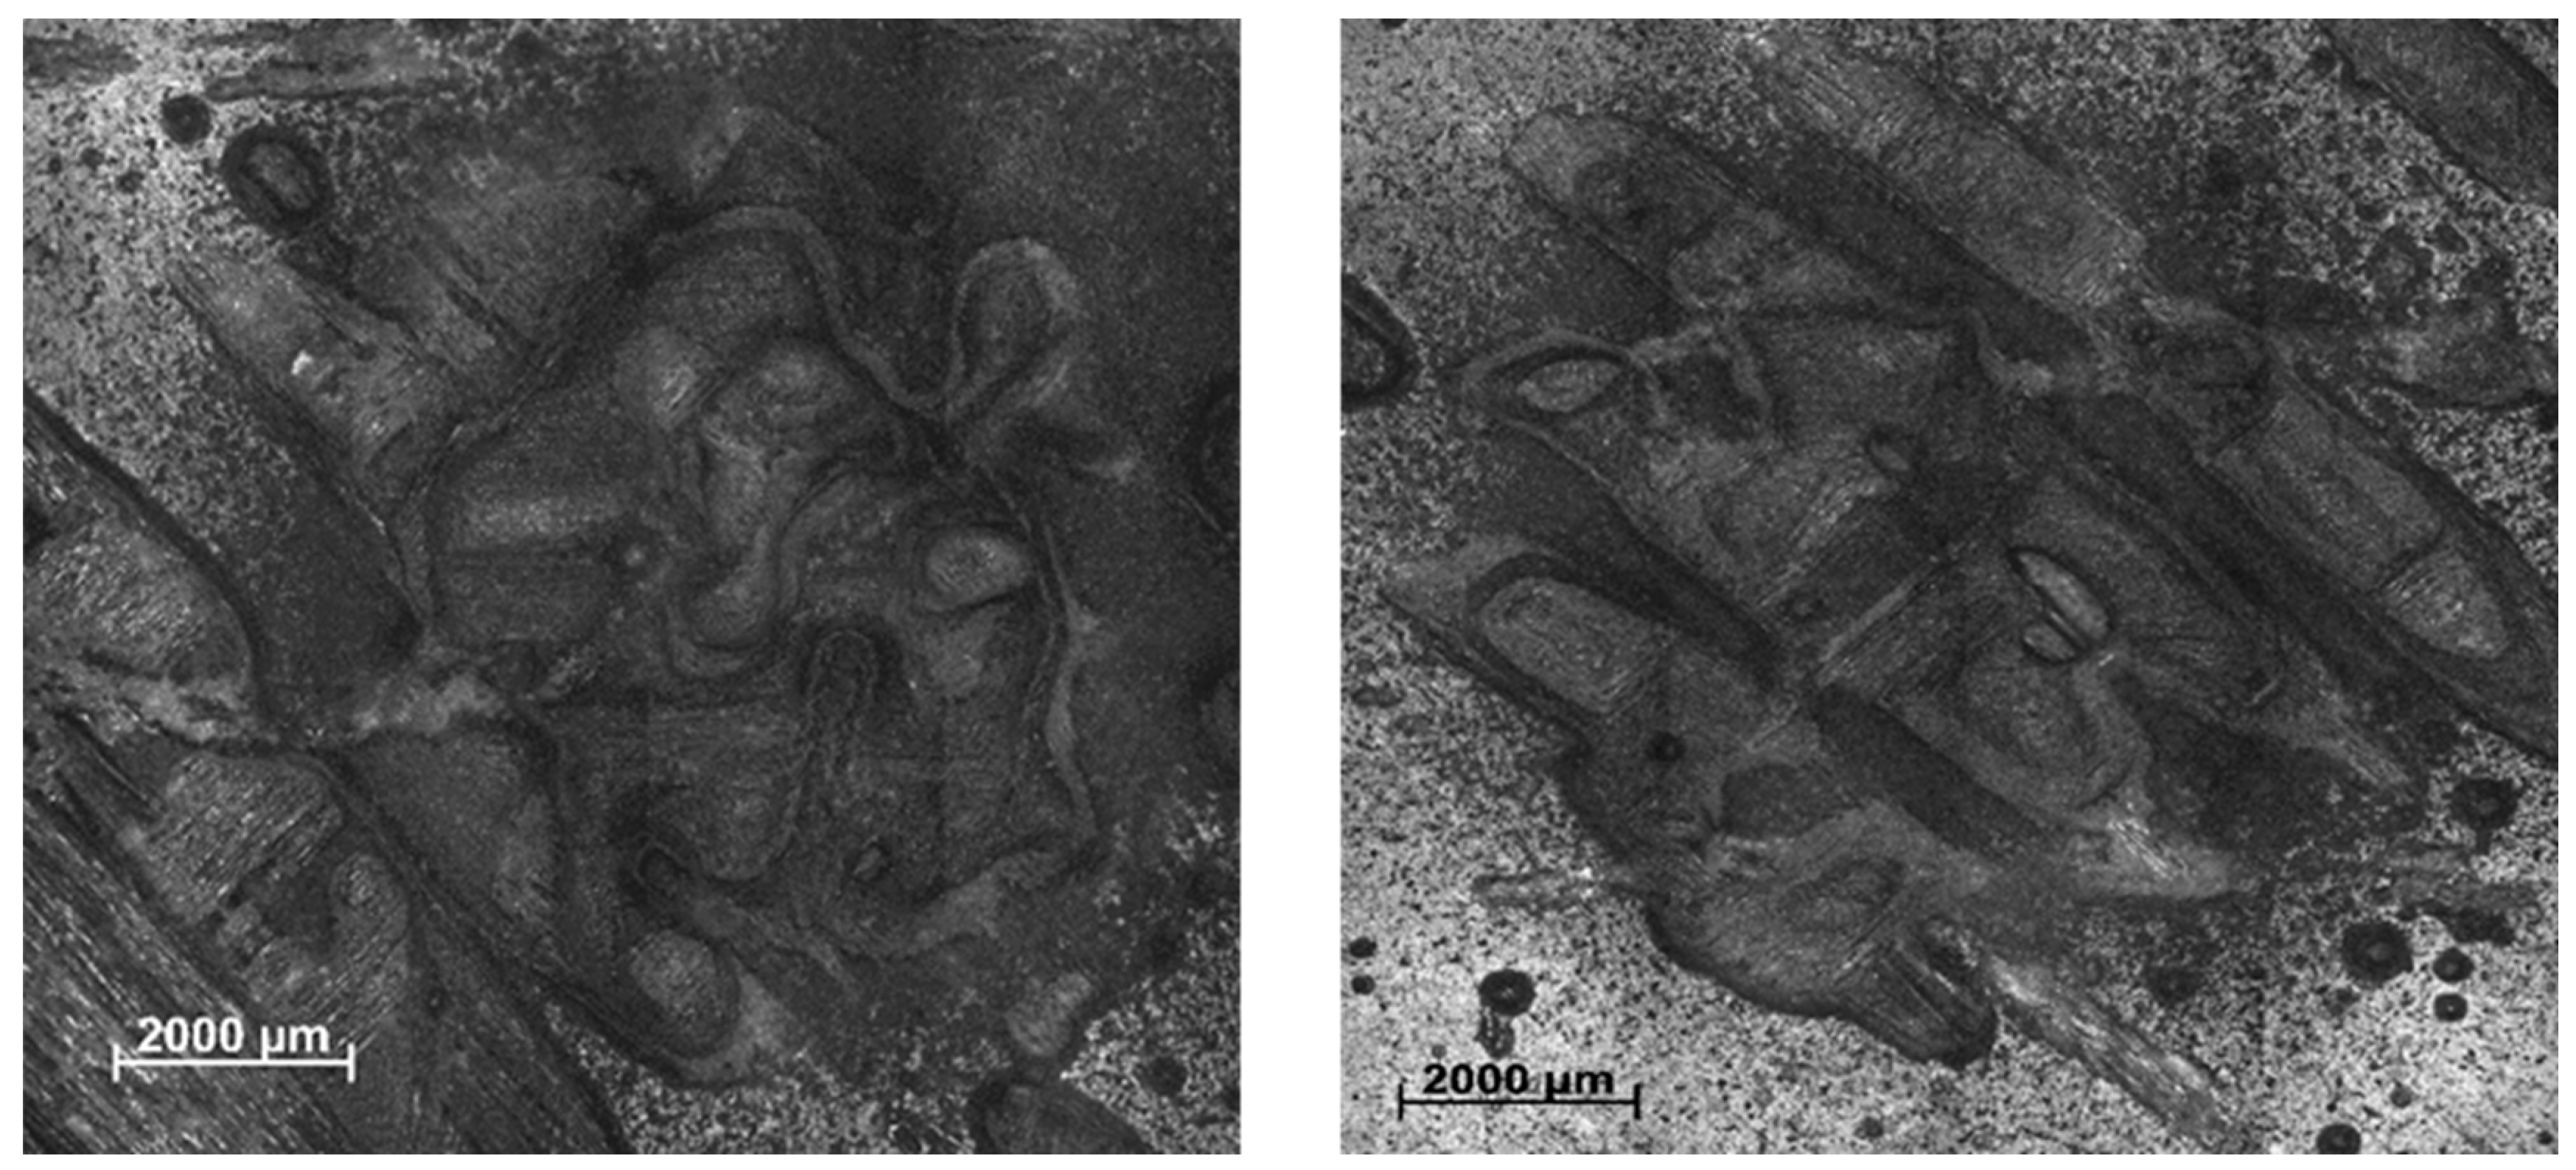
3.3. Characterization of Surface Damage Caused by Sandblasting
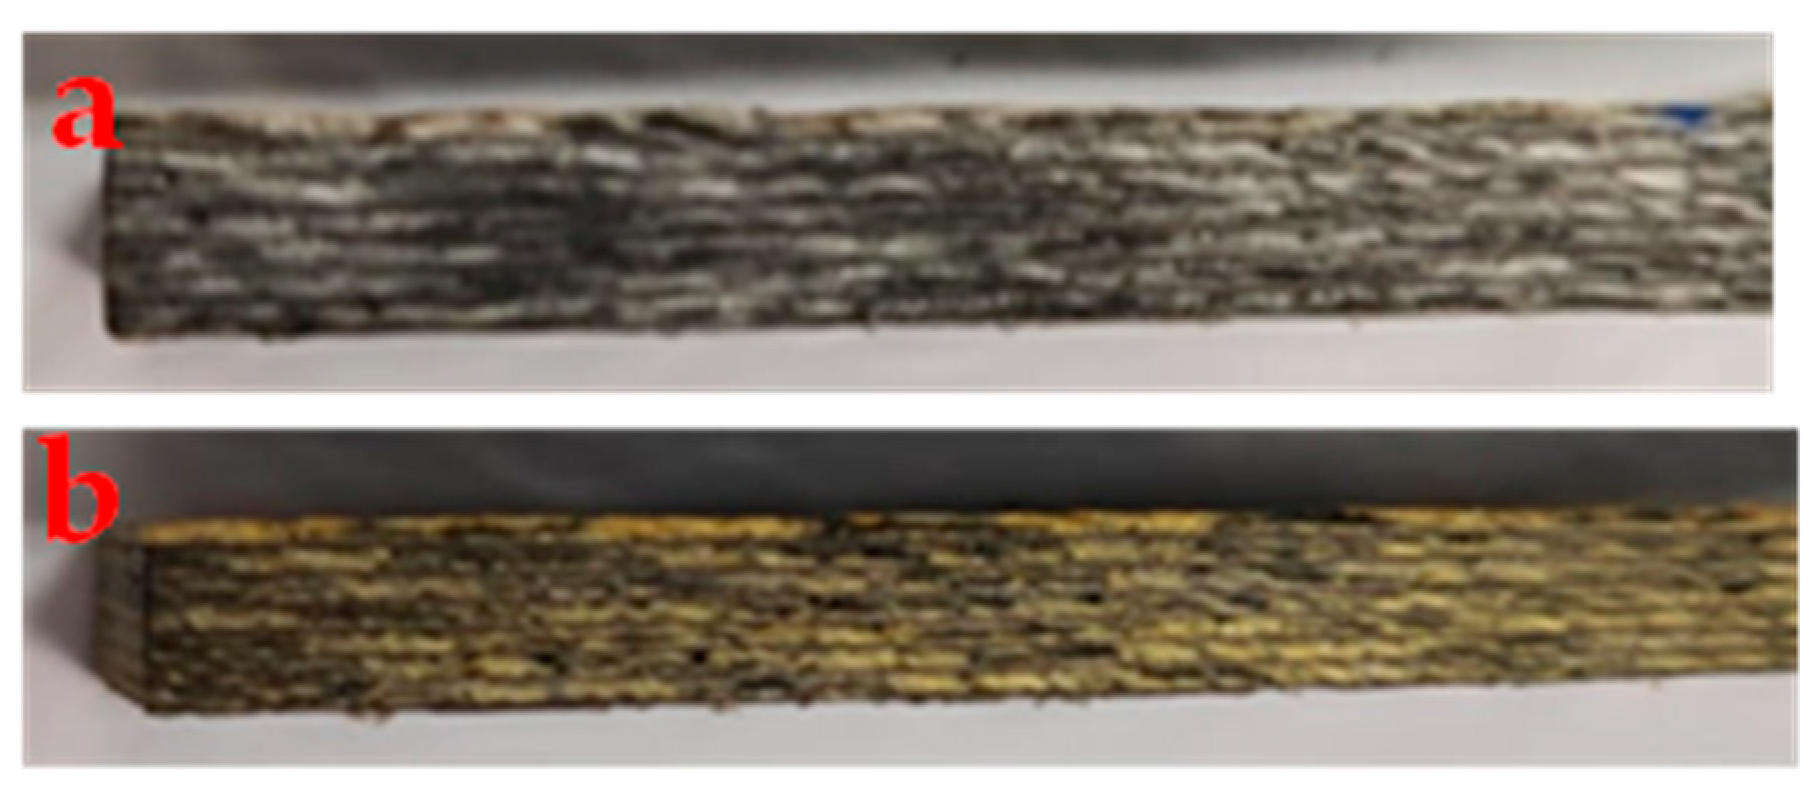
The surface of the sandblasted samples was evaluated to determine the type and depth of damage caused by sandblasting. Figure 3 shows, as an example, two sandblasted surfaces. It can be seen that the damage caused does not have a defined shape, and the sandblasted area has different depths. This type of defect, where an indentation and the ejection of the material around it are observed, is characteristic of low-energy impacts, such as those simulated in this work [41].
The parameters that characterize the topography of the sandblasted surfaces, obtained by reconstructing the images, are listed in Table 2. The Pt value, which indicates the average wear depth, is in agreement with the values reported in the literature. For example, tests simulating the effects of LEO report the depth caused by micrometeorites as 2.5 mm in CRFPs [42], while impactors with circular surfaces can cause defects with depths ranging from 0.100 to 0.499 mm, depending on the impact velocity [43] or from 0.12 to 1.32 mm depending on the fiber array [44].

3.4. Colorimetry

Table 3 shows the results of the colorimetric analysis of the composites before and after aging. The values of the variations in the color parameters, as well as the parameter ΔE* (Equation (1)), which defines whether the color change is noticeable or not, are listed in Table 4.
From the ΔE* results, it can be seen that the color change is noticeable to the naked eye for all aging times since ΔE* > 3.3. Furthermore, since the difference in luminosity (∆L*) was positive, this indicates that the aged samples are becoming lighter than the as-manufactured samples. The variations of ∆a* and ∆b* indicate, respectively, that the samples are becoming greener and more yellowish [45]. An example of the color change is shown in Figure 4. Yellowing is characteristic of photo-oxidation processes caused by UV radiation [18,46].

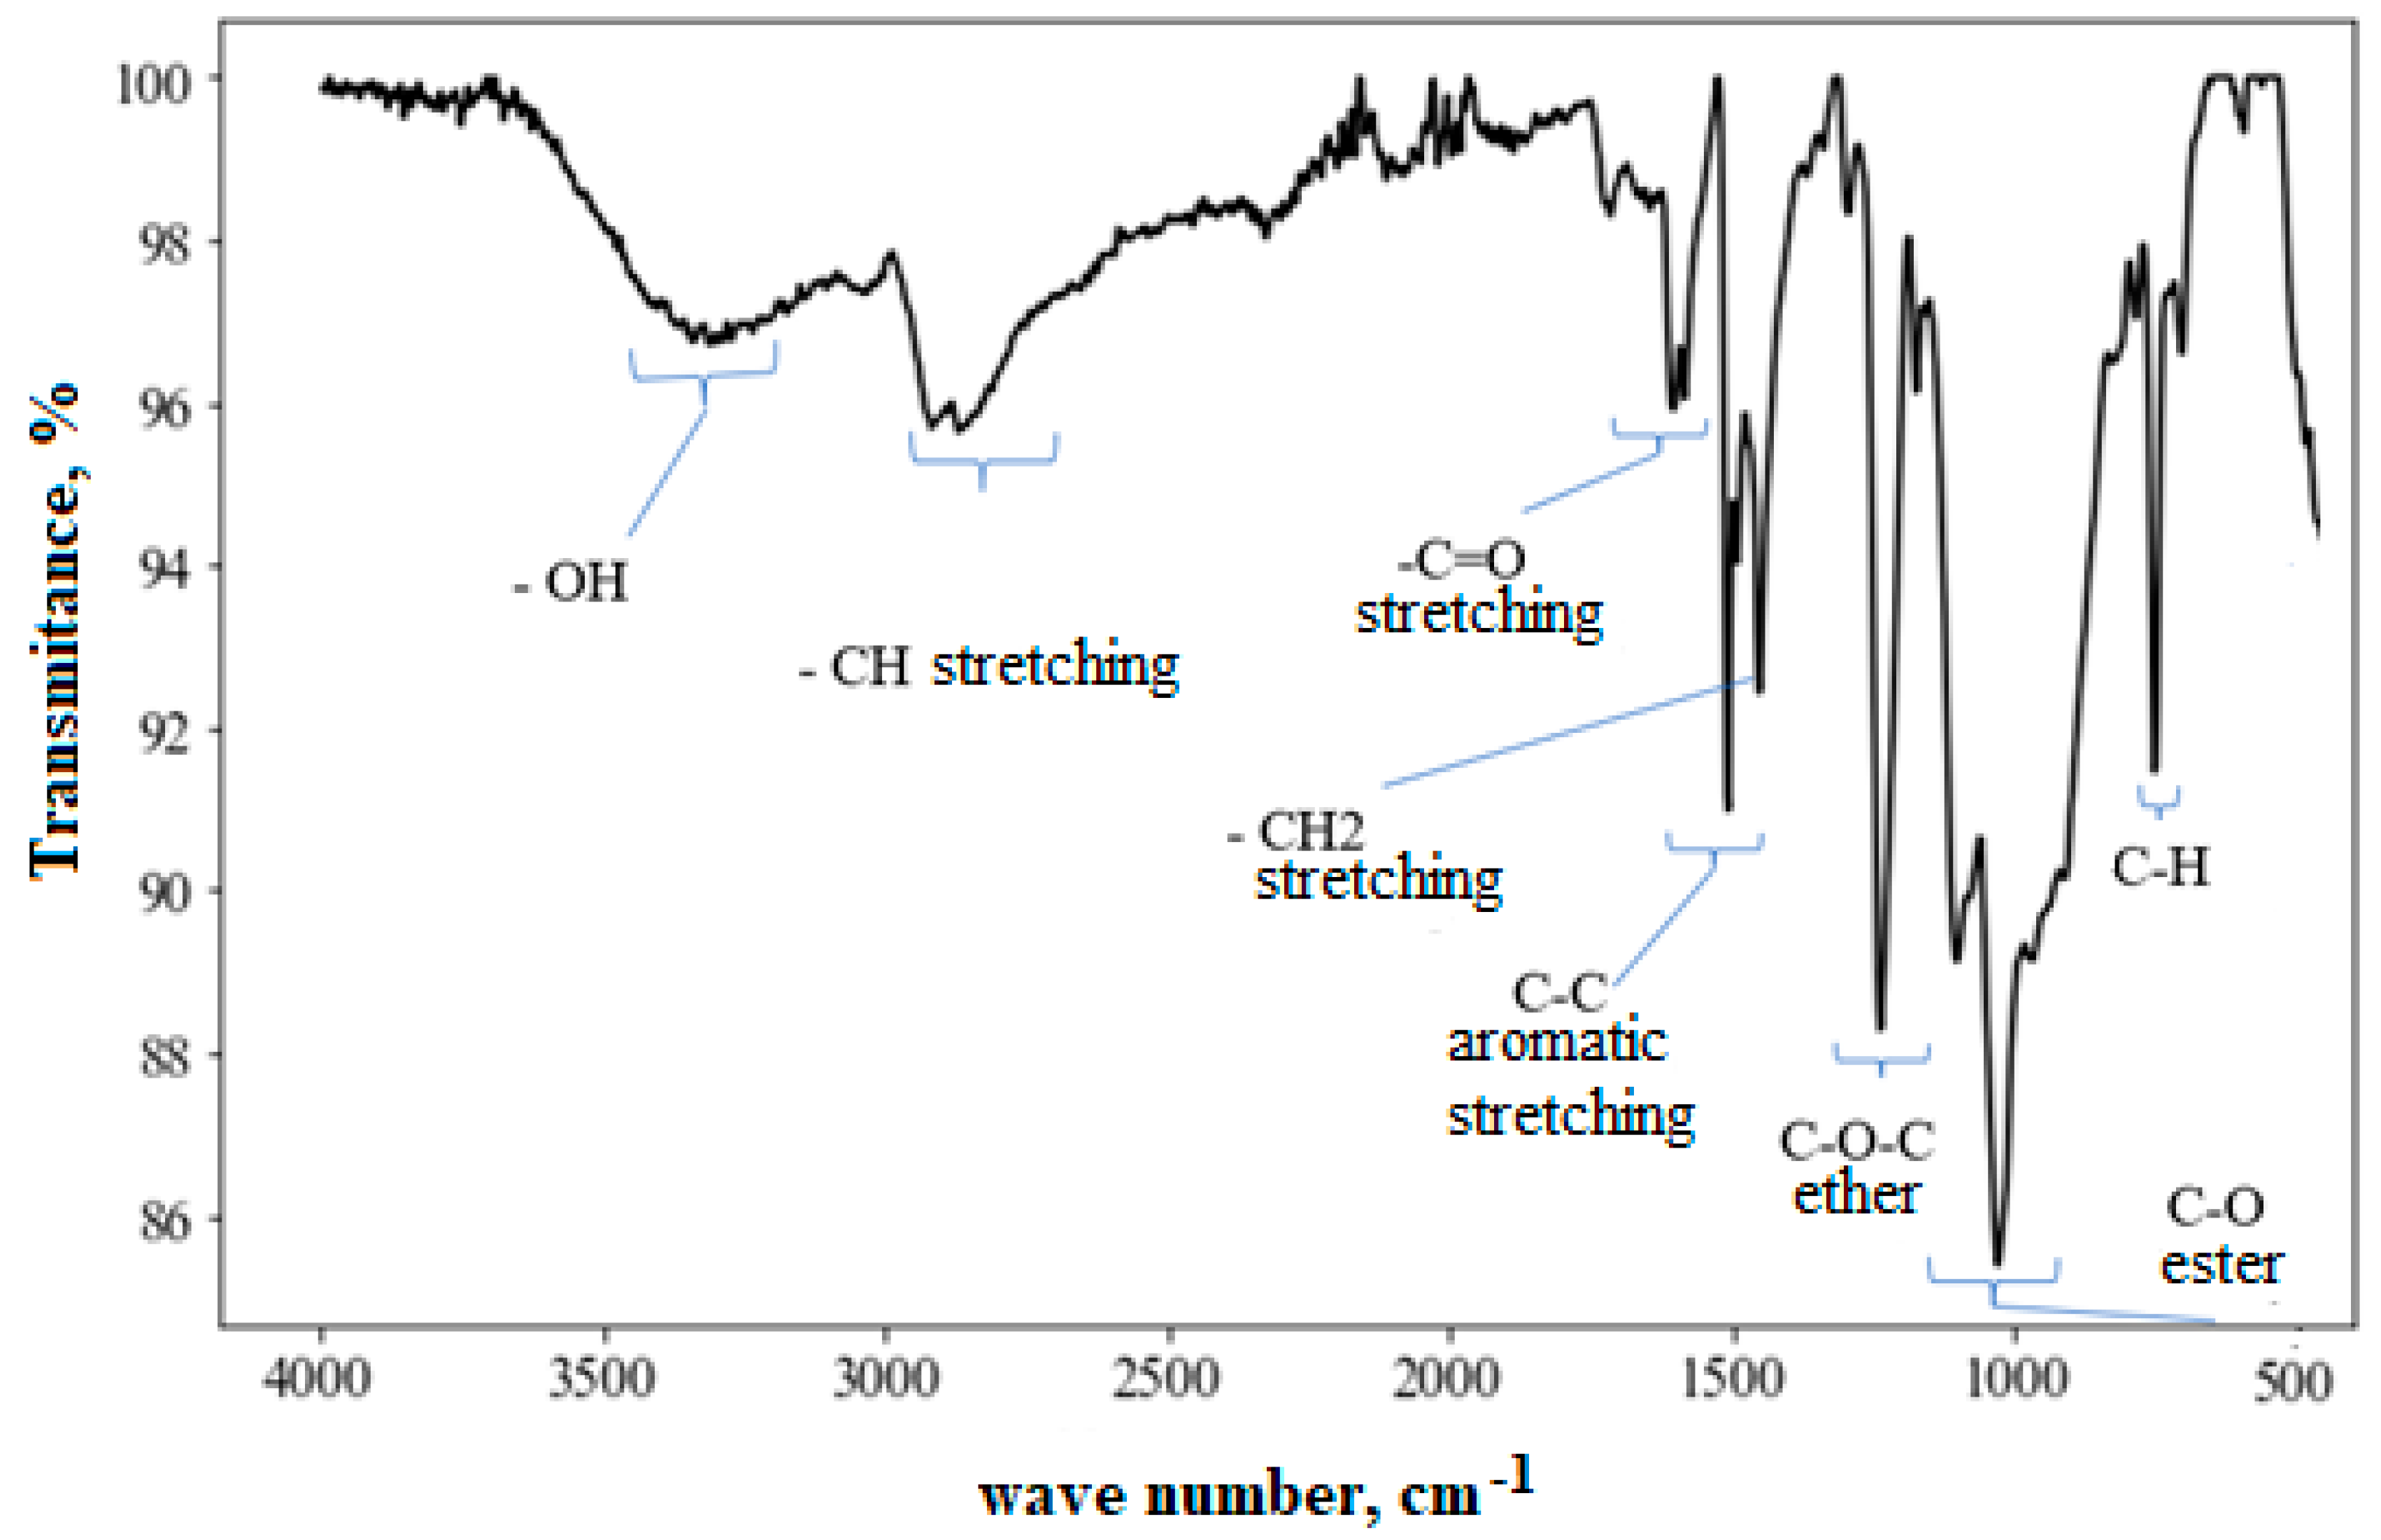
3.5. Infrared Analysis (FTIR)

The FTIR spectrum of the as-fabricated composite is shown in Figure 5 and is in agreement with the spectra of tetraglycidyldiamino-diphenylmethane (TGDDM) epoxy resins reported in the literature [47]. One can observe the bands corresponding to C-C bonds between 1500–1450 cm−1 and C-H bonds between 800–700 cm−1, corresponding to aromatic rings [48]. In addition, between 2850–3000 cm−1, the presence of the C-H bond (of aliphatic hydrocarbon) is observed, in the range of 1750–1680 cm−1 the C=O bond (carbonyl), between 1300–1200 cm−1 C-O-C bonds (ethers) and in the range of 1100–1000 cm−1 C-O bonds (esters). It is also possible to notice the presence of -OH in the range of 3400–3200 cm−1 due to the absorption of moisture from the environment or from the hydroxyl groups present in the epoxy resin molecule.
The spectra of samples aged for up to 180 days did not show the appearance of new bands. However, there was a change in the relative height of the carbonyl band, which is a possible consequence of the effect of UV aging [46,49], which agrees with the color change determined by colorimetry (Figure 4). For the unaged material, the ratio between the carbonyl band and the C-C bond of the aromatic ring was 0.44, increasing to 0.68 to 0.75 for aging times of 60 to 120 days and reaching 1.14 for aging after 180 days.

3.6. Mechanical Behavior

3.6.1. ILSS

The results of interlaminar shear strength are shown in Table 5. The samples aged for 60 days show a statistically significant reduction in relation to the material without aging (p-value = 0.009) and also in relation to the composites aged for 120 (p-value = 0.008) and 180 days (p-value = 0.021). On the other hand, the values of the samples without aging and aged for 120 and 180 days are statistically equal (p-value > 0.05). As previously discussed, UV radiation initially causes deterioration on the surface of the material [20,21,50]. Therefore, any increase in shear strength with increasing exposure time would not be expected but rather a continuous decrease or an initial decrease, followed by stabilization. The result obtained for the material aged for 60 days can be attributed to the lack of microstructural homogeneity of the composite, as highlighted in Figure 2. In fact, considering the values obtained for 120 and 180 days in relation to the material as manufactured, it can be stated that there was no effect of UV radiation on the interlaminar shear strength at the analysis time used in this work. The failure mode presented by the specimens corroborates this approach because, both before and after aging, it was of the inelastic deformation type, which indicates that there is uniform deformation throughout the material [51]. An example of the failure mode observed is shown in Figure 6.
These results agree with the work of Shin et al. [52], who observed that the interlaminar shear strength of carbon-epoxy composites remained constant after long cycles of LEO simulation with UV exposure. Furthermore, it was also observed that the fracture mode of carbon/epoxy and glass/epoxy composites subjected to 6 months of aging with UV exposure did not change compared to the fracture mode of the unaged material [53].

3.6.2. Bending: Impulse Excitation Test

The results of the non-destructive impulse excitation test comparing the as-manufactured material and the UV-aged but non-sandblasted samples are shown in Table 6. By analyzing the coefficients of variation (CV), it is possible to observe that there is an increase in the dispersion of the values of the aged samples in relation to the non-aged ones. Figure 7 shows the results graphically, where it is possible to clearly see the increase in the dispersion of the values with UV exposure. Due to the high dispersion of the results, it can only be stated that there is a tendency for the elastic modulus value to decrease with aging time, but the values are statistically equal. The increase in dispersion indicates, however, that damage is being generated by the exposure of the material to UV, interfering with the propagation of sound waves [35]. On the other hand, it is observed that the median of the material without aging is higher than the medians of the aged groups as a consequence of the deleterious effect of UV radiation, in agreement with what was reported in previous works [20,46,50,54].
Table 7 presents the mean values, median, and standard deviations for the modulus of elasticity of the samples that were only sandblasted and those with the combined effects of UV aging and sandblasting, as per Table 1. From these results, it is possible to observe a behavior similar to the behavior observed for the composites only subjected to UV aging (Figure 7). This means that there was an increase in the dispersion of the experimental results for all UV aging conditions, with the exception of one; the mean values are statistically equal, and there is a reduction in the median of the aged specimens in relation to the specimens that were only sandblasted. These results seem to indicate that UV exposure, regardless of whether or not it was preceded by sandblasting, was the preponderant effect under the experimental conditions of this work. This result agrees with previous studies, which identified UV exposure as having the most significant effect on the flexural and fatigue strength [55] and impact strength [56] of glass/epoxy composites.

3.6.3. Bending: Three-Point Bending

Table 8 presents the values of the average values and standard deviations of the modulus of elasticity and the flexural rupture stress of the samples without aging and aged by UV as a function of the exposure time. The results obtained are statistically equal, similar to the results obtained for the modulus of elasticity by the impulse excitation test (Table 6).
Two observations can be made regarding the modulus of elasticity when comparing the results in Table 6 and Table 8. First, the values obtained in the flexural test are approximately 20% lower than those obtained in the impulse excitation test. This difference is due to the elastic contribution of the test equipment in measuring the modulus of elasticity when an instrumented test is not performed [57]. Furthermore, although for both tests it can be stated that UV aging did not cause a significant effect on the rigidity of the material, the impulse excitation test showed greater sensitivity, indicating a possible decrease in values as a function of the exposure time. This difference is directly linked to the fact that in the impulse excitation test, any defect generated in the polymer matrix will interfere with the propagation of sound waves, while in the mechanical test, the influence of the matrix on the measurement of mechanical properties is less than that of the fibers. It is important to remember here that UV radiation will initially affect mainly the surface of the material [53]. In other words, there will be a greater effect on the matrix than on the fibers.
The flexural test results of the sandblasted and UV-aged samples are listed in Table 9. The elastic modulus values were similar to those of the samples that were only UV-aged (Table 8). This result indicates that sandblasting did not significantly affect the elastic response of the material, although there was an increase in the dispersion of the results, as observed by the increase in the coefficient of variance values, except for sample #1. This result is directly linked to the fact that both sandblasting and UV-caused defects on the surface of the composite mainly affect the polymer matrix. Since the modulus of elasticity of a composite with glass and/or carbon fibers is a fiber-dominated property, the damage was not sufficient to deteriorate the stiffness of the material. In fact, several studies show that even when there are large delaminations in laminated composites, stiffness is little affected as long as the fibers remain intact or little damaged [22,58].
Regarding flexural strength, there was a reduction in value in relation to the as-manufactured material (Table 8), with the exception of sample #4. It is important to highlight that this sample was the only one in which blasting was performed before UV aging, as listed in Table 1. This behavior seems to indicate that the surface deterioration caused by UV exposure causes a synergistic effect that increases the deterioration of the material when subsequently subjected to sandblasting.

4. Conclusions

In this work, the combined effects of UV radiation and particle abrasion on the interlaminar shear strength and flexural behavior of hybrid composites with an epoxy matrix reinforced by glass and carbon fibers were analyzed as a function of the aging time. The results obtained showed that:
  • During the analysis period used in this study (180 days), the damage caused by UV radiation in the epoxy matrix was restricted to the outer layers of the composite. Therefore, the interlaminar shear strength, therefore, was not affected by UV radiation since this parameter reflects the shear response of the internal layers of a composite.
  • The flexural behavior showed that UV exposure caused a greater effect than sandblasting. Thus, samples that were first exposed to UV and then sandblasted showed the greatest drop in flexural strength. This behavior was attributed to the deterioration of the surface layer by the action of UV, which led to a greater ejection of material from the composite when sandblasted.
From an operational point of view, the results obtained showed that UV protection, either through the use of additives in the polymer matrix or through an external layer of UV-absorbing material, is a key point in maintaining the structural integrity of polymer composites for application in satellites in low Earth orbit and also in exoplanet environments. This protection against UV effects appears to be even more relevant than extra protection against particle abrasion. Of course, it will be necessary to extend the period of exposure to UV rays for longer periods in order to have a better understanding of the effects of long-term degradation in real service situations.

Author Contributions

Conceptualization, J.R.M.d.; Validation, M.d.V.P.H.T.; Investigation, M.d.V.P.H.T.; Data curation, M.d.V.P.H.T.; Writing—review an editing, J.R.M.d.; Supervision, J.R.M.d.; Funding acquisition, J.R.M.d. All authors have read and agreed to the published version of the manuscript.

Funding

This research received no external funding.

Institutional Review Board Statement

Not applicable.

Data Availability Statement

Data is contained within the article.

Acknowledgments

The authors are grateful for the financial support of the CNPq (Grant number: 307363/2018-0) and CAPES (Finance code: 001) agencies.

Conflicts of Interest

The authors declare no conflict of interest.

References

  1. Vieira, P.S.C.; da Silva, G.A.S.; Lopes, B.J.; d’Almeida, J.R.M.; da Silva, A.H.; Cardoso, D.C.T. Hygrothermal aging of steel/FRP pipe repair systems: A literature review. Int. J. Press. Vessel. Pip. 2023, 201, 104881. [Google Scholar] [CrossRef]
  2. Barile, C.; Casavola, C.; de Cillis, F. Mechanical comparison of new composite materials for aerospace applications. Compos. Part B Eng. 2019, 162, 122–128. [Google Scholar] [CrossRef]
  3. Ince, J.C.; Peerzada, M.; Mathews, L.D.; Pai, A.R.; Al, A.; Abbasi, S.; Yin, Y.; Hameed, N.; Duffy, A.R.; Lau, A.K.; et al. Overview of emerging hybrid and composite materials for space applications. Adv. Compos. Hybrid Mater. 2023, 6, 130. [Google Scholar] [CrossRef]
  4. Gordo, P.; Frederico, T.; Melicio, R.; Duzellier, S.; Amorim, A. System for space materials evaluation in LEO environment. Adv. Space Res. 2020, 66, 307–320. [Google Scholar] [CrossRef]
  5. Shekar, R.I.; Rao, P.M.D.; Siddaramaiah; Padaki, V.C.; Kim, N.H.; Lee, J.H. Fibre-fibre hybrid composites for aerospace applications. Adv. Mater. Res. 2010, 123–125, 1231–1234. [Google Scholar] [CrossRef]
  6. Liu, N.; Ma, B.; Liu, F.; Huang, W.; Xu, B.; Qu, L.; Yang, Y. Progress in research on composite cryogenic propellant tank for large aerospace vehicles. Compos. Part A Appl. Sci. Manuf. 2021, 143, 106297. [Google Scholar] [CrossRef]
  7. Shirshova, N.; Qian, H.; Shaffer, M.S.; Steinke, J.H.; Greenhalgh, E.S.; Curtis, P.T.; Kucernak, A.; Bismarck, A. Structural composite supercapacitors. Compos. Part A: Appl. Sci. Manuf. 2013, 46, 96–107. [Google Scholar] [CrossRef]
  8. Yang, Z.; Zhang, D.; Gu, C.; Zhao, R.; Zuo, X.; Tong, L.; Shang, C.; Sun, H. Research and application of advanced resin matrix composites for aerospace shuttle vehicles abroad. Acta Mater. Compos. Sin. 2022, 39, 3029. [Google Scholar] [CrossRef]
  9. Smith, C.T.G.; Delkowki, M.; Anguita, J.V.; Cox, D.C.; Haas, C.; Silva, S.R.P. Complete Atomic Oxygen and UV Protection for Polymer and Composite Materials in a Low Earth Orbit. ACS Appl. Mater. Interfaces 2021, 13, 6670–6677. [Google Scholar] [CrossRef]
  10. Kearsley, A.T.; Graham, G.A.; Yano, H.; Wright, I.P. Micrometeoroids&Orbital Debris Preserved on Multi-Layered Insulation Foils from the Japanese Space Flyer Unit Spacecraft. Lunar Planet. Sci. 2002, 33, 1122. [Google Scholar]
  11. Hu, D.Q.; Chi, R.G.; Liu, Y.Y.; Pang, B.J. Sensitivity analysis of spacecraft in micrometeoroids and orbital debris environment based on panel method. Def. Technol. 2023, 19, 126–142. [Google Scholar] [CrossRef]
  12. Suliga, A.; Jakubczyk, E.M.; Hamerton, I.; Viquerat, A. Analysis of atomic oxygen and ultraviolet exposure effects on cycloaliphatic epoxy resins reinforced with octa-functional POSS. Acta Astronaut. 2018, 142, 103–111. [Google Scholar] [CrossRef]
  13. Carrier, B.L.; Abbey, W.J.; Beegle, L.W.; Bhartia, R.; Liu, Y. Attenuation of Ultraviolet Radiation in Rocks and Minerals: Implications for Mars Science. J. Geophys. Res. Planets 2019, 124, 2599–2612. [Google Scholar] [CrossRef]
  14. Royer, C.; Bernard, S.; Beyssac, O.; Balan, E.; Forni, O.; Gauthier, M.; Morand, M.; Garino, Y.; Rosier, P. Impact of UV radiation on the Raman and infrared spectral signatures of sulfates, phosphates and carbonates: Implications for Mars exploration. Icarus 2024, 410, 115894. [Google Scholar] [CrossRef]
  15. Lemmon, M.T.; Smith, M.D.; Viudez-Moreiras, D.; de la Torre-Juarez, M.; Vicente-Retortillo, A.; Munguira, A.; Sanchez-Lavega, A.; Hueso, R.; Martinez, G.; Chide, B.; et al. Sand, and Winds Within an Active Martian Storm in Jezero Crater. Geophys. Res. Lett. 2022, 49, e2022GL100126. [Google Scholar] [CrossRef]
  16. Ainali, N.M.; Bikiaris, D.N.; Lambropoulou, D.A. Aging effects on low- and high-density polyethylene, polypropylene and polystyrene under UV irradiation: An insight into decomposition mechanism by Py-GC/MS for microplastic analysis. J. Anal. Appl. Pyrolysis 2021, 158, 105207. [Google Scholar] [CrossRef]
  17. Shokrieh, M.M.; Bayat, A. Effects of ultraviolet radiation on mechanical properties of glass/polyester composites. J. Compos. Mater. 2007, 41, 2443–2455. [Google Scholar] [CrossRef]
  18. Mayandi, K.; Rajini, N.; Ayrilmis, N.; Devi, M.P.I.; Siengchin, S.; Mohammad, F.; Al-Lohedan, H.A. An overview of endurance and ageing performance under various environmental conditions of hybrid polymer composites. J. Mater. Res. Technol. 2020, 9, 15962–15988. [Google Scholar] [CrossRef]
  19. Roylance, M.; Roylance, D. Forms of polymer degradation. In Environmental Degradation of Advanced and Traditional Engineering Materials; Hihara, L.H., Adler, R.P.I., Latanision, R.M., Eds.; CRC Press: Boca Raton, FL, USA, 2014; Chapter 13; pp. 337–348. [Google Scholar]
  20. Kumar, B.G.; Singh, R.P.; Nakamura, T. Degradation of carbon fiber-reinforced epoxy composites by ultraviolet radiation and condensation. J. Compos. Mater. 2002, 36, 2713–2733. [Google Scholar] [CrossRef]
  21. Navarro, R.F.; d’Almeida, J.R.M.; Rabello, M.S. Elastic properties of degraded polypropylene. J. Mater. Sci. 2007, 42, 2167–2174. [Google Scholar] [CrossRef]
  22. Gibson, R.F. Principles of Composite Materials Mechanics; McGraw-Hill: New York, NY, USA, 1994. [Google Scholar]
  23. Lan, Z.; Deng, J.; Song, Y.; Xu, Z.; Nie, Y.; Chen, Y.; Ma, Y. Color Changes and Mechanical Properties of Glass Fiber Reinforced Polycarbonate Composites after Thermal Aging. Polymers 2022, 14, 222. [Google Scholar] [CrossRef] [PubMed]
  24. Commission Internationale de l’Eclairage. CIE Technical Report: Colorimetry; CIE Pub No. 15.3.; CIE Central Bureau: Vienna, Austria, 2004; ISBN 3 901 906 33 9. [Google Scholar]
  25. Graham, G.A.; Kearsley, A.T.; Drolshagen, G.; Wright, I.P.; Grady, M.M.; Jones, C.G. Impact damage to space hardware: Identifying the culprits. Microsc. Anal. 2000, 27–28. [Google Scholar]
  26. Bijwe, J.; Indumathi, J.; Ghosh, A.K. On the abrasive wear behaviour of fabric-reinforced polyetherimide composites. Wear 2002, 253, 768–777. [Google Scholar] [CrossRef]
  27. Hejjaji, A.; Zitoune, R.; Toubal, L.; Crouzeix, L.; Collombet, F. Influence of controlled depth abrasive water jet milling on the fatigue behavior of carbon/epoxy composites. Compos. Part A Appl. Sci. Manuf. 2019, 121, 397–410. [Google Scholar] [CrossRef]
  28. Paciornik, S.; Maurício, M.H.P. Digital imaging. In ASM Handbook: Metallography and Microstructures; Voort, G.F.V., Ed.; ASM International: Materials Park, OH, USA, 2004; pp. 368–402. [Google Scholar]
  29. ISO 21920-2; Geometrical Product Specifications (GPS)—Surface Texture: Profile Part 2: Terms, Definitions and Surface Texture Parameters. International Organization for Standardization: Geneva, Switzerland, 2021.
  30. Whitehouse, D. Handbook of Surface and Nanometrology, 2nd ed.; CRC Press: Boca Raton, FL, USA, 2010. [Google Scholar] [CrossRef]
  31. Pereira, A.A.C.; d’Almeida, J.R.M. Wear behavior of polyamide 11 reinforced with titanate nanotubes. J. Thermoplast. Compos. Mater. 2023, 36, 510–534. [Google Scholar] [CrossRef]
  32. ASTM D790; Standard Test Methods for Flexural Properties of Unreinforced and Reinforced Plastics and Electrical Insulating Materials. American Society for Testing and Materials: West Conshohocken, PA, USA, 2017.
  33. ASTM D2344; Standard Test Method for Short-Beam Strength of Polymer Matrix Composite Materials and Their Laminates. American Society for Testing and Materials: West Conshohocken, PA, USA, 2022.
  34. ASTM E 1876; Standard Test Method for Dynamic Young’s Modulus, Shear Modulus, and Poisson’s Ratio by Impulse Excitation of Vibration. American Society for Testing and Materials: West Conshohocken, PA, USA, 2022.
  35. de Silva, C.W. Vibration Damping, Control and Design; Taylor & Francis: Boca Raton, FL, USA, 2007. [Google Scholar]
  36. Moore, H.J.; Hutton, R.E.; Clow, G.D.; Spitzer, C.R. Physical properties of the surface materials at the Viking landing sites on Mars. In USGS Numbered Series Professional Paper 1389; USGS: Reston, VA, USA, 1987. [Google Scholar] [CrossRef]
  37. Lemmon, M.T.; Guzewich, S.D.; McConnochie, T.; de Vicente-Retortillo, A.; Martínez, G.; Smith, M.D.; Bell, J.F., III.; Wellington, D.; Jacob, S. Large dust aerosol sizes seen during the 2018 Martian global dust event by the curiosity rover. Geophys. Res. Lett. 2019, 46, 9448–9456. [Google Scholar] [CrossRef]
  38. Chen-Chen, H.; Pérez-Hoyos, S.; Sánchez-Lavega, A.; Peralta, J. Characterization of deposited dust particles on Mars insight lander Instrument Context Camera (ICC) lens. Icarus 2023, 392, 115393. [Google Scholar] [CrossRef]
  39. Mazumder, M.K.; Saini, D.; Bins, A.S.; Srirama, P.K.; Calle, C.; Buhie, C. Mars Dust: Characterization of Particle size and Electrostatic Charge Distributions; Report number: KSC-2004-032; Kennedy Space Center: Merritt Island, FL, USA.
  40. Mazumder, M.K.; Calle, C.I.; Srirama, P.K.; Wilson, J.D.; Zhang, J.; Buhler, C.H.; Ali, M. In-Situ and simultaneous measurements of size and charge distributions of dust on Mars: Instrumentation and analysis. In Proceedings of the Seventh International Conference on Mars, Pasadena, CA, USA, 9–13 July 2007. Paper 3391. [Google Scholar]
  41. Grossman, E.; Gouzman, I.; Verker, R. Debris/Micrometeoroid Impacts and Synergistic Effects on Spacecraft Materials. MRS Bull. 2010, 35, 41–47. [Google Scholar] [CrossRef]
  42. Romeo, R.C.; Martina, R.N.; Bollweg, K. Discussions on radiation and space environment exposure of replicated optical mirrors produced from carbon composites. In Proceedings of the SPIE 9616, Nanophotonics and Macrophotonics for Space Environments IX, 961602, San Diego, CA, USA, 13–15 August 2015. [Google Scholar] [CrossRef]
  43. Meyer, C.S.; Catugas, I.G.; Gillespie, J.W.; Haque, B.Z.G. Investigation of normal, lateral, and oblique impact of microscale projectiles into unidirectional glass/epoxy composites. Def. Technol. 2022, 18, 1960–1978. [Google Scholar] [CrossRef]
  44. Uddin, M.N.; George, J.M.; Patlolla, V.R.; Asmatulu, R. Investigating the effects of UV light and moisture ingression on low-impact resistance of three different carbon fiber–reinforced composites. Adv. Compos. Hybrid Mater. 2019, 2, 701–710. [Google Scholar] [CrossRef]
  45. Schanda, J. Colorimetry: Understanding the CIE System; John Wiley: Hoboken, NJ, USA, 2007. [Google Scholar]
  46. Komorek, A.; Przybylek, P.; Brzozowski, D. The influence of UV radiation upon the properties of fibre reinforced polymers. Solid State Phenom. 2015, 223, 27–34. [Google Scholar] [CrossRef]
  47. Tian, W.; Hodgkin, J. Long-Term Aging in a Commercial Aerospace Composite Sample: Chemical and Physical Changes. J. O Fapplied Polym. Sci. 2010, 115, 2981–2985. [Google Scholar]
  48. Silverstein, R.M.; Webster, F.X.; Kiemle, D.J. Spectrometric Identification of Organic Compounds, 7th ed.; John Wiley & Sons: Hoboken, NJ, USA, 2005. [Google Scholar]
  49. Lin, J.; Yan, D.; Fu, J.; Chen, Y.; Ou, H. Ultraviolet-C and vacuum ultraviolet inducing surface degradation of microplastics. Water Res. 2020, 186, 116360. [Google Scholar] [CrossRef] [PubMed]
  50. Smoleń, J.; Olesik, P.; Nowacki, B.; Godzierz, M.; Kurtyka, K.; Chaber, P.; Czakiert, J.; Kozioł, M. The influence of UV radiation on the properties of GFRP laminates in underwater conditions. Sci. Rep. 2024, 14, 7446. [Google Scholar] [CrossRef]
  51. Daniels, B.K.; Harakas, N.K.; Jackson, R.C. Short beam shear tests of graphite fiber composites. Fibre Sci. Technol. 1971, 3, 187–208. [Google Scholar] [CrossRef]
  52. Shin, K.B.; Kim, C.G.; Hong, C.S.; Lee, H.H. Prediction of failure thermal cycles in graphite/epoxy composite materials under simulated low earth orbit environments. Compos. Part B 2000, 31, 223–235. [Google Scholar] [CrossRef]
  53. Liau, W.B.; Tseng, F.P. The effect of long-term ultraviolet light irradiation on polymer matrix composites. Polym. Compos. 1998, 19, 440–445. [Google Scholar] [CrossRef]
  54. Liu, T.; Liu, X.; Feng, P. A comprehensive review on mechanical properties of pultruded FRP composites subjected to long-term environmental effects. Compos. Part B 2020, 191, 107958. [Google Scholar] [CrossRef]
  55. Nakamura, T.; Singh, R.P.; Vaddadi, P. Effects of Environmental Degradation on Flexural Failure Strength of Fiber Reinforced Composites. Exp. Mech. 2006, 46, 257–268. [Google Scholar] [CrossRef]
  56. Pang, S.S.; Helms, J.E.; Li, G.; Ibekwe, S.I. Influence of ultraviolet radiation on the Low velocity impact response of laminated composite. In Proceedings of the Engineering Technology Conference on Energy, Part B, Houston, TX, USA, 5–7 February 2001; pp. 565–571. [Google Scholar] [CrossRef]
  57. Sánchez-Ávila, D.; Orozco-Caballero, A.; Martínez, E.; Portolés, L.; Barea, R.; Carreño, F. High-accuracy compliance correction for nonlinear mechanical testing: Improving small punch test characterization. Nucl. Mater. Energy 2021, 26, 100914. [Google Scholar] [CrossRef]
  58. da Silva, J.E.L., Jr.; Paciornik, S.; d’Almeida, J.R.M. Determination of the post-ballistic impact mechanical behavior of a ±45° glass–fabric composite. Polym. Test. 2004, 23, 599–604. [Google Scholar] [CrossRef]
Figure 1. Experimental setup of the impulse excitation test, highlighting the positioning of the microphone (1) and the actuator (2) on the test specimen.
Polymers 17 00861 g001
Figure 2. Representative aspect of the composite microstructure. It is possible to observe (a) pores in the matrix-rich region (→) and (b) defects due to lack of impregnation in the fiber layers (☐).
Polymers 17 00861 g002
Figure 3. Example of damage caused by sandblasting. The damage area has no defined shape and there is ejection of material from the surface of the samples.
Polymers 17 00861 g003
Figure 4. Side surface of the composite: (a) without aging; (b) aged.
Polymers 17 00861 g004
Figure 5. FT-IR spectrum of the composite as manufactured, highlighting the main absorption bands.
Polymers 17 00861 g005
Figure 6. Sample aged for 60 days. Failure mode common to all aging times, classified as inelastic deformation.
Polymers 17 00861 g006
Figure 7. Effect of UV exposure on the elastic modulus. Impulse excitation test. The orange line is the median, and the circles are the outliers.
Polymers 17 00861 g007
Table 1. Sequence of UV aging and abrasion damage.
SamplesTotal Aging Time
(Days)
Damage Introduction Procedure
#160UV aging for 60 days + sandblasting
#2120UV aging for 60 days + sandblasting + aging for 60 days
#3UV aging for 120 days + sandblasting
#4sandblasting + UV aging for 120 days
#5180UV aging for 60 days + sandblasting + aging for 120 days
Table 2. Average values, in mm, of the parameters Rv (peak-to-valley), Rp (peak-to-peak) and Rt (total texture height).
RvRpRt
Average0.335 ± 0.1301.387 ± 0.3921.722 ± 0.477
Table 3. Colorimetric analysis of the composites before and after aging under UV radiation for 60, 120, and 180 days.
SurfaceL*a*b*
As received18.876 ± 2.427−1.274 ± 0.4104.227 ± 1.271
UV 6019.151 ± 2.795−1.500 ± 0.6028.049 ± 1.161
UV 12020.017 ± 1.196−3.277 ± 0.84210.515 ± 1.367
UV 18022.955 ± 1.415−3.215 ± 0.4389.854 ± 1.718
LateralL*a*b*
As received31.777 ± 8.737−0.802 ± 0.2424.420 ± 0.567
UV 6036.064 ± 4.616−2.543 ± 0.52512.877 ± 2.892
UV 12031.995 ± 3.369−2.312 ± 0.35311.179 ± 1.631
UV 18037.446 ± 2.528−2.563 ± 0.24712.422 ± 1.363
Table 4. Variation of colorimetric parameters.
SurfaceΔL*Δa*Δb*ΔE*
UV 600.274−0.2263.8223.838
UV 1201.141−2.0036.2756.685
UV 1804.079−1.9415.6277.216
SideΔL*Δa*Δb*ΔE*
UV 604.287−1.7438.4579.641
UV 1200.218−1.5096.7596.929
UV 1805.668−1.7618.0039.964
Table 5. Mean values and standard deviations of samples after ILSS mechanical test.
As-Manufactured60 Days120 Days180 Days
τ (MPa)34.3 ± 4.228.8 ± 6.135.3 ± 6.535.7 ± 6.1
Table 6. Values of the elasticity modulus obtained through the impulse excitation test. UV-aged samples.
As-Manufactured60 Days120 Days180 Days
E (GPa)26.7 ± 0.423.5 ± 1.824.5 ± 1.724.5 ± 1.0
CV (%)1.67.76.94.0
Table 7. Mean and median values of the elastic moduli of the samples only sandblasted (Reference) and of the samples with combined effects of sandblasting and UV.
SamplesE (GPa)CV (%)Median (GPa)
Reference25.7 ± 0.82.925.7
#122.6 ± 3.214.023.8
#224.9 ± 0.12.024.7
#324.3 ± 1.14.424.2
#423.0 ± 2.19.323.6
#523.4 ± 3.314.223.9
Table 8. Average values of the modulus of elasticity (E) and the tensile strength (σr) obtained by three-point bending test. UV-aged samples.
As-Manufactured60 Days120 Days180 Days
E (GPa)19.9 ± 2.920.9 ± 2.120.5 ± 2.420.8 ± 1.9
σr (MPa)392.5 ± 59.3379.4 ± 36.3411.0 ± 44.6371.6 ± 61.1
Table 9. Average values of the modulus of elasticity (E) and the tensile strength (σr) obtained by bending test. Combined effect of sandblasting and UV exposure. The reference samples were only sandblasted.
SamplesE (GPa)CV (%)σr (MPa)CV (%)
Reference20.7 ± 1.46.6312.5 ± 42.213.5
#121.4 ± 1.57.0352.3 ± 65.518.6
#220.2 ± 2.66.6354.3 ± 44.212.5
#321.9 ± 1.46.3369.0 ± 15.74.2
#422.0 ± 2.511.4385.0 ± 45.711.9
#520.3 ± 3.517.1331.4 ± 38.911.7
Disclaimer/Publisher’s Note: The statements, opinions and data contained in all publications are solely those of the individual author(s) and contributor(s) and not of MDPI and/or the editor(s). MDPI and/or the editor(s) disclaim responsibility for any injury to people or property resulting from any ideas, methods, instructions or products referred to in the content.

