Author Contributions
Conceptualization, S.W. and G.C.; Methodology, L.Z.; Software, L.Z.; Validation, Y.Z.; Formal analysis, S.W.; Investigation, L.W.; Resources, Y.Z.; Data curation, L.Q. and Y.L.; Writing – original draft, L.W.; Writing – review & editing, G.C.; Visualization, Y.L.; Supervision, S.L.; Project administration, S.L.; Funding acquisition, S.L. All authors have read and agreed to the published version of the manuscript.
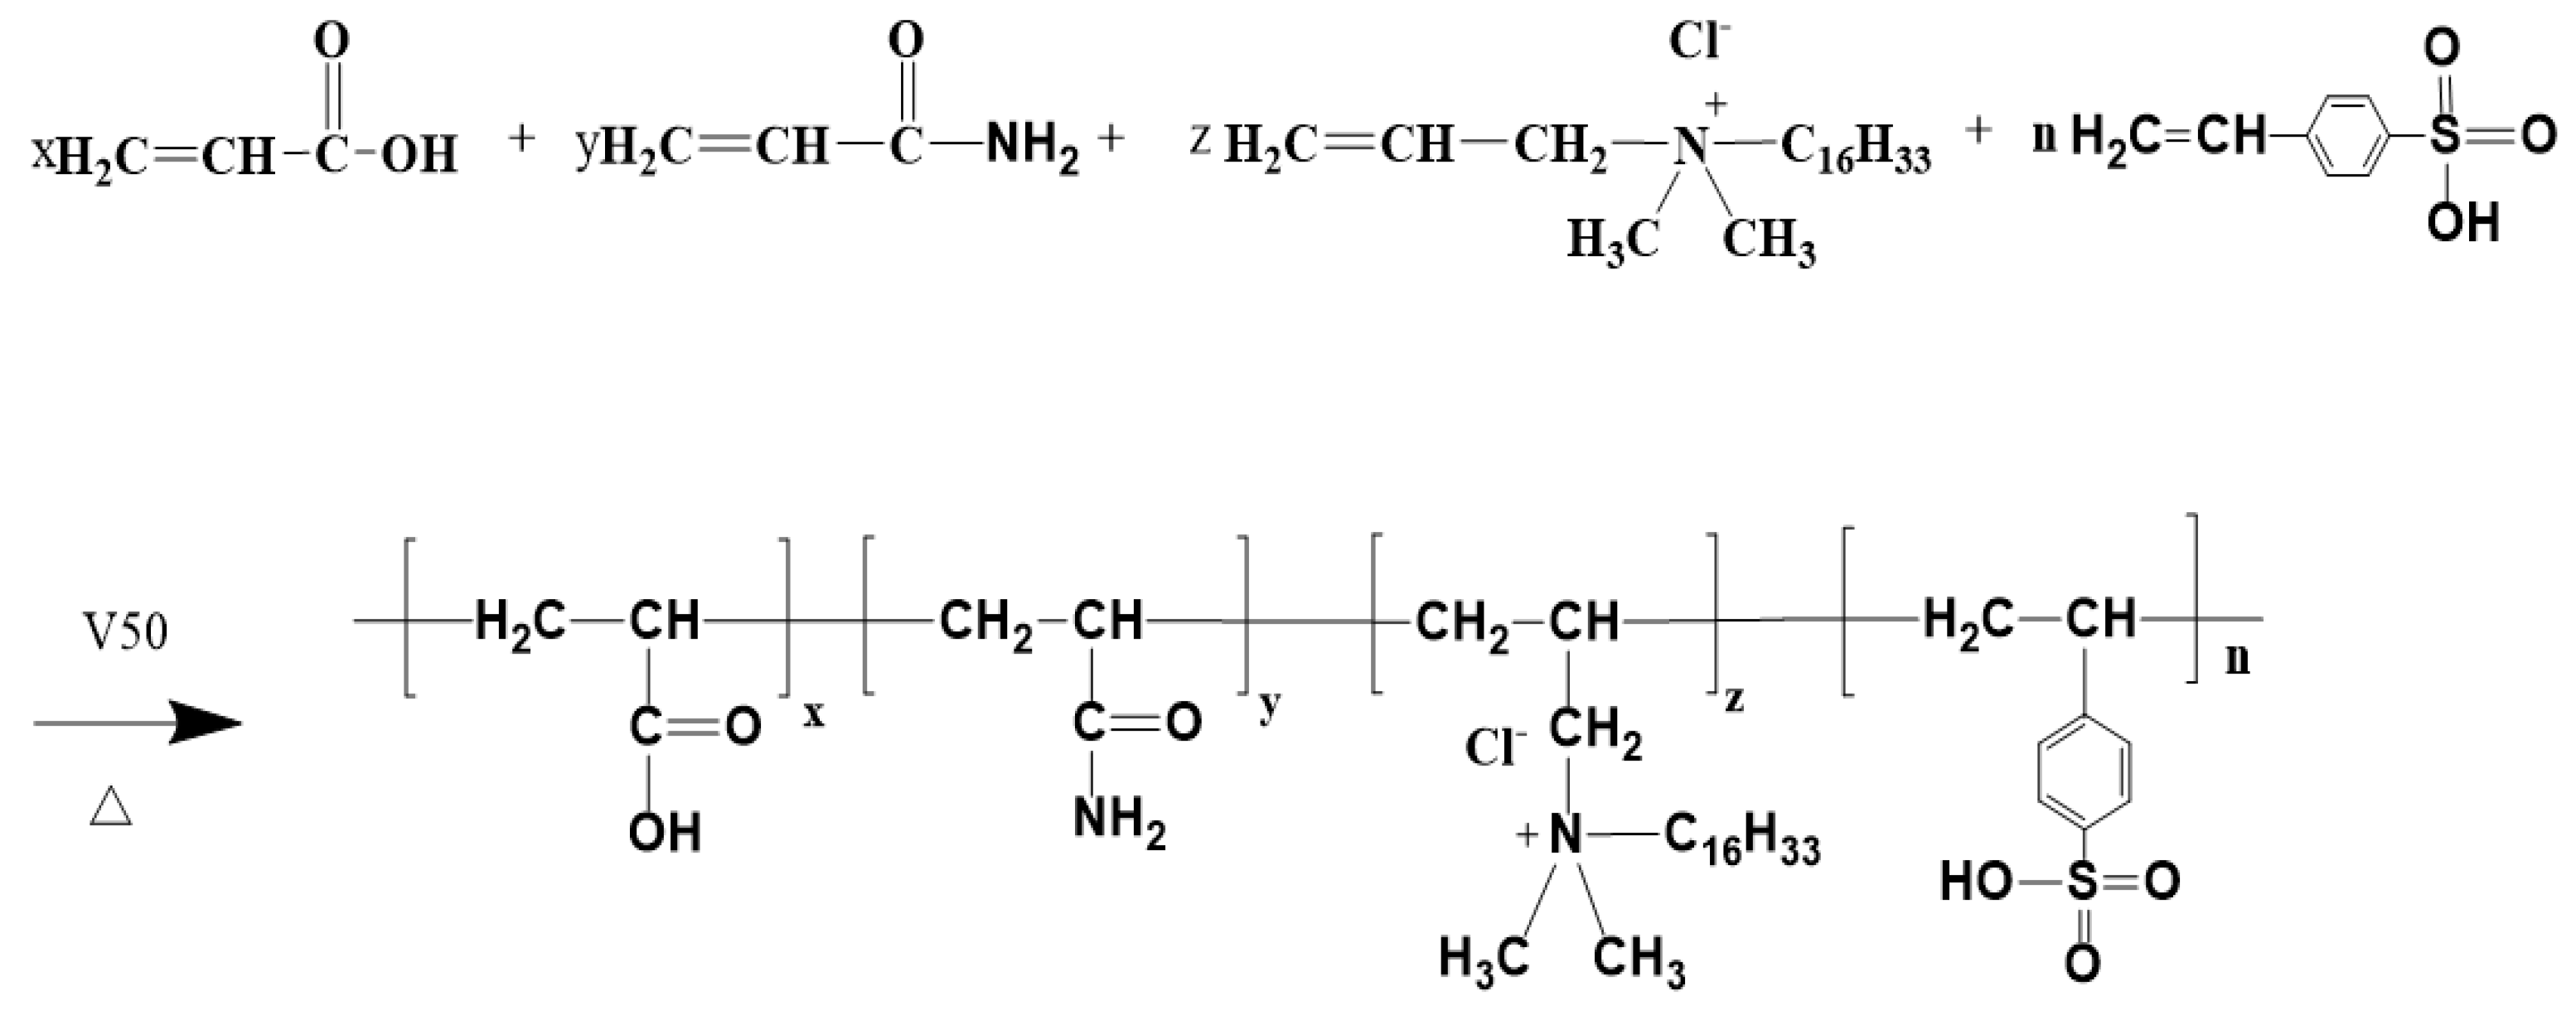
Figure 1.
P(AM/AA/SSS/DMAAC-16) reaction.
Figure 1.
P(AM/AA/SSS/DMAAC-16) reaction.
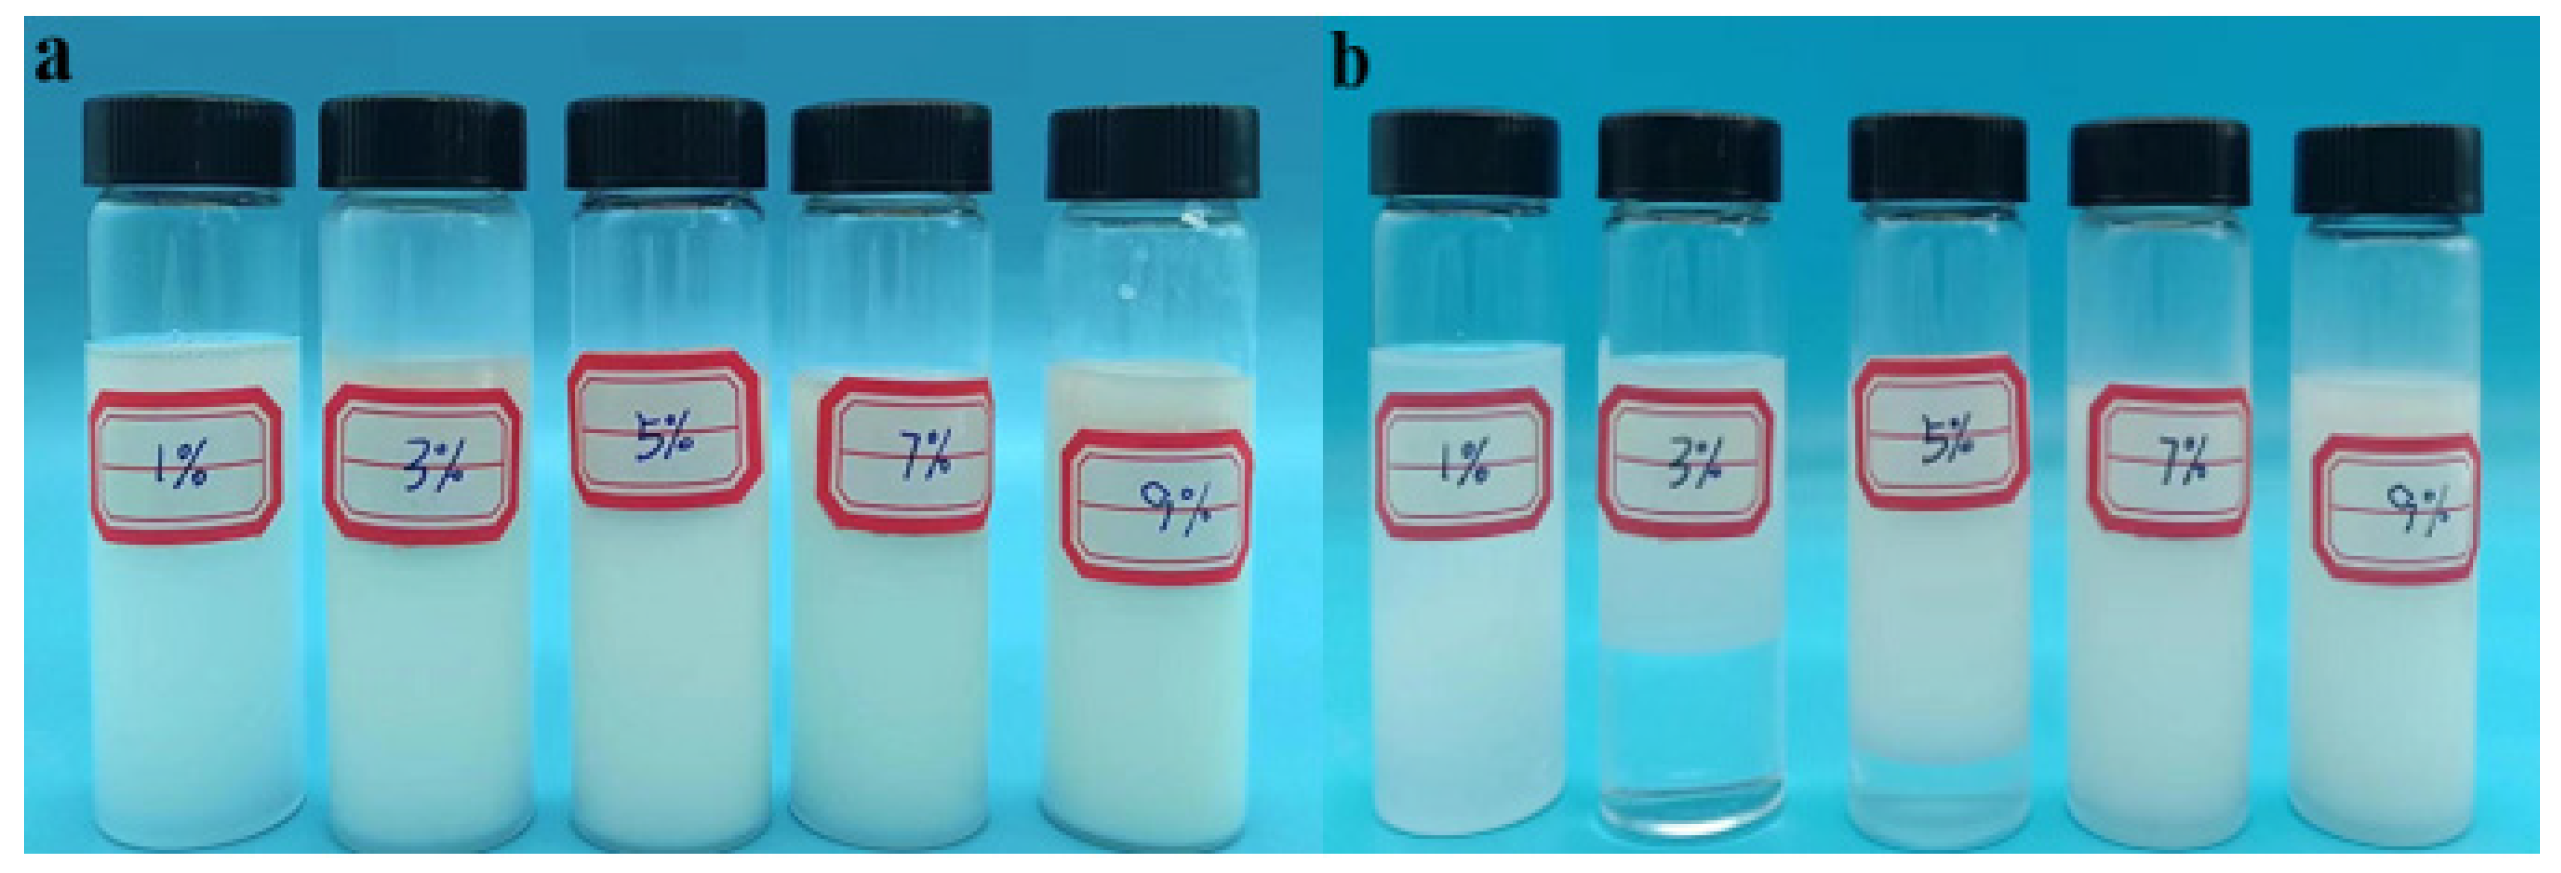
Figure 2.
Effect of emulsifier dosage on reversed-phase emulsion system P(AM/SS/SSS/DMAAC-16). (a) The state before standing for 3d (b) The state after standing for 3d.
Figure 2.
Effect of emulsifier dosage on reversed-phase emulsion system P(AM/SS/SSS/DMAAC-16). (a) The state before standing for 3d (b) The state after standing for 3d.
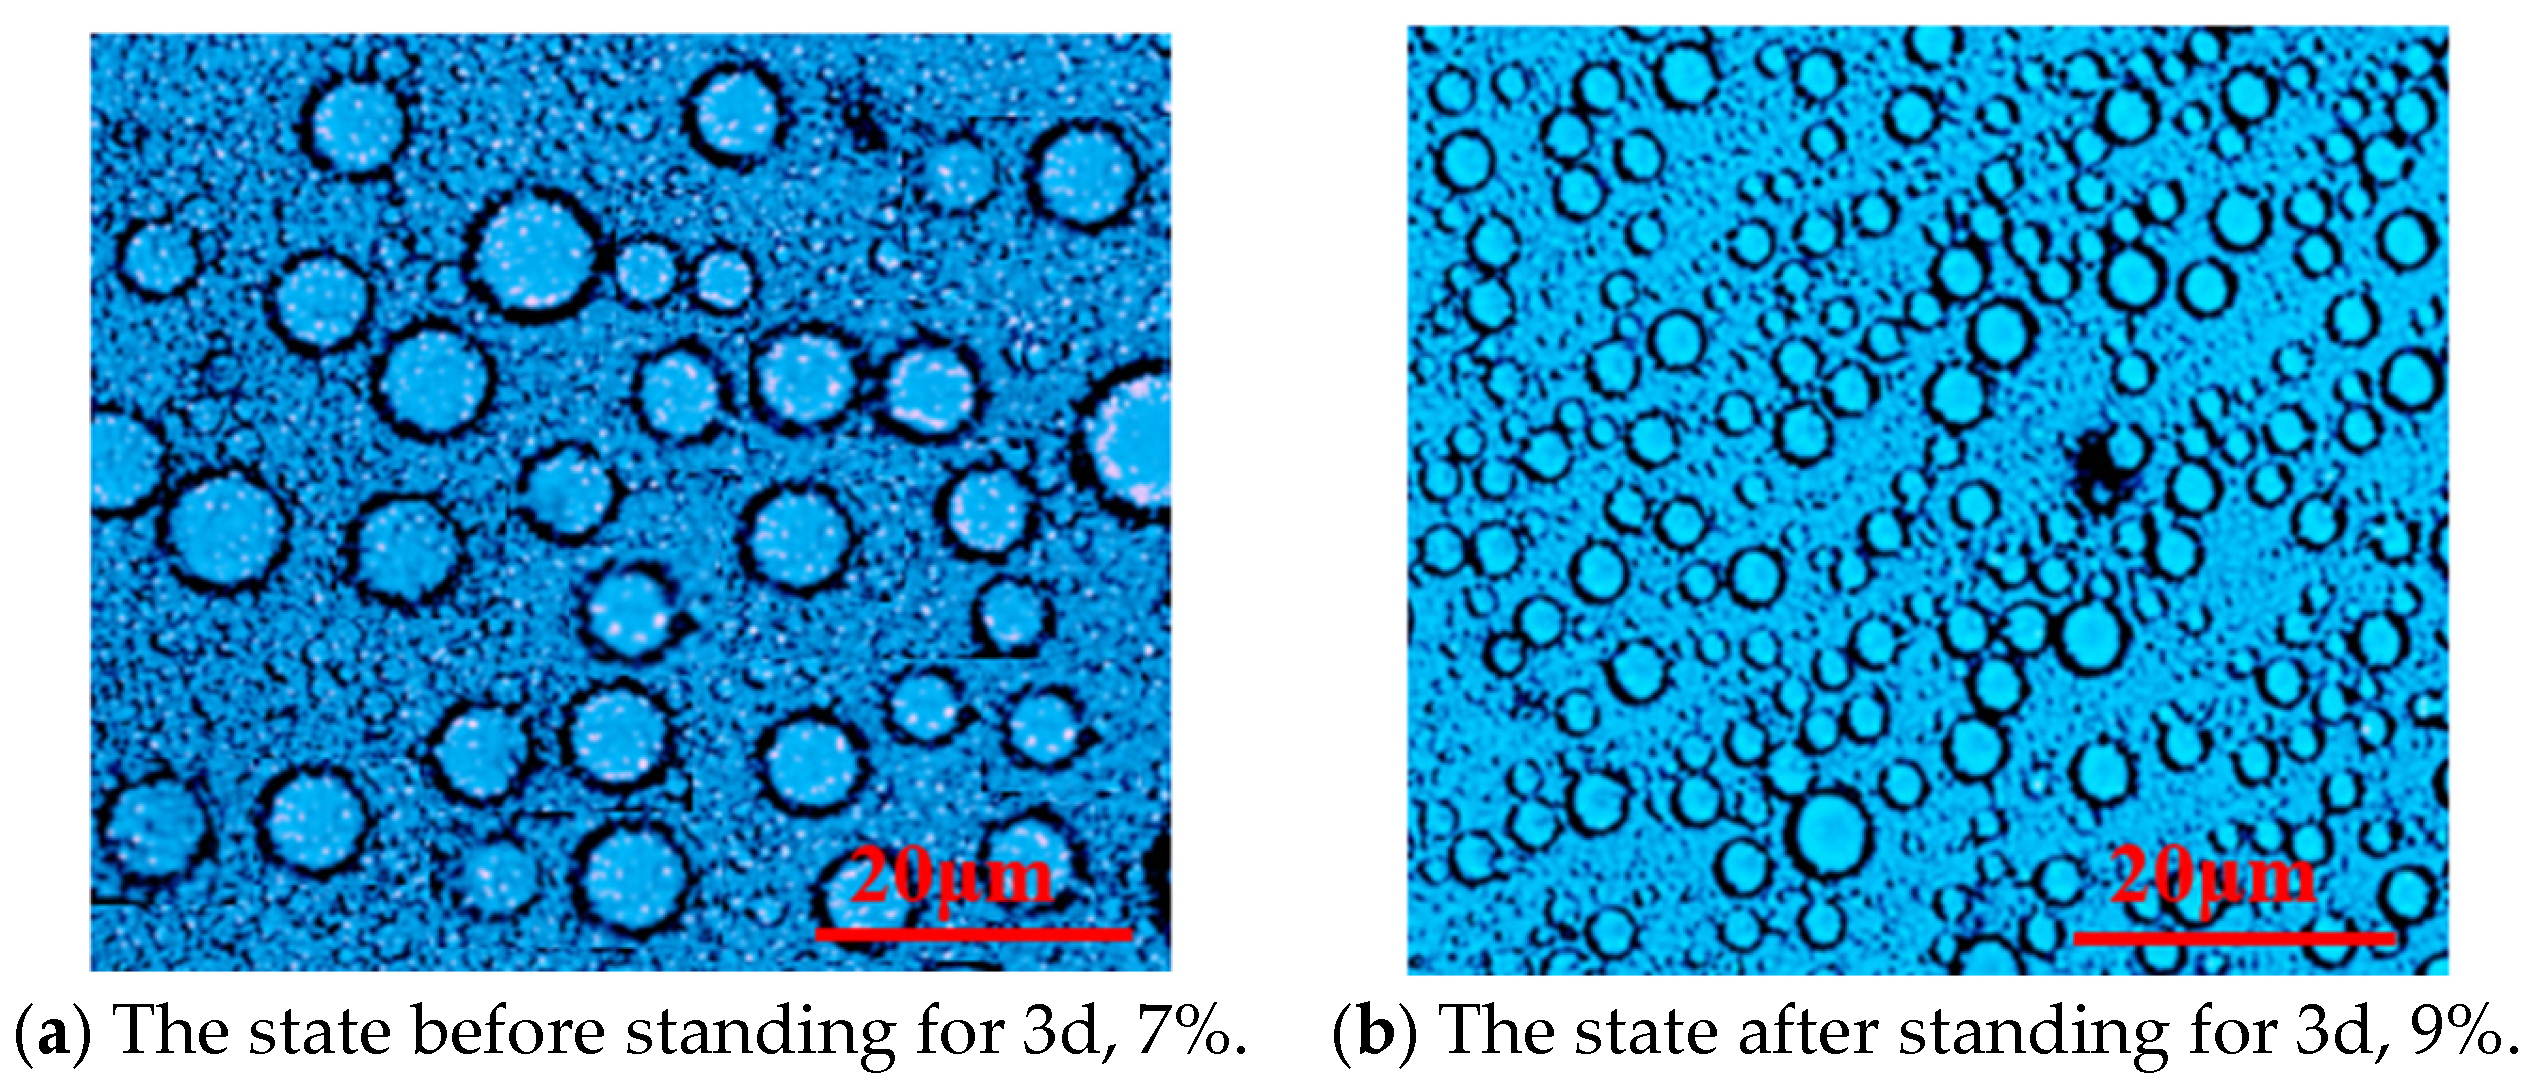
Figure 3.
Microstructure of the emulsion system P(AM/SS/SSS/DMAAC-16) under different emulsifier contents.
Figure 3.
Microstructure of the emulsion system P(AM/SS/SSS/DMAAC-16) under different emulsifier contents.
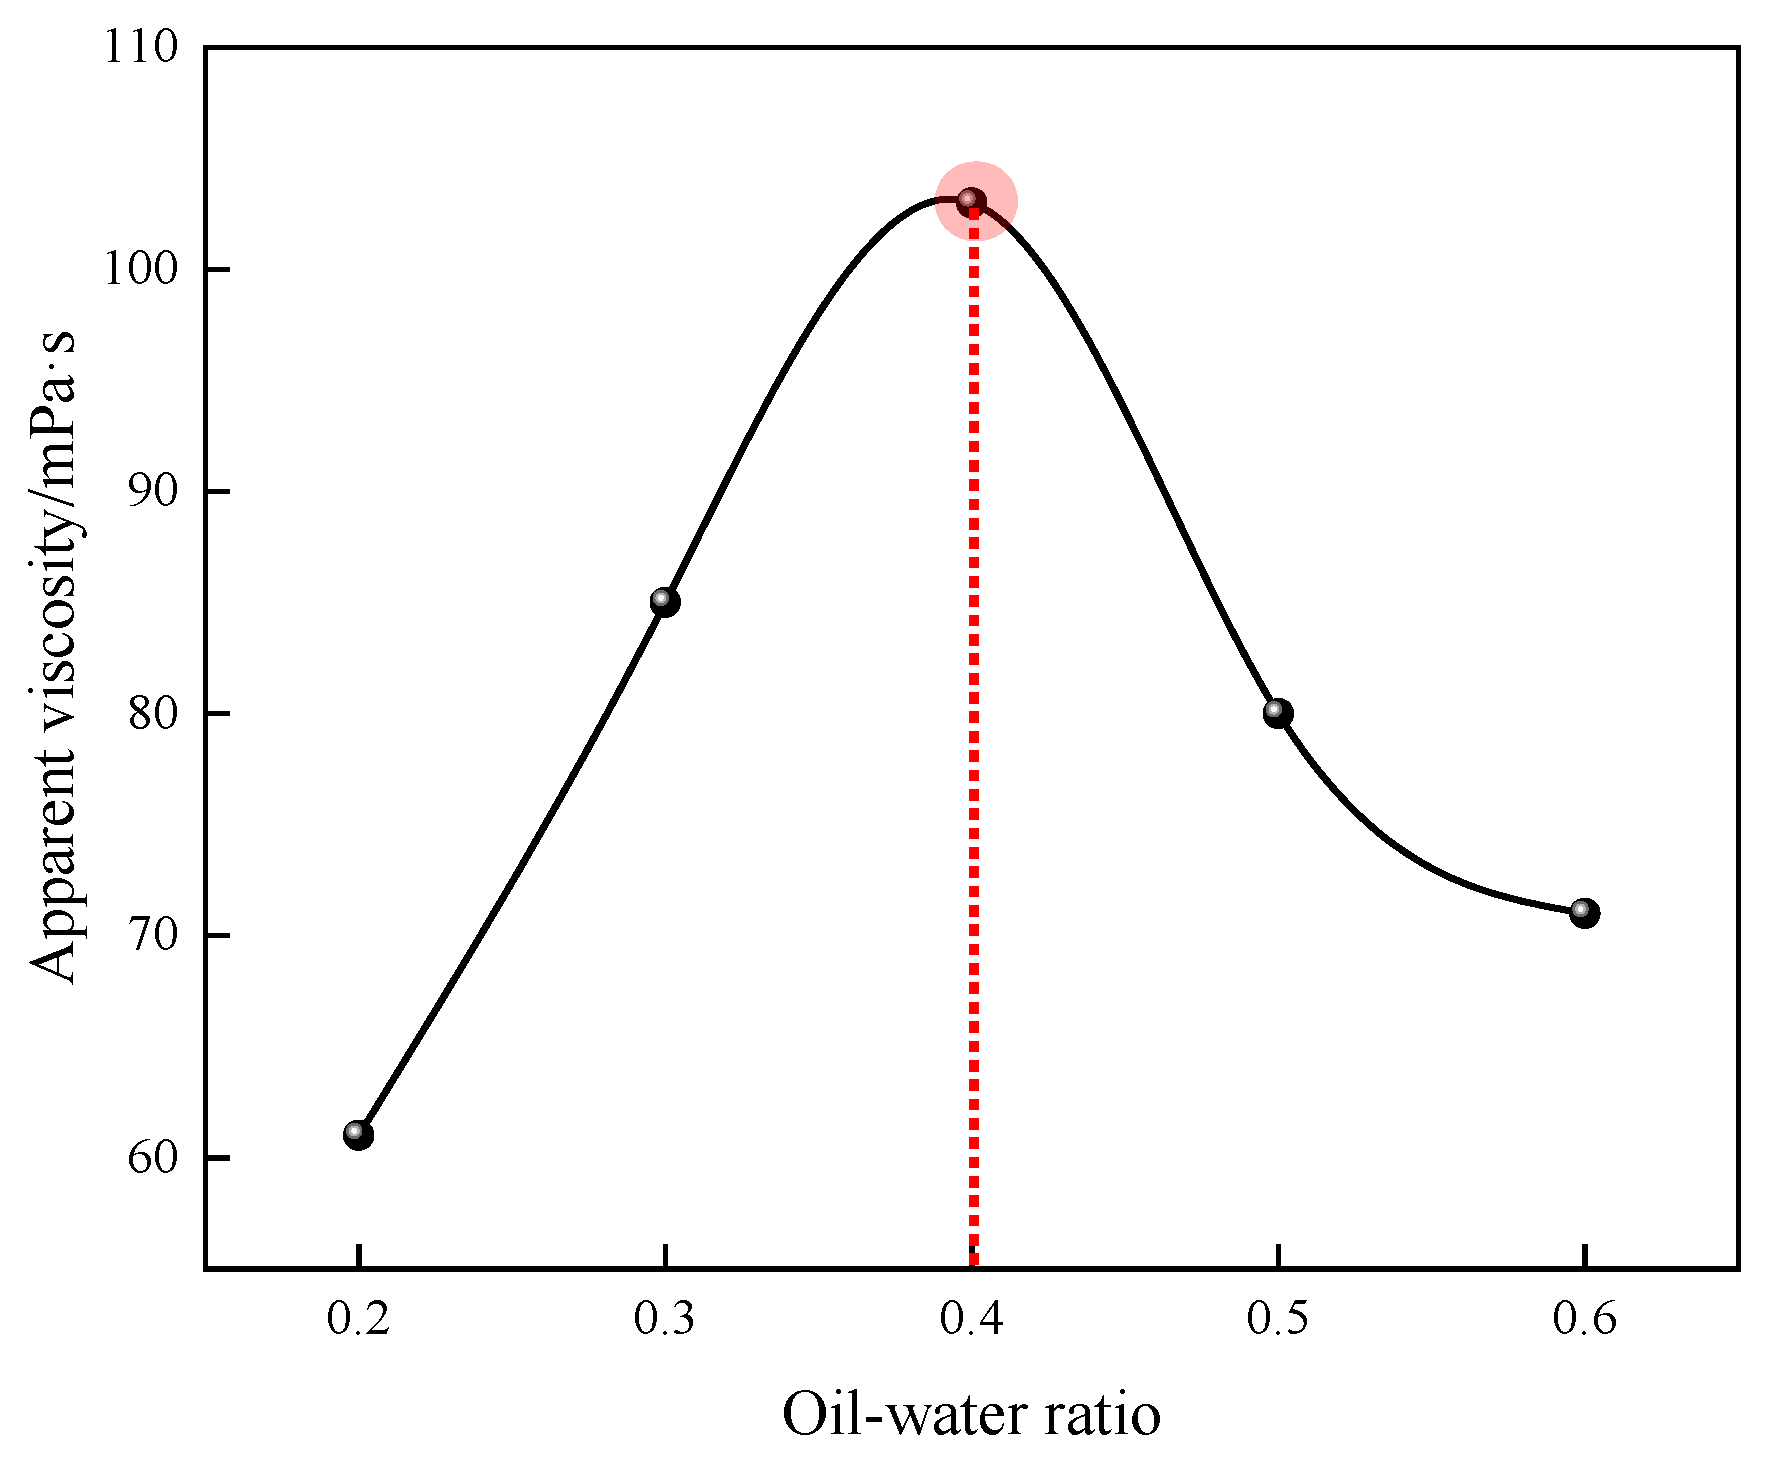
Figure 4.
Effect of the oil–water ratio on the apparent viscosity of P(AM/SS/SSS/DMAAC-16) gel.
Figure 4.
Effect of the oil–water ratio on the apparent viscosity of P(AM/SS/SSS/DMAAC-16) gel.
Figure 5.
Effect of monomer dosage on apparent viscosity of P(AM/SS/SSS/DMAAC-16) gel.
Figure 5.
Effect of monomer dosage on apparent viscosity of P(AM/SS/SSS/DMAAC-16) gel.
Figure 6.
Effect of aqueous pH on the apparent viscosity of P(AM/SS/SSS/DMAAC-16) gel.
Figure 6.
Effect of aqueous pH on the apparent viscosity of P(AM/SS/SSS/DMAAC-16) gel.
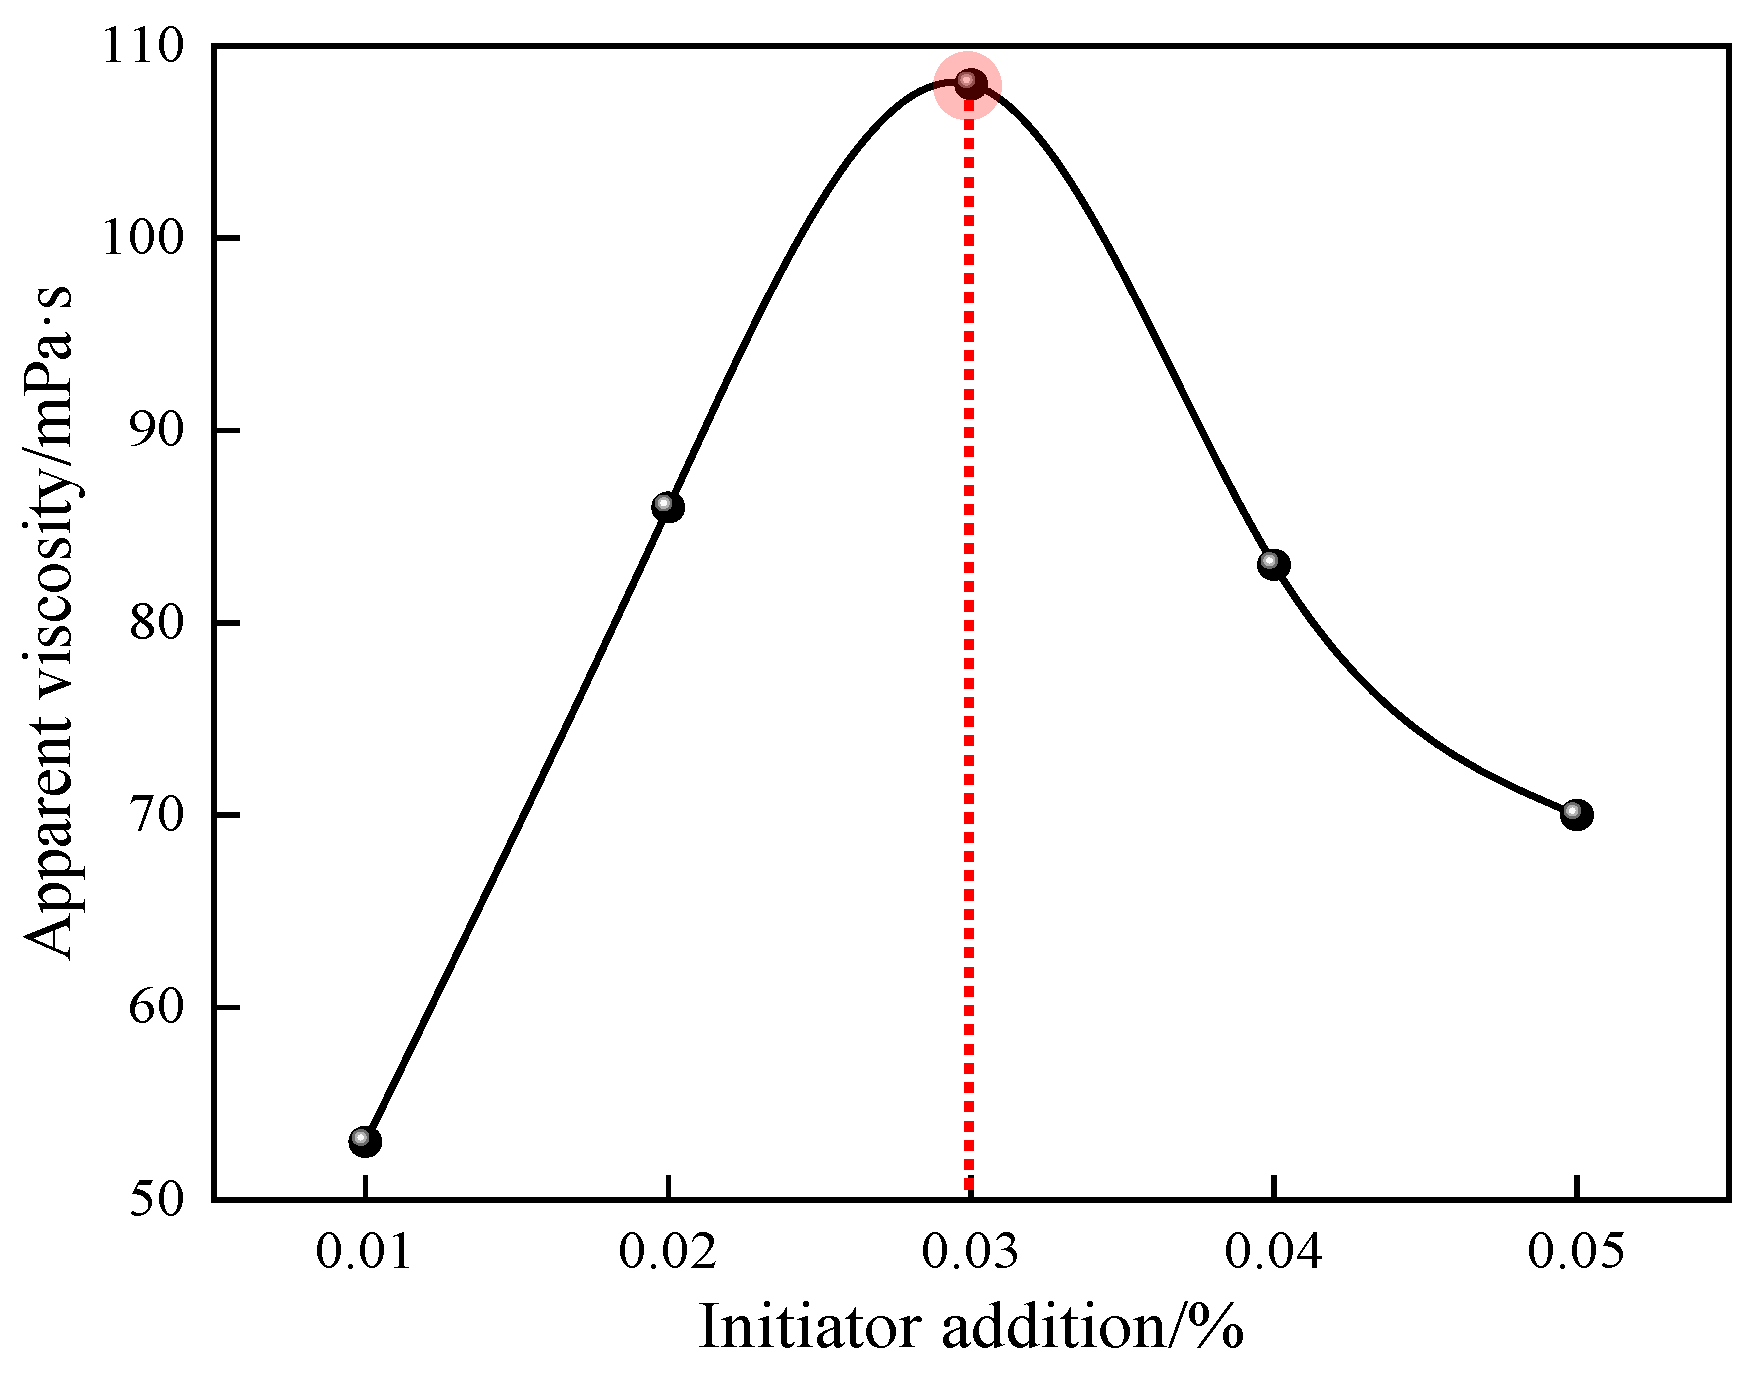
Figure 7.
Effect of initiator dosage on apparent viscosity of P(AM/SS/SSS/DMAAC-16) gel.
Figure 7.
Effect of initiator dosage on apparent viscosity of P(AM/SS/SSS/DMAAC-16) gel.
Figure 8.
Effect of reaction temperature on apparent viscosity of P(AM/SS/SSS/DMAAC-16) gel.
Figure 8.
Effect of reaction temperature on apparent viscosity of P(AM/SS/SSS/DMAAC-16) gel.
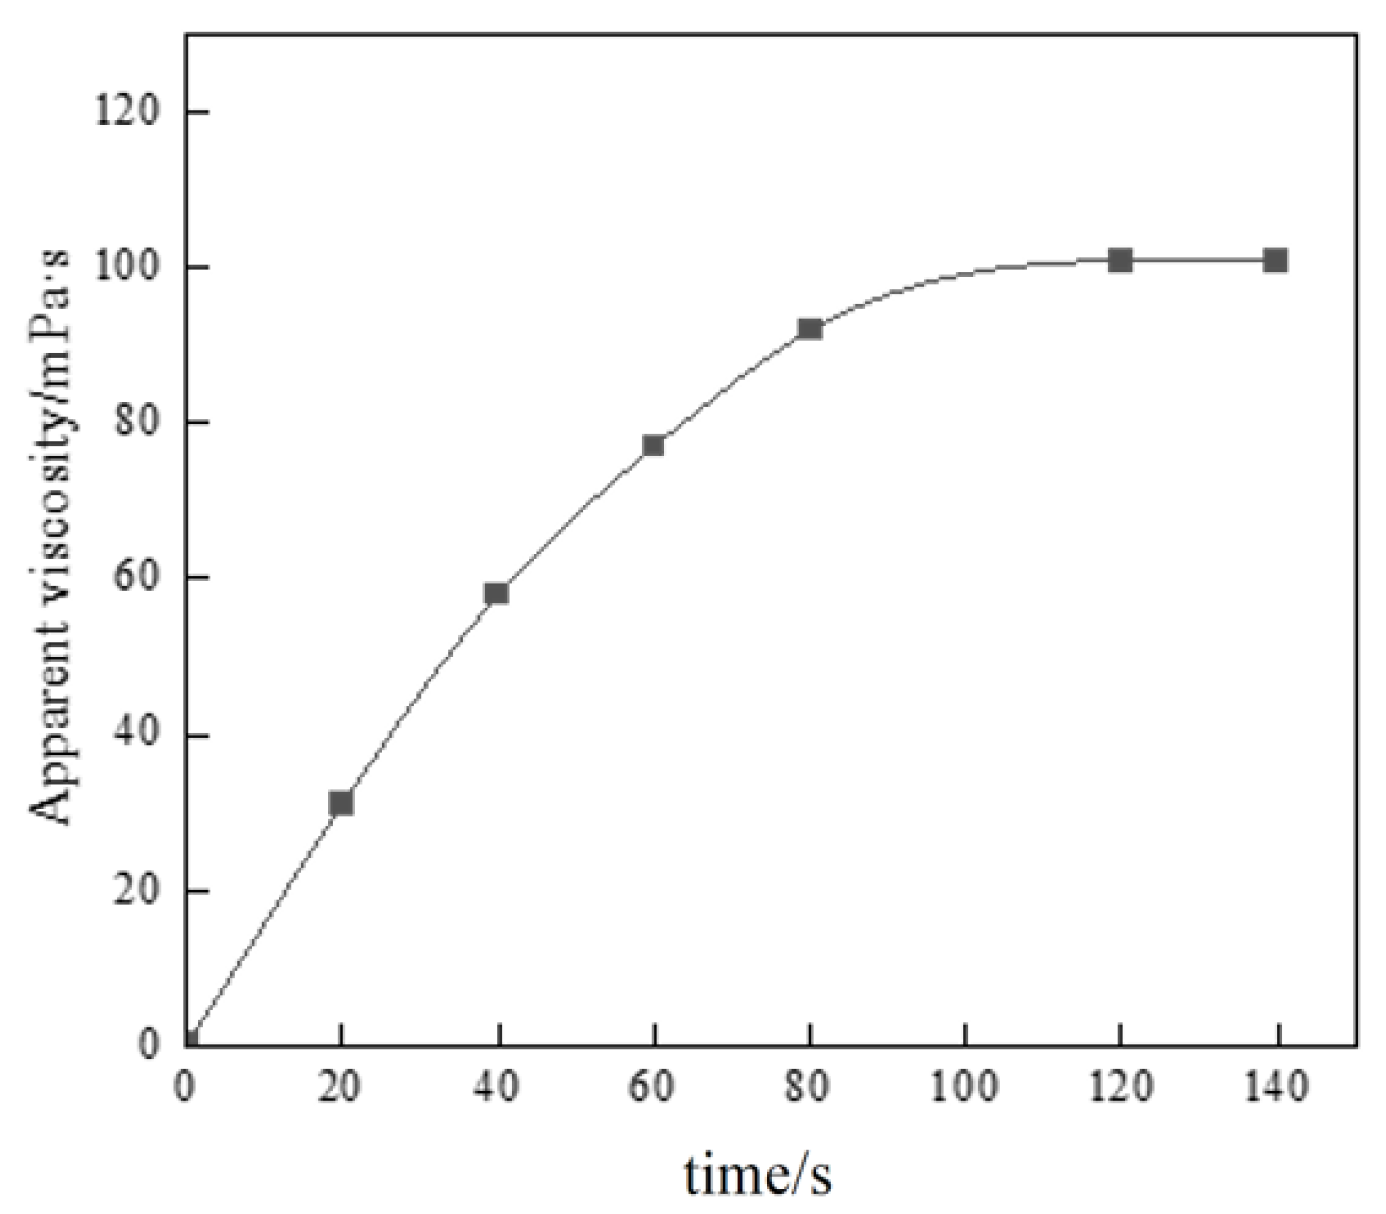
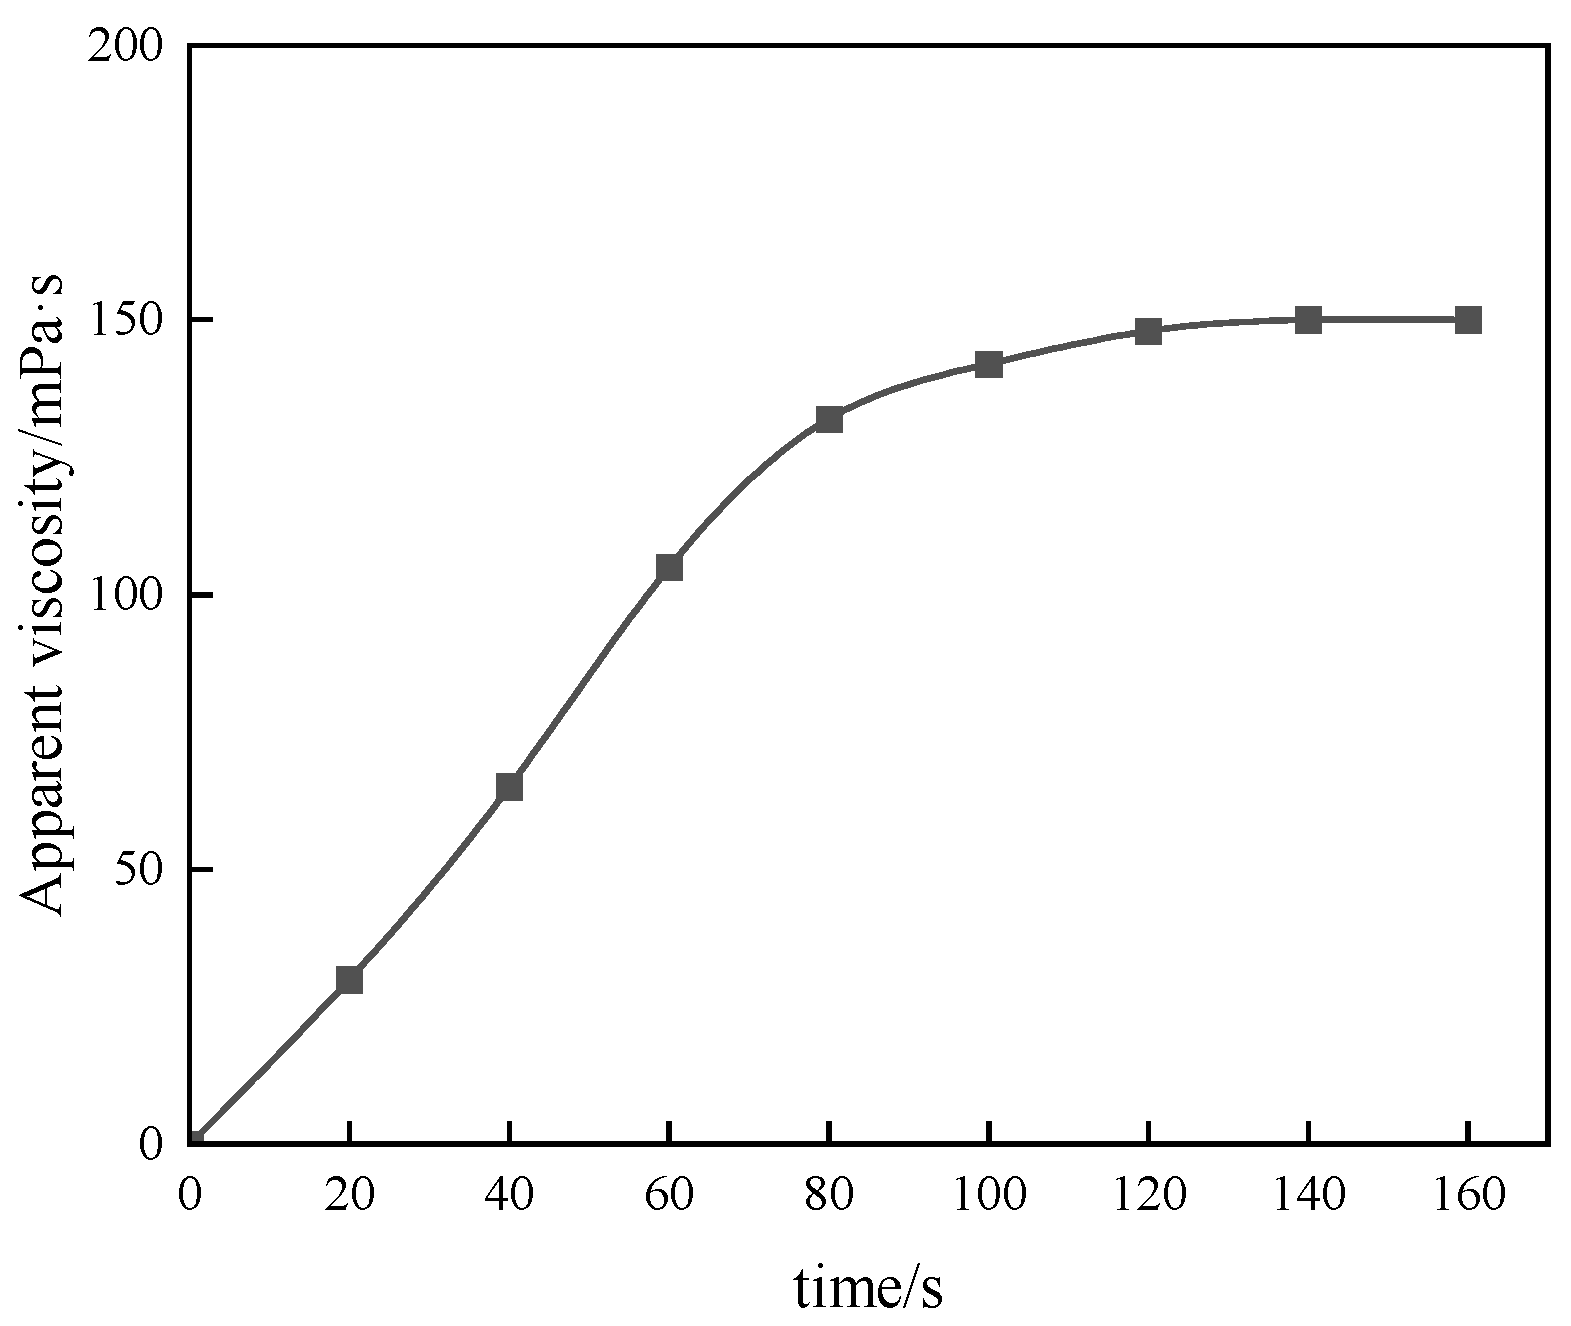
Figure 9.
Effect of reaction time on the apparent viscosity of P(AM/SS/SSS/DMAAC-16) gel.
Figure 9.
Effect of reaction time on the apparent viscosity of P(AM/SS/SSS/DMAAC-16) gel.
Figure 10.
Thickening performance test of thickener.
Figure 10.
Thickening performance test of thickener.
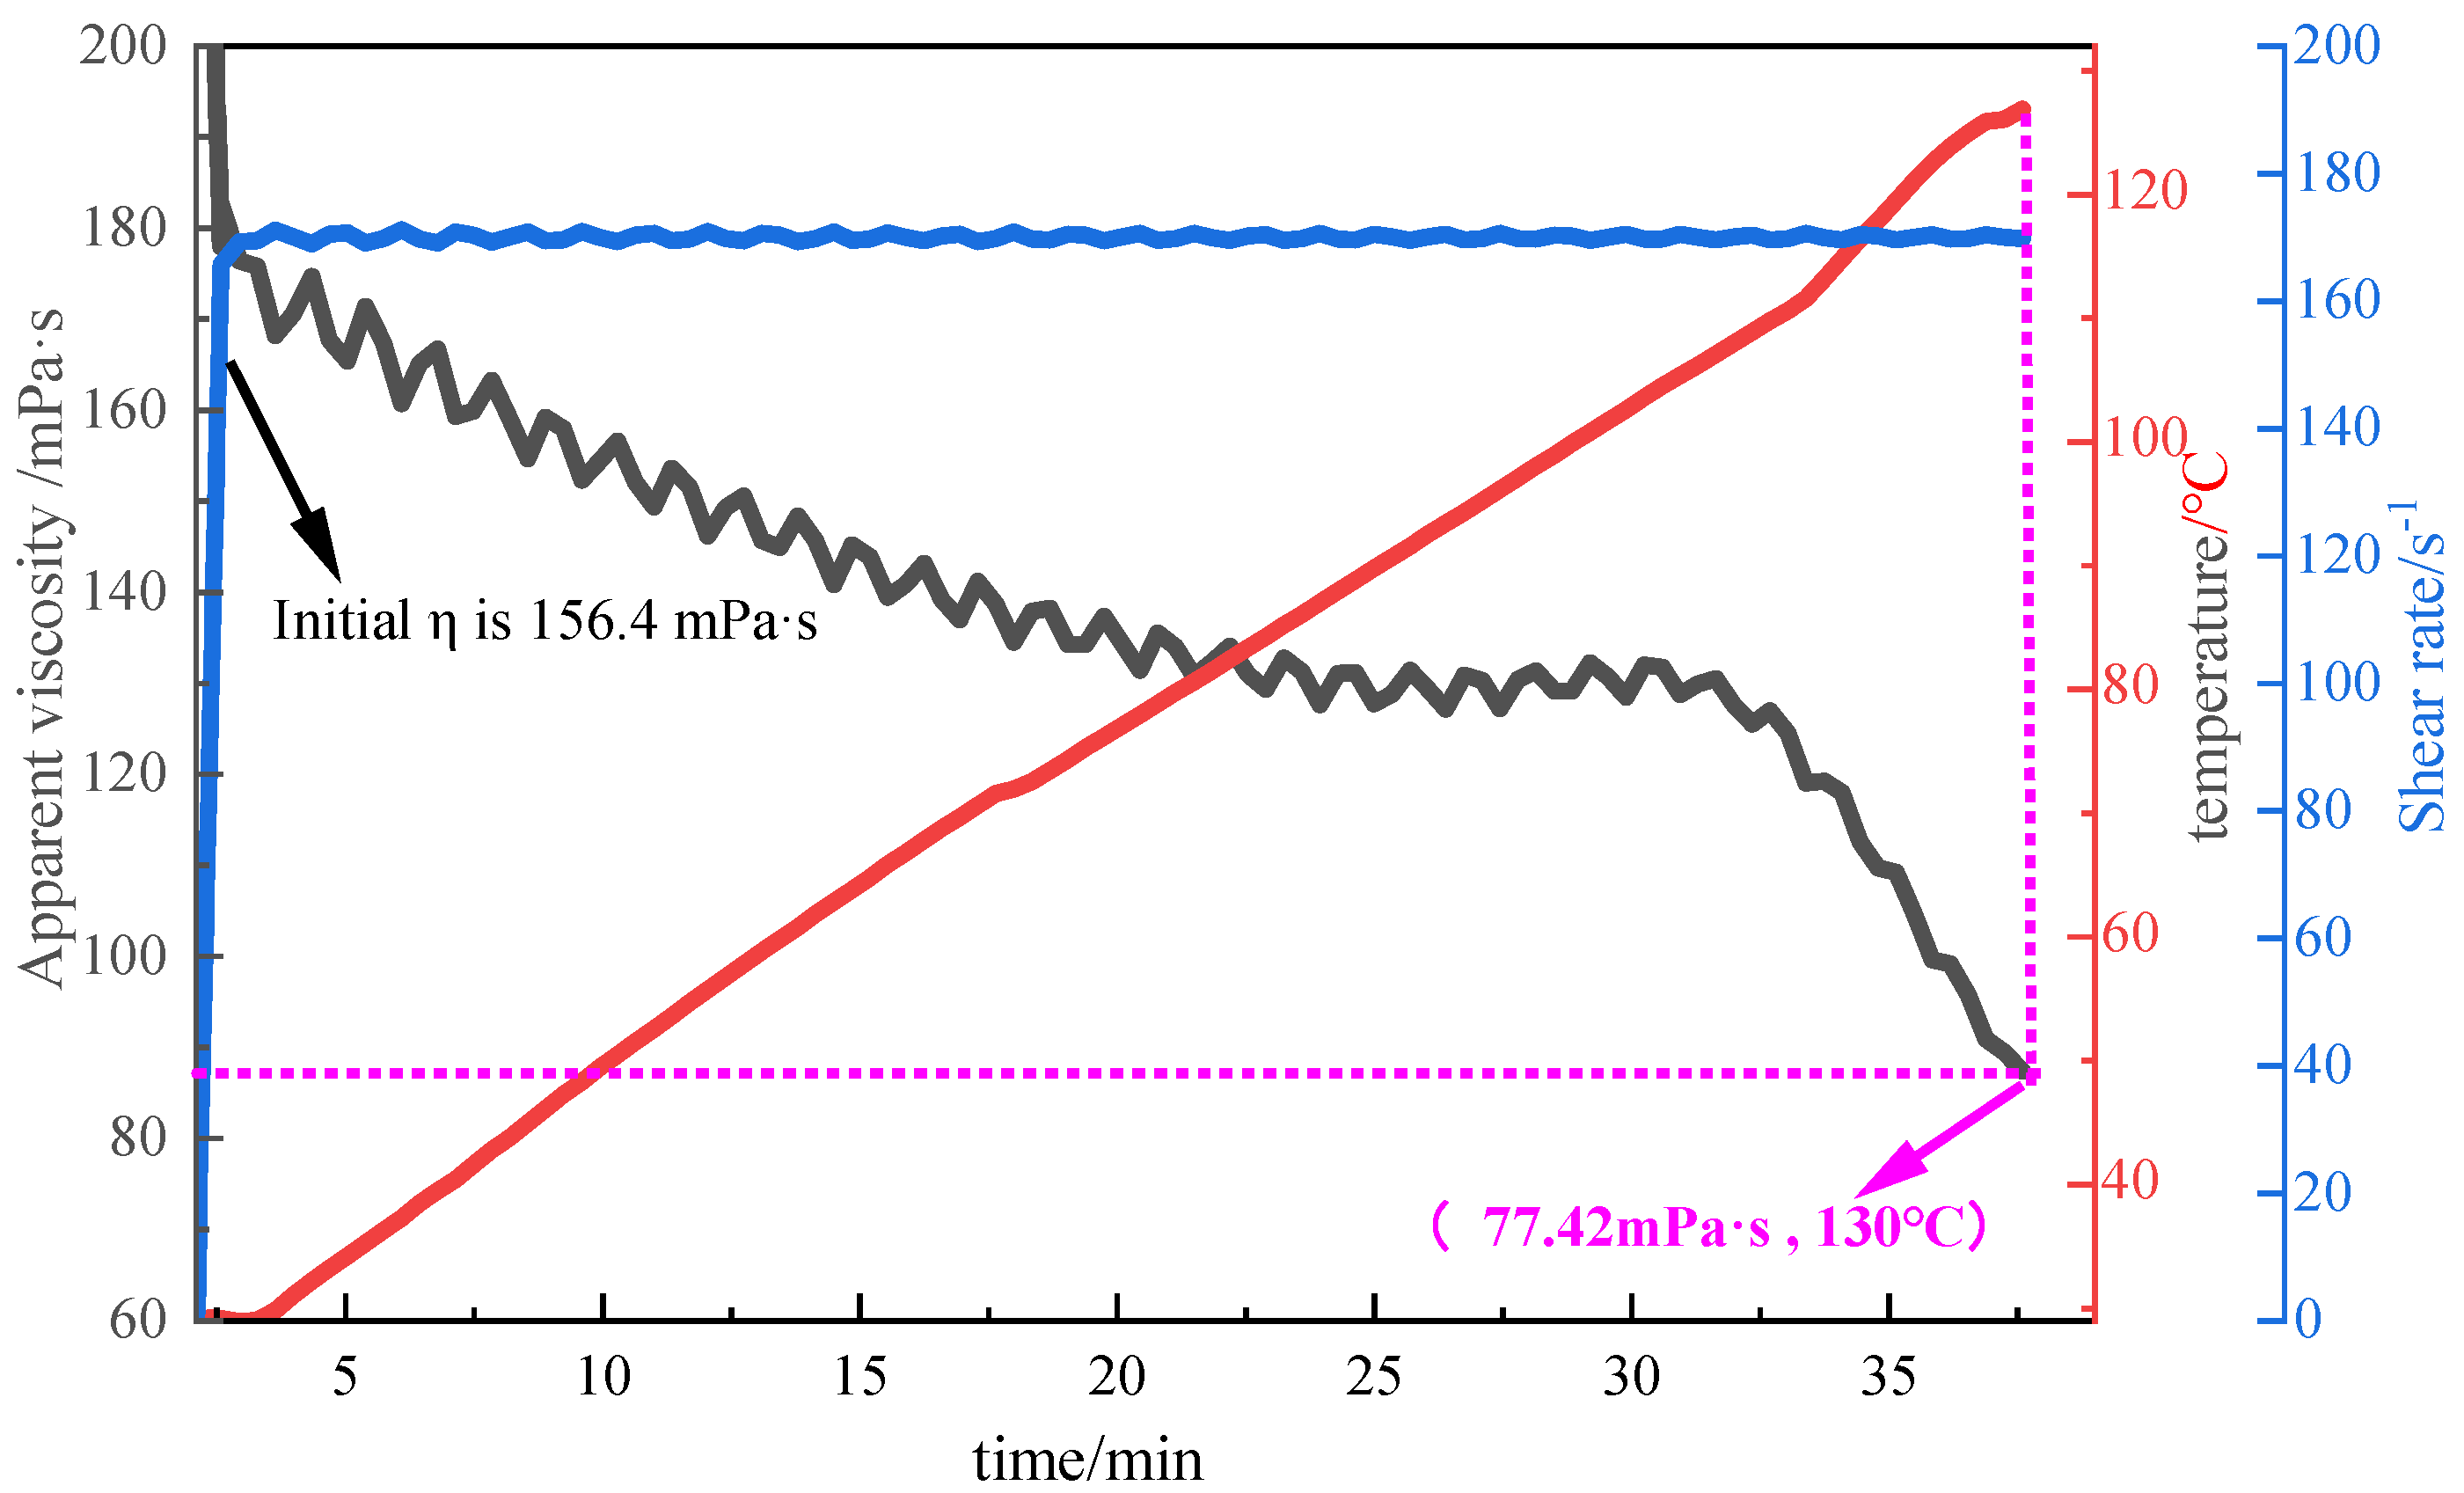
Figure 11.
Temperature resistance curve of 1% P(AM/AA/SSS/DMAAC-16) thickener solution.
Figure 11.
Temperature resistance curve of 1% P(AM/AA/SSS/DMAAC-16) thickener solution.
Figure 12.
Shear resistance curve of 1% P(AM/AA/SSS/DMAAC-16) thickener solution.
Figure 12.
Shear resistance curve of 1% P(AM/AA/SSS/DMAAC-16) thickener solution.
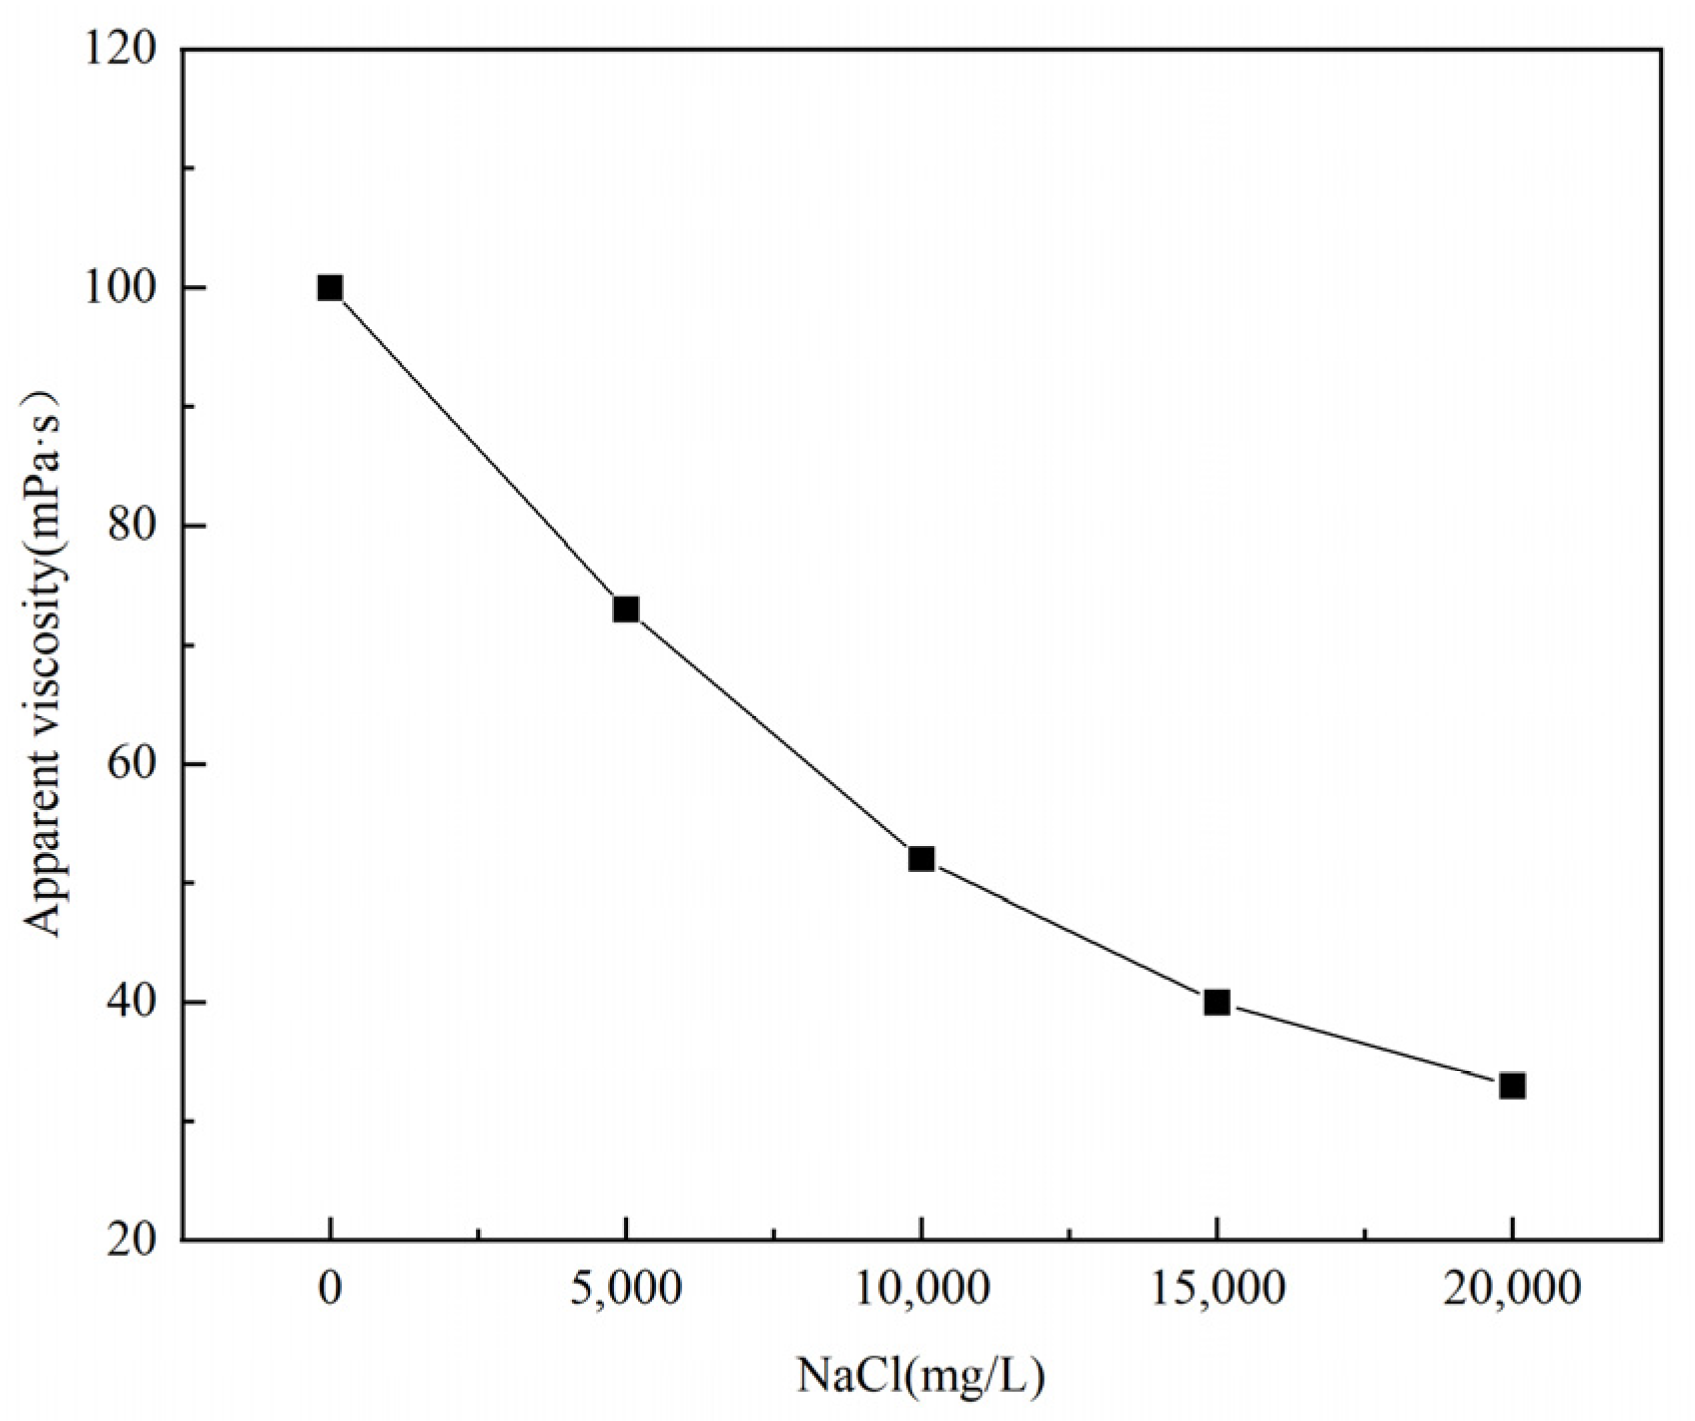
Figure 13.
Effect of NaCl concentration on the apparent viscosity of thickener solution.
Figure 13.
Effect of NaCl concentration on the apparent viscosity of thickener solution.
Figure 14.
Effect of CaCl2 concentration on the apparent viscosity of thickener solution.
Figure 14.
Effect of CaCl2 concentration on the apparent viscosity of thickener solution.
Figure 15.
Stress scan of 1% thickener P(AM/AA/SSS/DMAAC-16) gel.
Figure 15.
Stress scan of 1% thickener P(AM/AA/SSS/DMAAC-16) gel.
Figure 16.
Frequency scan of 1% thickener P(AM/AA/SSS/DMAAC-16) gel.
Figure 16.
Frequency scan of 1% thickener P(AM/AA/SSS/DMAAC-16) gel.
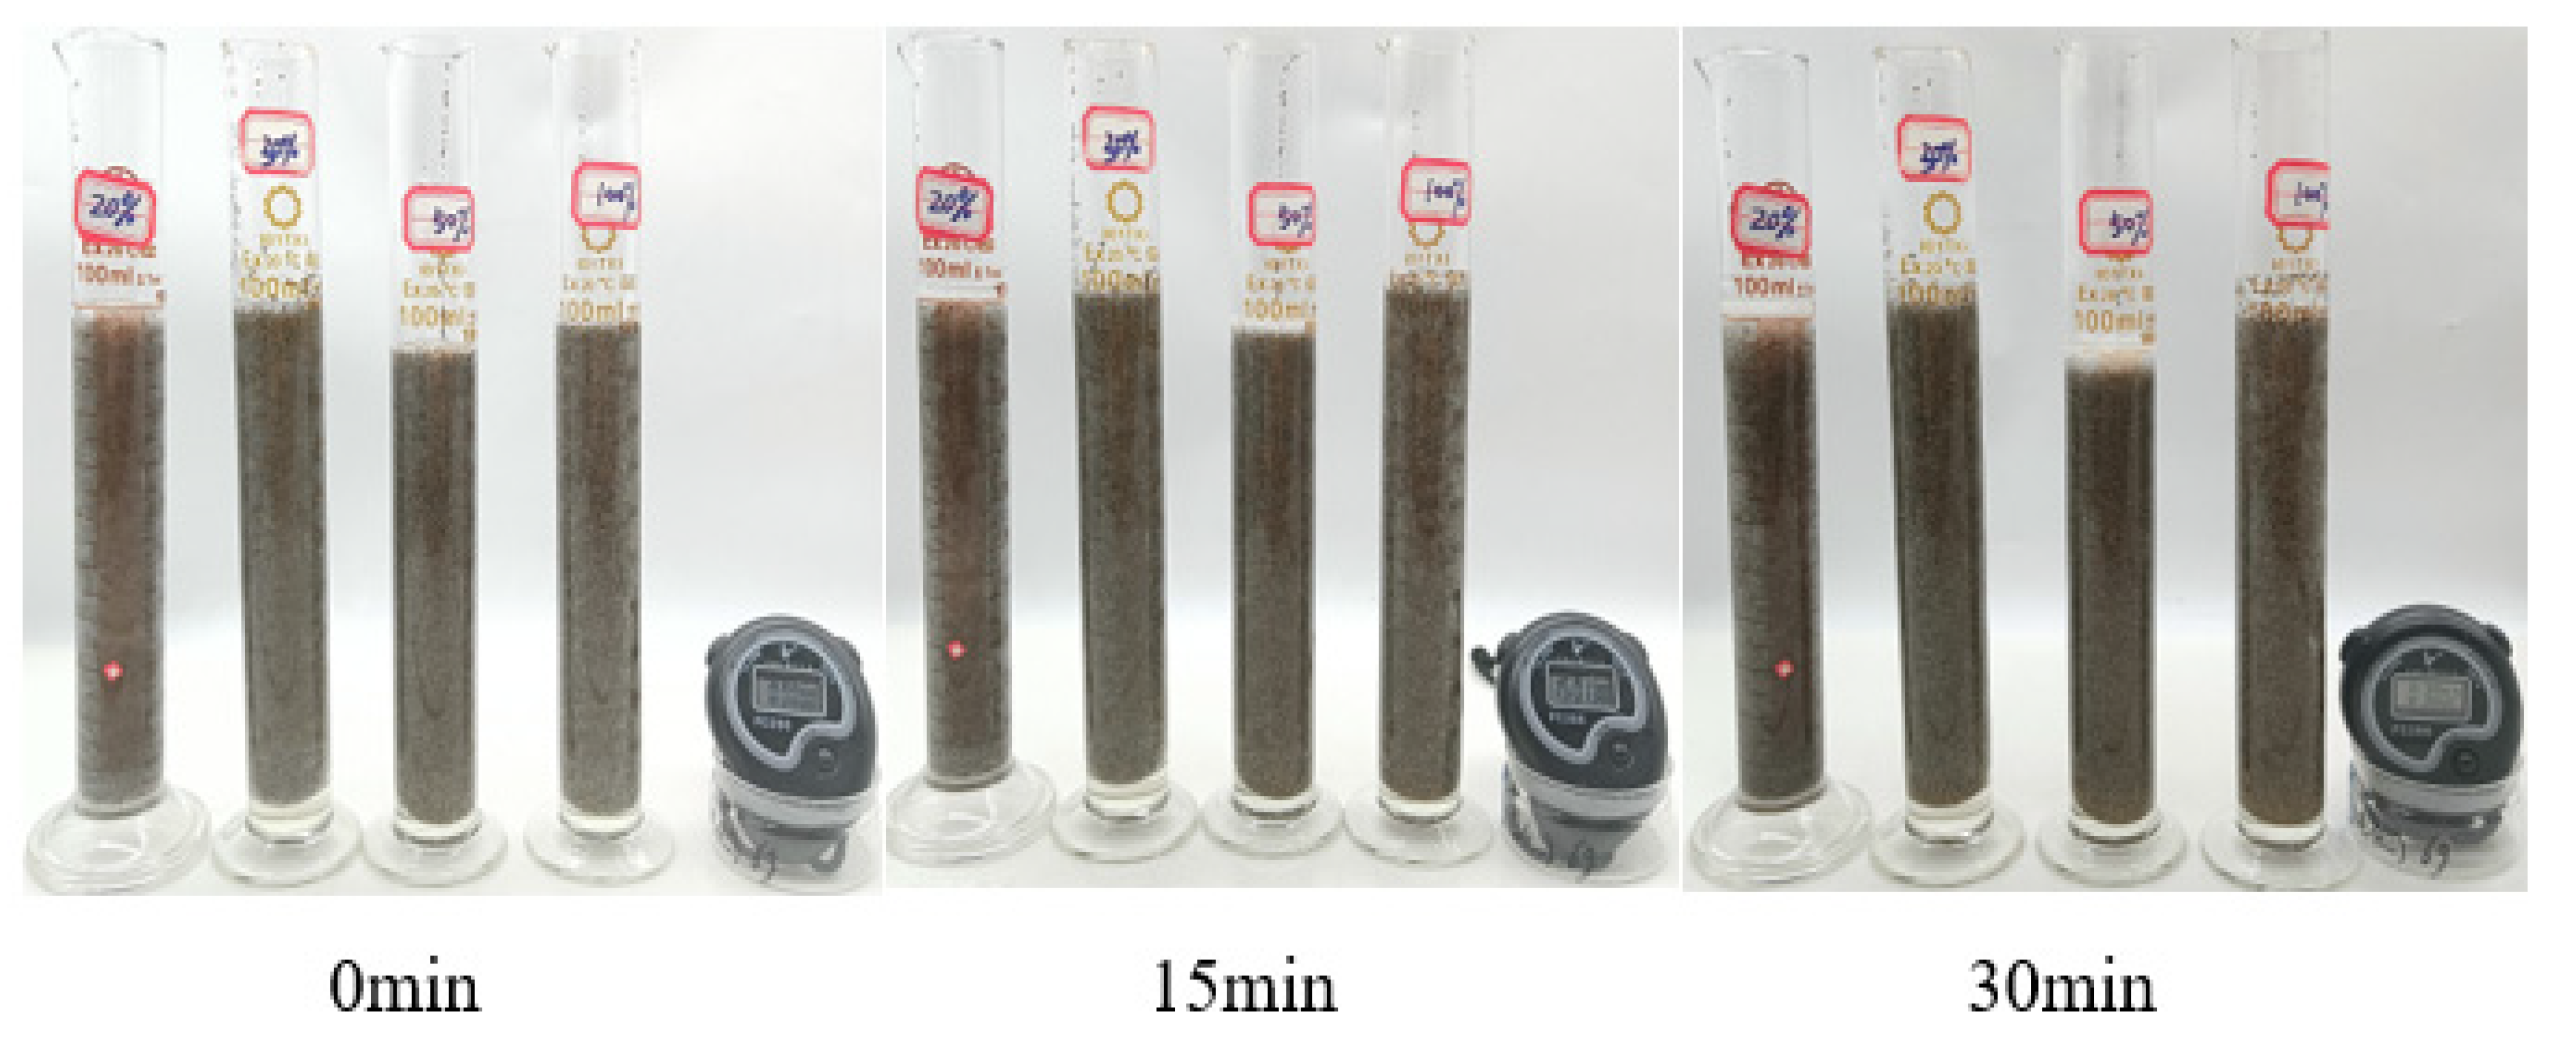
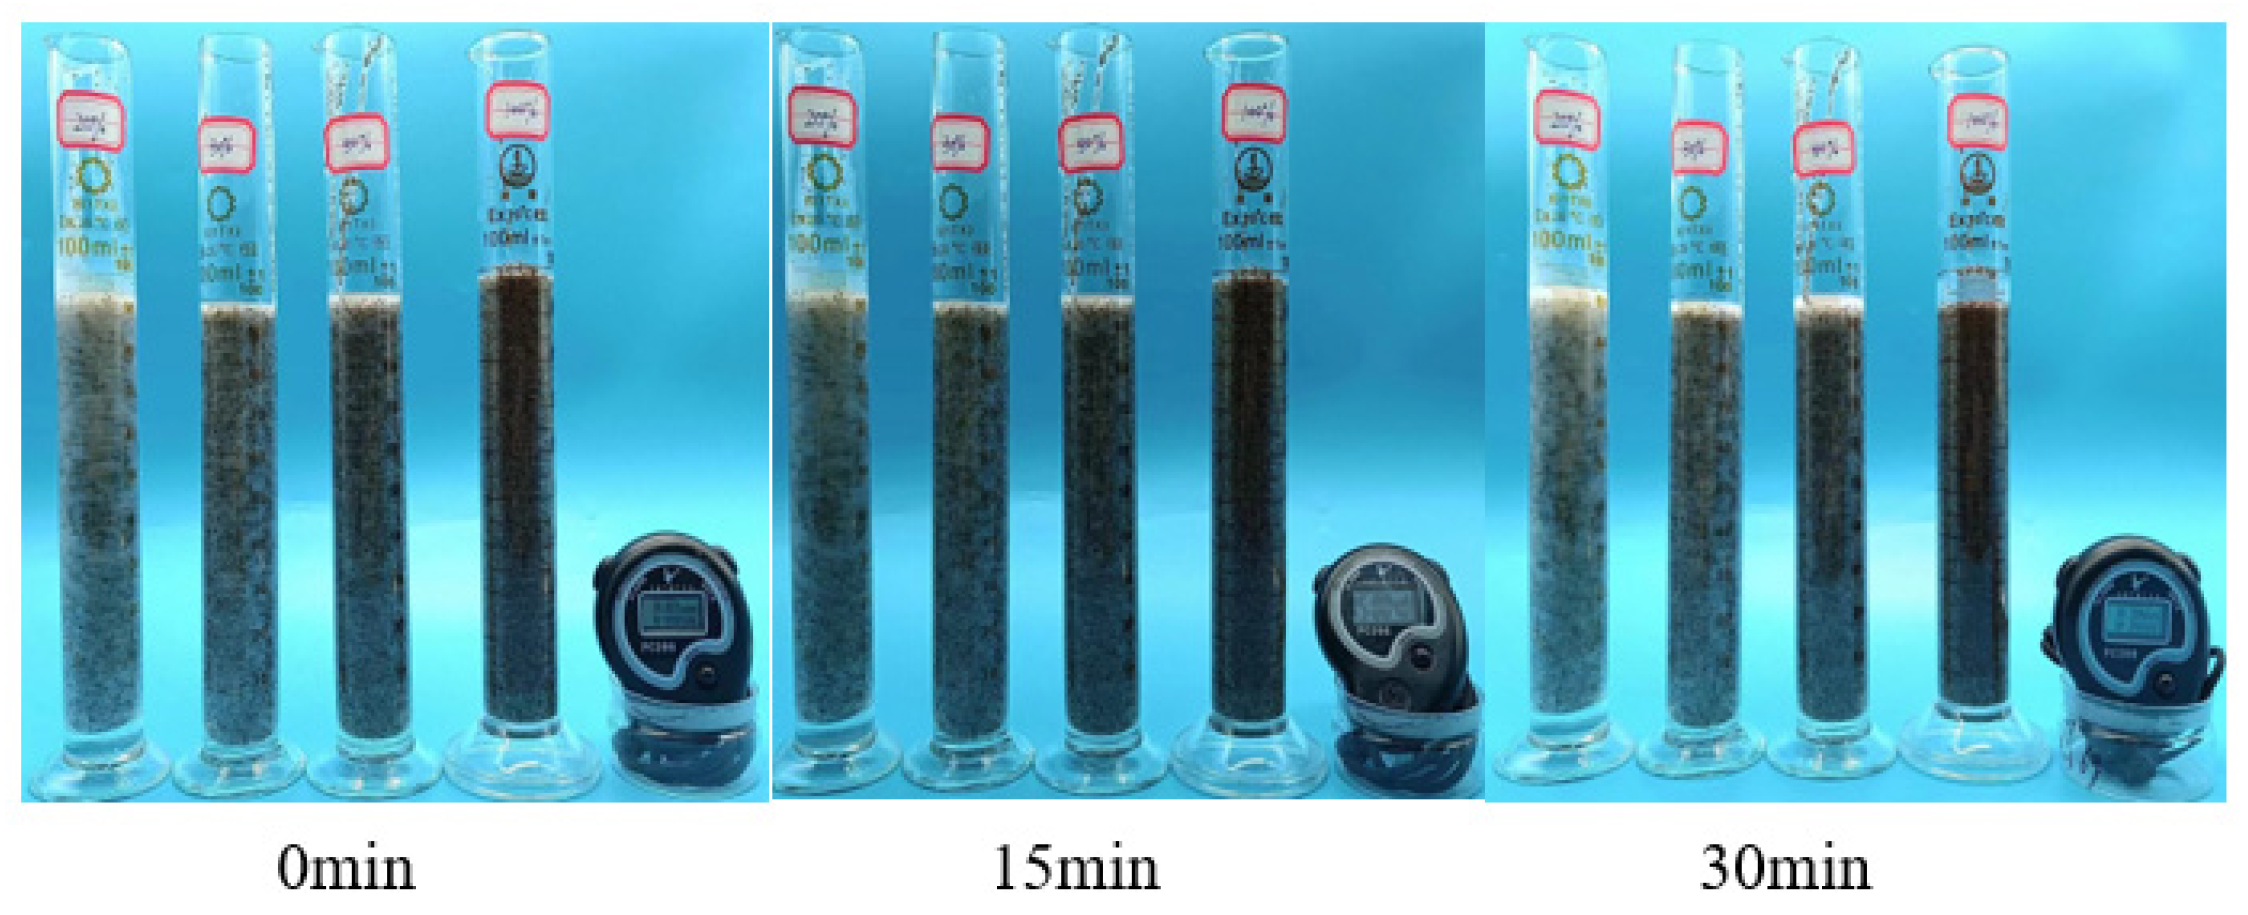
Figure 17.
Sand-carrying state diagram of 1% P(AM/AA/SSS/DMAAC-16) thickener solution—room temperature.
Figure 17.
Sand-carrying state diagram of 1% P(AM/AA/SSS/DMAAC-16) thickener solution—room temperature.
Figure 18.
Sand-carrying state of 1% P(AM/AA/SSS/DMAAC-16) thickener solution at −90 °C.
Figure 18.
Sand-carrying state of 1% P(AM/AA/SSS/DMAAC-16) thickener solution at −90 °C.
Figure 19.
Diagram of 1% P(AM/AA/SSS/DMAAC-16) thickener solution before and after breaking at 90 °C.
Figure 19.
Diagram of 1% P(AM/AA/SSS/DMAAC-16) thickener solution before and after breaking at 90 °C.
Figure 20.
Evaluation device for water shut-off profile control.
Figure 20.
Evaluation device for water shut-off profile control.
Figure 21.
Test of thickening performance of thickener in fracturing fluid flowback fluid.
Figure 21.
Test of thickening performance of thickener in fracturing fluid flowback fluid.
Figure 22.
Temperature resistance curve of 2% P(AM/AA/SSS/DMAAC-16) thickener flowback solution.
Figure 22.
Temperature resistance curve of 2% P(AM/AA/SSS/DMAAC-16) thickener flowback solution.
Figure 23.
Shear resistance curve of 2% P(AM/AA/SSS/DMAAC-16) thickener flowback fluid.
Figure 23.
Shear resistance curve of 2% P(AM/AA/SSS/DMAAC-16) thickener flowback fluid.
Figure 24.
Diagram of the sand-carrying state of 1% P(AM/AA/SSS/DMAAC-16) thickener flowback liquid.
Figure 24.
Diagram of the sand-carrying state of 1% P(AM/AA/SSS/DMAAC-16) thickener flowback liquid.
Figure 25.
XRD spectra of thickener P(AM/AA/SSS/DMAAC-16).
Figure 25.
XRD spectra of thickener P(AM/AA/SSS/DMAAC-16).
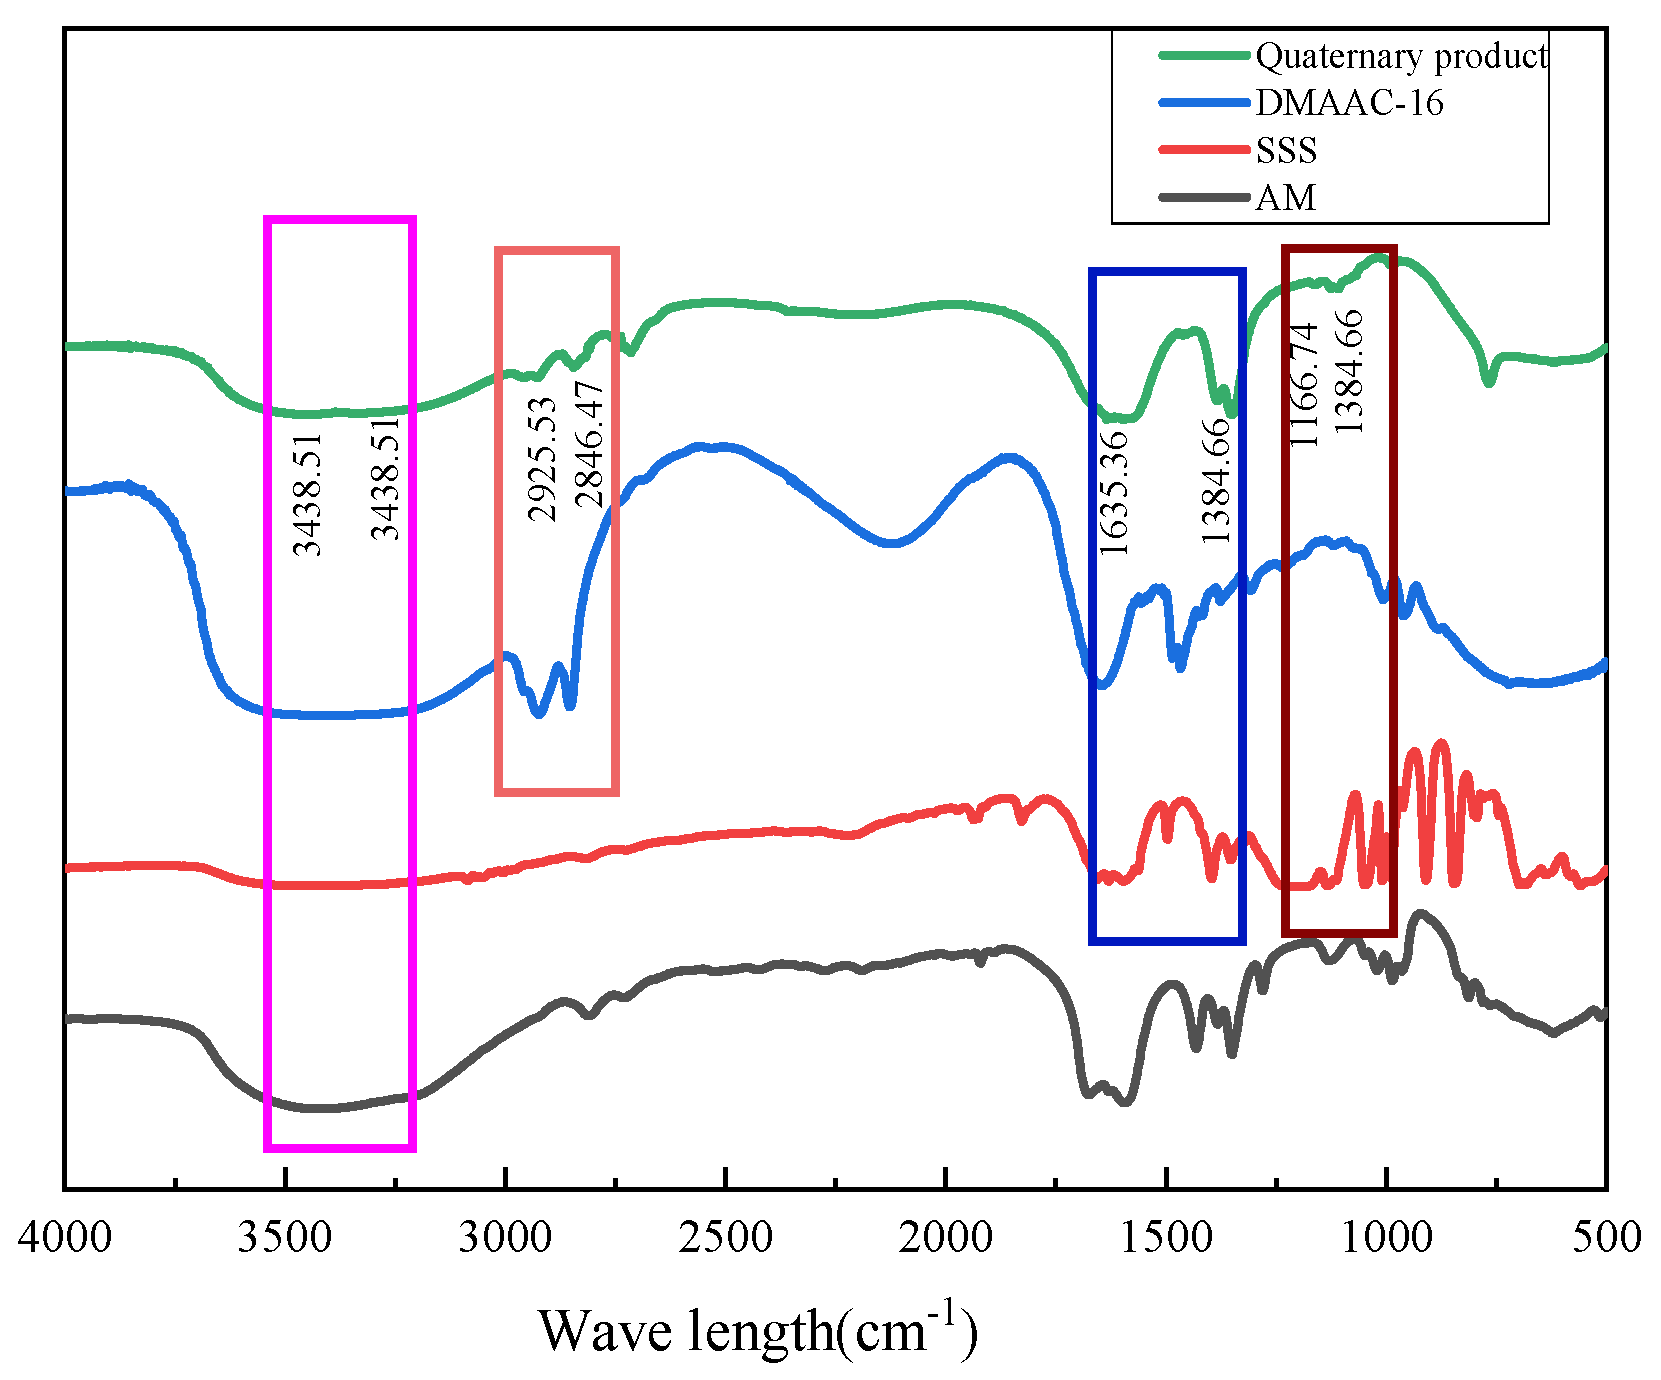
Figure 26.
Infrared spectra of thickener P(AM/AA/SSS/DMAAC-16).
Figure 26.
Infrared spectra of thickener P(AM/AA/SSS/DMAAC-16).
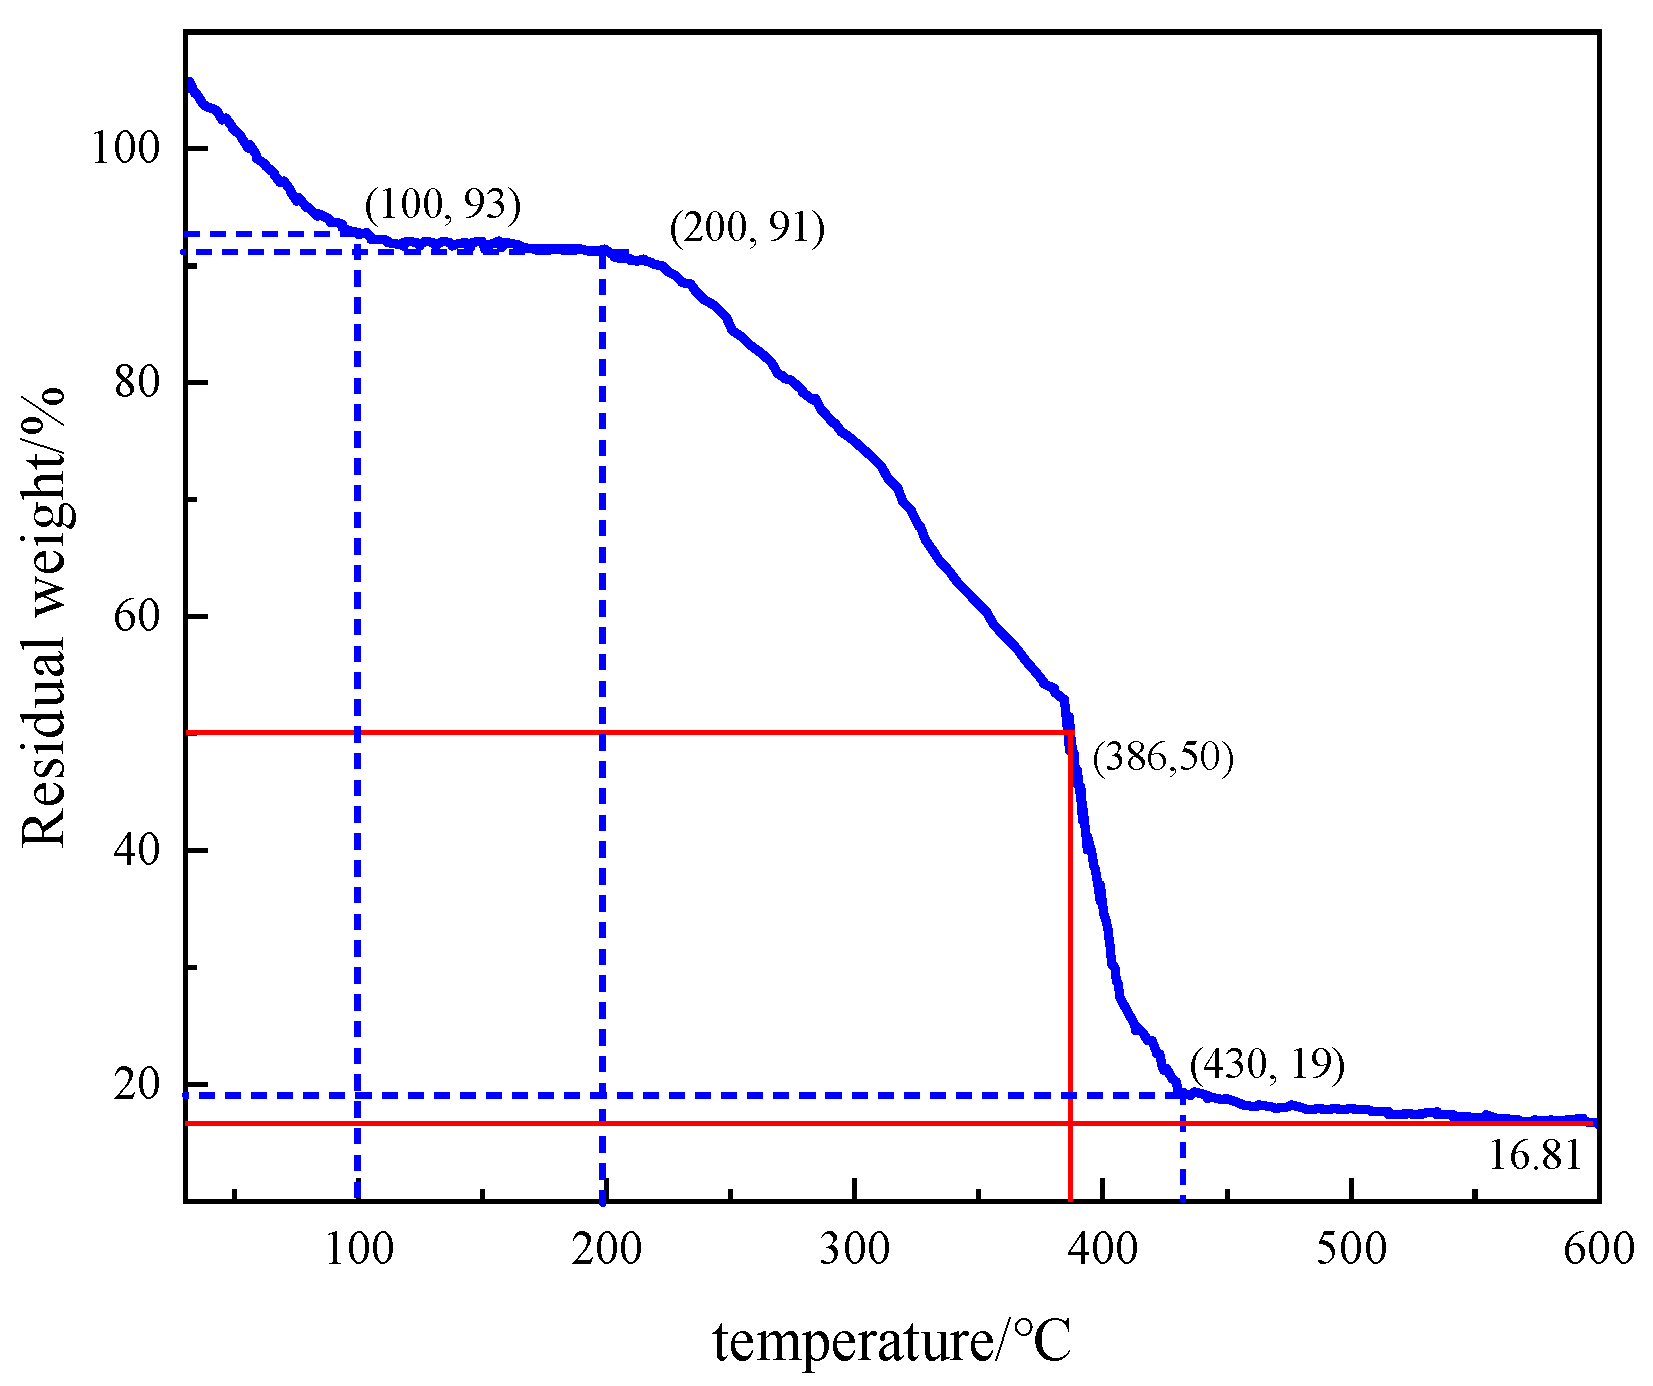
Figure 27.
Thermogravimetric analysis of the thickener P(AM/AA/SSS/DMAAC-16).
Figure 27.
Thermogravimetric analysis of the thickener P(AM/AA/SSS/DMAAC-16).
Table 1.
Effect of monomer molar ratio on apparent viscosity of P(AM/SS/SSS/DMAAC-16) gel.
Table 1.
Effect of monomer molar ratio on apparent viscosity of P(AM/SS/SSS/DMAAC-16) gel.
| Serial Number | n(AM):n(AA):n(SSS):n(DMAAC-16) | Apparent Viscosity (mPa·s) |
|---|
| 1 | 83.2:16:0.4:0.4 | 82 |
| 2 | 81.2:18:0.4:0.4 | 86 |
| 3 | 79.2:20:0.4:0.4 | 92 |
| 4 | 77.2:22:0.4:0.4 | 72 |
| 5 | 79.2:20:0.3:0.5 | 68 |
| 6 | 79.2:20:0.2:0.6 | 53 |
| 7 | 79.2:20:0.5:0.3 | 109 |
| 8 | 79.2:20:0.6:0.2 | 86 |
Table 2.
Evaluation of the sand-carrying capacity of the thickener solution.
Table 2.
Evaluation of the sand-carrying capacity of the thickener solution.
| Aggregation System | Ratio of Sand and Liquids/% | Sedimentation Rate (cm/min) |
|---|
| Room Temperature 90 °C |
|---|
| P(AM/AA/SSS/DMAAC-16) | 20 | 0.023 | 0.033 |
| 30 | 0.031 | 0.040 |
| 50 | 0.042 | 0.053 |
| 100 | 0.062 | 0.064 |
Table 3.
Evaluation of gel breaking performance of thickener solution.
Table 3.
Evaluation of gel breaking performance of thickener solution.
| Type of Solution | Gel Breaking Time (h) | Apparent Viscosity of Gel Breaking Solution (mPa·s) | The Surface Tension of the Gel Breaking Solution (mN/m) | Gel Breaking Interface Tension (mN/m) | Residue Content (mg/L) |
|---|
| 1% Thickener gel (cm3/s) | 4 | 4.515 | 27.3 | 1.689 | 123 |
Table 4.
Test data of fracture breaking fluid on core permeability damage rate.
Table 4.
Test data of fracture breaking fluid on core permeability damage rate.
| Test Temperature (°C) | Flowing Medium | Core Damage Specifications | Core Permeability (μm2) | Damage Rate (%) |
|---|
| Length (cm3/s) | Diameter (cm3/s) | Before Damage K1 | After Damage K2 |
|---|
| 60 | Gel breaking | 4.876 | 2.53 | 0.073 | 0.052 | 28.77 |
Table 5.
Evaluation of the sand-carrying capacity of the thickener solution and flowback solution.
Table 5.
Evaluation of the sand-carrying capacity of the thickener solution and flowback solution.
| Aggregation System | Ratio of Sand and Liquids/% | Sedimentation Velocity (cm/min) |
|---|
| P(AM/AA/SSS/DMAAC-16) | 20 | 0.018 |
| 30 | 0.023 |
| 50 | 0.034 |
| 100 | 0.058 |
Table 6.
Evaluation of gel breaking performance of thickener solution flowback liquid.
Table 6.
Evaluation of gel breaking performance of thickener solution flowback liquid.
| Type of Solution | Gel Breaking Time (h) | Apparent Viscosity of Gel Breaking Solution (mPa·s) | The Surface Tension of the Gel Breaking Solution (mN/m) | Gel Breaking Interface Tension (mN/m) | Residue Content (mg/L) |
|---|
| 1% thickener solution—flowback solution | 4 | 4.768 | 28.2 | 1.739 | 198 |
Table 7.
Relative molecular mass test of thickener P (AM/SS/SSS/DMAAC-16).
Table 7.
Relative molecular mass test of thickener P (AM/SS/SSS/DMAAC-16).
| Polymers | t0 (s) | t (s) | ηr | [η] (dl·g−1) | M |
|---|
| P(AM/AA/SSS/DMAAC-16) | 117 | 312 | 2.67 | 15.04 | 8,773,106 |

 ,
, 


