

Effects of Printing Orientation on the Tensile, Thermophysical, Smoke Density, and Toxicity Properties of Ultem® 9085


 , , , and
Abstract
1. Introduction
2. Materials and Methods
2.1. Materials
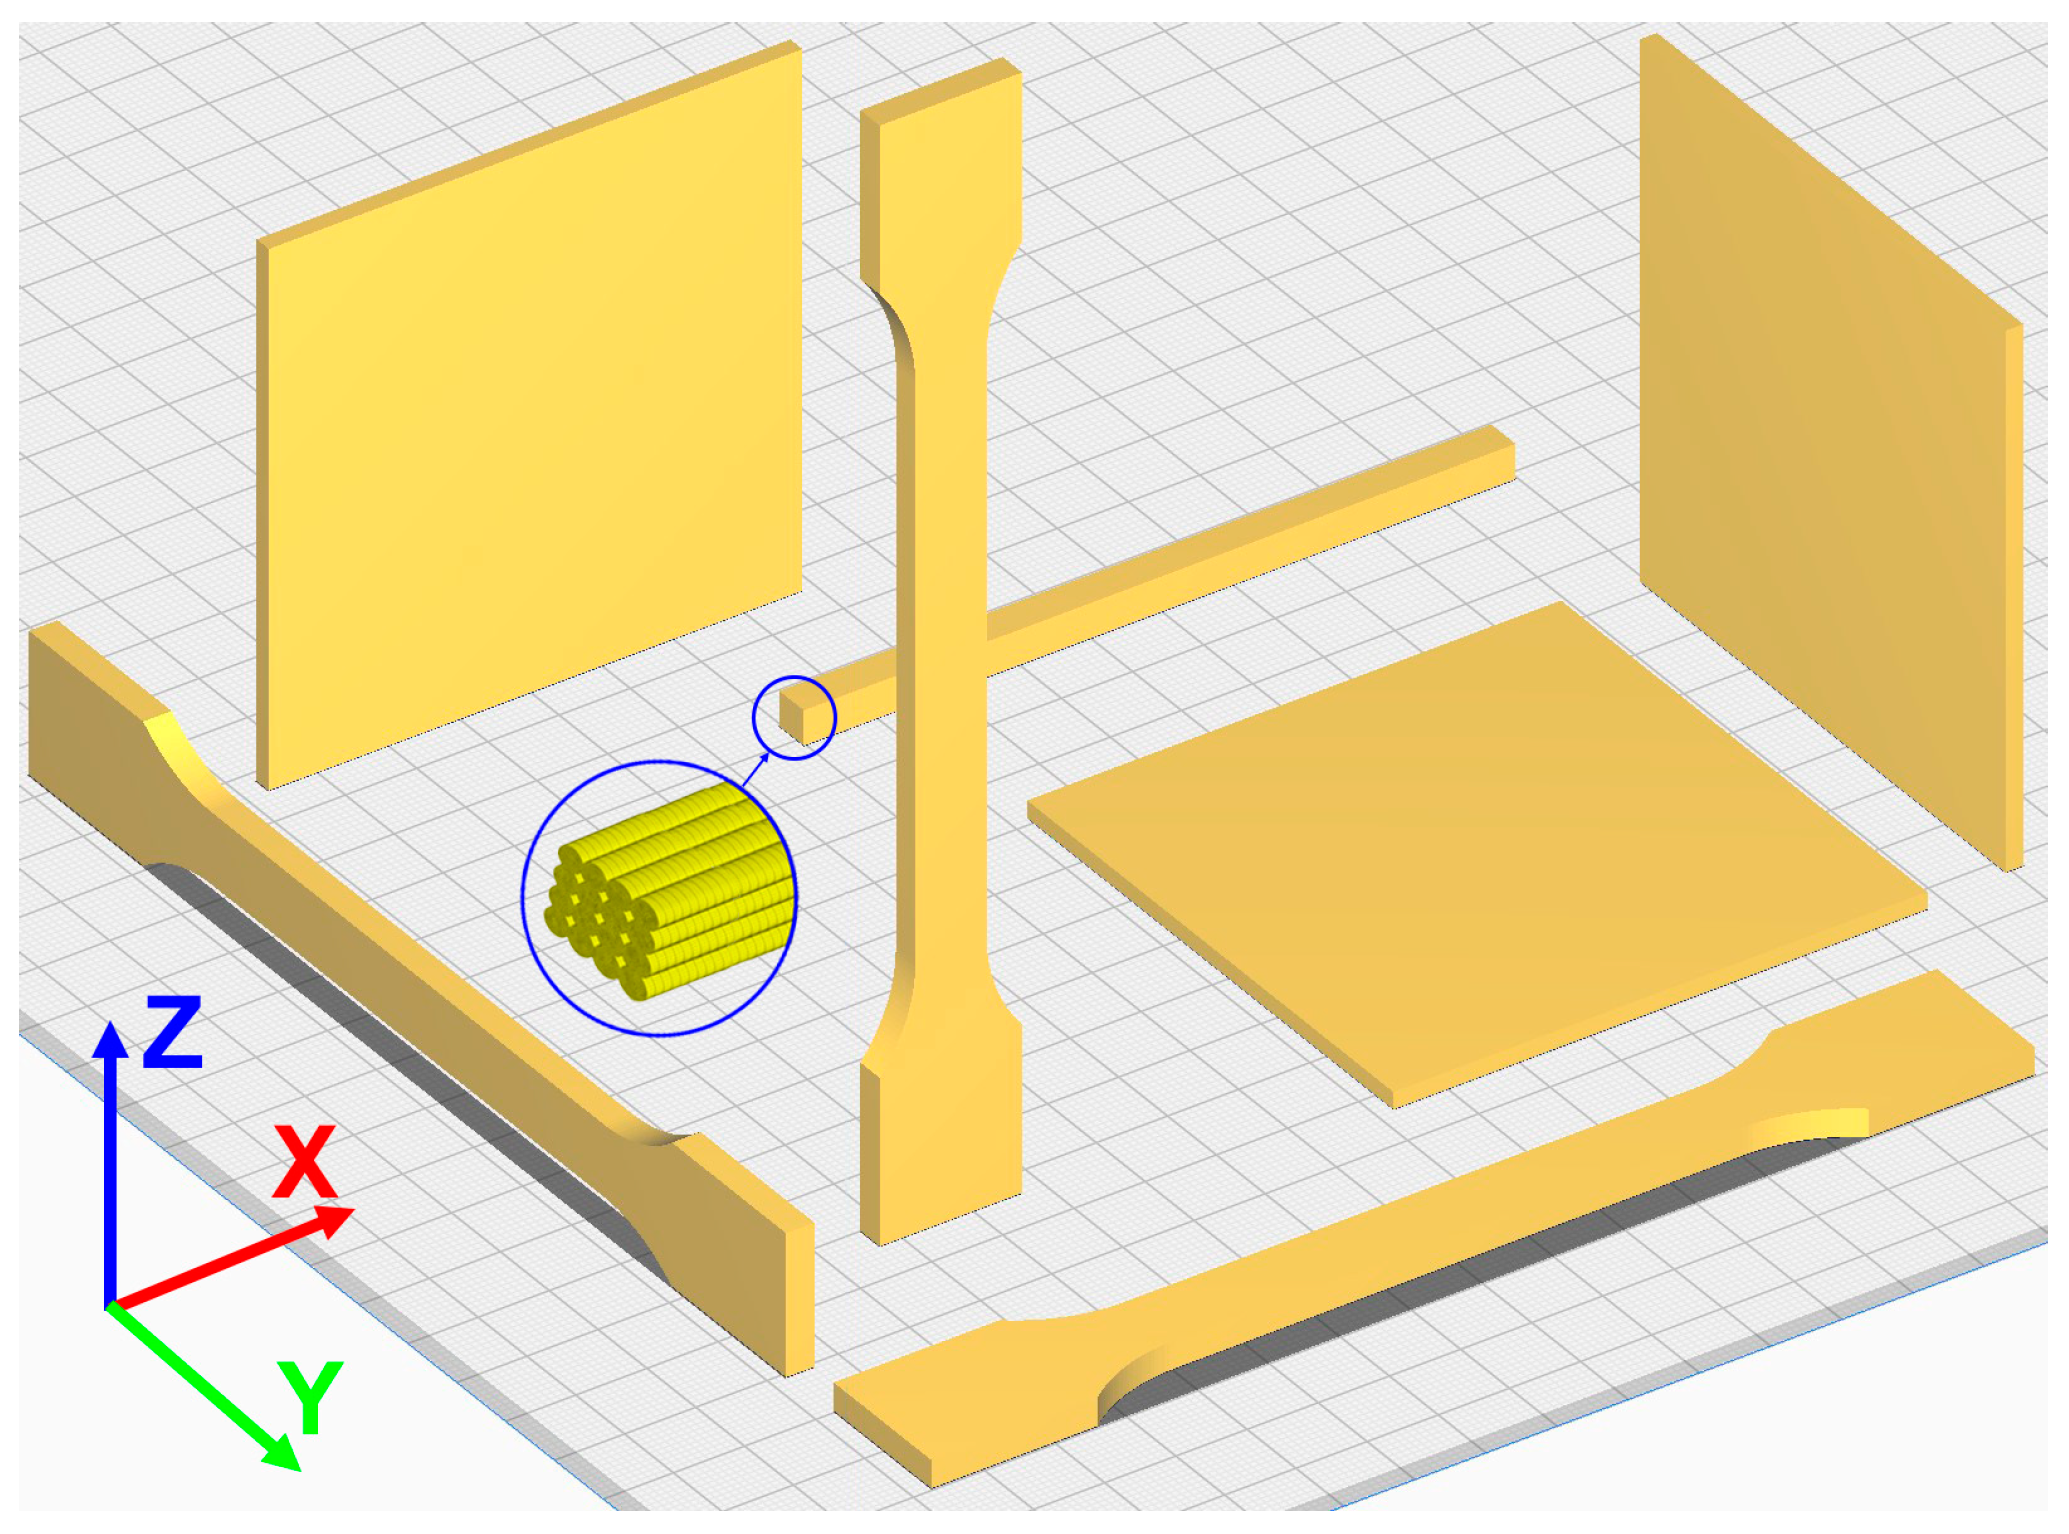
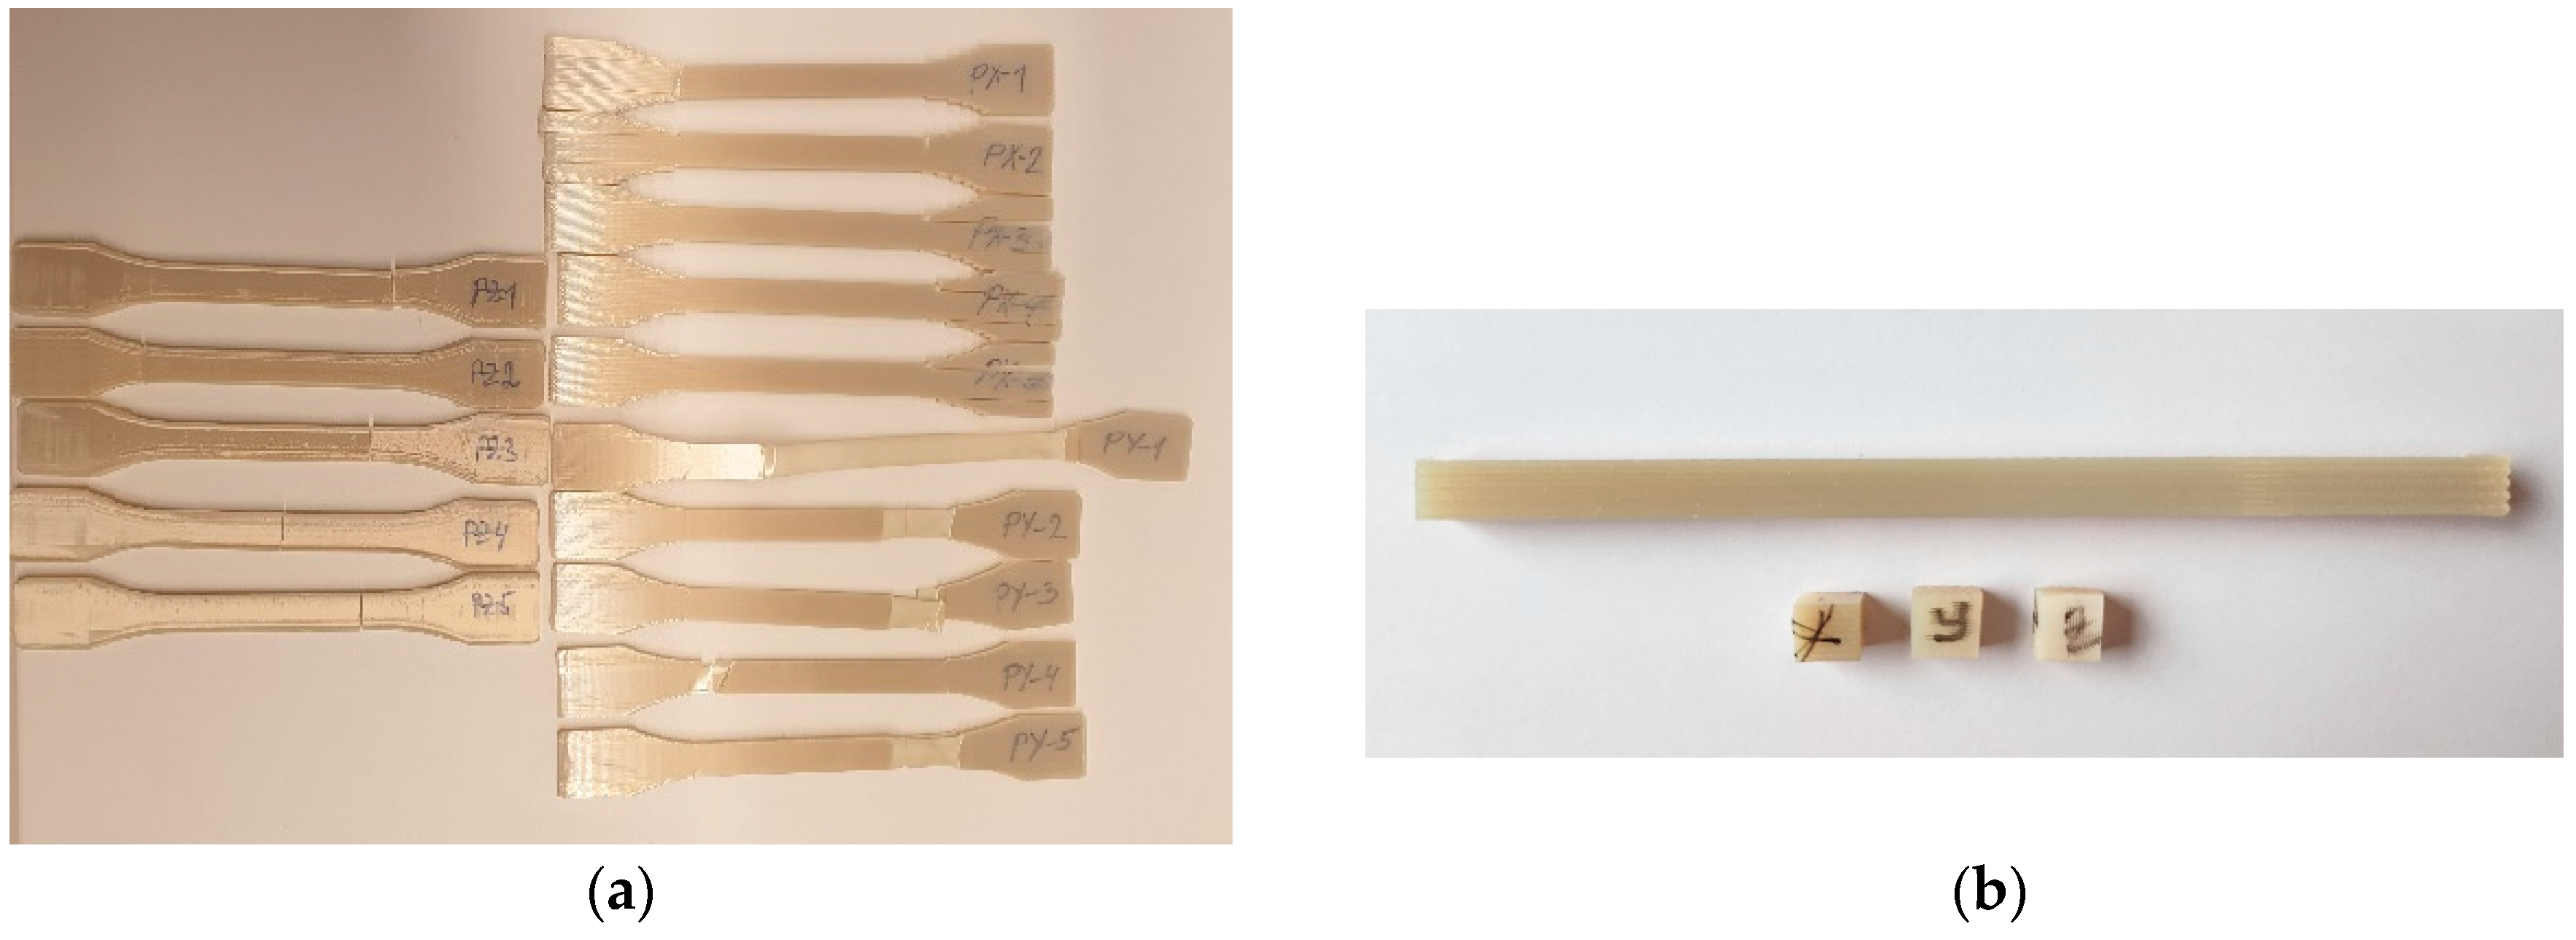
2.2. Tensile Tests
2.3. Testing of Thermophysical Properties
2.4. Smoke Density and Toxicity Tests
3. Results and Discussion
3.1. Morphology of Fracture Surfaces
3.2. Tensile Properties
3.3. Thermophysical Properties
3.3.1. Thermomechanical Analysis
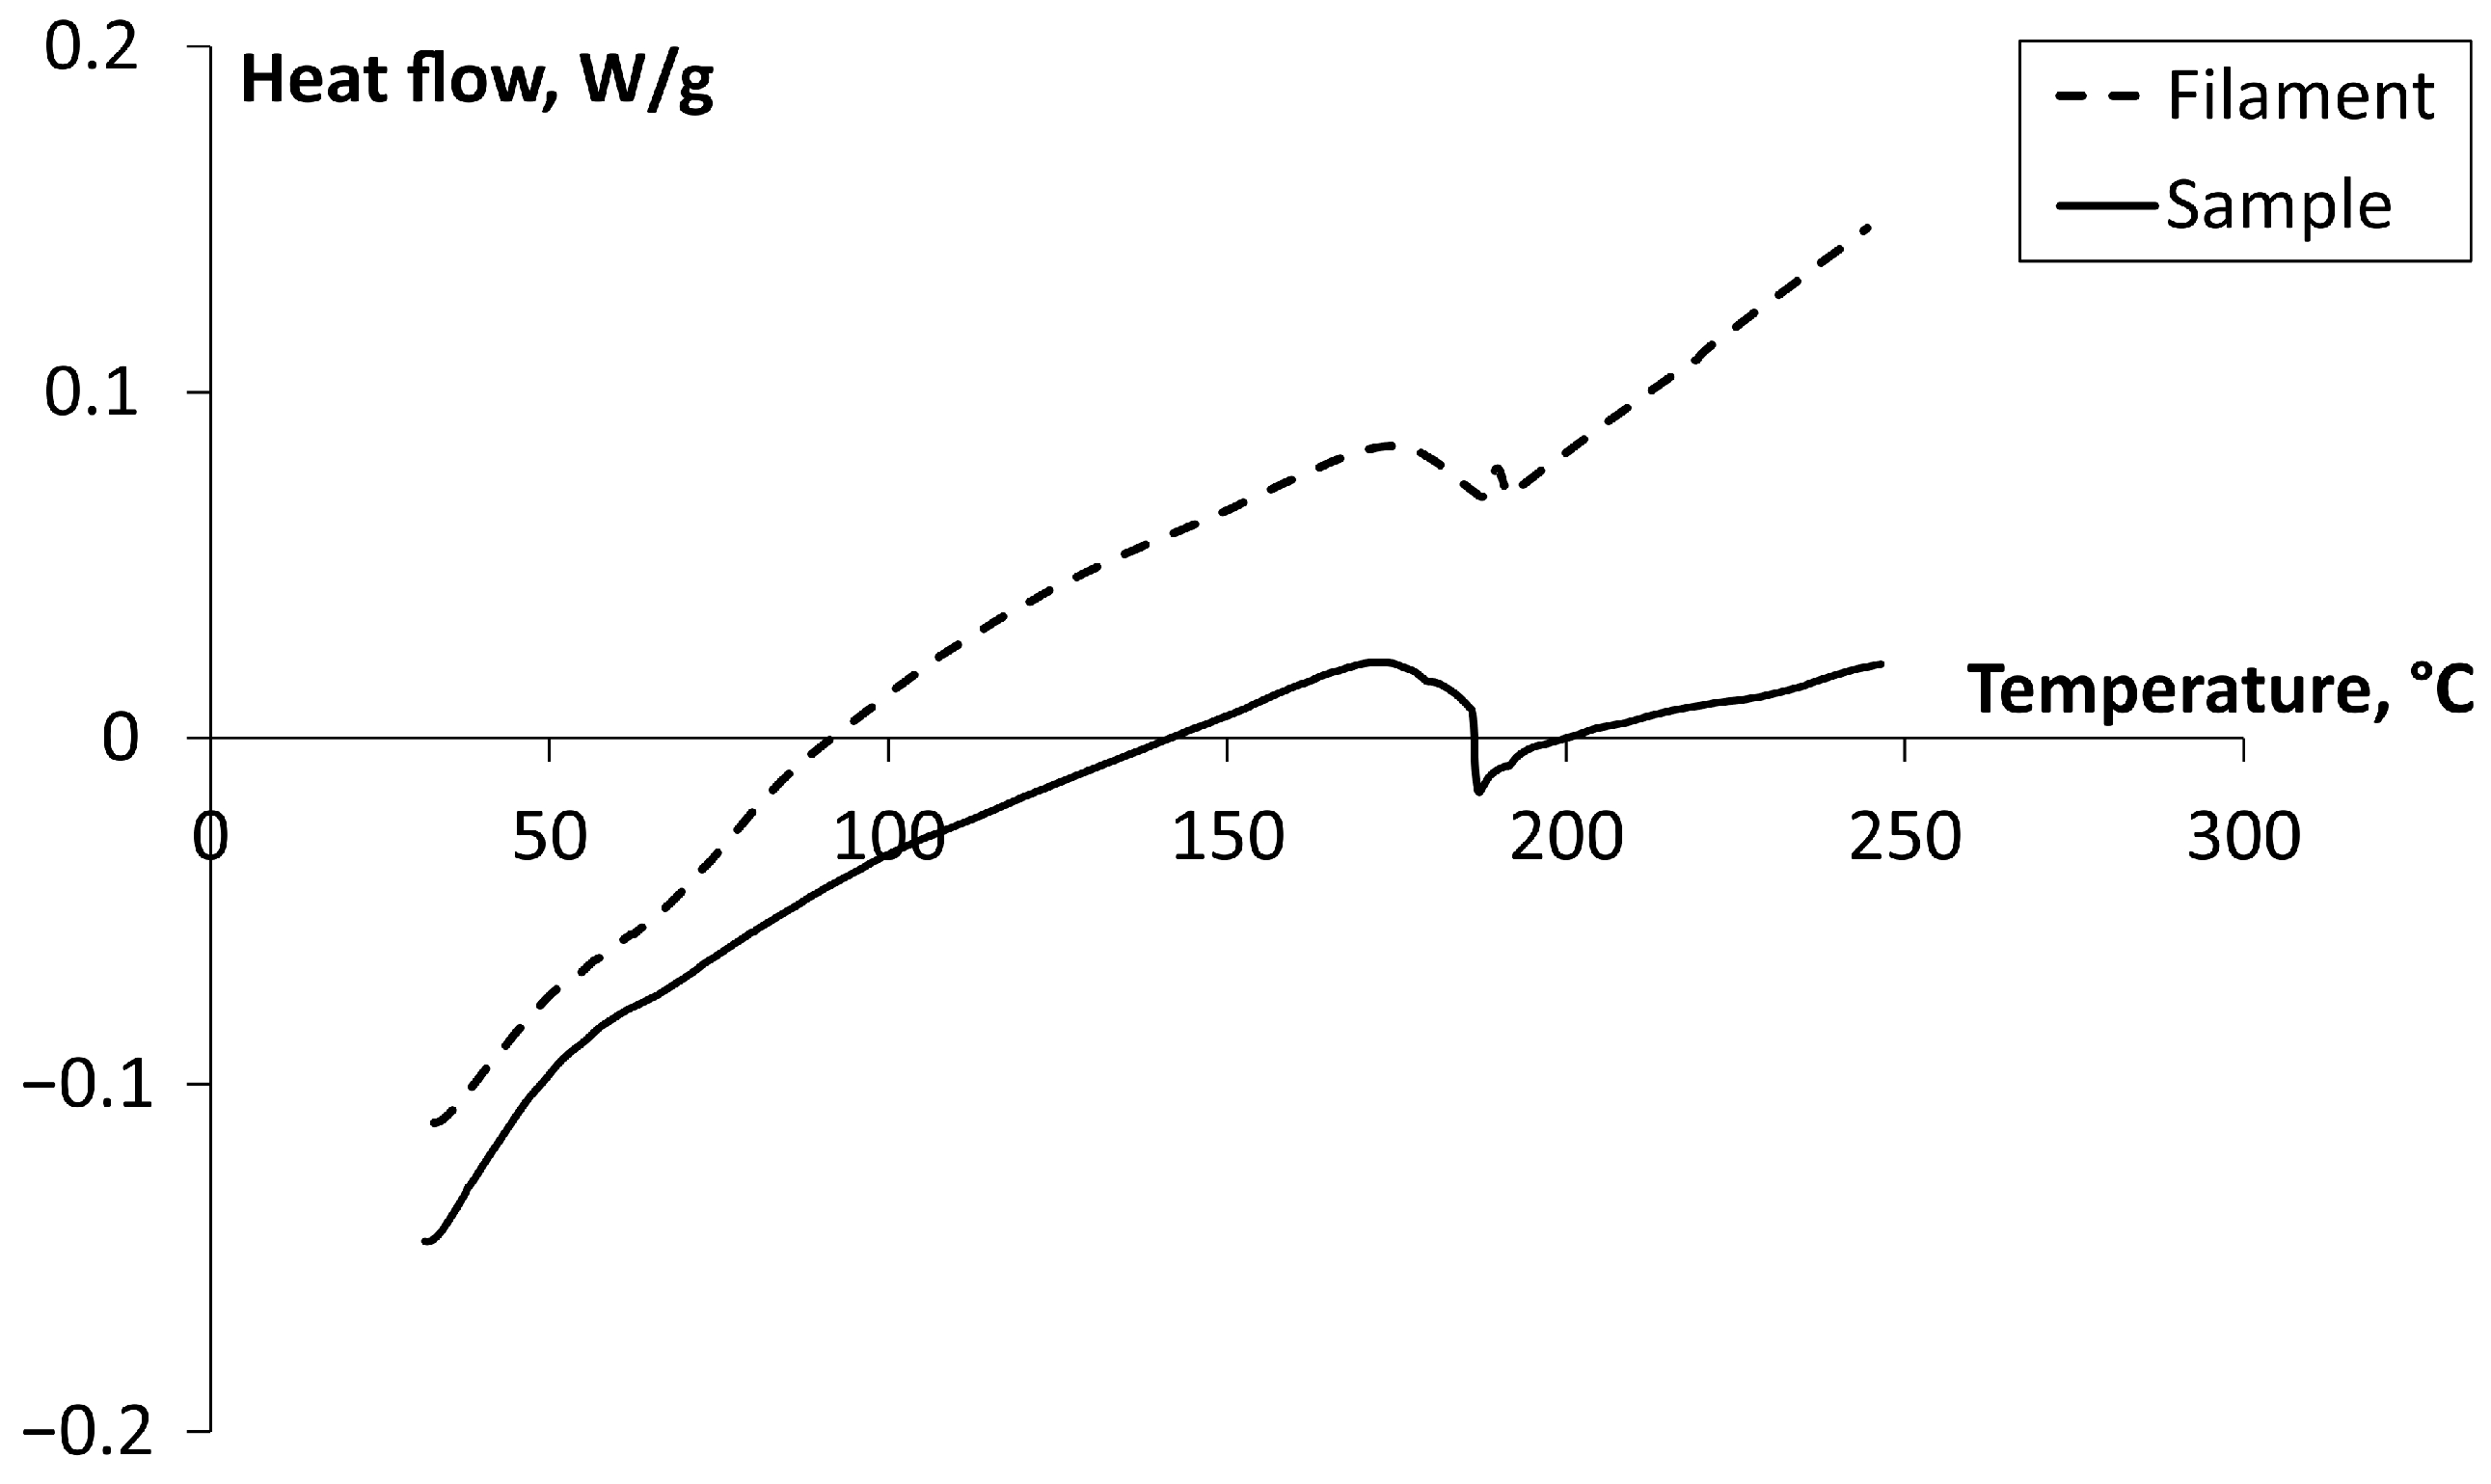
3.3.2. Differential Scanning Calorimetry
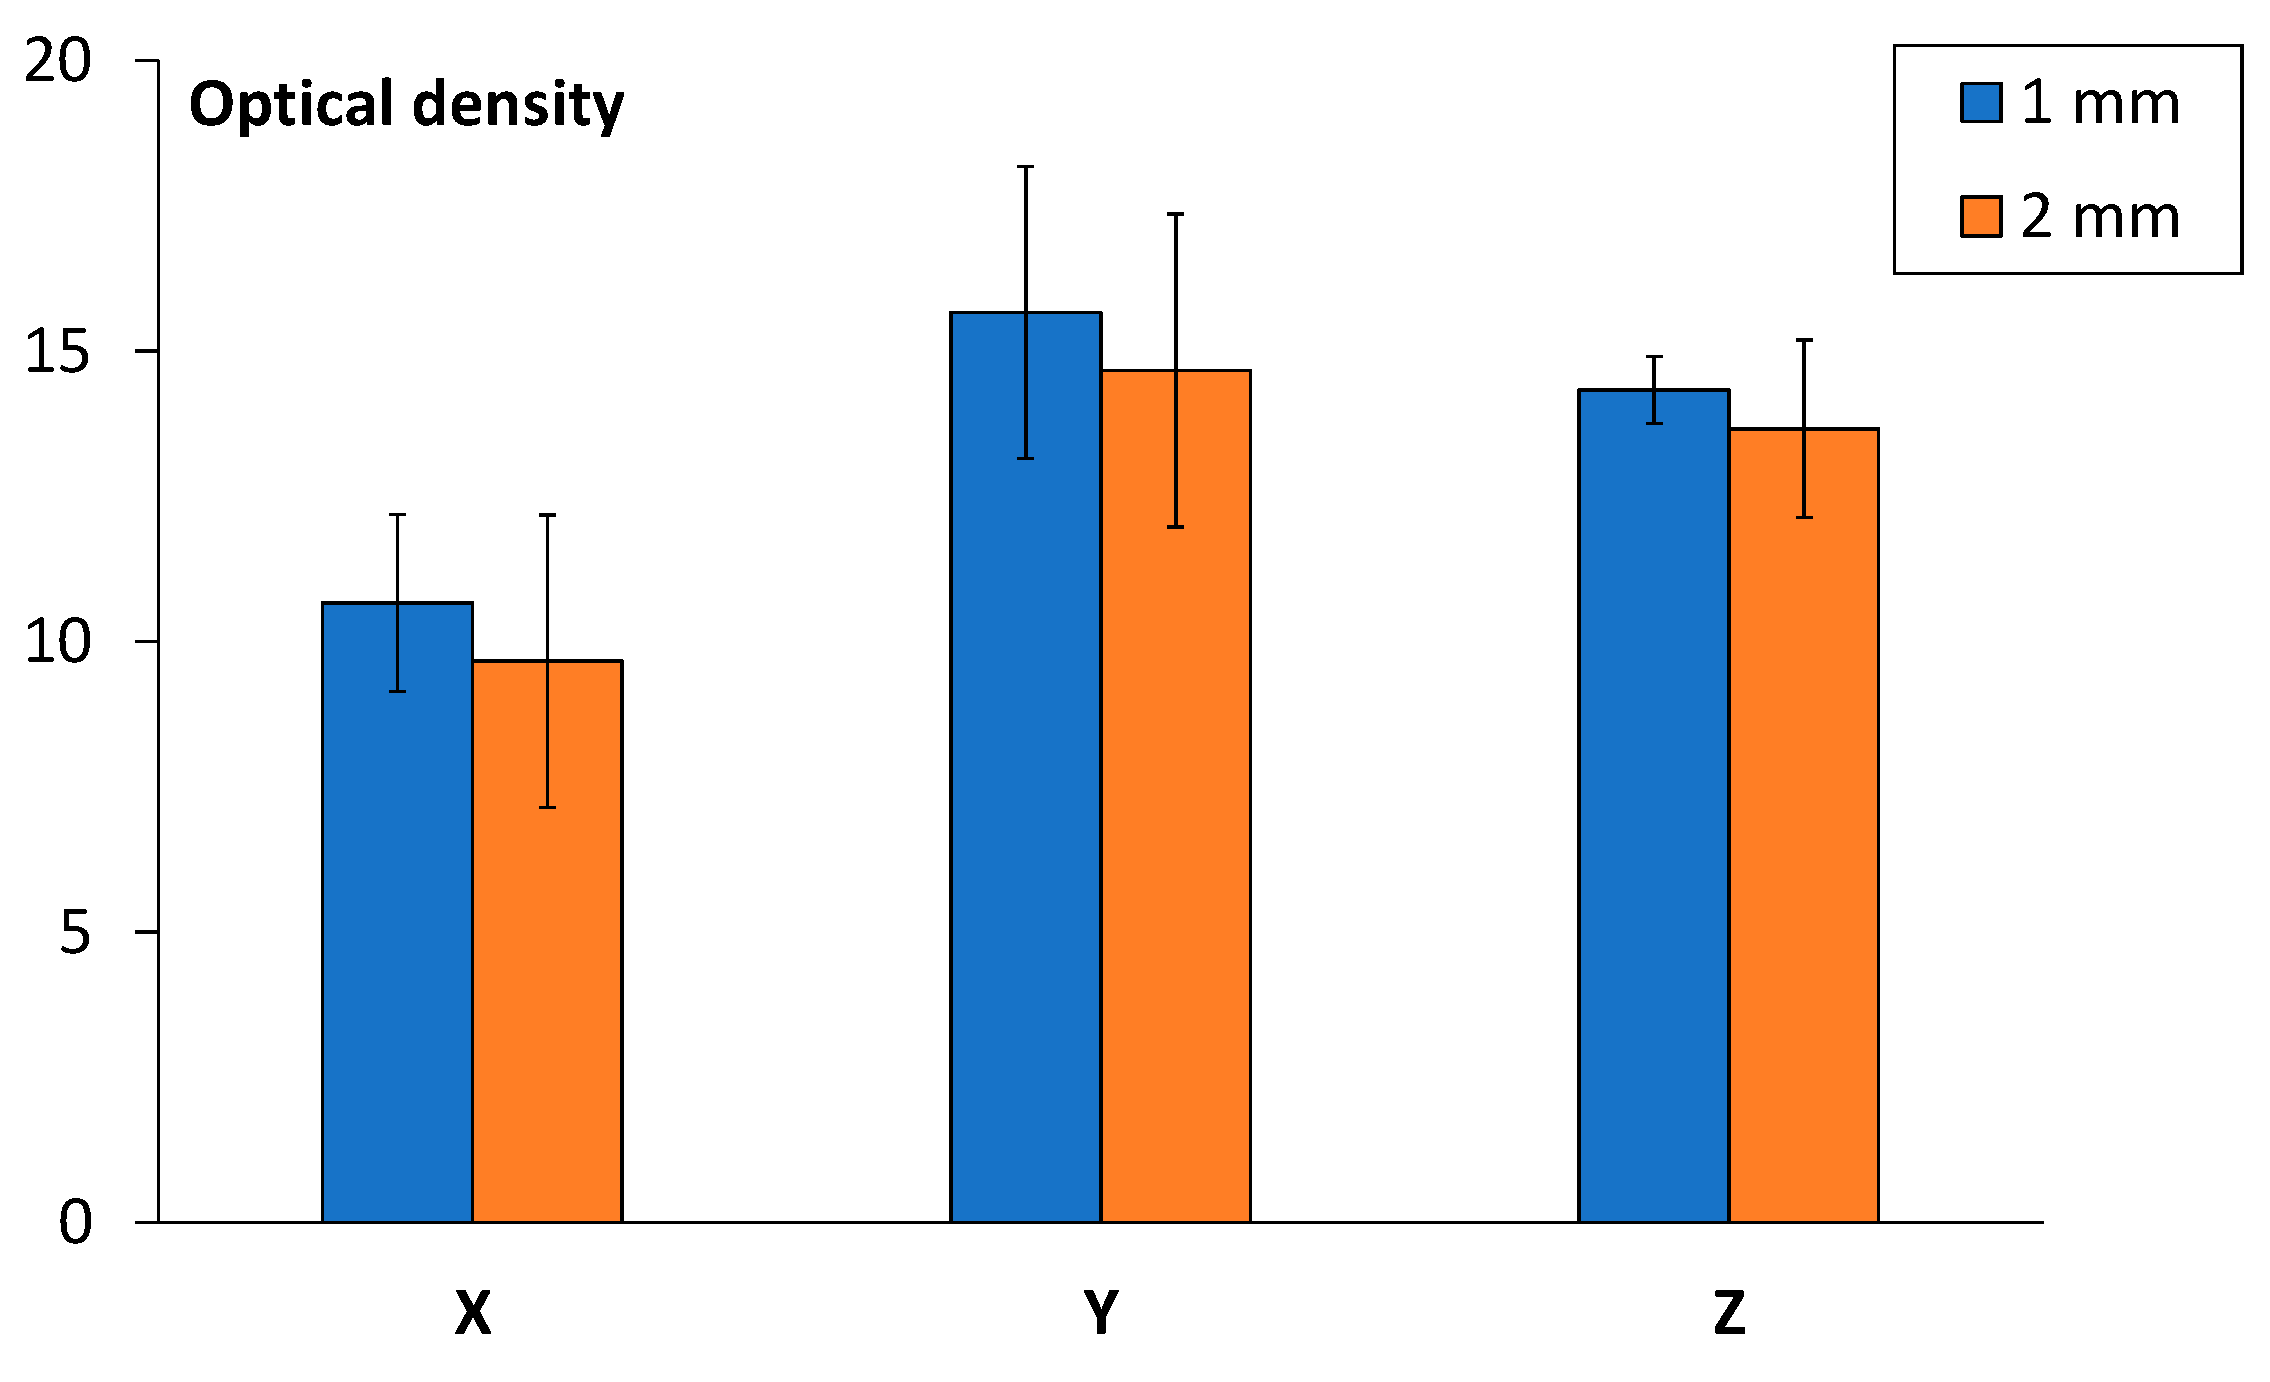
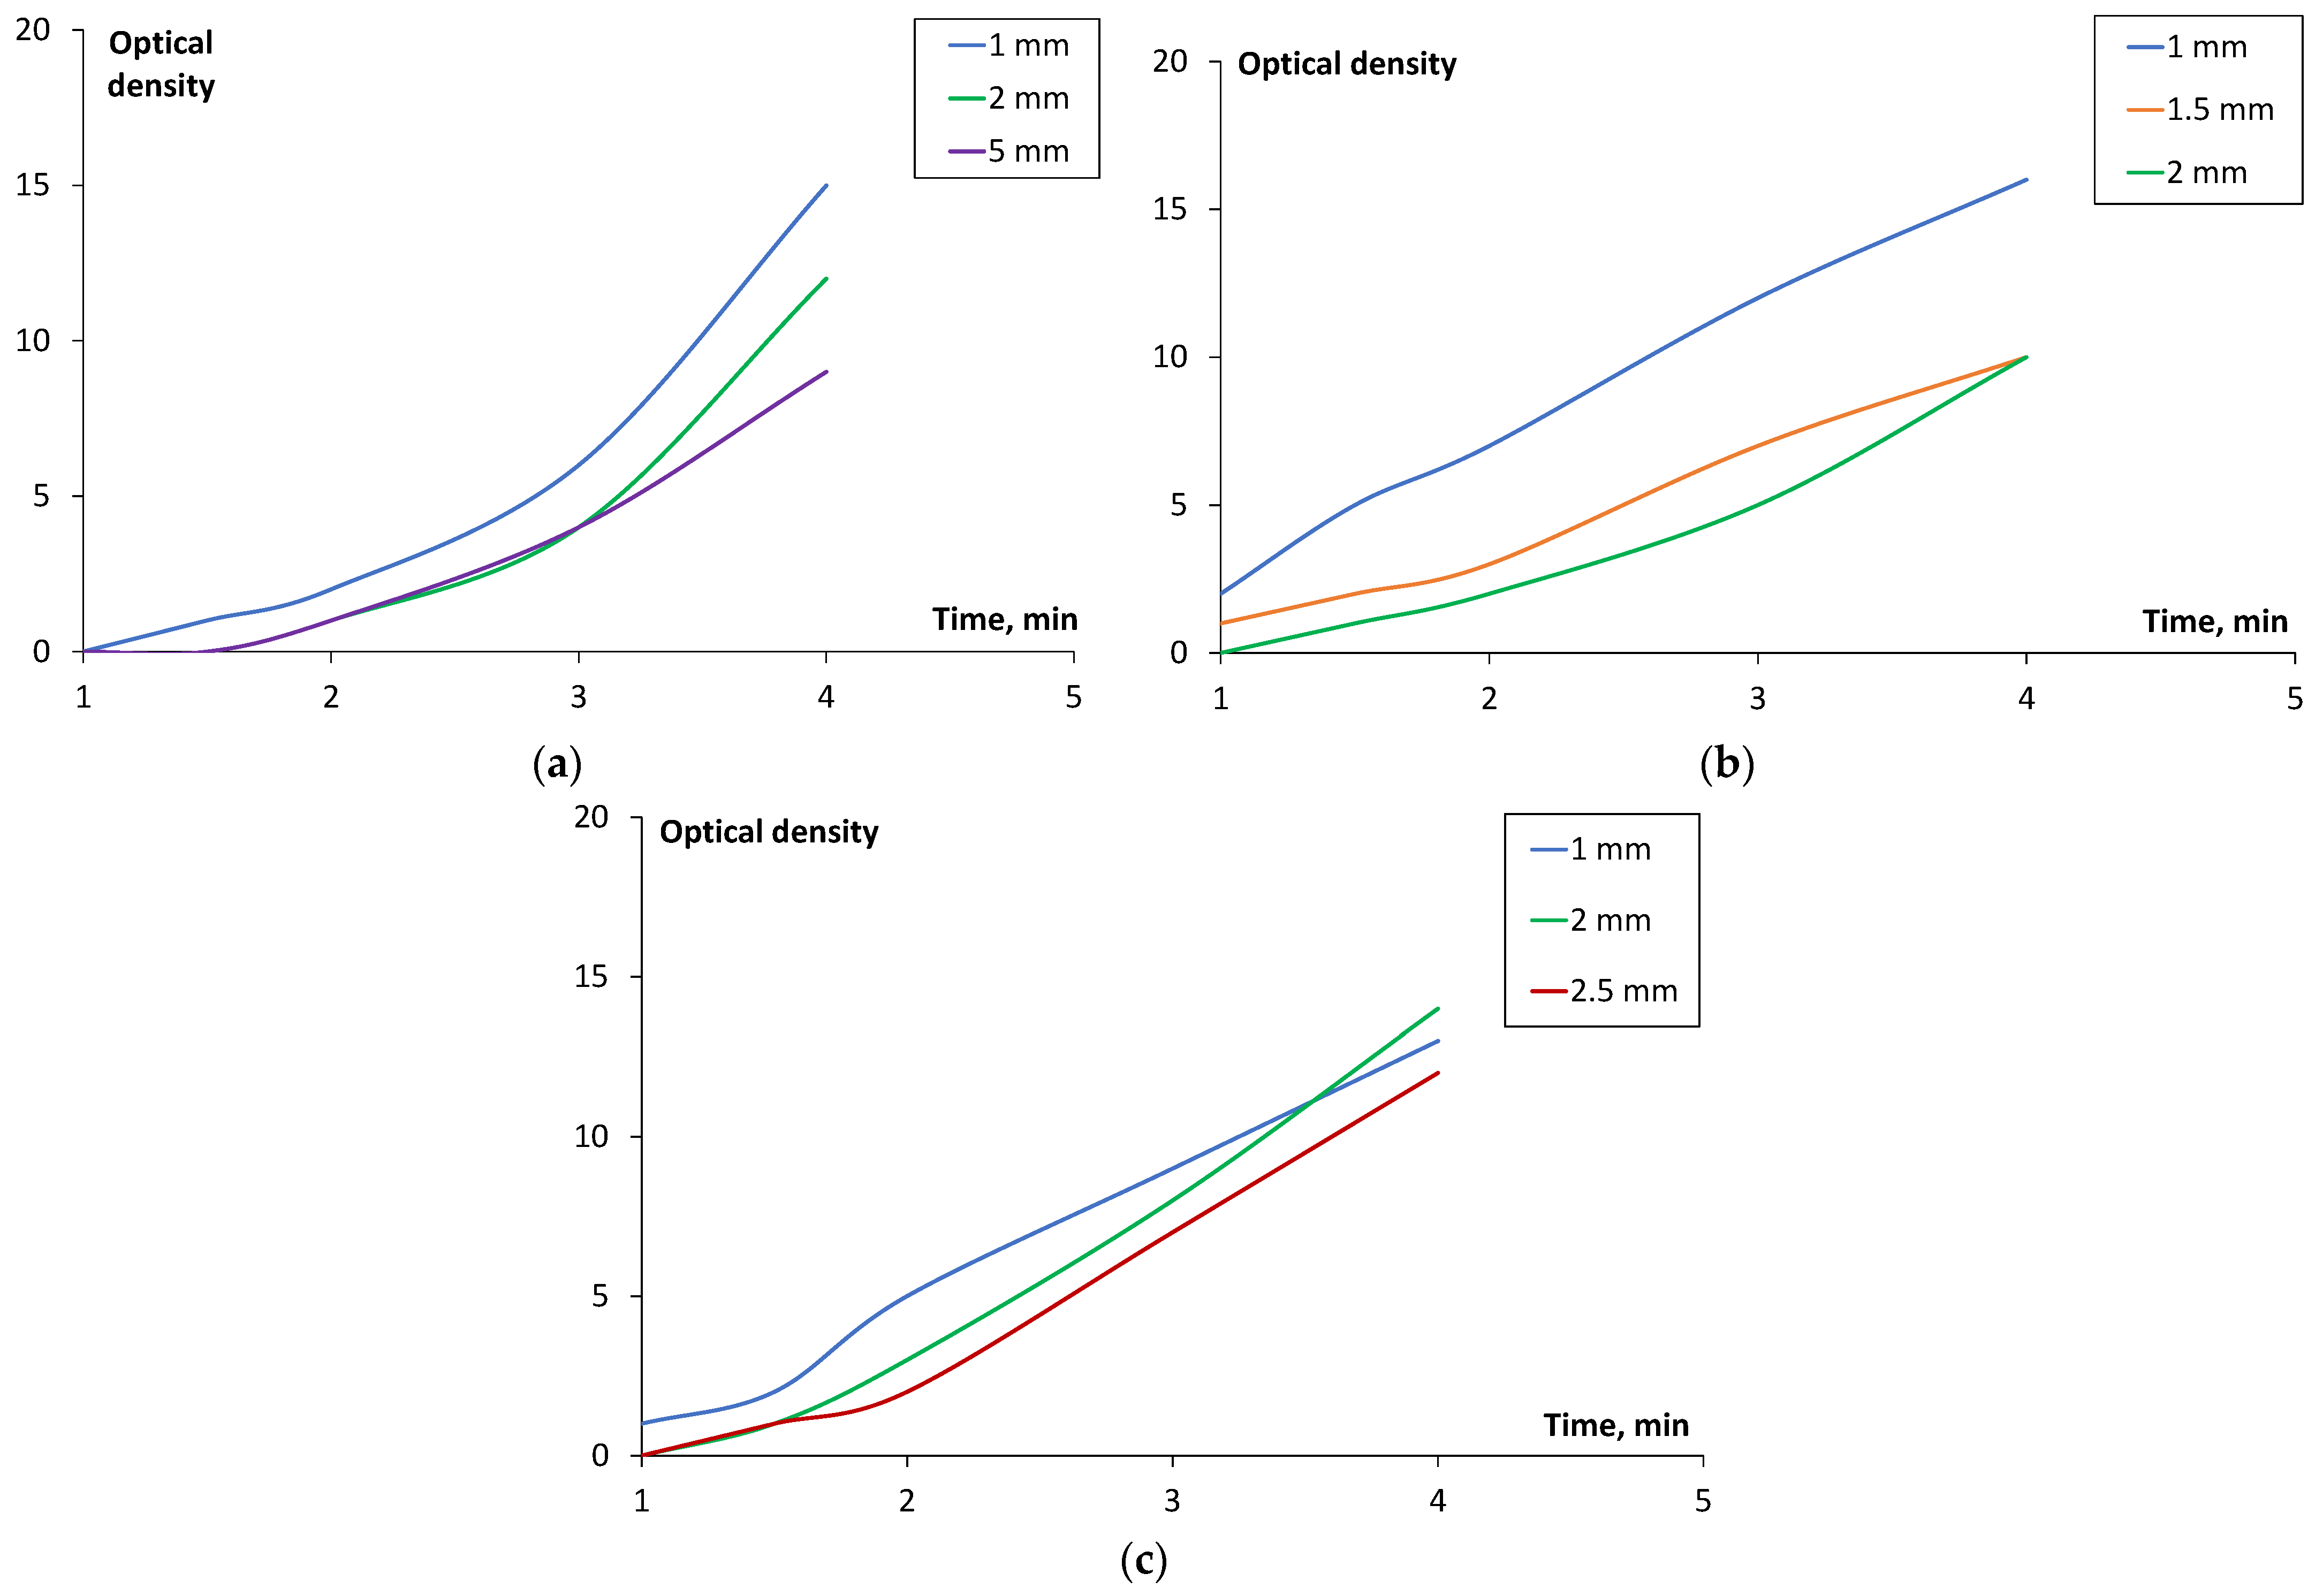
3.4. Smoke Density and Toxicity Characteristics
4. Conclusions
Author Contributions
Funding
Institutional Review Board Statement
Data Availability Statement
Acknowledgments
Conflicts of Interest
References
- Makki, T.; Vattathurvalappil, S.H.; Theravalappil, R.; Nazir, A.; Alhajeri, A.; Azeem, M.A.; Mahdi, E.; Ummer, A.C.; Ali, U. 3D and 4D printing: A review of virgin polymers used in fused deposition modeling. JCOMC 2024, 14, 100472. [Google Scholar] [CrossRef]
- Kobenko, S.; Dejus, D.; Jātnieks, J.; Pazars, D.; Glaskova-Kuzmina, T. Structural integrity of the aircraft interior spare parts produced by additive manufacturing. Polymers 2022, 14, 1538. [Google Scholar] [CrossRef]
- Glaskova-Kuzmina, T.; Dejus, D.; Jātnieks, J.; Aniskevich, A.; Sevcenko, J.; Sarakovskis, A.; Zolotarjovs, A. Effect of post-printing cooling conditions on the properties of Ultem printed parts. Polymers 2023, 15, 324. [Google Scholar] [CrossRef] [PubMed]
- Lv, Y.; Dejus, D.; Kobenko, S.; Singamneni, S.; Glaskova-Kuzmina, T. Evaluation of the fire-retardancy of Ultem 9085 polymer composites processed by fused deposition modelling. Mater. Sci. 2022, 28, 353–359. [Google Scholar] [CrossRef]
- Padovano, E.; Galfione, M.; Concialdi, P.; Lucco, G.; Badini, C. Mechanical and thermal behavior of Ultem®9085 fabricated by fused-deposition modeling. Appl. Sci. 2020, 10, 3170. [Google Scholar] [CrossRef]
- Glaskova-Kuzmina, T.; Dejus, D.; Jātnieks, J.; Vīndedze, E.; Bute, I.; Sevcenko, J.; Aniskevich, A.; Stankevich, S.; Boobani, B. The tensile, thermal and flame-retardant properties of polyetherimide and polyetherketoneketone processed by fused filament fabrication. Polymers 2024, 16, 336. [Google Scholar] [CrossRef] [PubMed]
- Wang, X.; Zhao, L.; Fuh, J.Y.H.; Lee, H.P. Effect of Porosity on Mechanical Properties of 3D Printed Polymers: Experiments and Micromechanical Modeling Based on X-ray Computed Tomography Analysis. Polymers 2019, 11, 1154. [Google Scholar] [CrossRef] [PubMed]
- Zaldivar, R.J.; Witkin, D.B.; Mclouth, T.; Patel, D.N.; Schmitt, K.; Nokes, J.P. Influence of processing and orientation print effects on the mechanical and thermal behavior of 3D-Printed ULTEM 9085 Material. Addit. Manuf. 2017, 13, 71–80. [Google Scholar] [CrossRef]
- Mirasadi, K.; Rahmatabadi, D.; Ghasemi, I.; Khodaei, M.; Baniassadi, M.; Bodaghi, M.; Baghani, M. 3D and 4D Printing of PETG–ABS–Fe3O4 Nanocomposites with Supreme Remotely Driven Magneto-Thermal Shape-Memory Performance. Polymers 2024, 16, 1398. [Google Scholar] [CrossRef] [PubMed]
- Ali, S.J.A.; Rahmatabadi, D.; Baghani, M.; Baniassadi, M. Design, processing, 3D/4D printing, and characterization of the novel PETG–PBAT blends. J. Mater. Sci. 2024, 59, 9150–9164. [Google Scholar] [CrossRef]
- Bucknall, C.B. Ch. 14—Fracture Phenomena in Polymer Blends. In Polymer Blends; Paul, D.R., Newman, S., Eds.; Academic Press: Cambridge, MA, USA, 1978; Volume 2, pp. 91–127. [Google Scholar] [CrossRef]
- Doostmohammadi, H.; Kashmarizad, K.; Baniassadi, M.; Bodaghi, M.; Baghani, M. 4D printing and optimization of biocompatible poly lactic acid/poly methyl methacrylate blends for enhanced shape memory and mechanical properties. J. Mech. Behav. Biomed. Mater. 2024, 160, 106719. [Google Scholar] [CrossRef] [PubMed]
- Simunec, D.P.; Jacob, J.; Kandjani, A.E.Z.; Trinchi, A.; Sola, A. Facilitating the additive manufacture of high-performance polymers through polymer blending: A review. Eur. Polym. J. 2023, 201, 112553. [Google Scholar] [CrossRef]
- Federal Aviation Administration (FAA). Aircraft Materials Fire Test Handbook; DOT/FAA/AR-00/12; Office of Aviation Research: Washington, DC, USA, 2000; 235p. Available online: https://www.fire.tc.faa.gov/pdf/00-12.pdf (accessed on 6 November 2024).
- European Union Aviation Safety Agency (EASA). Certification Specifications for Large Aeroplanes (CS-25), CS 25.853. Available online: https://www.easa.europa.eu/sites/default/files/dfu/CS-25_Amdt%203_19.09.07_Consolidated%20version.pdf (accessed on 6 November 2024).
- National Research Council. The Airliner Cabin Environment and the Health of Passengers and Crew; National Academies Press: Washington, DC, USA, 2002; 344p, Available online: https://nap.nationalacademies.org/catalog/10238/the-airliner-cabin-environment-and-the-health-of-passengers-and-crew (accessed on 6 November 2024).
- Ngo, T.D.; Kashani, A.; Imbalzano, G.; Nguyen, K.T.; Hui, D. Additive manufacturing (3D printing): A review of materials, methods, applications and challenges. Compos. B Eng. 2018, 143, 172–196. [Google Scholar] [CrossRef]
- Stratasys, ULTEM 9085 Production-Grade Thermoplastic for Fortus 3D Printers. Available online: https://www.stratasys.com/siteassets/materials/materials-catalog/fdm-materials/ultem-9085/mds_fdm_ultem9085_0824a.pdf?v=4a47d4 (accessed on 7 November 2024).
- Federal Aviation Regulation (FAR) Standard No. 25.853 Fire Test to Aircraft Material: Fire Protection for Compartment Interior. Available online: https://www.federalregister.gov/documents/2019/07/03/2019-13646/interior-parts-and-components-fireprotection-for-transport-category-airplanes (accessed on 7 November 2024).
- Gebisa, A.W.; Lemu, H.G. Investigating Effects of Fused-Deposition Modeling (FDM) Processing Parameters on Flexural Properties of ULTEM 9085 using Designed Experiment. Materials 2018, 11, 500. [Google Scholar] [CrossRef] [PubMed]
- Motaparti, K.P.; Taylor, G.; Leu, M.C.; Chandrashekhara, K.; Castle, J.; Matlack, M.; Motaparti, K.P.; Taylor, G.; Leu, M.C.; Chandrashekhara, K. Experimental investigation of effects of build parameters on flexural properties in fused deposition modelling parts. Virtual Phys. Prototyp. 2017, 12, 207–220. [Google Scholar] [CrossRef]
- Roberson, D.A.; Torrado, A.R.; Shemelya, C.M.; Rivera, A.; Macdonald, E.; Wicker, R.B. Comparison of stress concentrator fabrication for 3D printed polymeric izod impact test specimens. Addit. Manuf. 2015, 7, 1–11. [Google Scholar] [CrossRef]
- Lisa, G.; Hamciuc, C.; Hamciuc, E.; Tudorachi, N. Thermal and thermo-oxidative stability and probable degradation mechanism of some polyetherimides. J. Anal. Appl. Pyrolysis 2016, 118, 144–154. [Google Scholar] [CrossRef]
- Kaplun, B.W.; Zhou, R.; Jones, K.W.; Dunn, M.L.; Yakacki, C.M. Influence of orientation on mechanical properties for high performance fused filament fabricated Ultem 9085 and electro-statically dissipative polyetherketoneketone. Addit. Manuf. 2020, 36, 101527. [Google Scholar] [CrossRef]
- ISO 527-1; Plastics—Determination of Tensile Properties—Part 1: General Principles. International Organization for Standardization: Geneva, Switzerland, 2019. Available online: https://www.iso.org/standard/75824.html (accessed on 7 November 2024).
- European Union Aviation Safety Agency, EASA CS 25.853 Appendix F. PART V of Airworthiness Standards for the Aviation Sector Part I. Available online: https://www.easa.europa.eu/sites/default/files/dfu/CS%2025%20%28Initial%20issue%29.pdf (accessed on 2 December 2024).
- AITM 3-0005; Determination of Specific Gas Components of Smoke Generated by Aircraft Interior Materials. Airbus, 2015. Available online: https://www.govmark.com/pdf/accreditations/airbus-testing-qualification.pdf (accessed on 7 November 2024).
- Han, P.; Tofangchi, A.; Deshpande, A.; Zhang, S.; Hsu, K. An approach to improve interface healing in FFF-3D printed Ultem 1010 using laser pre-deposition heating. Procedia Manuf. 2017, 34, 672–677. [Google Scholar] [CrossRef]
- Forés-Garriga, A.; Pérez, M.A.; Gómez-Gras, G.; Reyes-Pozo, G. Role of infill parameters on the mechanical performance and weight reduction of PEI Ultem processed by FFF. Mater. Des. 2020, 193, 108810. [Google Scholar] [CrossRef]
- Hasanov, S.; Alkunte, S.; Rajeshirke, M.; Gupta, A.; Huseynov, O.; Fidan, I.; Alifui-Segbaya, F.; Rennie, A. Review on additive manufacturing of multi-material parts: Progress and challenges. J. Manuf. Mater. Process. 2022, 6, 4. [Google Scholar] [CrossRef]
- Byberg, K.I.; Gebisa, A.W.; Lemu, H.G. Mechanical properties of ULTEM 9085 material processed by fused deposition modeling. Polym. Test. 2018, 72, 335–347. [Google Scholar] [CrossRef]
- Gebisa, A.W.; Lemu, H.G. Influence of 3D printing FDM process parameters on tensile property of ULTEM 9085. Procedia Manuf. 2017, 30, 331–338. [Google Scholar] [CrossRef]
- ISO 11359-2:2021; Plastics—Thermomechanical Analysis (TMA) Part 2: Determination of Coefficient of Linear Thermal Expansion and Glass Transition Temperature. International Organization for Standardization: Geneva, Switzerland, 2021. Available online: https://www.iso.org/standard/81835.html (accessed on 30 November 2024).
- Al Rashid, A.; Koҫ, M. Creep and Recovery Behavior of Continuous Fiber-Reinforced 3DP Composites. Polymers 2021, 13, 1644. [Google Scholar] [CrossRef]
- Ramakers-van Dorp, E.; Möginger, B.; Hausnerova, B. Thermal expansion of semicrystalline polymers: Anisotropic thermal strain and crystallite orientation. Polymer 2020, 191, 122249. [Google Scholar] [CrossRef]
- Kennedy, Z.C.; Christ, J.F.; Fenn, M.D.; Zhong, L.; Chouyyok, W.; Arnold, A.M.; Denny, A.C.; Albrecht, A.M.; Silverstein, J.A.; Erikson, R.L.; et al. Mica filled polyetherketoneketones for material extrusion 3D printing. Addit. Manuf. 2022, 49, 102492. [Google Scholar] [CrossRef]
- De León, A.S.; Domínguez-Calvo, A.; Molina, S.I. Materials with enhanced adhesive properties based on acrylonitrile-butadiene-styrene (ABS)/thermoplastic polyurethane (TPU) blends for fused filament fabrication (FFF). Mater. Des. 2019, 182, 108044. [Google Scholar] [CrossRef]
- ISO 11357-1:2023; Plastics—Differential Scanning Calorimetry (DSC). International Organization for Standardization: Geneva, Switzerland, 2023. Available online: https://www.iso.org/standard/83904.html (accessed on 9 December 2024).
- Blanco, I.; Cicala, G.; Ognibene, G.; Rapisarda, M.; Recca, A. Thermal properties of polyetherimide/polycarbonate blends for advanced applications. Polym. Degrad. Stab. 2018, 154, 234–238. [Google Scholar] [CrossRef]


| Interval | X | Y | Z |
|---|---|---|---|
| Below Tg | 5.53 × 10⁻⁵ | 6.26 × 10⁻⁵ | 6.49 × 10⁻⁵ |
| Above Tg | 1.38 × 10⁻⁴ | 1.65 × 10⁻⁴ | 1.8 × 10⁻⁴ |
| Orientation | Thickness, mm | HCN, ppm | CO, ppm | NO/NO2, ppm | SO2, ppm | HF, ppm | HCl, ppm |
|---|---|---|---|---|---|---|---|
| X | 1.50 | <1 | 124.0 | <1 | 1 | <1 | <1 |
| X | 2.00 | <1 | 105 | <1 | <1 | <1 | <1 |
| X | 2.50 | <1 | 110.7 | <1 | <1 | 1 | <1 |
| X | 5.00 | <1 | 93.7 | <1 | 1 | <1 | <1 |
| Y | 1.00 | <1 | 127.0 | <1 | 1 | <1 | <1 |
| Y | 1.50 | <1 | 103.3 | <1 | <1 | <1 | <1 |
| Y | 2.00 | <1 | 113.7 | <1 | <1 | <1 | <1 |
| Z | 1.00 | <1 | 111.7 | <1 | <1 | <1 | <1 |
| Z | 2.00 | <1 | 107.3 | <1 | 1 | <1 | <1 |
| Z | 2.50 | <1 | 111.7 | <1 | 1 | <1 | <1 |
Disclaimer/Publisher’s Note: The statements, opinions and data contained in all publications are solely those of the individual author(s) and contributor(s) and not of MDPI and/or the editor(s). MDPI and/or the editor(s) disclaim responsibility for any injury to people or property resulting from any ideas, methods, instructions or products referred to in the content. |
© 2025 by the authors. Licensee MDPI, Basel, Switzerland. This article is an open access article distributed under the terms and conditions of the Creative Commons Attribution (CC BY) license (https://creativecommons.org/licenses/by/4.0/).
Share and Cite
Vīndedze, E.; Glaskova-Kuzmina, T.; Dejus, D.; Jātnieks, J.; Sevcik, S.; Bute, I.; Sevcenko, J.; Stankevich, S.; Gaidukovs, S. Effects of Printing Orientation on the Tensile, Thermophysical, Smoke Density, and Toxicity Properties of Ultem® 9085. Polymers 2025, 17, 145. https://doi.org/10.3390/polym17020145
Vīndedze E, Glaskova-Kuzmina T, Dejus D, Jātnieks J, Sevcik S, Bute I, Sevcenko J, Stankevich S, Gaidukovs S. Effects of Printing Orientation on the Tensile, Thermophysical, Smoke Density, and Toxicity Properties of Ultem® 9085. Polymers. 2025; 17(2):145. https://doi.org/10.3390/polym17020145
Chicago/Turabian StyleVīndedze, Elīna, Tatjana Glaskova-Kuzmina, Didzis Dejus, Jānis Jātnieks, Scott Sevcik, Irina Bute, Jevgenijs Sevcenko, Stanislav Stankevich, and Sergejs Gaidukovs. 2025. "Effects of Printing Orientation on the Tensile, Thermophysical, Smoke Density, and Toxicity Properties of Ultem® 9085" Polymers 17, no. 2: 145. https://doi.org/10.3390/polym17020145
APA StyleVīndedze, E., Glaskova-Kuzmina, T., Dejus, D., Jātnieks, J., Sevcik, S., Bute, I., Sevcenko, J., Stankevich, S., & Gaidukovs, S. (2025). Effects of Printing Orientation on the Tensile, Thermophysical, Smoke Density, and Toxicity Properties of Ultem® 9085. Polymers, 17(2), 145. https://doi.org/10.3390/polym17020145