3. Results
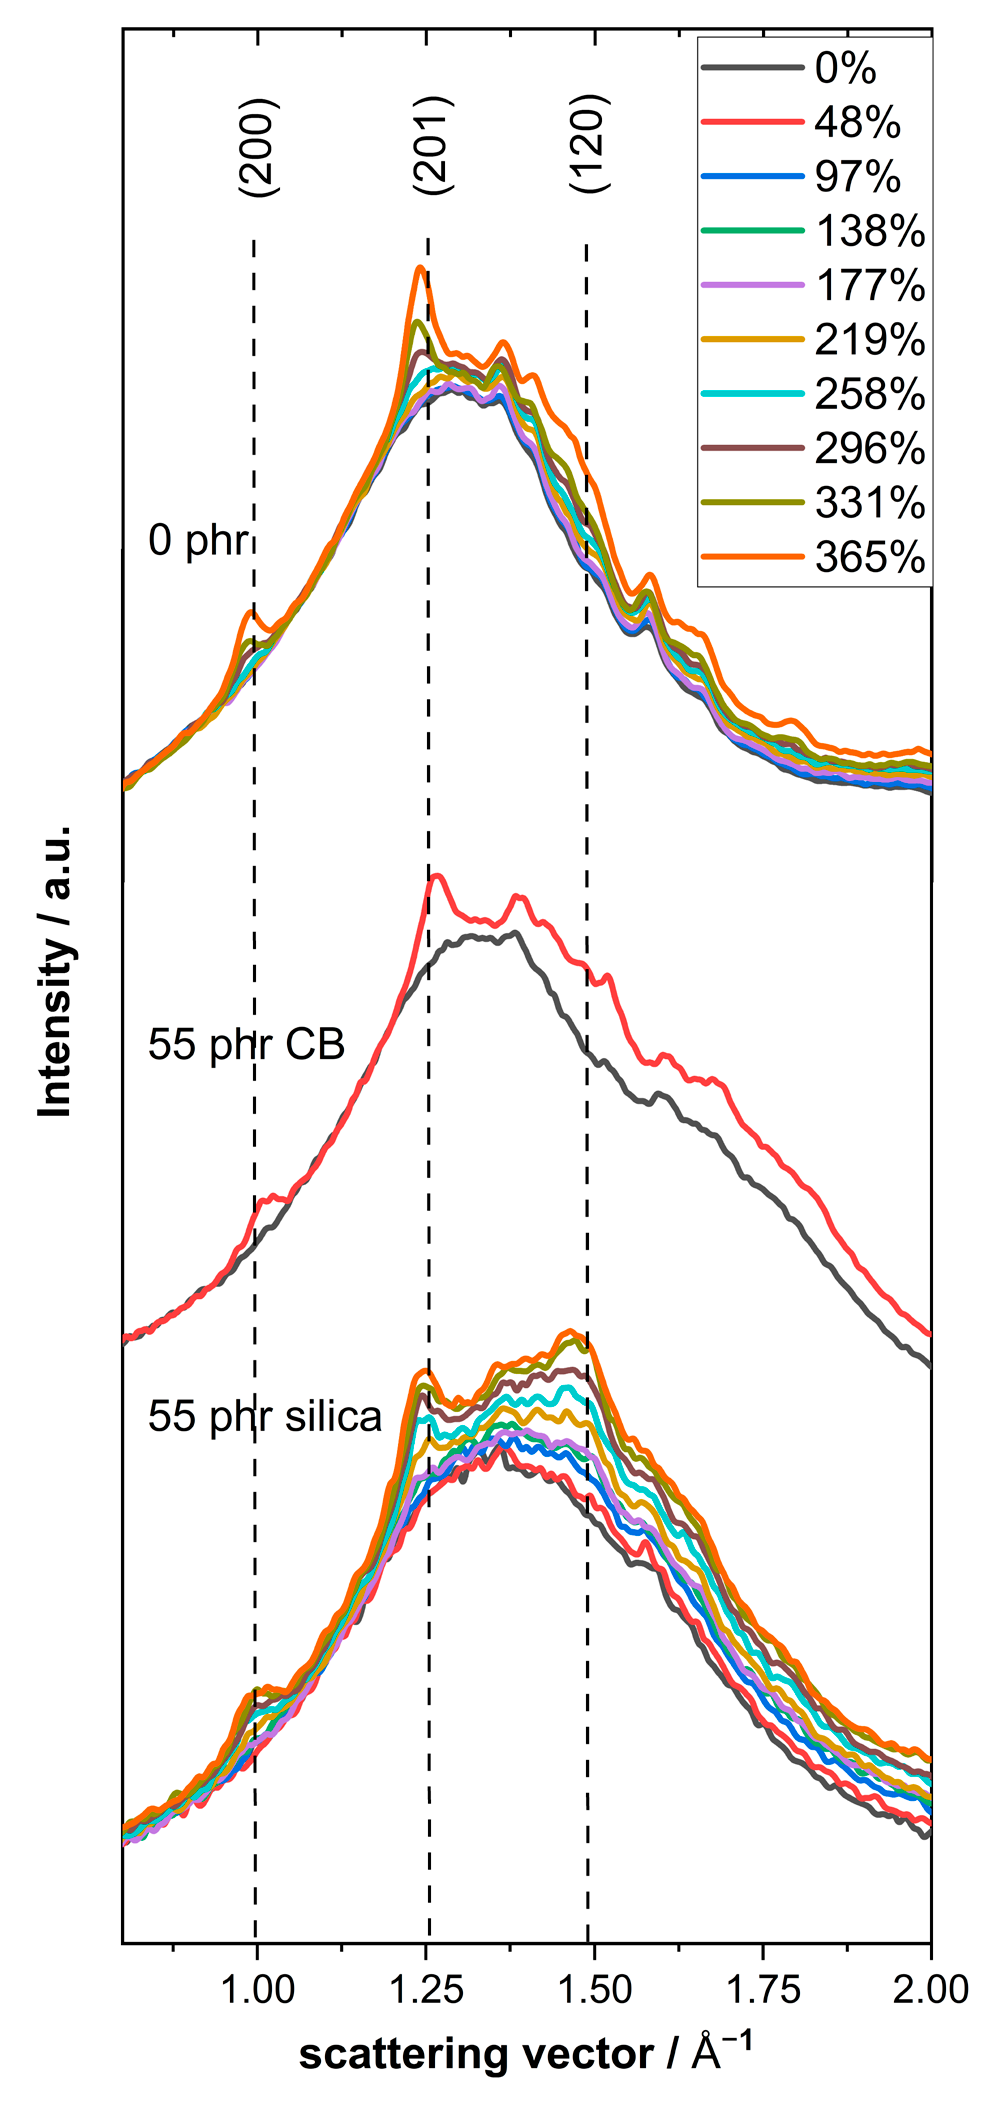
The central aim of this work was to compare the strain-induced crystallization (SIC) in natural rubber compounds filled with 40 to 70 phr silica or carbon black. In the first step, 2D WAXD measurements were performed on samples under uniaxial deformation with strain values ranging from 0 to 400% at room temperature. The 2D WAXD patterns for vulcanized natural rubber (NR) and corresponding NR compounds filled with 55 phr silica and 55 phr carbon black are shown in
Figure 1 as representative examples. Crystalline reflections appear above 200% strain, indicating the occurrence of SIC in natural rubber. The position of the stronger crystalline reflections is in good agreement with the q values expected for the (200), (201) and (120) lattice planes commonly found in crystalline natural rubber at about 1.0, 1.25 and 1.5 A
−1, respectively [
20,
21,
22]. The strongest crystalline reflections for the NR compounds filled with carbon black and silica appeared at quite similar positions.
Considering the pattern for undeformed samples in more detail, one can observe that the shape of the amorphous halo in unfilled NR and NR compounds filled with Ultrasil 7000 GR silica is seemingly similar, while that for NR compounds filled with N234 carbon black is significantly broader since an additional shoulder centered at higher q values (about 1.70 to 1.75 A
−1) appears. The intensity of this shoulder significantly increases with increasing carbon black content, indicating that this feature is related to carbon black, while the weak shoulder appearing close to 2 Å
−1 is obviously caused by additives used in commercial NR compounds (for details, see
Supplementary Material, Figure S2b). Looking more carefully at the data for unfilled NR and silica-filled NR, one can also see that the peak width in the silica filled compounds is significantly enlarged, indicating extra contributions near 1.5 Å
−1.
These observations are relevant if the degree of crystallinity D
C of the natural rubber matrix has to be estimated and compared for NR compounds containing different kinds of filler and different filler fractions. An important question for the calculation of D
C is then to what extent NR contributes to the area of the amorphous halo, and how to estimate this contribution, denoted A
am,NR. An appropriate evaluation method has to be derived and applied. Accordingly, the equation
is commonly used in this work to estimate the degree of crystallization D
C of the NR matrix, where A
cryst is the total area of the crystalline reflections belonging to NR, A
am,total is the experimentally determined area of the entire amorphous halo in the q range from 0.8 to 2 Å
−1, and C
NR is a compound- and model-specific correction factor used to estimate A
am,NR = C
NR A
am,total, as discussed in more detail below. The determination of D
C is a complicated issue, since different aspects will influence the overall scattering pattern in cases of NR compounds undergoing SIC. In particular, the contribution of NR to the amorphous halo is hard to determine. Different approaches can be considered in cases of fillers with quite different scattering behavior. Two reasonable models giving somewhat limiting values for C
NR are discussed in the next two paragraphs.
In order to learn more about filler-related contributions to the amorphous halo, a quantitative analysis of the scattering patterns for all undeformed NR compounds based on a fit with three Lorentzian functions was performed (cf.
Supplementary Material, Figure S1 and Table S1). Further analysis of the area of the Lorentzian function with a peak maximum at intermediate q values (1.57 Å
−1 for silica-filled and 1.73 Å
−1 for CB-filled NR compounds) shows that this contribution corresponds to the filler fraction in both cases, while the other two peaks in the fit (at about 1.33 Å
−1 and 2.03 Å
−1) are related to non-filler contributions to the amorphous halo, i.e., NR and all other components in the compounds. This is confirmed by (i) the position of the filler-related peaks (cf.
Supplementary Material, Figure S2 and Table S1) and (ii) the dependence of the area of this peak on filler content. It is observed that the area of the intermediate peaks is approximately proportional to the filler mass fraction for both series of NR compounds (cf.
Supplementary Material, Figure S3). The relative contributions related to the non-filler components decrease accordingly with increasing filler fraction. Hence, the NR contributions to the area of the amorphous halo should be, in good approximation, proportional to the mass fraction of NR in compounds containing fillers. Based on these findings as reported in the
Supplementary Material, the NR mass fraction correction C
NR,MC = m
NR/m
total was used to calculate the degree of crystallinity D
C,MC of NR in compounds containing different amounts of filler and additional additives as one approximation.
An alternative approach considers the fact that the absorption of silica is obviously much stronger compared to those of NR, additives and carbon black. This is confirmed by a strong reduction in the total area of the amorphous halo with increasing filler content in silica-filled NR compounds (cf.
Supplementary Material, Figure S4) if measured under otherwise identical conditions. Using an extreme model approach, one can assume that there are basically no contributions of silica to the amorphous halo, since absorption and multiple scattering prevent scattered photons from leaving the silica particles/clusters and therefore the entire sample. Considering this assumption, an absorption-based correction C
NR,AC = m
NR/m
non-filler = 0.826 (where m
non-filler includes only the non-filler components) could be used to calculate the degree of crystallinity D
C,AC of the NR fraction in silica-filled compounds. For carbon black-filled NR compounds, the mass fraction correction C
NR,MC can seemingly be maintained despite absorption effects, since there is basically no dependence of the total area of the amorphous halo on the filler content under otherwise identical measurement conditions (cf.
Supplementary Material, Figure S4).
Both approaches were applied to silica-filled NR compounds in order to demonstrate the consequences of the considered assumptions/models. Note that it remains extremely complicated to address this problem experimentally since (i) there are many influencing factors and components in NR compounds as well as (ii) no alternative experimental methods like classical DSC that could give the usual absolute values for the degree of crystallinity DC. Such standard methods are unavailable in cases of NR undergoing SIC.
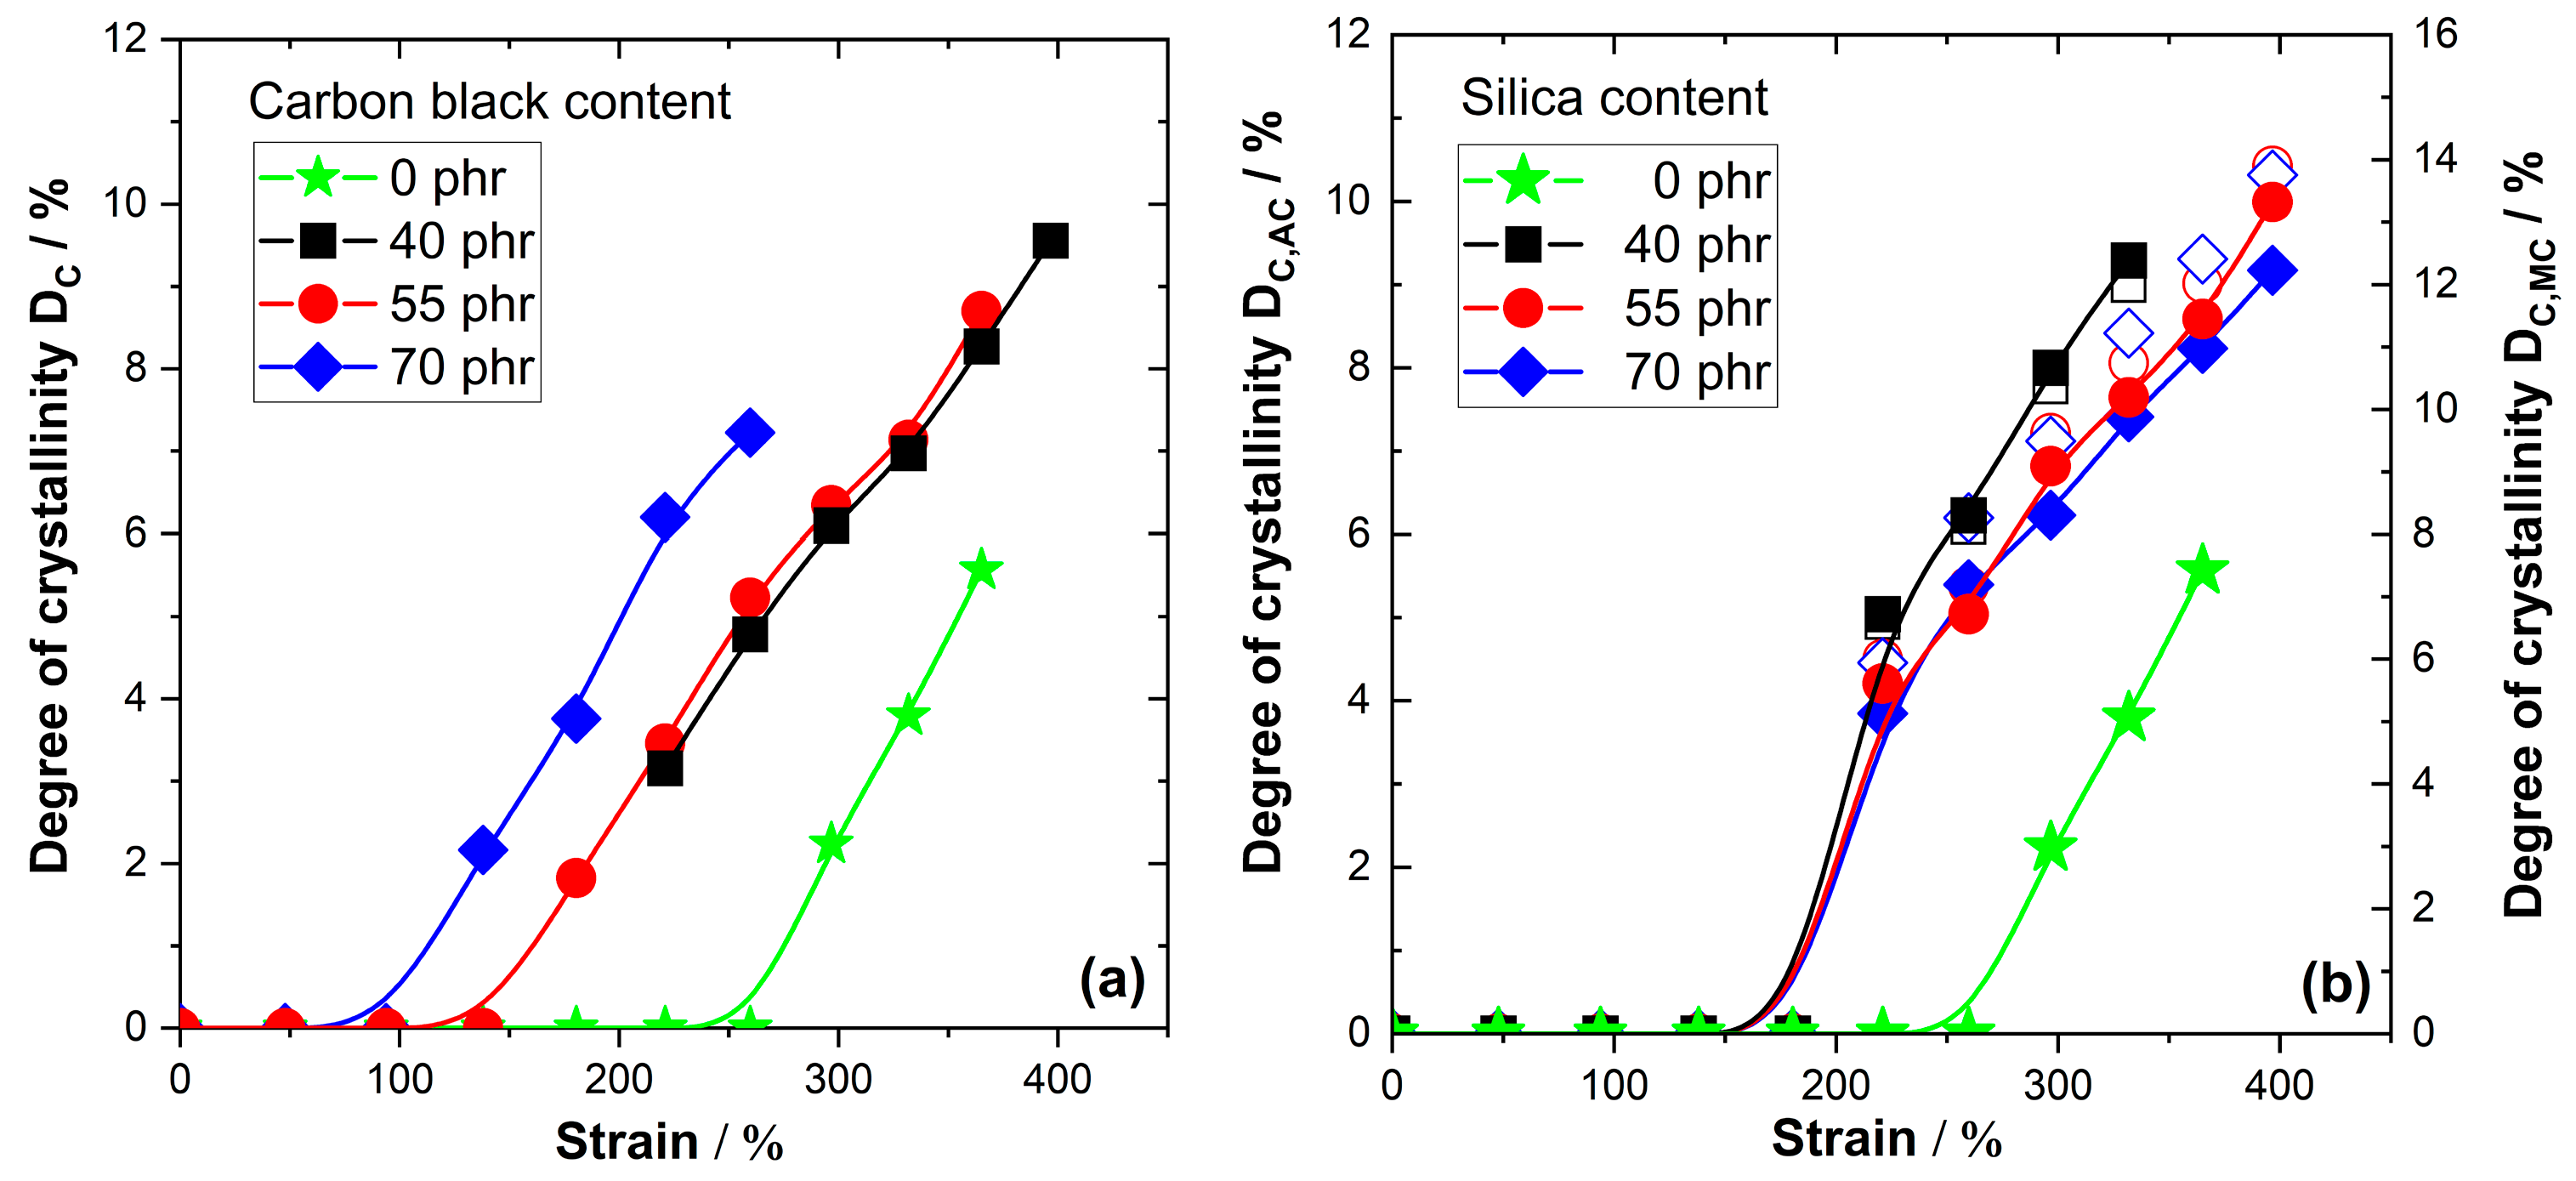
The strain-dependent D
C values for NR compounds filled with different amounts of silica and carbon black are compiled in
Figure 2. An amplification of SIC compared to unfilled NR with similar crosslinking density is observed for both types of fillers—silica and carbon black. For carbon black-filled NR compounds only the mass-based correction factor C
NR,MC is applied to calculate D
C. The D
C values for silica-filled NR compounds are, interestingly, similar to or even higher than those for carbon black-filled compounds, depending on the model used to estimate D
C. The absorption correction for silica-filled compounds gives D
C,AC values similar to the D
C values calculated for carbon black-filled compounds, while the NR mass fraction correction interestingly gives much higher D
C,MC values for the silica-filled NR compounds. Such a significant increase in D
C seems to be a bit unlikely, although the covalent bonds between silica filler and NR matrix via silane coupling agents may improve the situation since NR chains cannot easily be detached from the filler at high strain.
On the other side, there are also clear differences between carbon black- and silica filled-compounds. In the case of carbon black-filled compounds, the DC values for the NR matrix increase nearly linearly with the applied strain above the onset of SIC, as observed for unfilled NR. The extrapolated onset of SIC significantly shifts to lower strain values with increasing filler content. The onset appears at about 250% strain for unfilled NR, while it is in the range between 150% and 100% strain for the NR compounds filled with 40 to 70 phr N234 carbon black. DC values of about 9–10% are achieved for NR compounds filled with 40 phr and 55 phr carbon black at 400% strain compared to DC~6% for unfilled NR. The situation in NR compounds containing 40 to 70 phr silica is slightly different. In this case, the differences between NR compounds containing different amounts of silica are quite small. Moreover, the onset of SIC commonly appears in silica filled compounds at a strain of about 180% and the DC values rise more abruptly shortly after the onset before a nearly linear increase is achieved. The absorption-corrected DC,AC values are in the range 9–10% before the sample breaks for all investigated silica contents. The DC,MC values from NR mass fraction correction are much higher, in the range of about 14%.
In the second step, the temperature dependence of SIC at a fixed strain of about 330% was investigated. The 2D scattering patterns observed for unfilled NR at different temperatures are presented in
Figure 3. Crystalline reflections similar to those obtained in strain-dependent measurement are clearly seen at room temperature. Prominent (200) and (120) reflections are found along the vertical direction, i.e., perpendicular to the applied uniaxial deformation, while four peaks are observed for the (201) planes, which are tilted relative to the vertical direction in the 2D pattern. This is the expected behavior and in line with findings that are commonly reported in the literature [
20,
21,
22]. All crystalline reflections disappear systematically with increasing temperature. At 100 °C the crystalline reflections are basically absent, and only weak indications for a tiny crystalline fraction that remains at this temperature are observed.
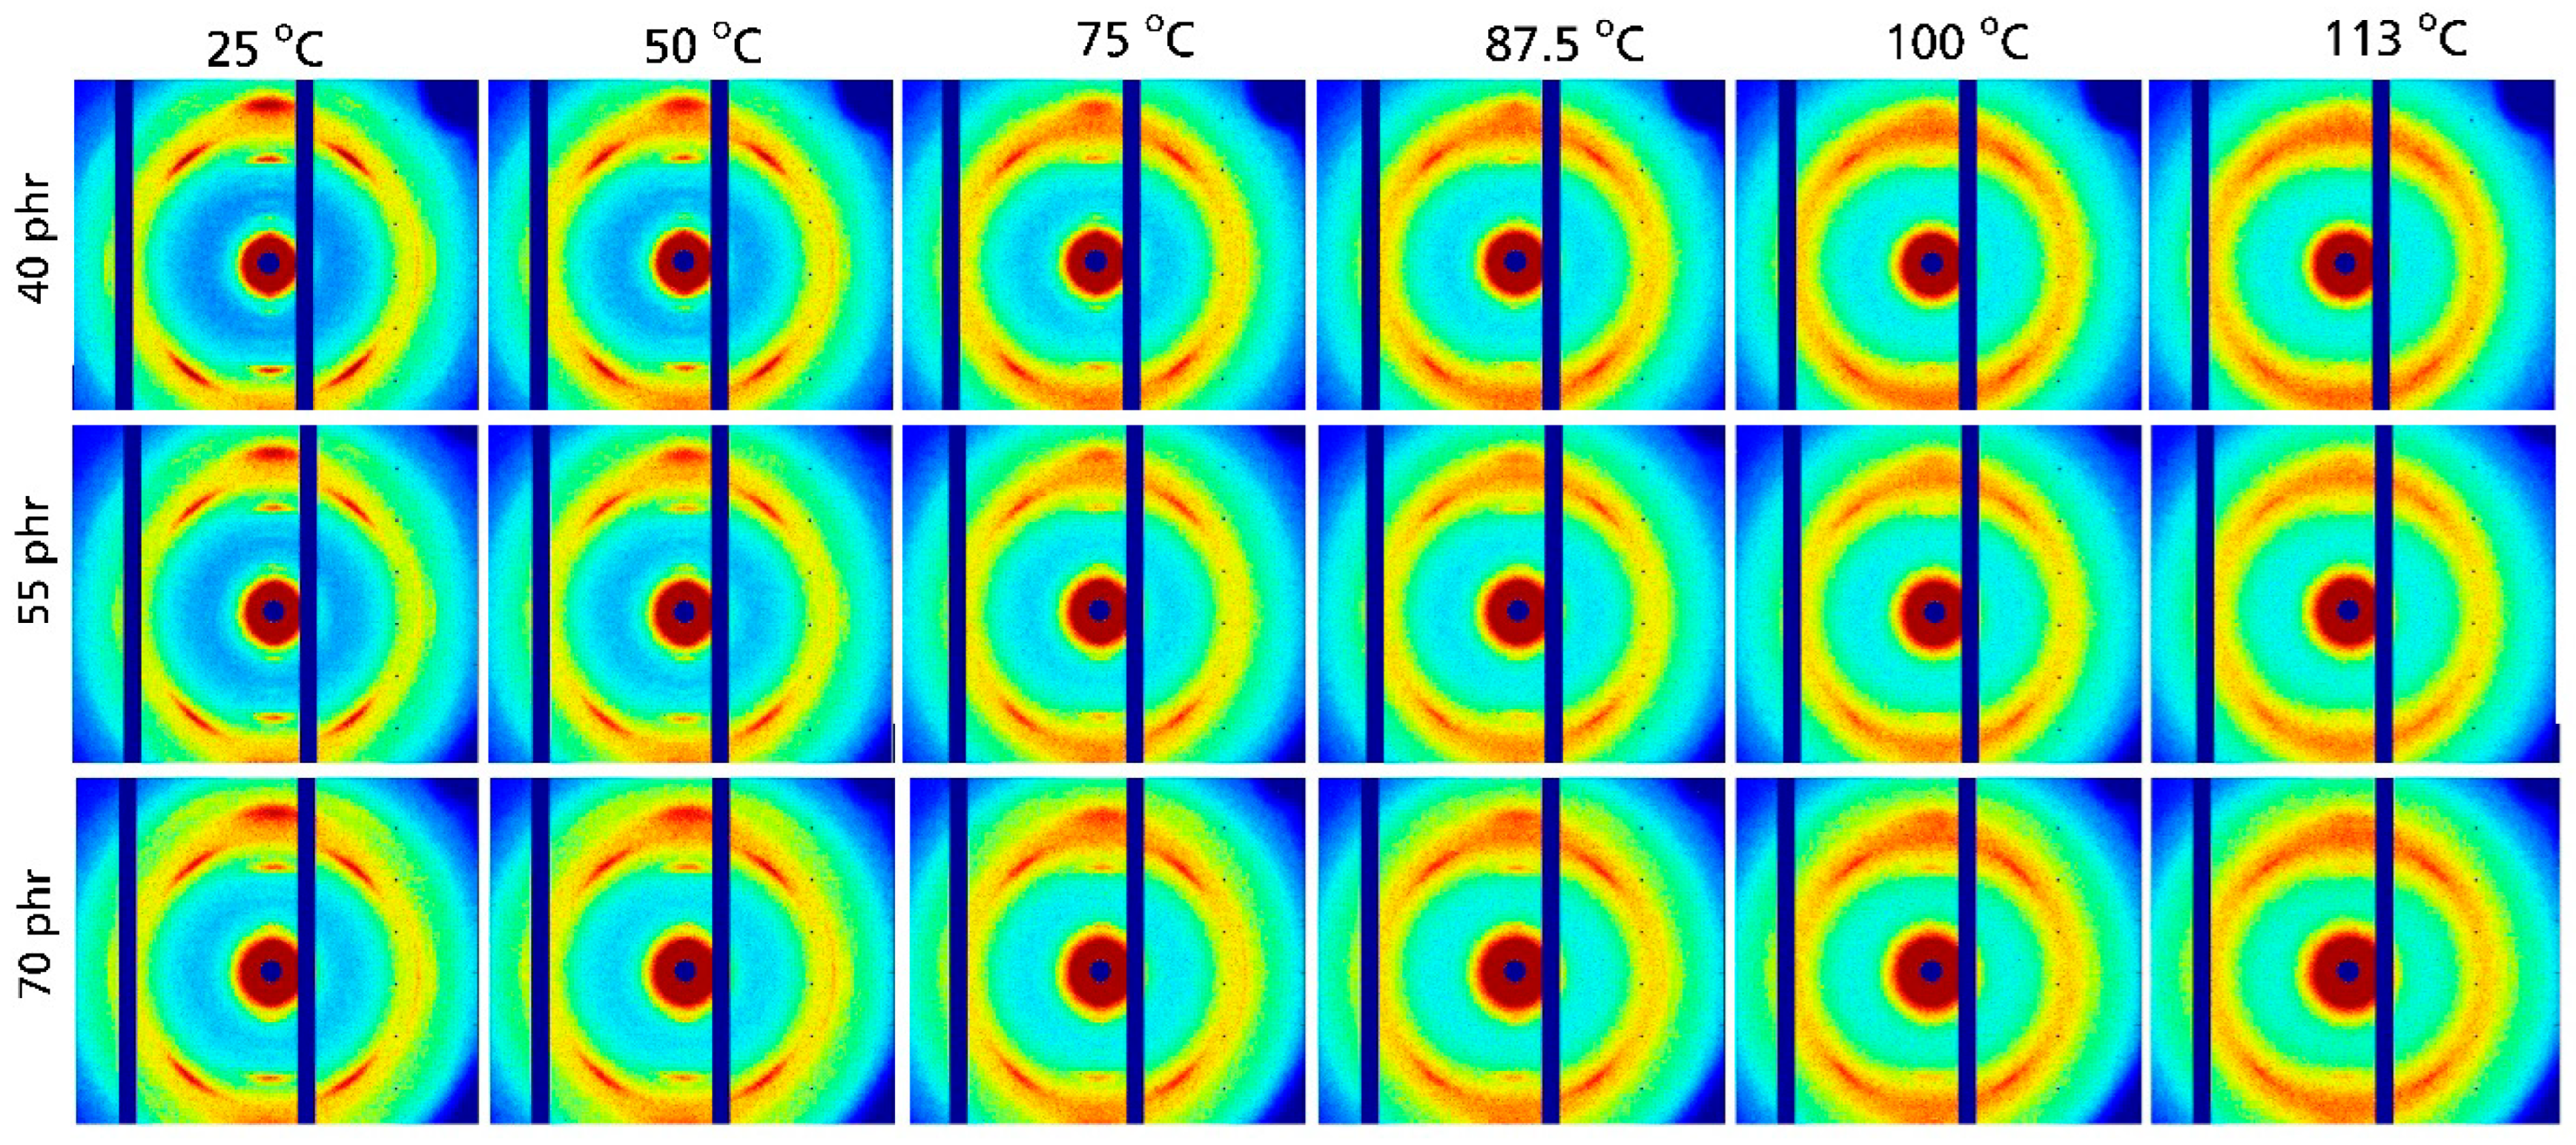
Very similar effects are seen in the 2D WAXD patterns for NR compounds containing different amounts of carbon black presented in
Figure 4. Also in this case, the characteristic reflections of crystalline NR are found at 25 °C together with a systematic decrease in their intensity at higher temperatures. The intensity of the crystalline reflections at 100 °C is seemingly a bit higher compared to that in unfilled samples. Hence, the 2D pattern was also recorded at 113 °C, resulting in a situation similar to that observed for unfilled NR at 100 °C. A visual inspection of the 2D WAXD pattern indicated that the crystalline fraction is still present above 100 °C, i.e., it disappears at slightly higher temperatures in carbon black-filled NR compounds compared to unfilled NR. A more detailed analysis of the temperature dependence of D
C was made based on azimuthal integration of the 2D patterns shown in
Figure 4. The resulting WAXD patterns are given in
Figure 5a. All relevant reflections for crystalline NR are observed. A systematic reduction in the intensity of the crystalline reflections with increasing temperature is seen for all investigated carbon black contents. A further analysis focusing on the temperature dependence of the degree of crystallization shows a nearly linear decrease in D
C with increasing temperature (
Figure 5b). This trend is observed for all investigated filler contents ranging from 40 to 70 phr carbon black. A linear extrapolation shows that the crystalline fraction disappears at about 105 to 115 °C, with a somewhat higher temperature observed for 70 phr carbon black. However, in general, the degree of crystallinity of the rubber matrix is weakly affected by carbon black content in the range 40 to 70 phr.
The situation for unfilled NR is characterized by smaller DC values at 25 °C, as also obtained in strain-dependent measurements, as well as a crystalline fraction that disappears at significantly lower temperatures (about 80 °C) compared to carbon black-filled NR compounds. Note that the absolute DC values at 25 °C are commonly a bit lower compared to the related values from strain-dependent measurement reported above. This is possibly due to stress relaxation effects that may appear under slightly different conditions in the case of temperature-dependent measurement performed at a fixed strain of about 330%. Significant differences in the local strain are unlikely, since the situation was investigated by an optical method, although a certain deviation of the local strain from 330% cannot be absolutely excluded. The linear temperature dependence of DC is unaffected by these minor experimental uncertainties.
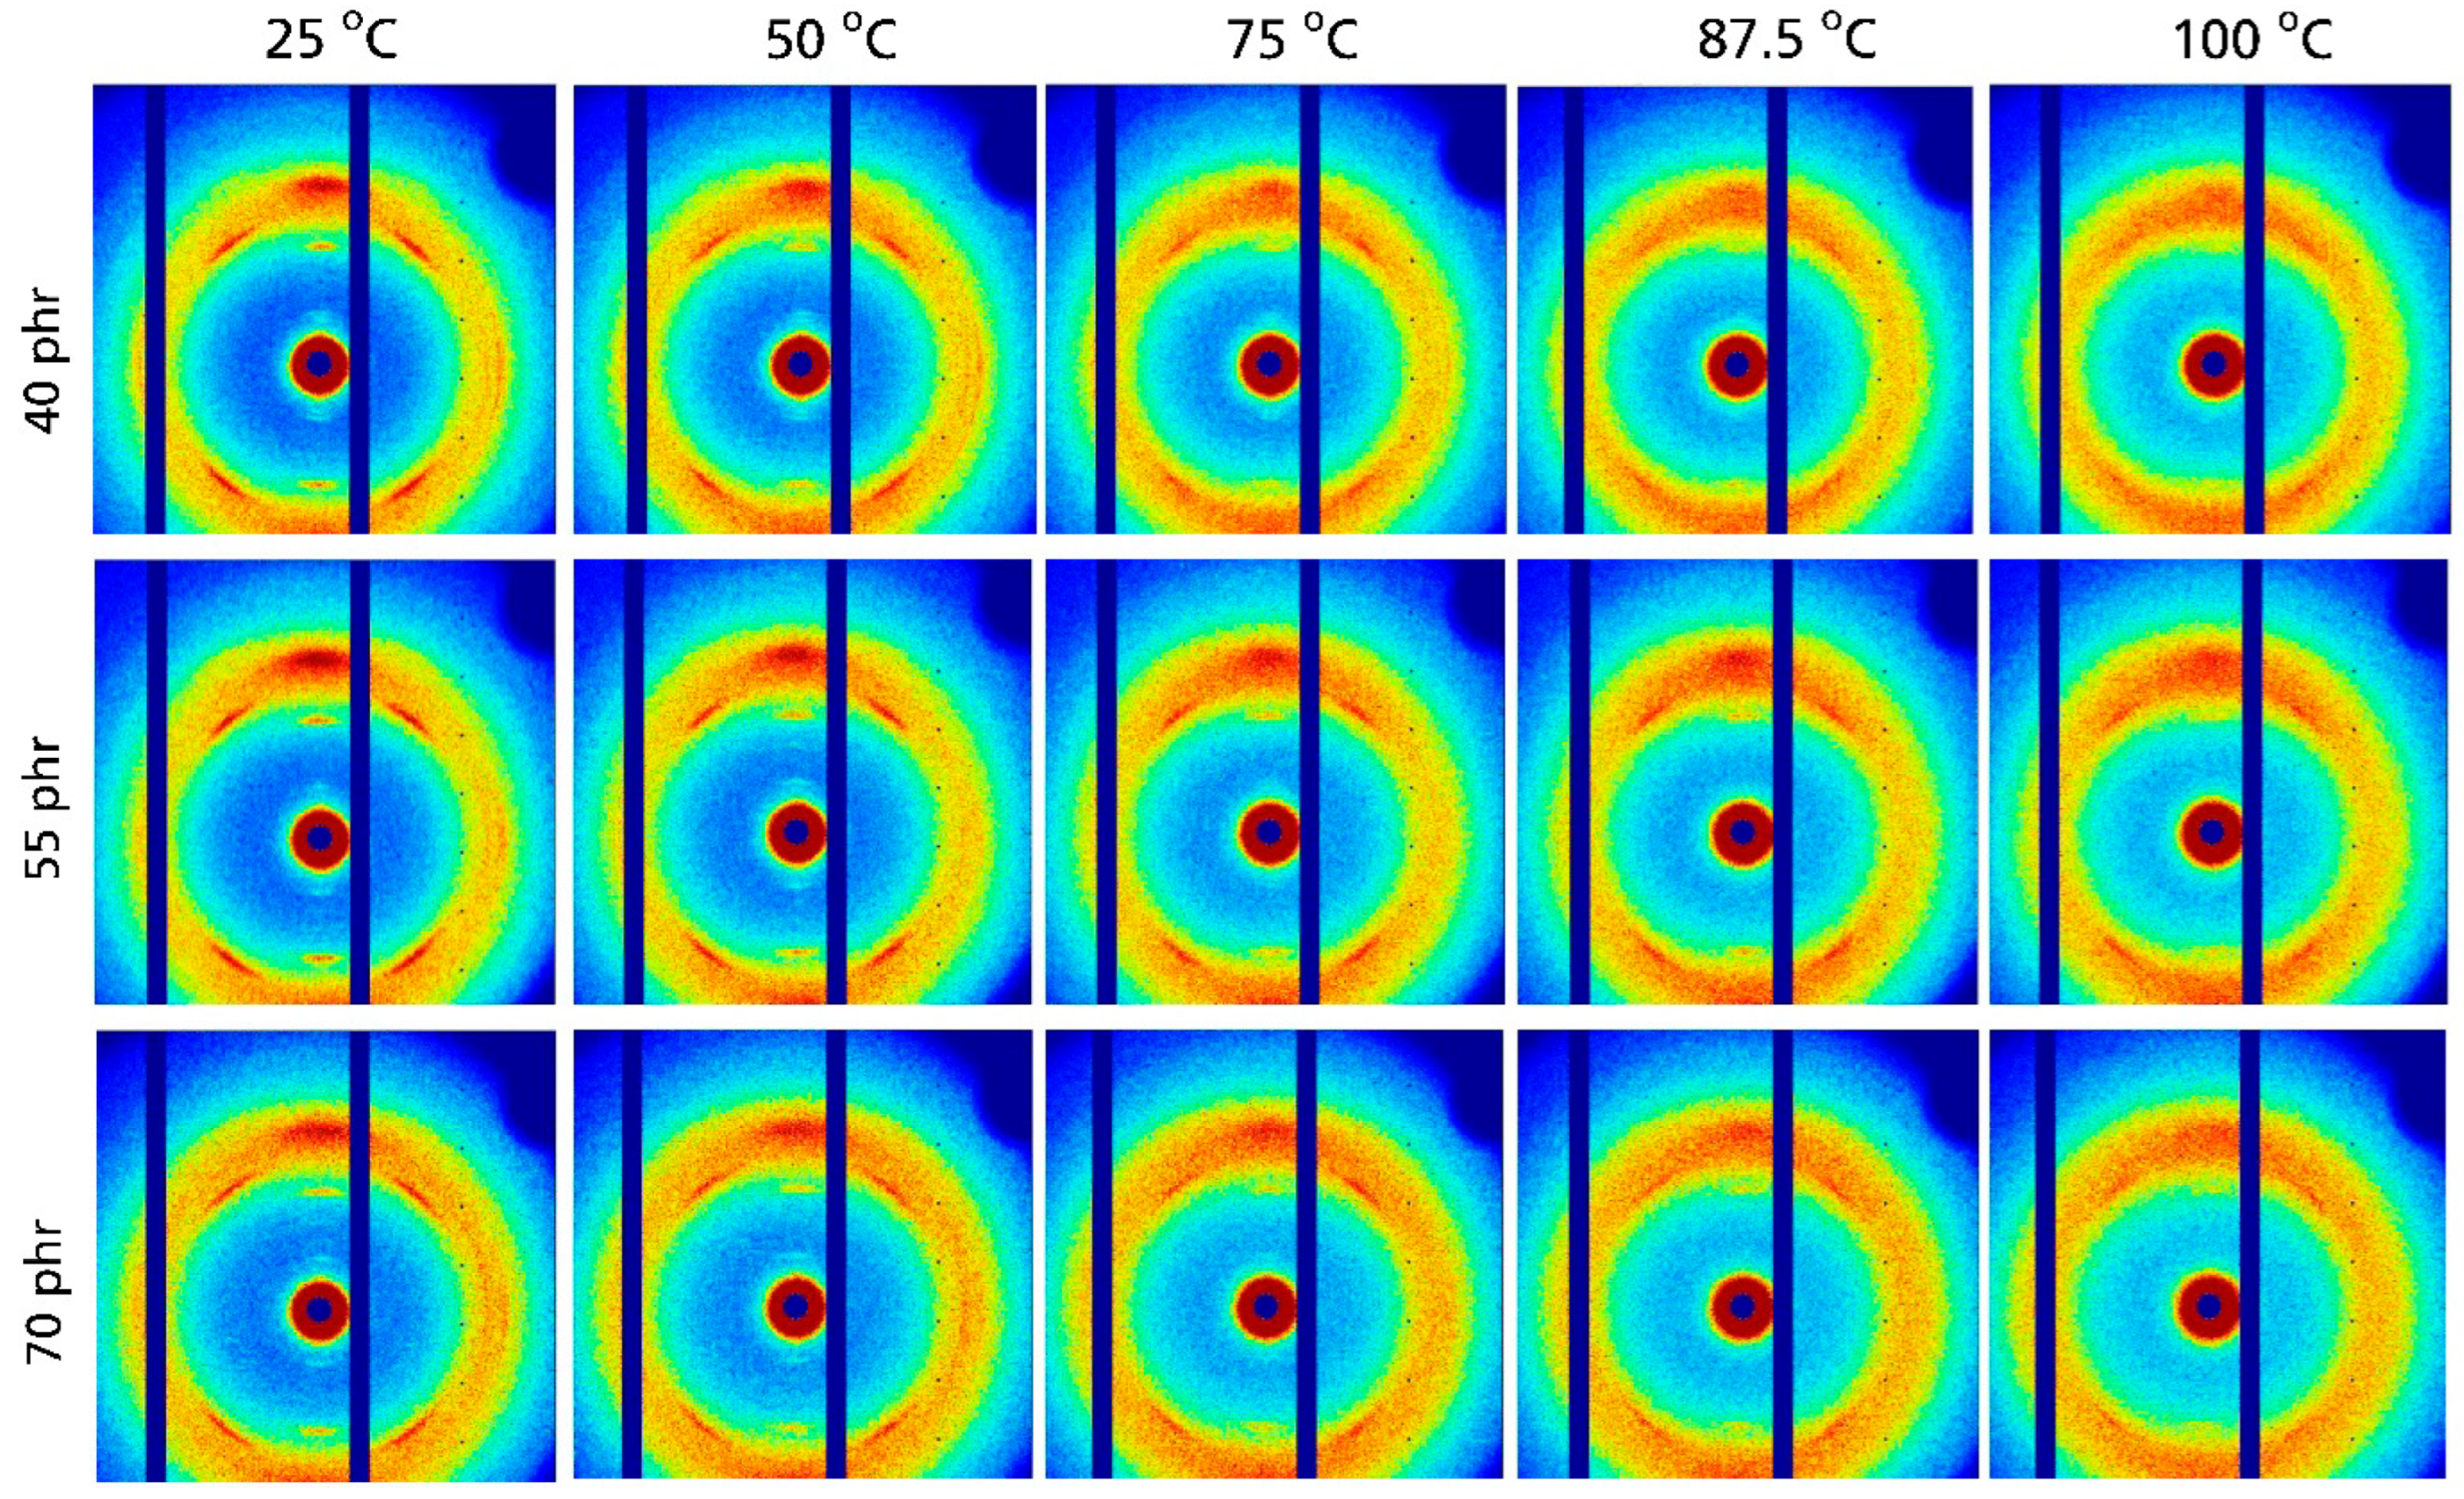
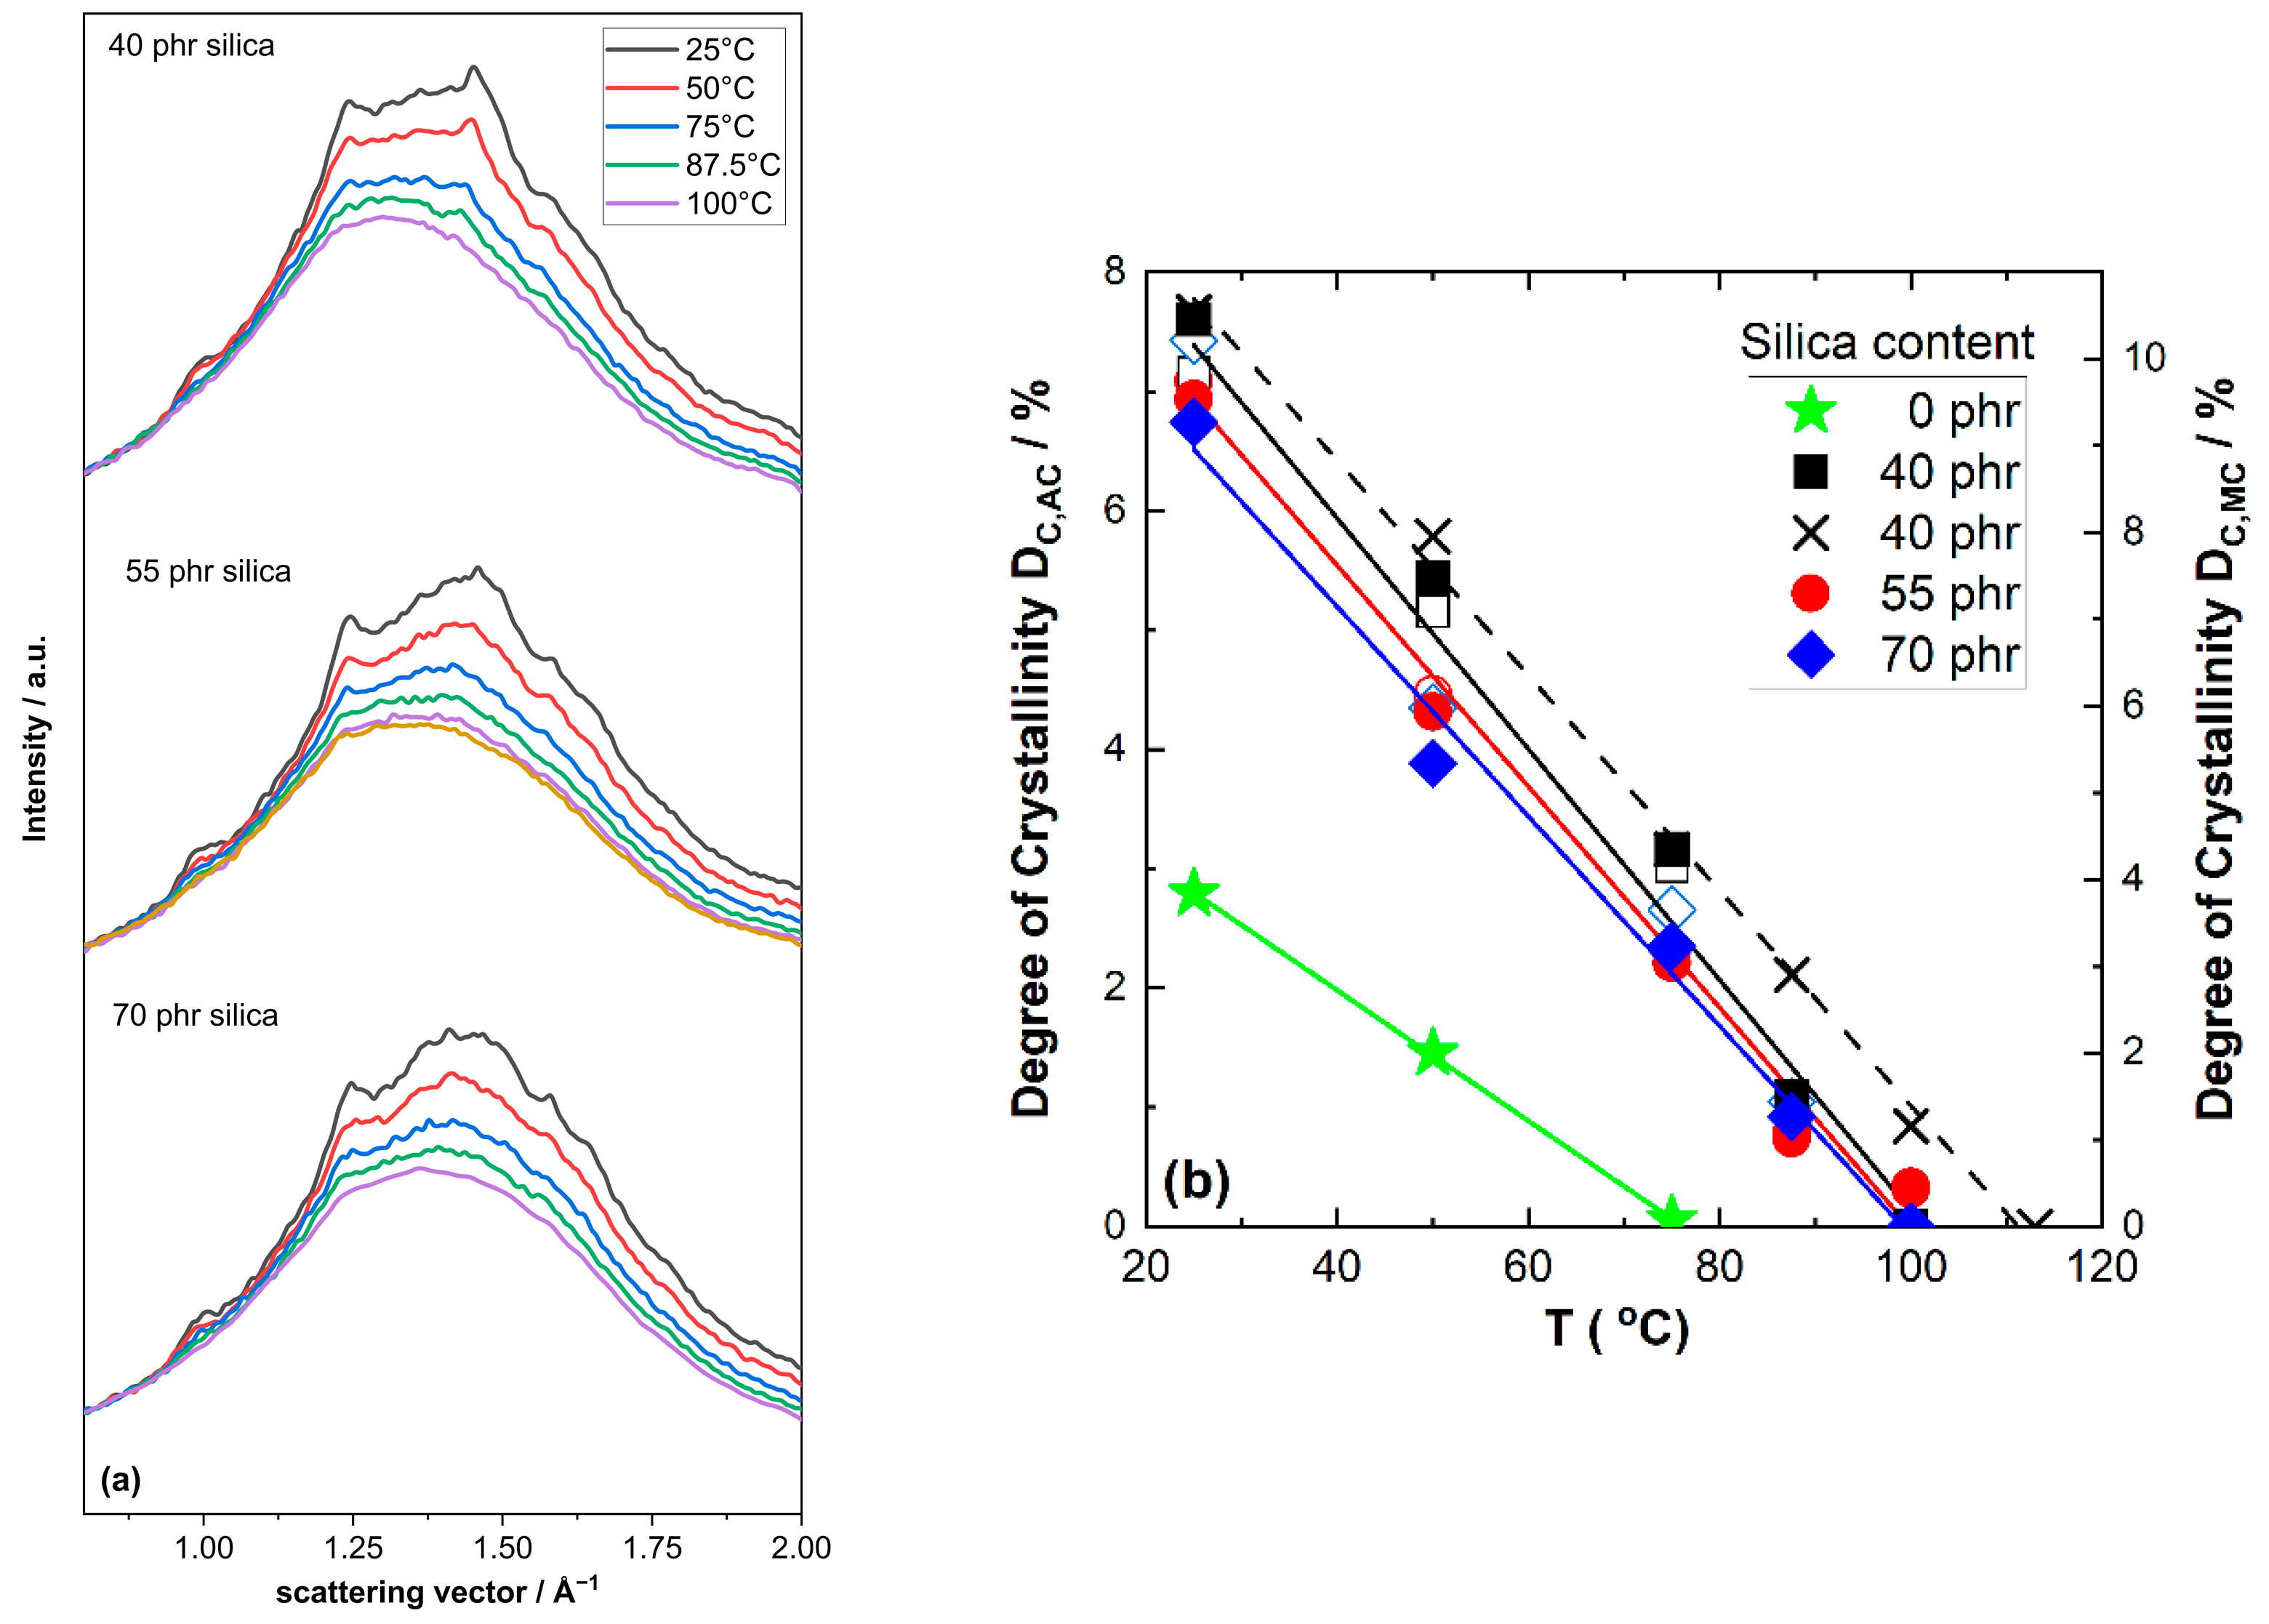
The 2D WAXD patterns for NR compounds containing 40 to 70 phr silica are compiled in
Figure 6. As in other NR compounds, significant reflections indicating the presence of crystalline NR are observed at 25 °C. The intensity of these reflections in these compounds also decreases with increasing temperature. At 100 °C there is basically only a non-oriented amorphous halo remaining. Clear indications of a crystalline fraction are absent in this temperature range for all investigated silica contents. This observation is also confirmed by the WAXD patterns obtained from azimuthal integration of the 2D patterns shown in
Figure 7a. With increasing temperature, these patterns show a systematic intensity reduction for the (200), (201) and (120) reflections appearing at about 1.0, 1.25 and 1.5 Å
−1, respectively. At 100 °C the intensity of the crystalline reflections is quite small and practically approaches zero. This basic impression is also confirmed by a further analysis of the WAXD patterns focusing on the degree of crystallinity. As shown in
Figure 7b, the D
C values for NR compounds containing silica also decrease nearly linearly with temperature. The extrapolated temperatures where the crystalline NR fraction disappears are only a few Kelvin lower compared to those observed for NR compounds filled with carbon black: independent of the filler content, a temperature of about 102 °C ± 2 °C is observed for NR compounds containing 40 and 70 phr silica; only the temperature for the middle batch filled with 55 phr silica is slightly higher (about 110 °C). The slight scatter in the data for NR compounds with different silica contents possibly reflects experimental uncertainties. The crystalline NR fraction also disappears for these compounds at higher temperatures compared to unfilled NR, where this happens at about 75–80 °C, i.e., significantly below 100 °C. Note that the obtained D
C values again depend significantly on the correction method applied. The absorption-corrected values D
C,AC are comparable to the D
C values obtained for carbon black-filled NR compounds in
Figure 5, while the NR mass-corrected values D
C,MC for silica-filled NR compounds are significantly higher (nearly 50%).
Figure 7 also shows that there is a certain scatter in the D
C values for batches with an identical recipe prepared under identical processing conditions. This scatter is small but comparable to the differences obtained for batches containing different amounts of silica. To what extent this might be due to batch-to-batch variations, local inhomogeneities in highly filled NR compounds, or experimental uncertainties of the used scattering techniques and data evaluation methods requires further investigation. The main findings of this study are, however, unaffected by these remaining uncertainties.
In summary, one can conclude from the observations in this study that:
- (i)
Strain-induced crystallization (SIC) of NR is significantly improved by the presence of 40 to 70 phr of nanofillers like carbon black or silica. The onset of SIC appears at lower strain values, and DC values are commonly higher if nanofillers are incorporated. The DC values for silica-filled NR compounds are at least similar to or higher than those of carbon black-filled compounds with similar filler mass fractions, depending on the correction factors applied (absorption correction or mass correction). The onset of strain-induced crystallization commonly appears at lower macroscopic strain values for filler-containing NR compounds compared to unfilled NR and the actual DC values for a given strain above the onset are higher for filled NR compounds. Certain differences are indicated between carbon black- and-silica filled NR compounds. This is especially seen close to the onset of strain-induced crystallization. The onset commonly appears at close to 180% for silica-filled compounds, while a slight shift with filler content is indicated in the case of carbon black-filled compounds. In addition, the rise directly after onset appears more abruptly in the case of silica-filled samples than in carbon black-filled samples, where the rise with increasing strain is nearly linear.
- (ii)
A linear decrease in the degree of crystallinity Dc at 330% strain is observed with increasing temperature for various NR compounds filled with 40 to 70 phr silica or carbon black. The extrapolated temperatures where the crystalline NR fraction disappears range from 100 to 115 °C for NR compounds filled with silica or carbon black, respectively. This is significantly higher compared to the related temperature estimated for unfilled NR, which is about 80 °C. The data indicate that the disappearance of the crystalline NR fraction occurs at temperatures a few Kelvin higher for carbon black compounds as compared to silica compounds containing a similar mass fraction of filler.
4. Discussion
Considering the commonly expected relevance of strain-induced crystallization effects for the abrasion resistance of NR-based truck tire treads, it is important to understand the influence of different nanofillers on this phenomenon. In particular, this is interesting in the light of ongoing activities towards truck tires with reduced rolling resistance, where carbon black is replaced by silica fillers in tread compounds.
The results of our study indicate that there are no strong qualitative differences in SIC between carbon black- and silica-filled NR compounds. In both cases an improvement in SIC is achieved by the presence of nanofillers, i.e., the degree of crystallization DC of filled NR compounds is at a given strain significantly higher compared to unfilled NR. This is understandable considering the fact that the local strain in a highly filled rubber compound containing a filler network is locally much higher compared to the macroscopically applied strain. This results in higher DC values for highly-filled NR compounds and can also explain why the onset of crystallization appears at lower strains in filled NR compounds. In such compounds, even at low macroscopic strains, the critical deformation needed to crystallize the NR matrix can be reached locally. In this respect, there are no qualitative differences regarding SIC in CB- and silica-filled NR compounds. Interestingly, the DC values observed for silica-filled NR compounds at high strain (>300%) and room temperature are at least similar (absorption-based correction) or even higher (NR mass fraction correction) than those of comparable carbon black-filled NR compounds. Considering further details of the SIC behavior, there are obviously also certain differences between NR compounds reinforced with carbon black and silica. These differences might be minor, but they are seemingly significant. There are at least three features that should be mentioned here: (1) the onset of SIC shifts with filler content to lower strains in CB but is nearly filler fraction-independent in silica-filled NR compounds at ambient temperature, (2) the increase in DC shortly after onset occurs more abruptly with silica fillers, and (3) the disappearance of the crystalline NR fraction at a given strain occurs at slightly higher (about 5 K) temperatures for CB-filled NR compounds compared to those containing silica.
If we focus on the most application-relevant conditions and filler contents, there are obviously no serious disadvantages of silica-filled NR compounds compared to carbon black-filled NR compounds containing up to 70 phr filler. The D
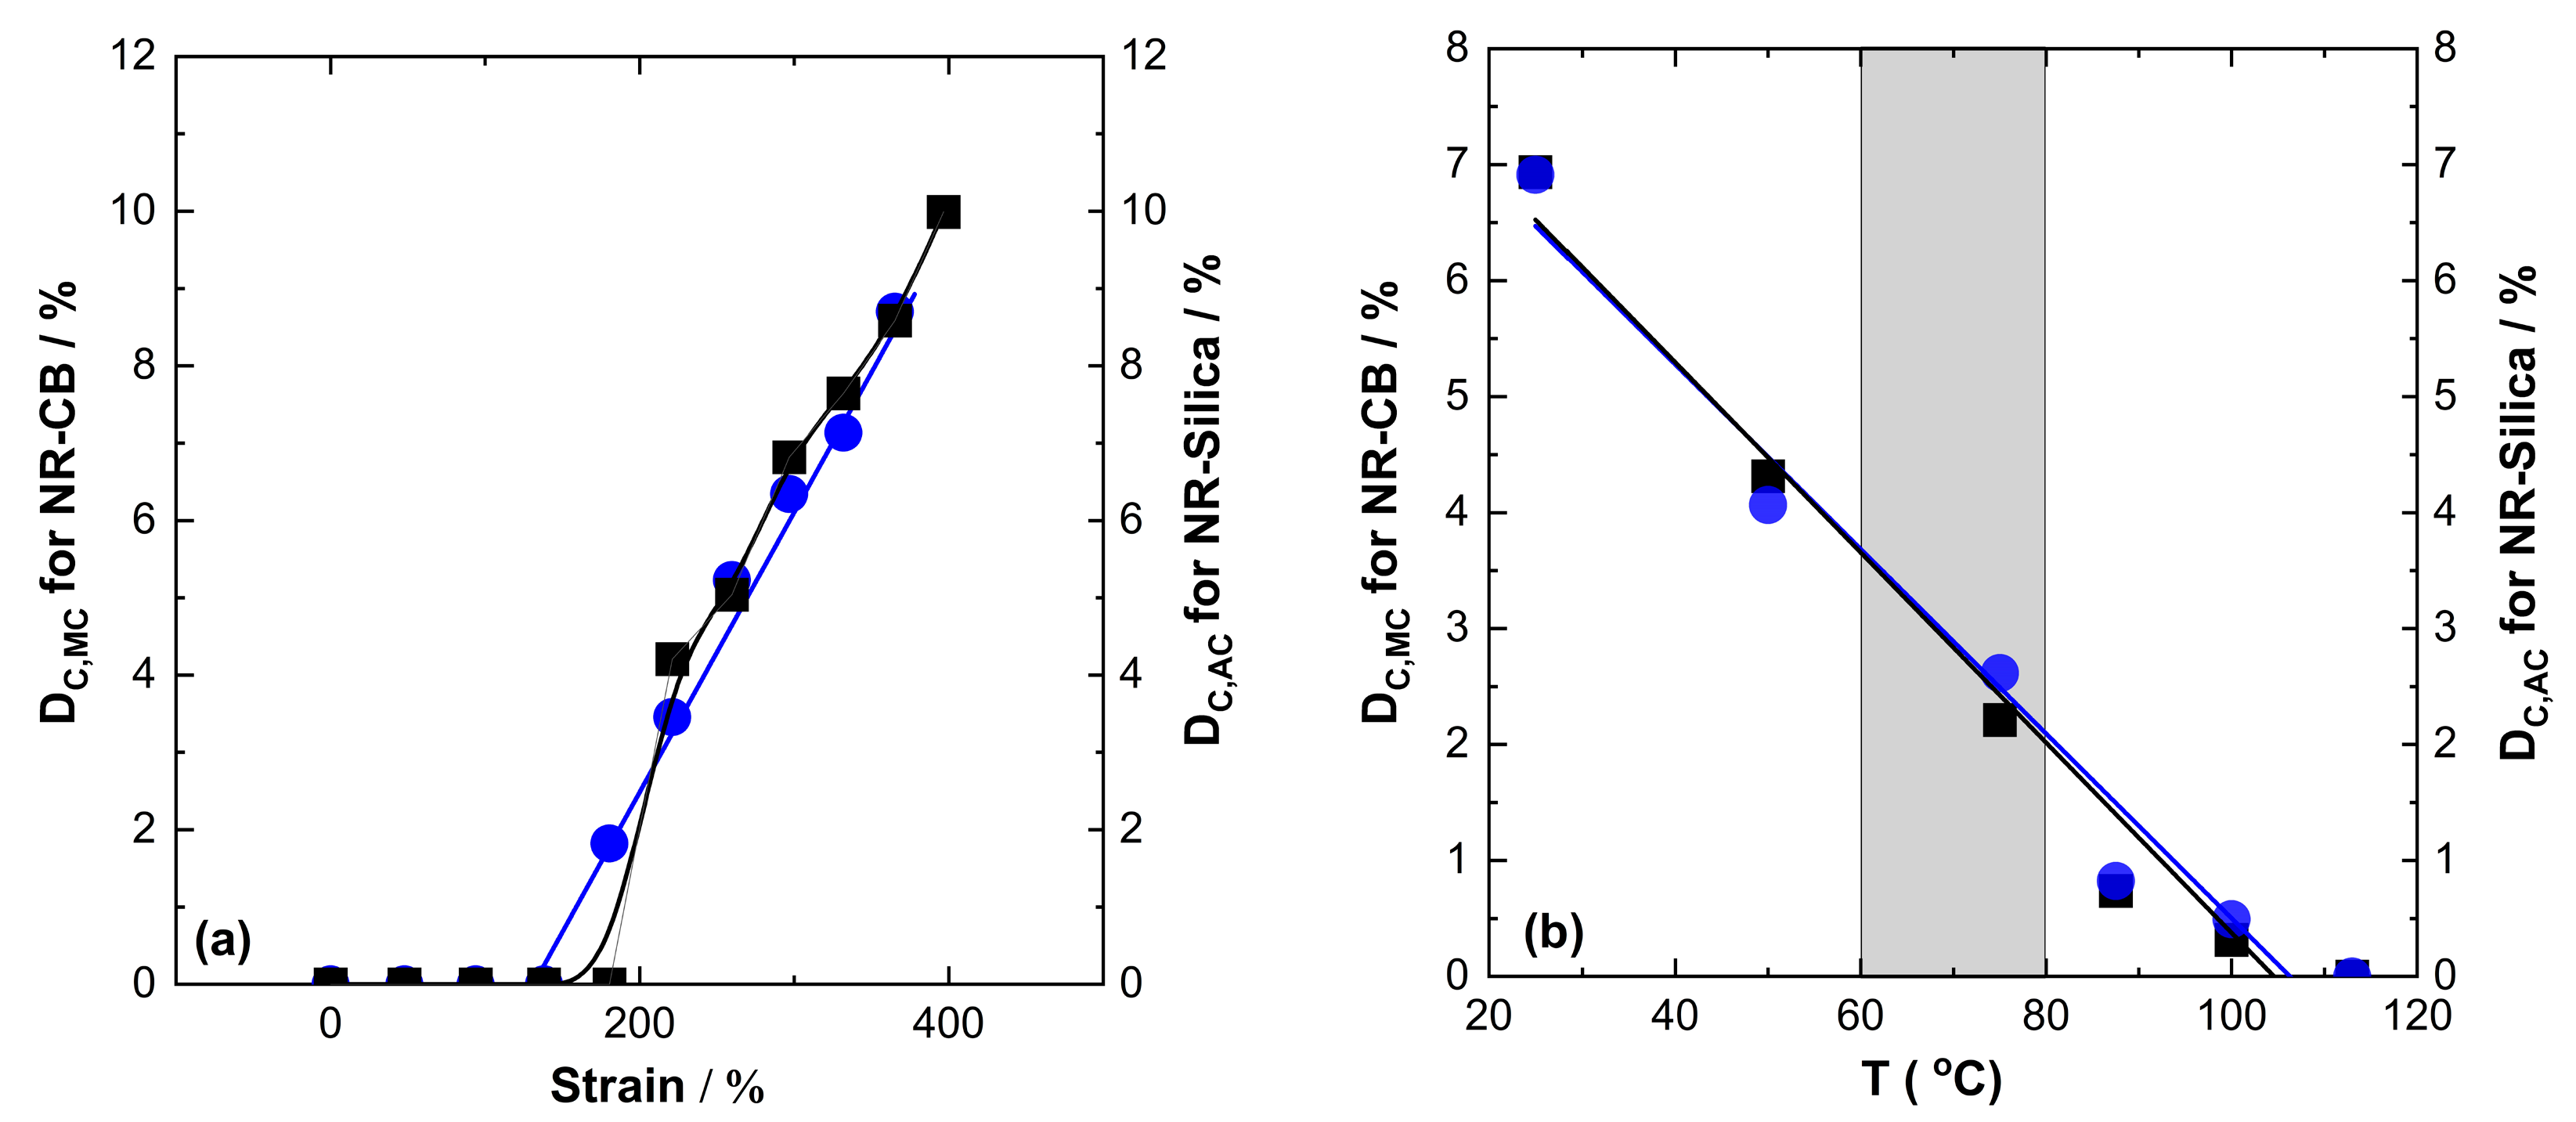
C values of the NR matrix at ambient temperature and in the temperature range relevant for truck tire treads (60–80 °C) of the silica compound are at least comparable to those of NR compounds containing carbon black under these conditions. This is clearly visible in
Figure 8, where the situation in NR compounds filled with 55 phr silica or carbon black is compared in detail. This comparison demonstrates that the strain dependence D
C of the silica-filled compound is qualitatively comparable to that in the corresponding NR compound containing carbon black apart from slight differences close to the onset (
Figure 8a), and that small differences in the temperature dependence of the D
C values should not cause disadvantages (
Figure 8b). Only for the highest filler contents under investigation (70 phr) might there be indications of certain advantages of CB-filled NR compounds regarding SIC for low strain, since the onset of SIC already occurs at 100% strain close to environmental temperatures, and at high temperatures, where SIC survives at probably 5–10 K higher temperatures compared to silica-filled NR compounds containing the same mass fraction of filler. However, even at such high CB fractions—which are not commonly used in truck tire treads—there are indeed no significant regions in the relevant strain–temperature window where carbon black should impart real advantages compared to silica regarding the SIC of the natural rubber matrix in NR compounds.
Hence, it can finally be concluded that the SIC behavior is most likely not the decisive factor for the different abrasion resistance of silica- and carbon black-reinforced NR compounds for truck tire treads. Whether minor differences in SIC achieved only under special conditions might have an influence on the abrasion of tires with silica-filled tread compounds, or other influencing factors are more relevant, cannot be determined here since tire abrasion remains a highly complex and hardly predictable phenomenon. From a practical point of view, however, it remains an extremely important task for materials science and of increasing application relevance to achieve a good compromise allowing the production of truck tires combining low CO2 emissions and reduced abrasion. Both aspects are extremely relevant for the sustainability of future cars.
