
Comparative Analysis of Plastic Waste Management Options Sustainability Profiles


Abstract
1. Introduction
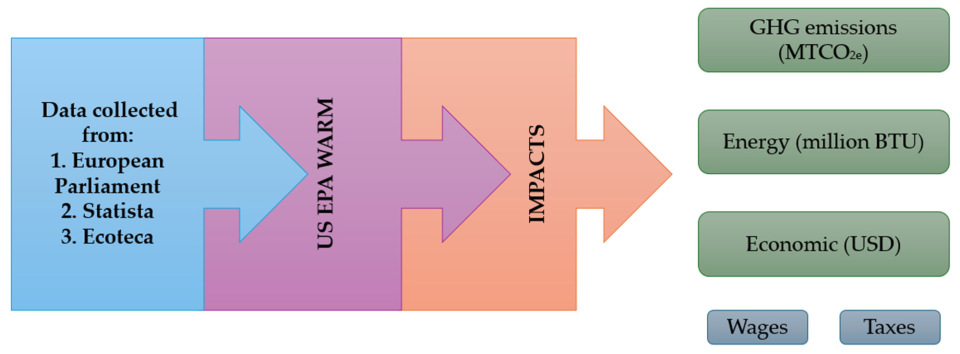
2. Methodology
2.1. Waste Reduction Model (WARM)
2.2. Plastic Waste Calculation
3. Results
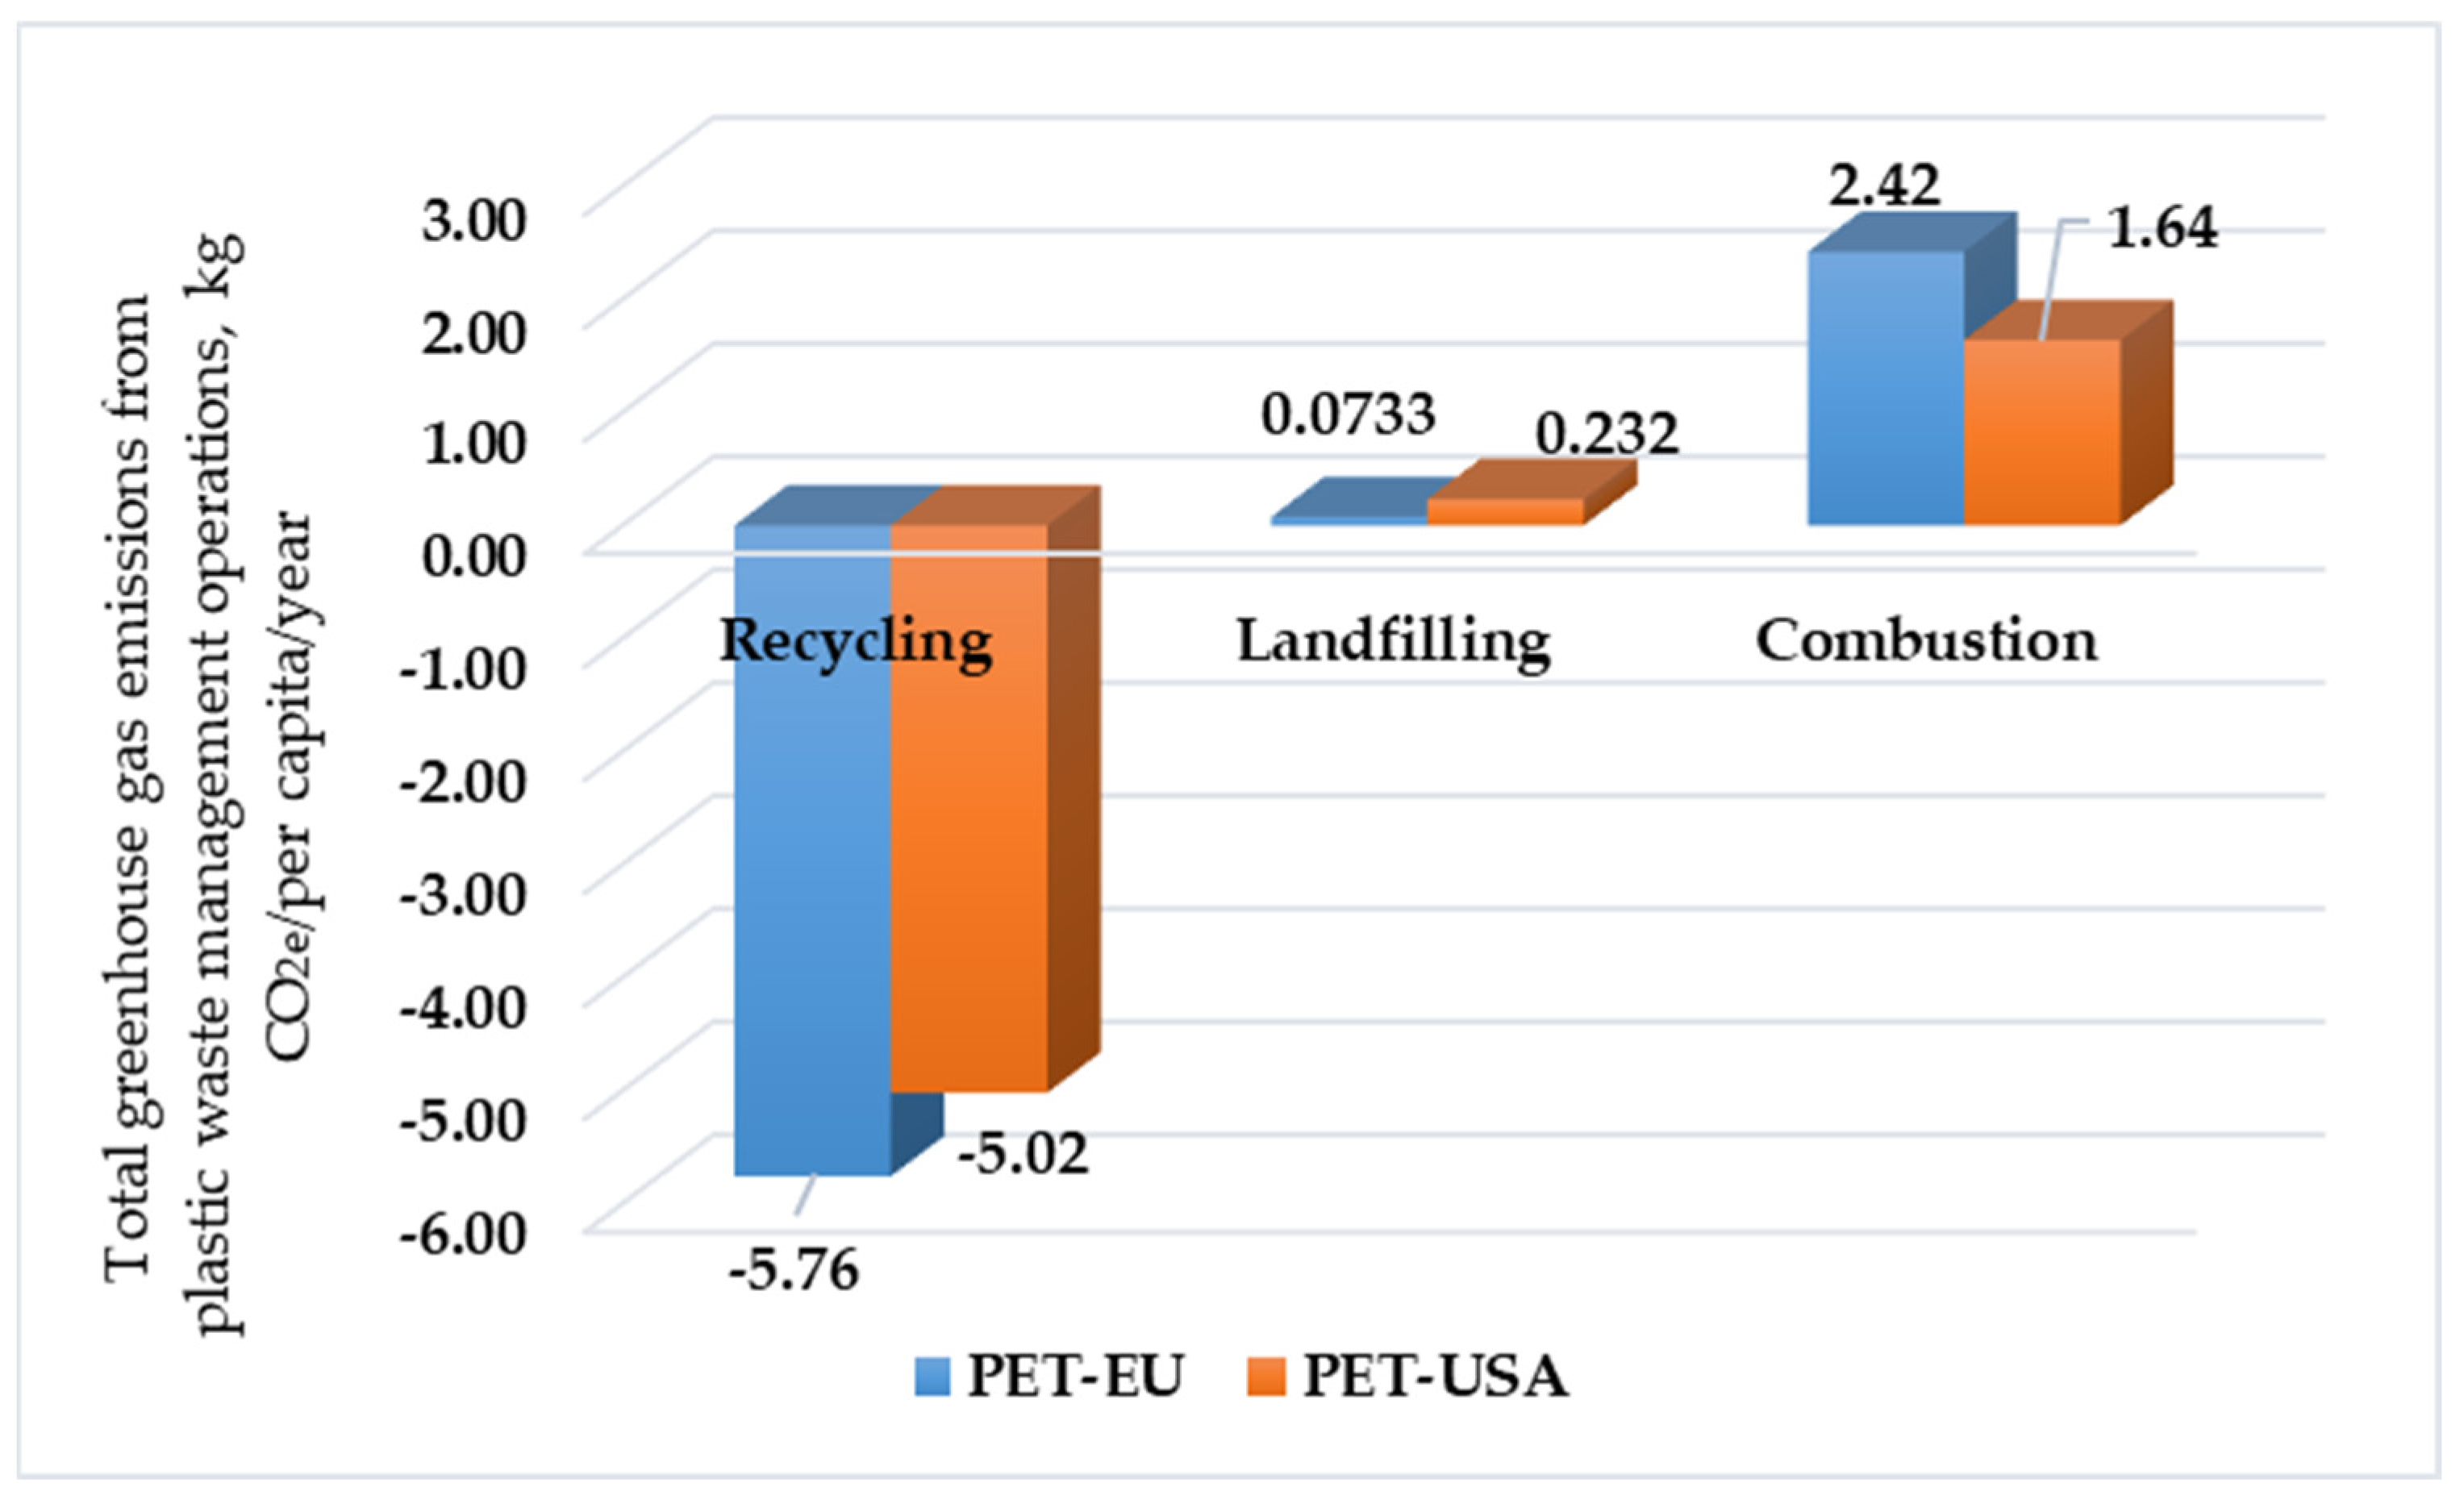
3.1. Carbon Footprint
3.2. Energy Consumption
3.3. Taxes and Wages
3.4. Romania in Relation to US EPA WARM Data
4. Discussion
Practical and Policy Implications
5. Conclusions
- The importance of recycling. The analysis demonstrated that recycling is the most effective plastic waste management strategy for reducing GHG emissions. The significant benefits in avoided emissions, particularly those for general plastic in the USA (−20 kg CO2e/capita/year) and for PET in the EU (−0.0225 MJ/capita/year energy savings), underline its essential role in the transition to a low-carbon economy.
- Regional differences and opportunities for improvement. There are clear differences in the carbon footprint and energy efficiency of waste management between the EU and the US. Although the EU achieves higher per capita energy savings for total plastic, it faces considerably higher per capita emissions from incineration and landfilling. In contrast, the US, with a remarkable benefit from recycling, has lower emissions from incineration and landfilling for overall plastic, but an untapped potential in systematically scaling up energy savings at the total plastic level compared with the EU. For Romania, positioning itself within the European dynamics offers both challenges and opportunities to learn from best practices at EU level and to accelerate its progress towards circular economy goals, by increasing recycling capacity and reducing reliance on landfilling.
- Economic implications: The study highlights that waste management policies have distinct economic implications. The EU demonstrates much higher wage generation in the PET sector (over $2.8 billion), indicating a more labor-intensive infrastructure and a deep commitment to the circular economy. In contrast, the US generates a larger tax base (over $2 billion), suggesting different tax structures or volumes of economic activity.
- The need for a multifaceted and integrated approach: Beyond technological solutions, long-term success depends on a systemic change in social behavior supported by education and public awareness campaigns. An inclusive approach is imperative, stimulating positive collaboration between policymakers, businesses, research centers, and civil society organizations. Romania, in this context, can play an active role in promoting increased public awareness and environmentally friendly consumption and waste management practices, contributing to a cleaner and more resource-efficient future.
Author Contributions
Funding
Institutional Review Board Statement
Data Availability Statement
Conflicts of Interest
Abbreviations
| HDPE | High-density polyethylene |
| LDPE | Low-density polyethylene |
| PP | Polypropylene |
| PE | Polyethylene |
| PVC | Polyvinyl chloride |
| PS | Polystyrene |
| NIR | Near-infrared spectroscopy |
| MPW | Mismanaged plastic waste |
| DRS | Deposit-return system |
| AI | Artificial intelligence |
| EU | European Union |
| US | United States of America |
| EPR | Extended Producer Responsibility |
References
- Zimmermann, L.; Dierkes, G.; Ternes, T.A.; Völker, C.; Wagner, M. Benchmarking the in Vitro Toxicity and Chemical Composition of Plastic Consumer Products. Environ. Sci. Technol. 2019, 53, 11467–11477. [Google Scholar] [CrossRef]
- Damayanti, D.; Saputri, D.R.; Marpaung, D.S.S.; Yusupandi, F.; Sanjaya, A.; Simbolon, Y.M.; Asmarani, W.; Ulfa, M.; Wu, H.-S. Current Prospects for Plastic Waste Treatment. Polymers 2022, 14, 3133. [Google Scholar] [CrossRef] [PubMed]
- Gothai, E.; Thamilselvan, R.; Natesan, P.; Keerthivasan, M.; Kabinesh, K.; Ruban, D.K. Plastic Waste Classification Using CNN for Supporting 3R’s Principle. In Proceedings of the 2022 International Conference on Computer Communication and Informatics (ICCCI), Coimbatore, India, 25–27 January 2022; pp. 01–07. [Google Scholar]
- Darko, C.; Yung, P.W.S.; Chen, A.; Acquaye, A. Review and Recommendations for Sustainable Pathways of Recycling Commodity Plastic Waste across Different Economic Regions. Resour. Environ. Sustain. 2023, 14, 100134. [Google Scholar] [CrossRef]
- Jadhav, B.; Medyńska-Juraszek, A. Use of EDTA and CaCl2 Extraction Methods to Predict the Bioavailability of Heavy Metals in Soils Polluted with Microplastics. Materials 2025, 18, 760. [Google Scholar] [CrossRef]
- Munier, B.; Bendell, L.I. Macro and Micro Plastics Sorb and Desorb Metals and Act as a Point Source of Trace Metals to Coastal Ecosystems. PLoS ONE 2018, 13, e0191759. [Google Scholar] [CrossRef]
- Javed, N.; Muhammad, S.; Iram, S.; Ramay, M.W.; Jaffri, S.B.; Damak, M.; Fekete, G.; Varga, Z.; Székács, A.; Aleksza, L. Analysis of Fuel Alternative Products Obtained by the Pyrolysis of Diverse Types of Plastic Materials Isolated from a Dumpsite Origin in Pakistan. Polymers 2023, 15, 24. [Google Scholar] [CrossRef] [PubMed]
- Hu, B.; Wang, S.; Yan, J.; Zhang, H.; Qiu, L.; Liu, W.; Guo, Y.; Shen, J.; Chen, B.; Shi, C.; et al. Review of Waste Plastics Treatment and Utilization: Efficient Conversion and High Value Utilization. Process Saf. Environ. Prot. 2024, 183, 378–398. [Google Scholar] [CrossRef]
- Lu, L.; Li, W.; Cheng, Y.; Liu, M. Chemical recycling technologies for PVC waste and PVC-containing plastic waste: A review. Waste Manag. 2023, 165, 103–112. [Google Scholar] [CrossRef]
- Ranjbar, I.; Ventikos, Y.; Arashpour, M. Zero-Shot and Few-Shot Multimodal Plastic Waste Classification with Vision-Language Models. Waste Manag. 2025, 202, 114815. [Google Scholar] [CrossRef]
- Thiounn, T.; Smith, R.C. Advances and Approaches for Chemical Recycling of Plastic Waste. J. Polym. Sci. 2020, 58, 1347–1364. [Google Scholar] [CrossRef]
- Zhang, F.; Zhao, Y.; Wang, D.; Yan, M.; Zhang, J.; Zhang, P.; Ding, T.; Chen, L.; Chen, C. Current Technologies for Plastic Waste Treatment: A Review. J. Clean. Prod. 2021, 282, 124523. [Google Scholar] [CrossRef]
- Demets, R.; Grodent, M.; Van Kets, K.; De Meester, S.; Ragaert, K. Macromolecular Insights into the Altered Mechanical Deformation Mechanisms of Non-Polyolefin Contaminated Polyolefins. Polymers 2022, 14, 239. [Google Scholar] [CrossRef]
- Van Kets, K.; Delva, L.; Ragaert, K. Onset Critical Strains as an Effective Parameter for Compatibilizer Efficiency in a Polypropylene-Poly(Ethylene Terephthalate) Blend. J. Appl. Polym. Sci. 2021, 138, 50656. [Google Scholar] [CrossRef]
- Lahtela, V.; Hyvärinen, M.; Kärki, T. Composition of Plastic Fractions in Waste Streams: Toward More Efficient Recycling and Utilization. Polymers 2019, 11, 69. [Google Scholar] [CrossRef]
- Möllnitz, S.; Feuchter, M.; Duretek, I.; Schmidt, G.; Pomberger, R.; Sarc, R. Processability of Different Polymer Fractions Recovered from Mixed Wastes and Determination of Material Properties for Recycling. Polymers 2021, 13, 457. [Google Scholar] [CrossRef] [PubMed]
- Lebreton, L.; Andrady, A. Future Scenarios of Global Plastic Waste Generation and Disposal. Palgrave Commun. 2019, 5, 6. [Google Scholar] [CrossRef]
- Winterstetter, A.; Veiga, J.M.; Sholokhova, A.; Šubelj, G. Country-Specific Assessment of Mismanaged Plastic Packaging Waste as a Main Contributor to Marine Litter in Europe. Sustainability 2022, 14, 12282. [Google Scholar] [CrossRef]
- Milbrandt, A.; Coney, K.; Badgett, A.; Beckham, G.T. Quantification and Evaluation of Plastic Waste in the United States. Resour. Conserv. Recycl. 2022, 183, 106363. [Google Scholar] [CrossRef]
- Mihai, F.-C.; Ulman, S.R. Plastic Waste Trade Issues and Environmental Contamination in Romania. In Plastic Waste Trade; Springer Nature: Cham, Switzerland, 2024; pp. 191–216. [Google Scholar] [CrossRef]
- Mihai, F.-C.; Ulman, S.-R.; Pop, V. Macro and Microplastic Pollution in Romania: Addressing Knowledge Gaps and Potential Solutions Under the Circular Economy Framework. PeerJ 2024, 12, e17546. [Google Scholar] [CrossRef] [PubMed]
- Home|Returo SGR. Available online: https://returosgr.ro/en (accessed on 12 June 2025).
- Soares, S.; Serralha, F.; Paz, M.C.; Carriço, N.; Galatanu, S.-V. Unveiling the Data: An Analysis of Plastic Waste with Emphasis on the Countries of the E3UDRES2 Alliance. Heliyon 2024, 10, e28375. [Google Scholar] [CrossRef]
- Drzyzga, O.; Prieto, A. Plastic Waste Management, a Matter for the ‘Community’. Microb. Biotechnol. 2019, 12, 66–68. [Google Scholar] [CrossRef] [PubMed]
- Liang, Y.; Tan, Q.; Song, Q.; Li, J. An Analysis of the Plastic Waste Trade and Management in Asia. Waste Manag. 2021, 119, 242–253. [Google Scholar] [CrossRef]
- Evode, N.; Qamar, S.A.; Bilal, M.; Barceló, D.; Iqbal, H.M.N. Plastic Waste and Its Management Strategies for Environmental Sustainability. Case Stud. Chem. Environ. Eng. 2021, 4, 100142. [Google Scholar] [CrossRef]
- Prata, J.C.; Patrício Silva, A.L.; da Costa, J.P.; Mouneyrac, C.; Walker, T.R.; Duarte, A.C.; Rocha-Santos, T. Solutions and Integrated Strategies for the Control and Mitigation of Plastic and Microplastic Pollution. Int. J. Environ. Res. Public Health 2019, 16, 2411. [Google Scholar] [CrossRef]
- Sheriff, S.S.; Yusuf, A.A.; Akiyode, O.O.; Hallie, E.F.; Odoma, S.; Yambasu, R.A.; Thompson-Williams, K.; Asumana, C.; Gono, S.Z.; Kamara, M.A. A Comprehensive Review on Exposure to Toxins and Health Risks from Plastic Waste: Challenges, Mitigation Measures, and Policy Interventions. Waste Manag. Bull. 2025, 2, 100204. [Google Scholar] [CrossRef]
- United States Environmental Protection Agency. Basic Information About the Waste Reduction Model. Available online: https://www.epa.gov/waste-reduction-model/basic-information-about-waste-reduction-model (accessed on 24 June 2025).
- Evoluția Ambalajelor puse pe Piață și Valorificate în Perioada 2009–2022 în România-EcotecaEcoteca. Available online: https://ecoteca.ro/evolutia-ambajelor-puse-pe-piata-si-valorificate-in-perioada-2009-2022-in-romania.html (accessed on 11 June 2025).
- Deșeurile din Plastic și Reciclarea în UE în Cifre. Available online: https://www.europarl.europa.eu/topics/ro/article/20181212STO21610/deseurile-din-plastic-si-reciclarea-in-ue-in-cifre (accessed on 11 June 2025).
- U.S. Plastic Waste Management by Method 2021. Available online: https://www.statista.com/statistics/1339439/plastic-waste-management-by-method-us/ (accessed on 12 June 2025).
- Basuhi, R.; Bhuwalka, K.; Roth, R.; Olivetti, E.A. Evaluating strategies to increase PET bottle recycling in the United States. J. Ind. Ecol. 2024, 28, 916–927. [Google Scholar] [CrossRef]
- Benyathiar, P.; Kumar, P.; Carpenter, G.; Brace, J.; Mishra, D.K. Polyethylene Terephthalate (PET) Bottle-to-Bottle Recycling for the Beverage Industry: A Review. Polymers 2022, 14, 2366. [Google Scholar] [CrossRef]
- Moliner, C.; Pasquale, G.; Arato, E. Municipal Plastic Waste Recycling through Pyrogasification. Energies 2024, 17, 1206. [Google Scholar] [CrossRef]
- Jeswani, H.; Krüger, C.; Russ, M.; Horlacher, M.; Antony, F.; Hann, S.; Azapagic, A. Life cycle environmental impacts of chemical recycling via pyrolysis of mixed plastic waste in comparison with mechanical recycling and energy recovery. Sci. Total Environ. 2021, 757, 144483. [Google Scholar] [CrossRef]
- Faisal, F.; Rasul, M.G.; Jahirul, M.I.; Schaller, D. Pyrolytic conversion of waste plastics to energy products: A review on yields, properties, and production costs. Sci. Total Environ. 2023, 863, 160721. [Google Scholar] [CrossRef]
- Prokić, D.; Stepanov, J.; Milošević, L.; Panin, B.; Stojić, N.; Pucarević, M. Evaluating Plastic Waste Management in EU Accession Countries: A Life Cycle Perspective from the Republic of Serbia with Microplastic Implications. Sustainability 2025, 17, 6297. [Google Scholar] [CrossRef]
- da Costa, J.P.; Mouneyrac, C.; Costa, M.; Duarte, A.C.; Rocha-Santos, T. The Role of Legislation, Regulatory Initiatives and Guidelines on the Control of Plastic Pollution. Front. Environ. Sci. 2020, 8, 104. [Google Scholar] [CrossRef]
- Calleja, D. Why the “New Plastics Economy” Must Be a Circular Economy. Reinventing Plastics, Special Issue 19. 2019. Available online: https://journals.openedition.org/factsreports/5123 (accessed on 23 July 2025).


| Code | Polymer Type | Examples | Degree of Recycling | References |
|---|---|---|---|---|
| 1 | PET (polyethylene terephthalate) | Beverage bottles, packaging | Easily recyclable | [2,6] |
| 2 | HDPE (high-density polyethylene) | Milk cans, detergents | Easily recyclable | [7,8] |
| 3 | PVC (polyvinyl chloride) | Pipes, windows, packaging | Difficult; requires dechlorination, chemical recycling | [9] |
| 4 | LDPE (low-density polyethylene) | Bags, foils | Limited recycling, sometimes mechanical | [10] |
| 5 | PP (polypropylene) | Containers | Mechanical or chemical recycling, variable acceptance | [11] |
| 6 | PS (polystyrene) | Casseroles, glasses, packaging | Difficult, sometimes chemical recycling | [12] |
| 7 | Other types (e.g., polycarbonate, bioplastics) | CDs, special bottles | Rarely recycled, special treatments | [7] |
| Polymer Appearance | Individual Analysis | Mixed Fraction | References |
|---|---|---|---|
| Composition identification | Precise | Limited/uncertain | [14,15] |
| Material quality | High | Variable/low | [14,15] |
| Recycling efficiency | Optimized | Low | [14,15] |
| Processing costs | Potentially smaller | Often larger | [14,15] |
| No. | Parameters | Applied Hypothesis | Justifications and Sources | Impact on Results |
|---|---|---|---|---|
| 1 | Data on plastic waste combustion from Romania | No specific data were included for the combustion of plastic waste in Romania. | Relevant and validated data on the amount of plastic waste incinerated in Romania were not available for the study year. Therefore, this stream was excluded from the LCA analysis for Romania. | Potentially underestimates the energy impact and emissions associated with incineration in Romania, if it occurs on a significant scale. |
| 2 | Source of data on plastic waste (Romania) | Data on plastic waste quantities were taken from Ecoteca. | Ecoteca is a recognized source of data and reports on waste management in Romania. [Source: https://ecoteca.ro/evolutia-ambajelor-puse-pe-piata-si-valorificate-in-perioada-2009-2022-in-romania.html (accessed on 11 June 2025)] | Ensures the use of data specific to the Romanian context. |
| 3 | Consistency of data sources across regions (EU vs. US) | Data for the EU were taken directly from the European Parliament, while for the US, aggregated data from the Statista platform were used. | This approach was necessary because of the accessibility and availability of data. | Potential variations in the collection methodologies and definition of indicators between Eurostat’s primary sources and those used by Statista for the US could influence the accuracy of direct comparisons between the two entities. |
| 4 | Year of data (Romania vs. US/EU) | Data from 2022 were used for Romania, while data from 2021 were used for the US and EU. | Complete and consolidated data for plastic waste in Romania for 2021 were not available at the time of collection; 2022 was the most recent year with complete data. It is assumed that the major trends and structure of waste streams did not change radically between 2021 and 2022 to affect overall comparability. | This may introduce a slight temporal discrepancy in direct comparisons, but it is a necessary approach in the absence of uniform data. |
| 5 | Data normalization (all regions) | All numerical data were reported per capita for each region. | This normalization ensures a fair and scientifically valid comparison between regions with different populations, eliminating the influence of absolute population size. | It allows for a more relevant interpretation of waste management performance at the individual/societal level. |
| 6 | Converting percentages to absolute volumes (US and EU) | The estimated percentages for each waste stream (recycling, incineration, landfill) were converted into absolute quantities (tons) using the total volume of PET waste generated. For percentage ranges (e.g., 25–30%), the average value (e.g., 27.5%) was used. | This conversion was necessary to feed the WARM with absolute numerical data and to ensure a coherent representation of material flows. The use of the average is standard practice in the absence of a clear indication for another value. | Absolute and per capita results depend on the accuracy of the percentages estimated in the original sources. The use of the average introduces an assumption that could slightly over/underestimate the actual volumes for each treatment category. |
| 7 | Composition of plastic waste (Romania) | A composition similar to the EU average for mixed plastic was assumed, in the absence of detailed data by polymer type (PET, HDPE, etc.) from the Ecoteca source. | Detailed data by polymer type for the total plastic waste stream in Romania were not available at the level required for modeling. This assumption was necessary to align the data with the WARM categories. | This could have affected the accuracy of the LCA assessment for individual polymers, as the WARM has different factors for each polymer type. |
| 8 | Average waste transport distance (Romania) | An average distance of 100 km was estimated for transporting waste to treatment/disposal facilities. | This value is an estimate based on average transport distances in European countries with similar population density and waste management infrastructure. There is no centralized, official data. | An underestimation/overestimation of distance could slightly influence transportation emissions and fuel consumption in the WARM. |
| 9 | Energy efficiency of mechanical recycling (Romania) | WARM default values were applied for the energy efficiency of mechanical recycling processes. | No specific data on the energy efficiency of recycling facilities in Romania were available. WARM values are considered a reasonable starting point in the absence of local data. | The values used may differ from the actual performance of Romanian installations, affecting the calculation of energy savings. |
| Romania | Reference | |||
|---|---|---|---|---|
| Kilograms generated per capita | Kilograms recycled per capita | Kilograms landfilled per capita | Kilograms combusted per capita | [30] |
| 25.7 | 22.3 | 3.3 | - | |
| European Union | Reference | |||
| Kilograms generated per capita | Kilograms recycled per capita | Kilograms landfilled per capita | Kilograms combusted per capita | [31] |
| 24.7 | 18 | 1.3 | 5.3 | |
| United States of America | Reference | |||
| Kilograms generated per capita | Kilograms recycled per capita | Kilograms landfilled per capita | Kilograms combusted per capita | [32] |
| ≈150 | ≈7.1 | ≈126.4 | ≈16.5 | |
| Region | Category Waste—PET | Total Quantity (Tons) | Percentage of Total Generated (%) | Quantity per Capita (Kg/Capita) | References |
|---|---|---|---|---|---|
| EU | Total generated | 5,000,000 | 100% | ≈11 | [31] |
| Recycled | 2,500,000 | 50% | ≈5 | ||
| Combusted | 875,000 | 30–40%—35% calculation | ≈1 | ||
| Landfilled | 1,625,000 | 10–20%—15% calculation | ≈3 | ||
| USA | Total generated | 6,000,000 | 100% | ≈17 | [33,34] |
| Recycled | 1,650,000 | 25–30%—27.5% calculation | ≈4 | ||
| Combusted | 450,000 | 5–10%—7.5% calculation | ≈1 | ||
| Landfilled | 3,900,000 | 60–70%—65% calculation | ≈11 |
| Articles/References | Technology Focus | Energy Consumption | GHG Emissions | Yield Efficiency/Key Results |
|---|---|---|---|---|
| “Municipal Plastic Waste Recycling through Pyrogasification” [35] | Mechanical recycling, chemical recycling (glycolysis, depolymerization) | Mechanical: 0.5–2.5 MJ/kg; chemical: 1.5–10 MJ/kg | 7–88% less than alternatives | Mechanical: 60–90% (clean); chemical: 88–99% (PET) |
| “Life Cycle Environmental Impacts of Chemical Recycling via Pyrolysis of Mixed Plastic Waste in Comparison with Mechanical Recycling and Energy Recovery” [36] | Mechanical recycling, pyrolysis, combined | Mechanical: 13.32 MJ/kg; pyrolysis: higher | 0.48 kg CO2e/kg (combined) | Combined: 16% higher carbon efficiency |
| “Pyrolytic Conversion of Waste Plastics to Energy Products: A Review on Yields, Properties, and Production Costs” [37] | Pyrolysis vs. mechanical recycling, waste-to-energy incineration (WtE) | Pyrolysis: ~50% lower than WtE | Pyrolysis: −0.45 t CO2e/t; WtE: 1.89 t CO2e/t | Similar to mechanical treatment if recycled quality is considered |
| “Evaluating Plastic Waste Management in EU Accession Countries: A Life Cycle Perspective from the Republic of Serbia with Microplastic Implications”, [38] | Landfilling, mechanical recycling, incineration | Landfilling: ~580 MJ/ton PET; mechanical: ~1.450 MJ/ton PET; incineration: ~2.100 MJ/ton PET | Landfilling: ~1.280 kg CO2e/t; mechanical: ~530 kg CO2e/t; incineration: ~870 kg CO2e/t | Landfilling: Slow degradation—only 1–5% in 150 years. Major risk of persistent microplastics in soil and water; mechanical: avoided emissions and consumption (LCA net benefits); incineration: recovered electricity. Toxic emissions: dioxins, furans. Microplastics detected in ash and slag |
| Romania | GHG emissions from production (Kg CO2e)/per capita/year | GHG emissions from recycling (Kg CO2e)/per capita/year | GHG emissions from landfilling (Kg CO2e)/per capita/year |
| ≈43 | −18 | ≈0.06 | |
| Energy Consumption MJ/per capita/year | |||
| ≈−0.08 | |||
| Taxes $/per capita/year | |||
| ≈3.90 | |||
| Wages $/per capita/year | |||
| ≈24.02 | |||
| Main Feature | United States of America | European Union | Romania | References |
|---|---|---|---|---|
| Landfill/incineration costs | Lower ($55/ton). Reduces economic incentives for recycling. | Higher ($80–125/ton). Make recycling more economically attractive. | Lower costs but rising because of EU pressure. | [39,40] |
| Regulatory targets | No federal recycling mandates; state-level variation. | Ambitious recycling quotas (50% by 2025, 55% by 2030); strict directives. | Bound by EU targets but struggles with implementation. | [39,40] |
| Producer responsibility (PR) | Limited or nonexistent PR policies at the national level. Producers are less accountable. | Extensive and mandatory REP schemes. Producers are responsible for the waste management of their products. | Extensive and mandatory REP schemes. Producers are responsible for the waste management of their products. | [39,40] |
| Circular economy objectives | Less developed. Focus on exporting low-value plastics, not developing domestic markets. | Strategic priority. Promoting closed-loop recycling, secondary materials markets, design for recycling. | Dependent on national capacity to enforce EU rules. | [39,40] |
| Central Theme | Practical Implications | Policy Implications |
|---|---|---|
| 1. Reconfirming recycling priority and expanding capacity | Plastic and packaging companies should intensify efforts in design for recycling and use of recycled content. Private investment should be stimulated in modern sorting and recycling facilities (mechanical, chemical). Consumers should be continuously educated on the importance and correct methods of sorting at source. | Mandatory recycling targets: Expansion and strict enforcement for various types of plastic. Extended Producer Responsibility (EPR): Strengthening and expanding EPR schemes for financial accountability of producers throughout the entire life cycle (collection, sorting, recycling). Recycled content standards: Minimum requirements for new products and packaging, creating a stable market for recycled materials. |
| 2. Reducing dependence on positive-emissions methods (landfilling and incineration) | Sanitation operators and municipalities should prioritize diversifying treatment options, reducing reliance on landfill and direct incineration in favor of recycling. Advanced energy recovery technologies (if needed for nonrecyclables) should be optimized to minimize residual emissions. | Landfill and incineration taxes: Imposing or increasing these taxes to discourage the practices and direct flows towards recycling. Progressive bans: Implementing bans on the landfilling of certain types of recyclable plastic waste. |
| 3. Romania’s role in the European context | The implementation of European directives on plastic waste management should be accelerated, with focus on developing selective collection and recycling capacities, especially in rural and poorly covered urban areas. Infrastructure should be modernized to reduce dependence on landfill. | Romanian authorities should develop and implement specific national policies to integrate EU recycling objectives, stimulate investments in clean technologies, and implement economic instruments (e.g., landfill taxes). Public education and awareness campaigns should mobilize the population in correct sorting. |
Disclaimer/Publisher’s Note: The statements, opinions and data contained in all publications are solely those of the individual author(s) and contributor(s) and not of MDPI and/or the editor(s). MDPI and/or the editor(s) disclaim responsibility for any injury to people or property resulting from any ideas, methods, instructions or products referred to in the content. |
© 2025 by the authors. Licensee MDPI, Basel, Switzerland. This article is an open access article distributed under the terms and conditions of the Creative Commons Attribution (CC BY) license (https://creativecommons.org/licenses/by/4.0/).
Share and Cite
Enache, M.-M.; Gavrilescu, D.; Teodosiu, C. Comparative Analysis of Plastic Waste Management Options Sustainability Profiles. Polymers 2025, 17, 2117. https://doi.org/10.3390/polym17152117
Enache M-M, Gavrilescu D, Teodosiu C. Comparative Analysis of Plastic Waste Management Options Sustainability Profiles. Polymers. 2025; 17(15):2117. https://doi.org/10.3390/polym17152117
Chicago/Turabian StyleEnache, Madalina-Maria, Daniela Gavrilescu, and Carmen Teodosiu. 2025. "Comparative Analysis of Plastic Waste Management Options Sustainability Profiles" Polymers 17, no. 15: 2117. https://doi.org/10.3390/polym17152117
APA StyleEnache, M.-M., Gavrilescu, D., & Teodosiu, C. (2025). Comparative Analysis of Plastic Waste Management Options Sustainability Profiles. Polymers, 17(15), 2117. https://doi.org/10.3390/polym17152117