3.1. The Microwave Inspection System for HDPE Pipes
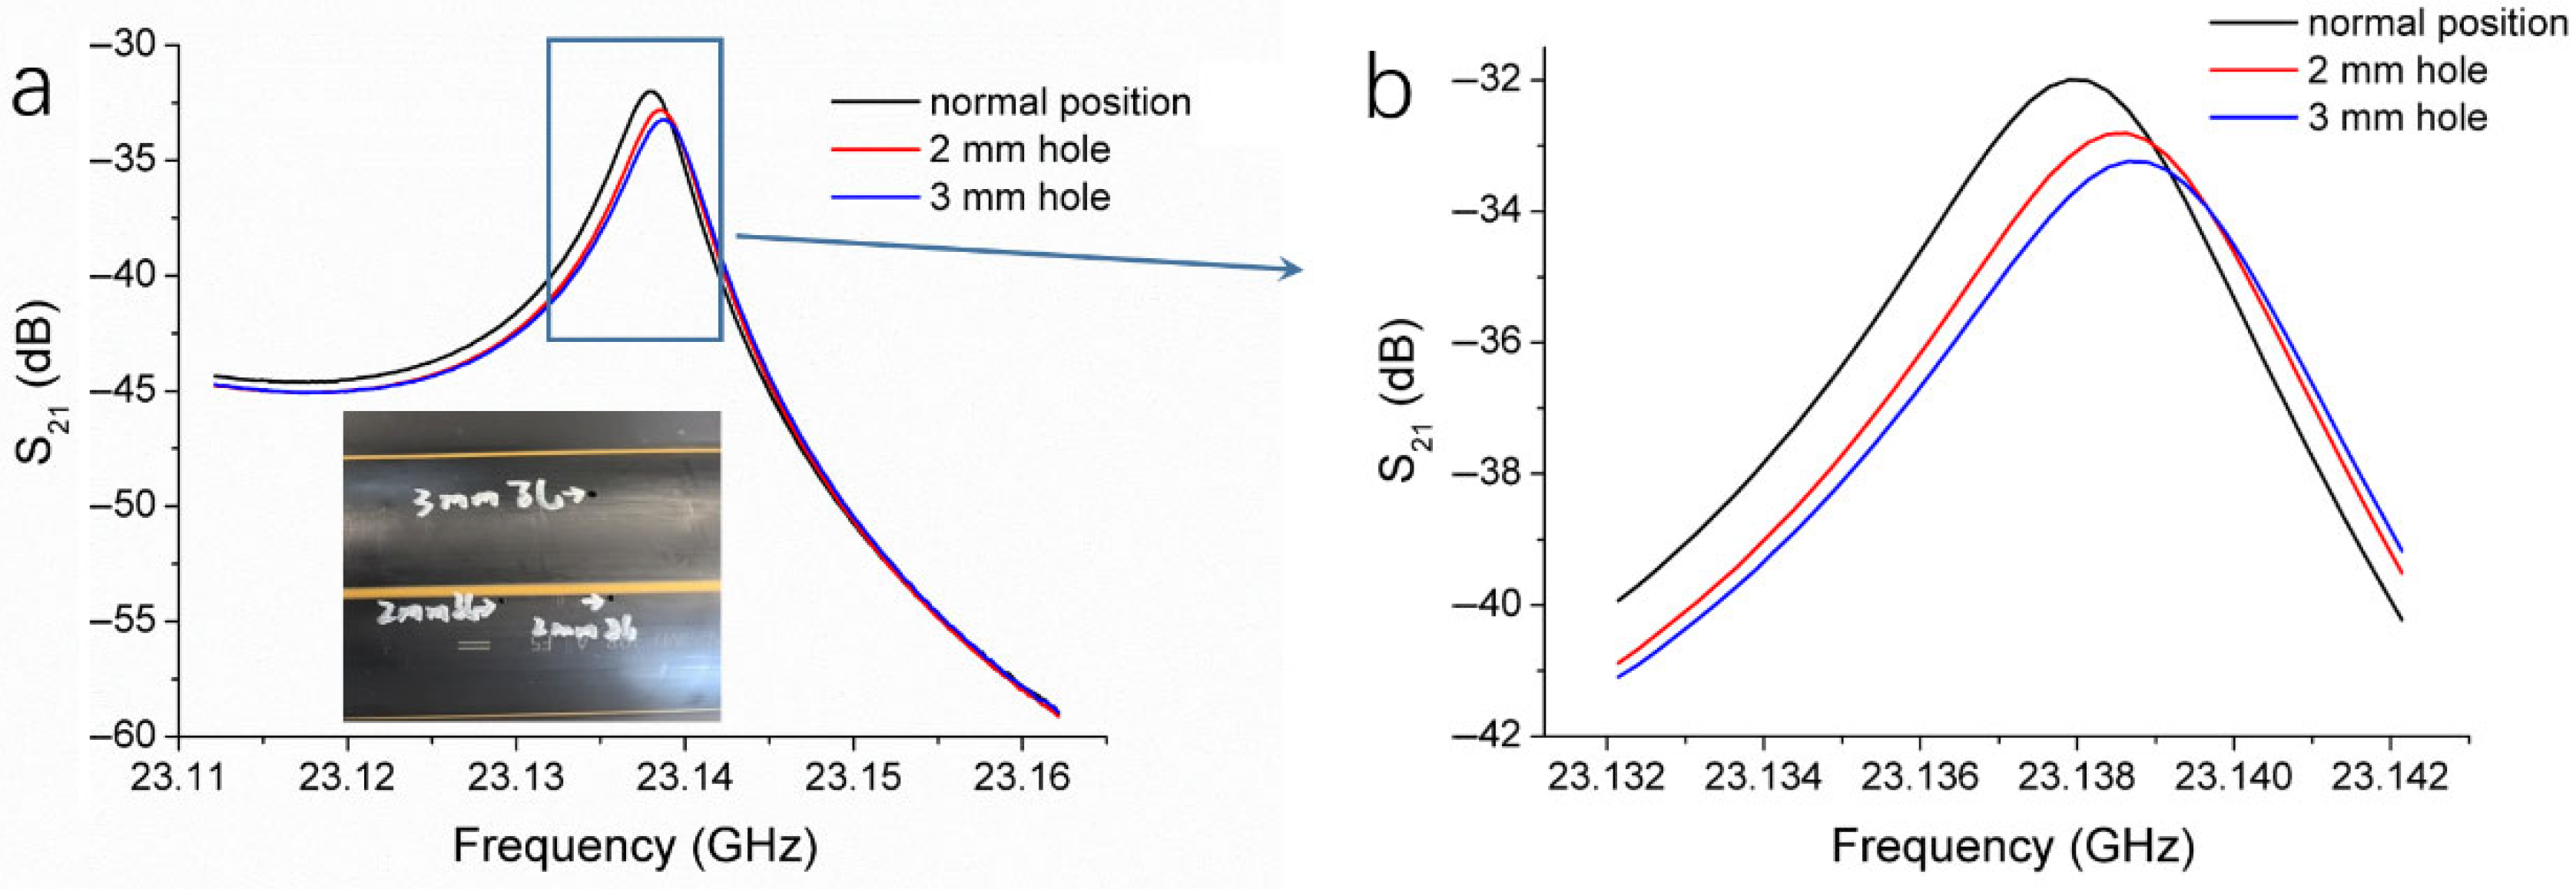
To clarify the core principles of our microwave inspection system and its corresponding method, we chose voids as typical defects for testing, since the air has a very low permittivity. Holes with diameters of 2 mm and 3 mm, both with a depth of 10 mm, were drilled into the wall of an HDPE pipe, as shown in the inset of
Figure 4. The HDPE pipe was scanned using the microwave resonant probe, with a constant standoff distance between the probe and the pipe surface throughout the entire scanning process. Three resonance curves were recorded, as follows: one when the probe was positioned at a normal (defect-free) location on the pipe, one at the 2 mm hole, and one at the 3 mm hole, as shown in
Figure 4a. All resonance peaks were located within the frequency range of 23.135 to 23.140 GHz. Compared with the normal location, the resonance peak at the 2 mm hole exhibited a decrease in magnitude and a slight frequency shift. At the 3 mm hole, the peak magnitude was further reduced, and the peak position shifted towards higher frequencies.
Figure 4b provides an enlarged view of the boxed region in
Figure 4a, clearly showing the changes in the resonance curves caused by the presence of the 2 mm and 3 mm holes. The larger the hole, the more pronounced the changes, with greater decreases in resonance peak magnitude and larger frequency shifts.
As the probe moves along the surface of the HDPE pipe, the resonance curve remains virtually unchanged in defect-free areas. However, when the probe passes over a hole, the reflected microwave signal alters, disturbing the resonant state in the cavity and causing a noticeable change in the resonance curve compared to the defect-free condition. As the hole size increases, the disturbance to the resonant state becomes more pronounced. The permittivity and permeability of holes (air) are different from those of HDPE. This change in material influences the electromagnetic wave propagation characteristics and disturbs the electromagnetic field distribution, which in turn affects the reflected wave. For HDPE, variations in permeability are usually negligible. The reflection coefficient (
R) at the interface between two dielectric media, which is a measure of how much of a microwave is reflected when it encounters the interface, can be calculated by a simplified model, as in the following Equation (1) [
25]:
where
ε1 and
ε2 are the relative permittivities of the two media. When air replaces HDPE in a hole, more microwaves are reflected at the hole position as the air has a permittivity lower than HDPE (
ε1 ≠
ε2). The resonance state in the cavity is, thus, disturbed. The larger the size of the hole, the larger the area where reflection occurs. Therefore, the S
21 magnitude of the resonance peak changes with the size of the holes.
In addition, changes in resonant frequency can be described by the following Equation (2) [
26]:
where
ω1 and
ω2 are the angular frequency before and after the disturbance, respectively;
E1 and
H1 are electric and magnetic field distributions of the original system;
E2 and
H2 are electric and magnetic field distributions after the disturbance; Δ
ε and Δ
µ are the changes in the permittivity and permeability due to the disturbance, respectively. For the holes that replace the HDPE (Δ
µ is usually negligible.), Δ
ε < 0, because the permittivity of air is generally considered to be infinite. According to Equation (2), the resonance frequency increases as a hole replaces the HDPE, which explains the frequency shifts in
Figure 4. These results demonstrate that our microwave non-destructive testing system is highly sensitive to changes in reflected microwave signal and capable of detecting material variations of HDPE pipes.
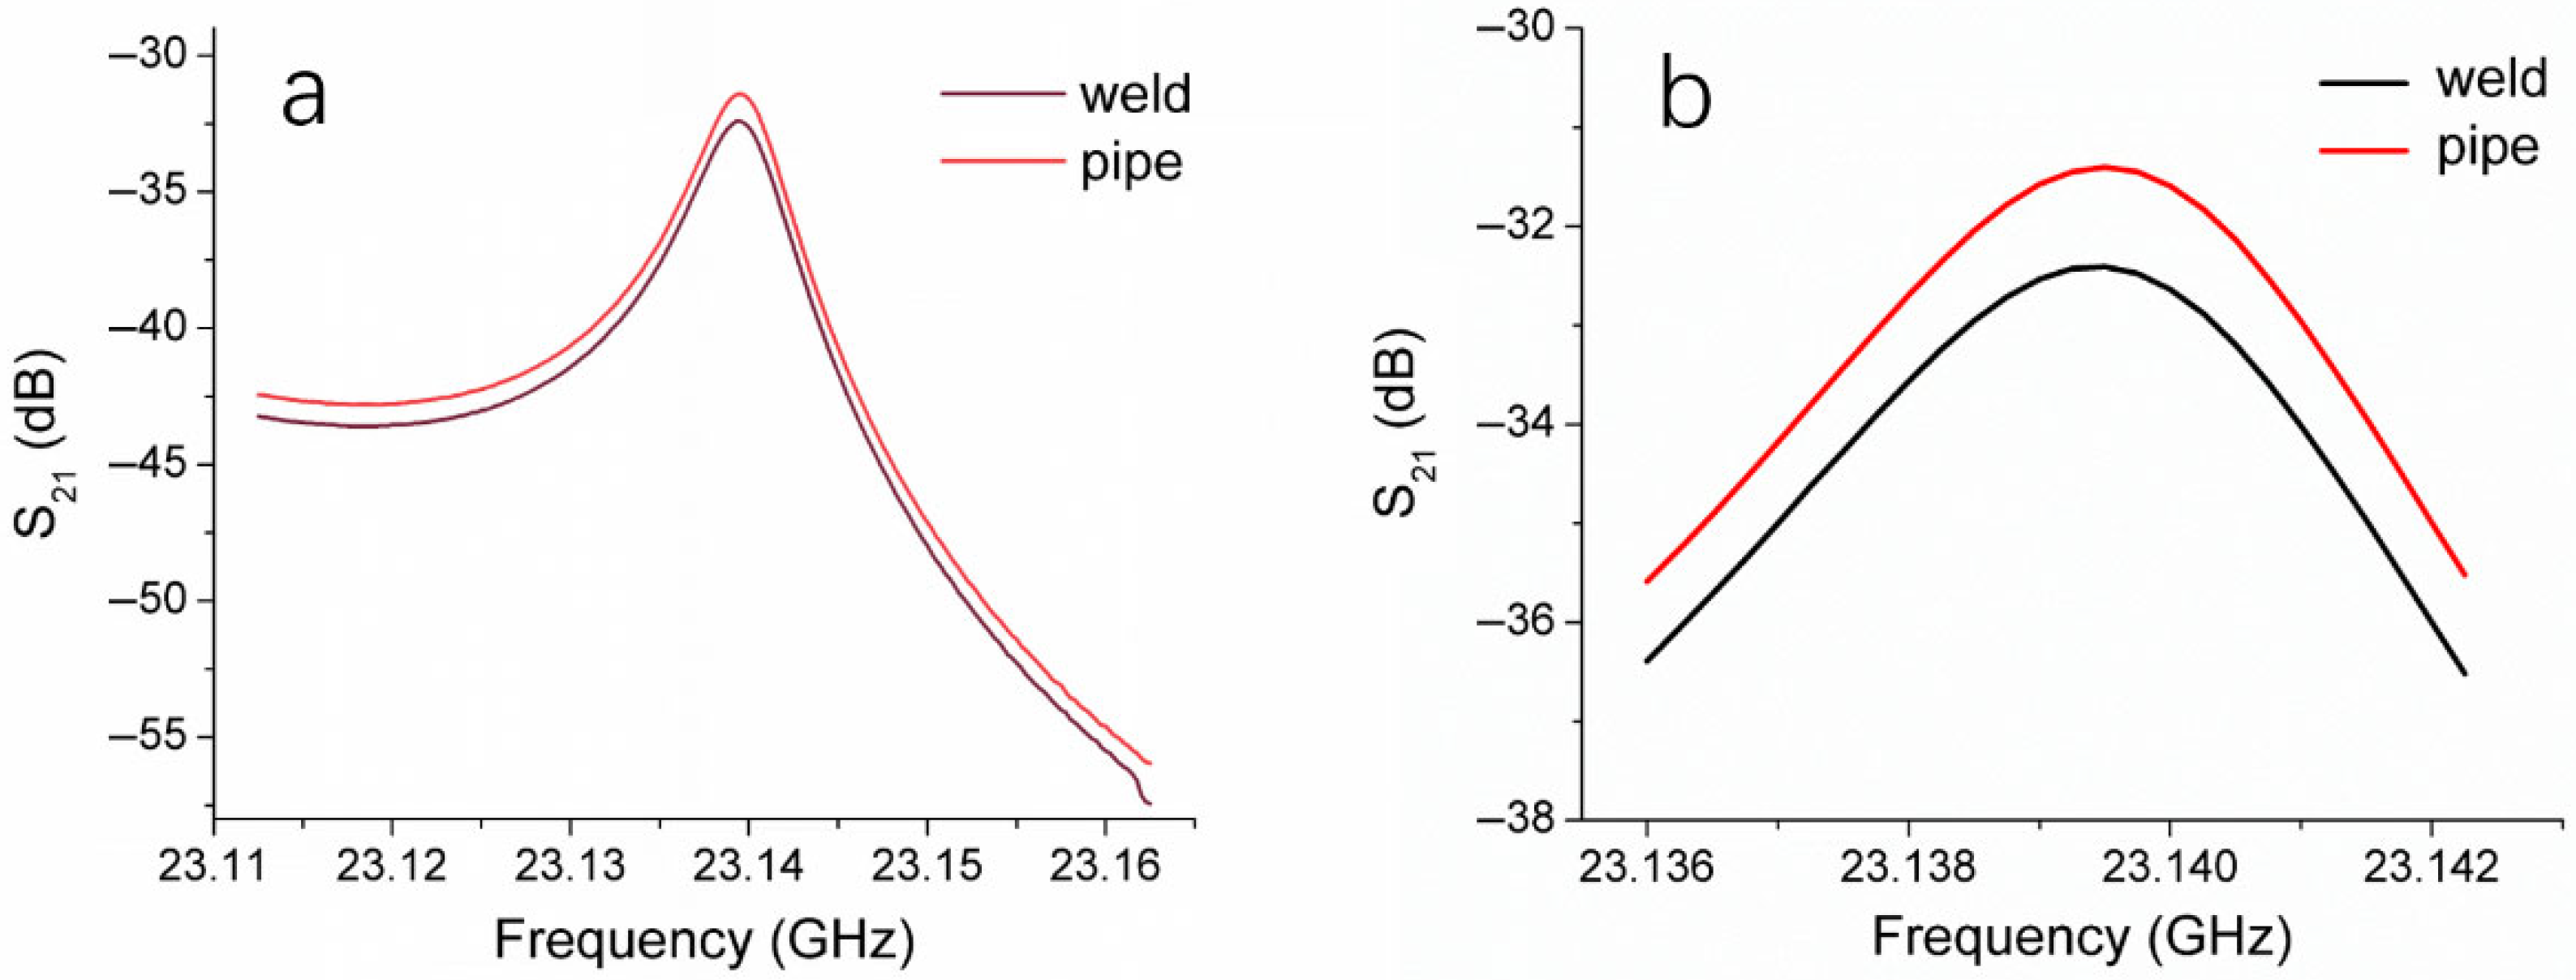
By connecting the ends of two HDPE pipes in a heated and molten state, a thermal fusion weld was formed upon cooling. Under molten conditions and applied pressure, the polyethylene molecular chains diffuse and are entangled, subsequently bonding together during the cooling process. Throughout the thermal fusion process, the molecular chain orientation and crystallinity of the pipe material may change, resulting in variations in the permittivity. Consequently, the response of the HDPE weld differs from that of the pipe body to microwave signals.
We employed the microwave resonant probe to test the thermal fusion weld of one HDPE pipe and a defect-free location on the pipe body, obtaining the resonance curves shown in
Figure 5, with
Figure 5b providing a magnified view of
Figure 5a. The resonance curve of the thermal fusion weld differs from that of the pipe body, with the S
21 magnitude at the resonance peak of the weld being lower, exhibiting a difference of 1.04 dB. This result indicates that the impact of fusion on the structural integrity of HDPE material can be detected by our microwave testing system, further confirming the feasibility of using a microwave resonant probe to assess the thermal fusion welds of HDPE pipes.
3.2. Detection of Cold Welding Defects
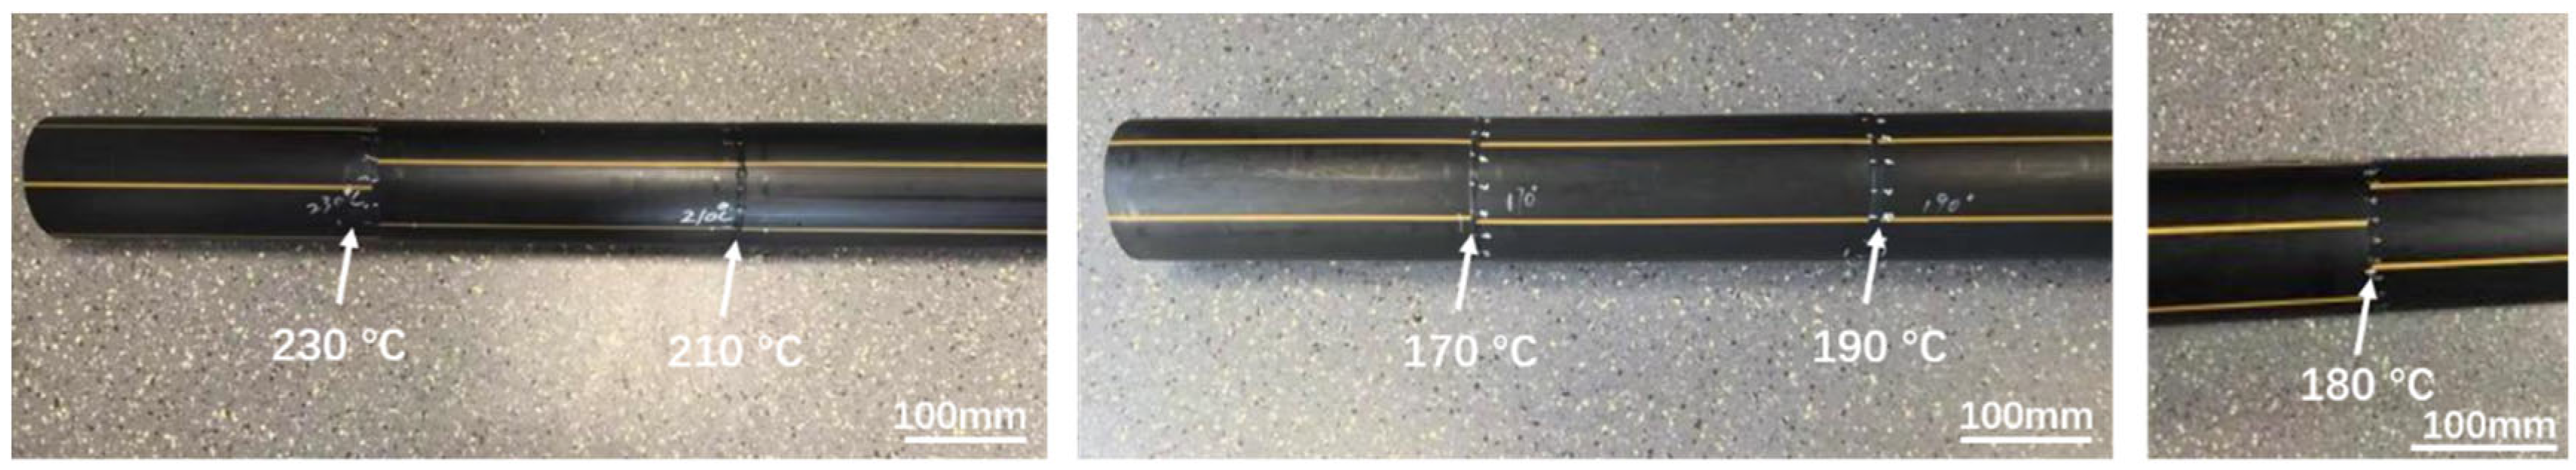
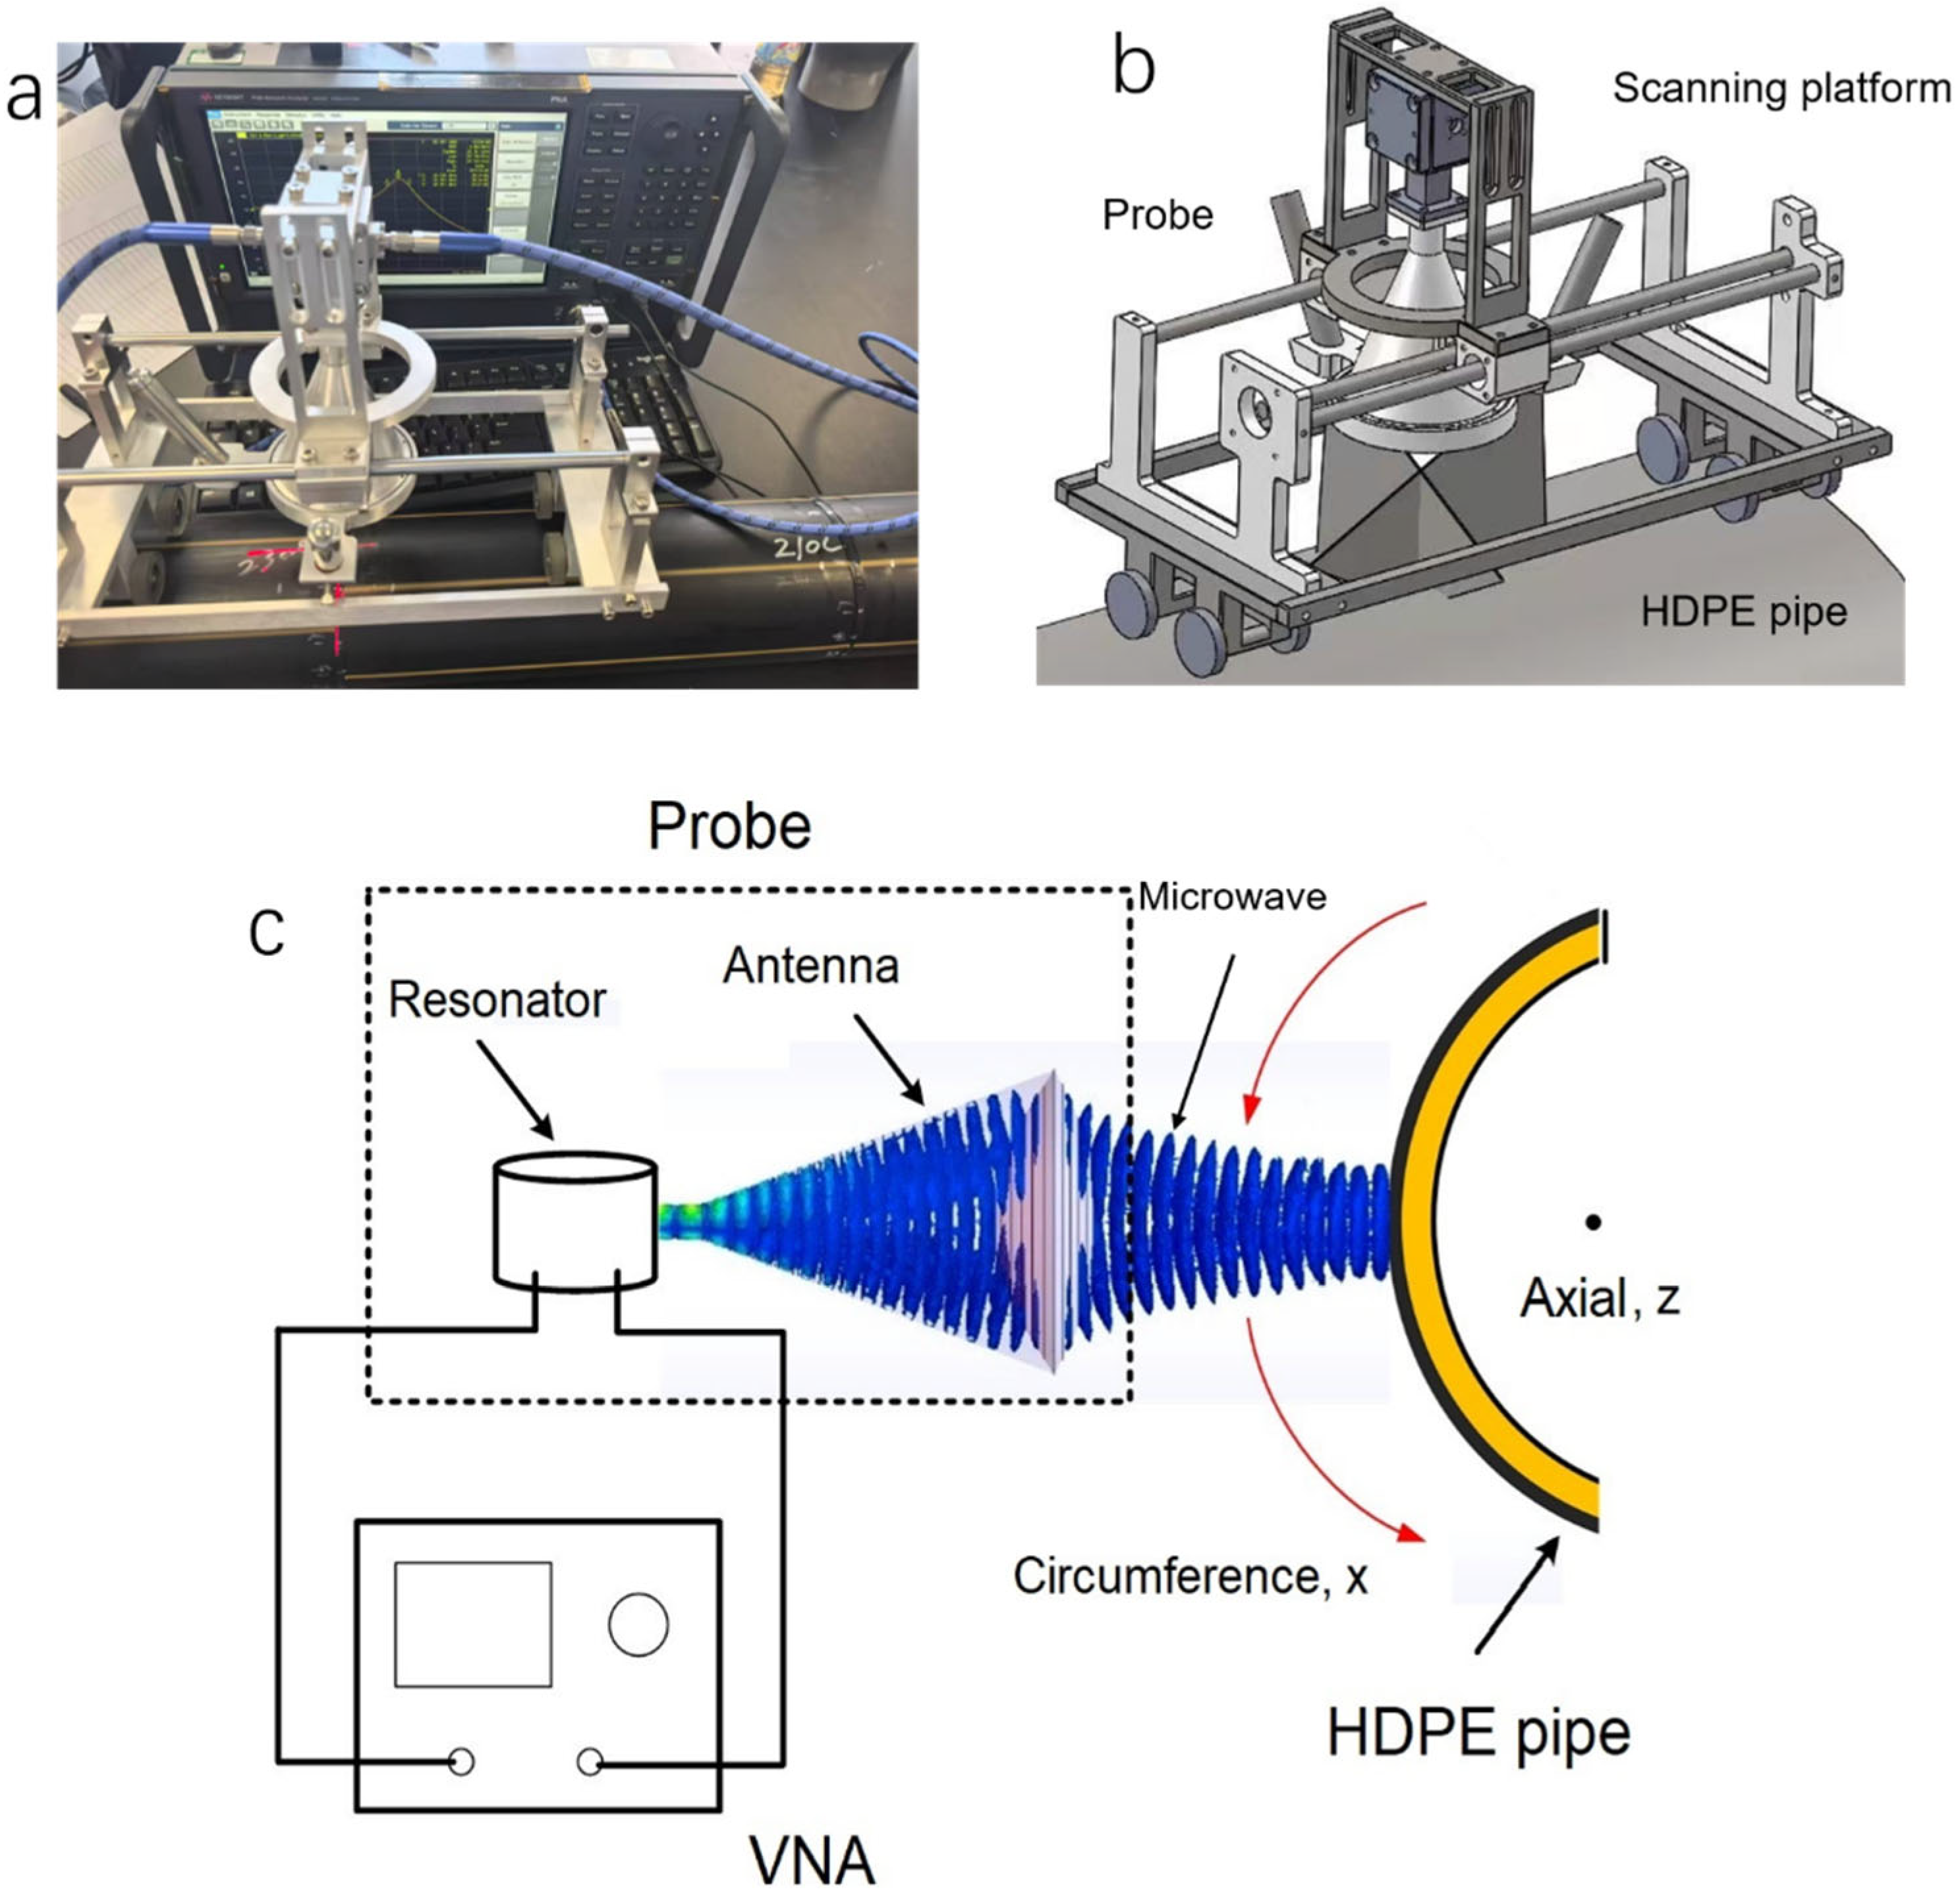
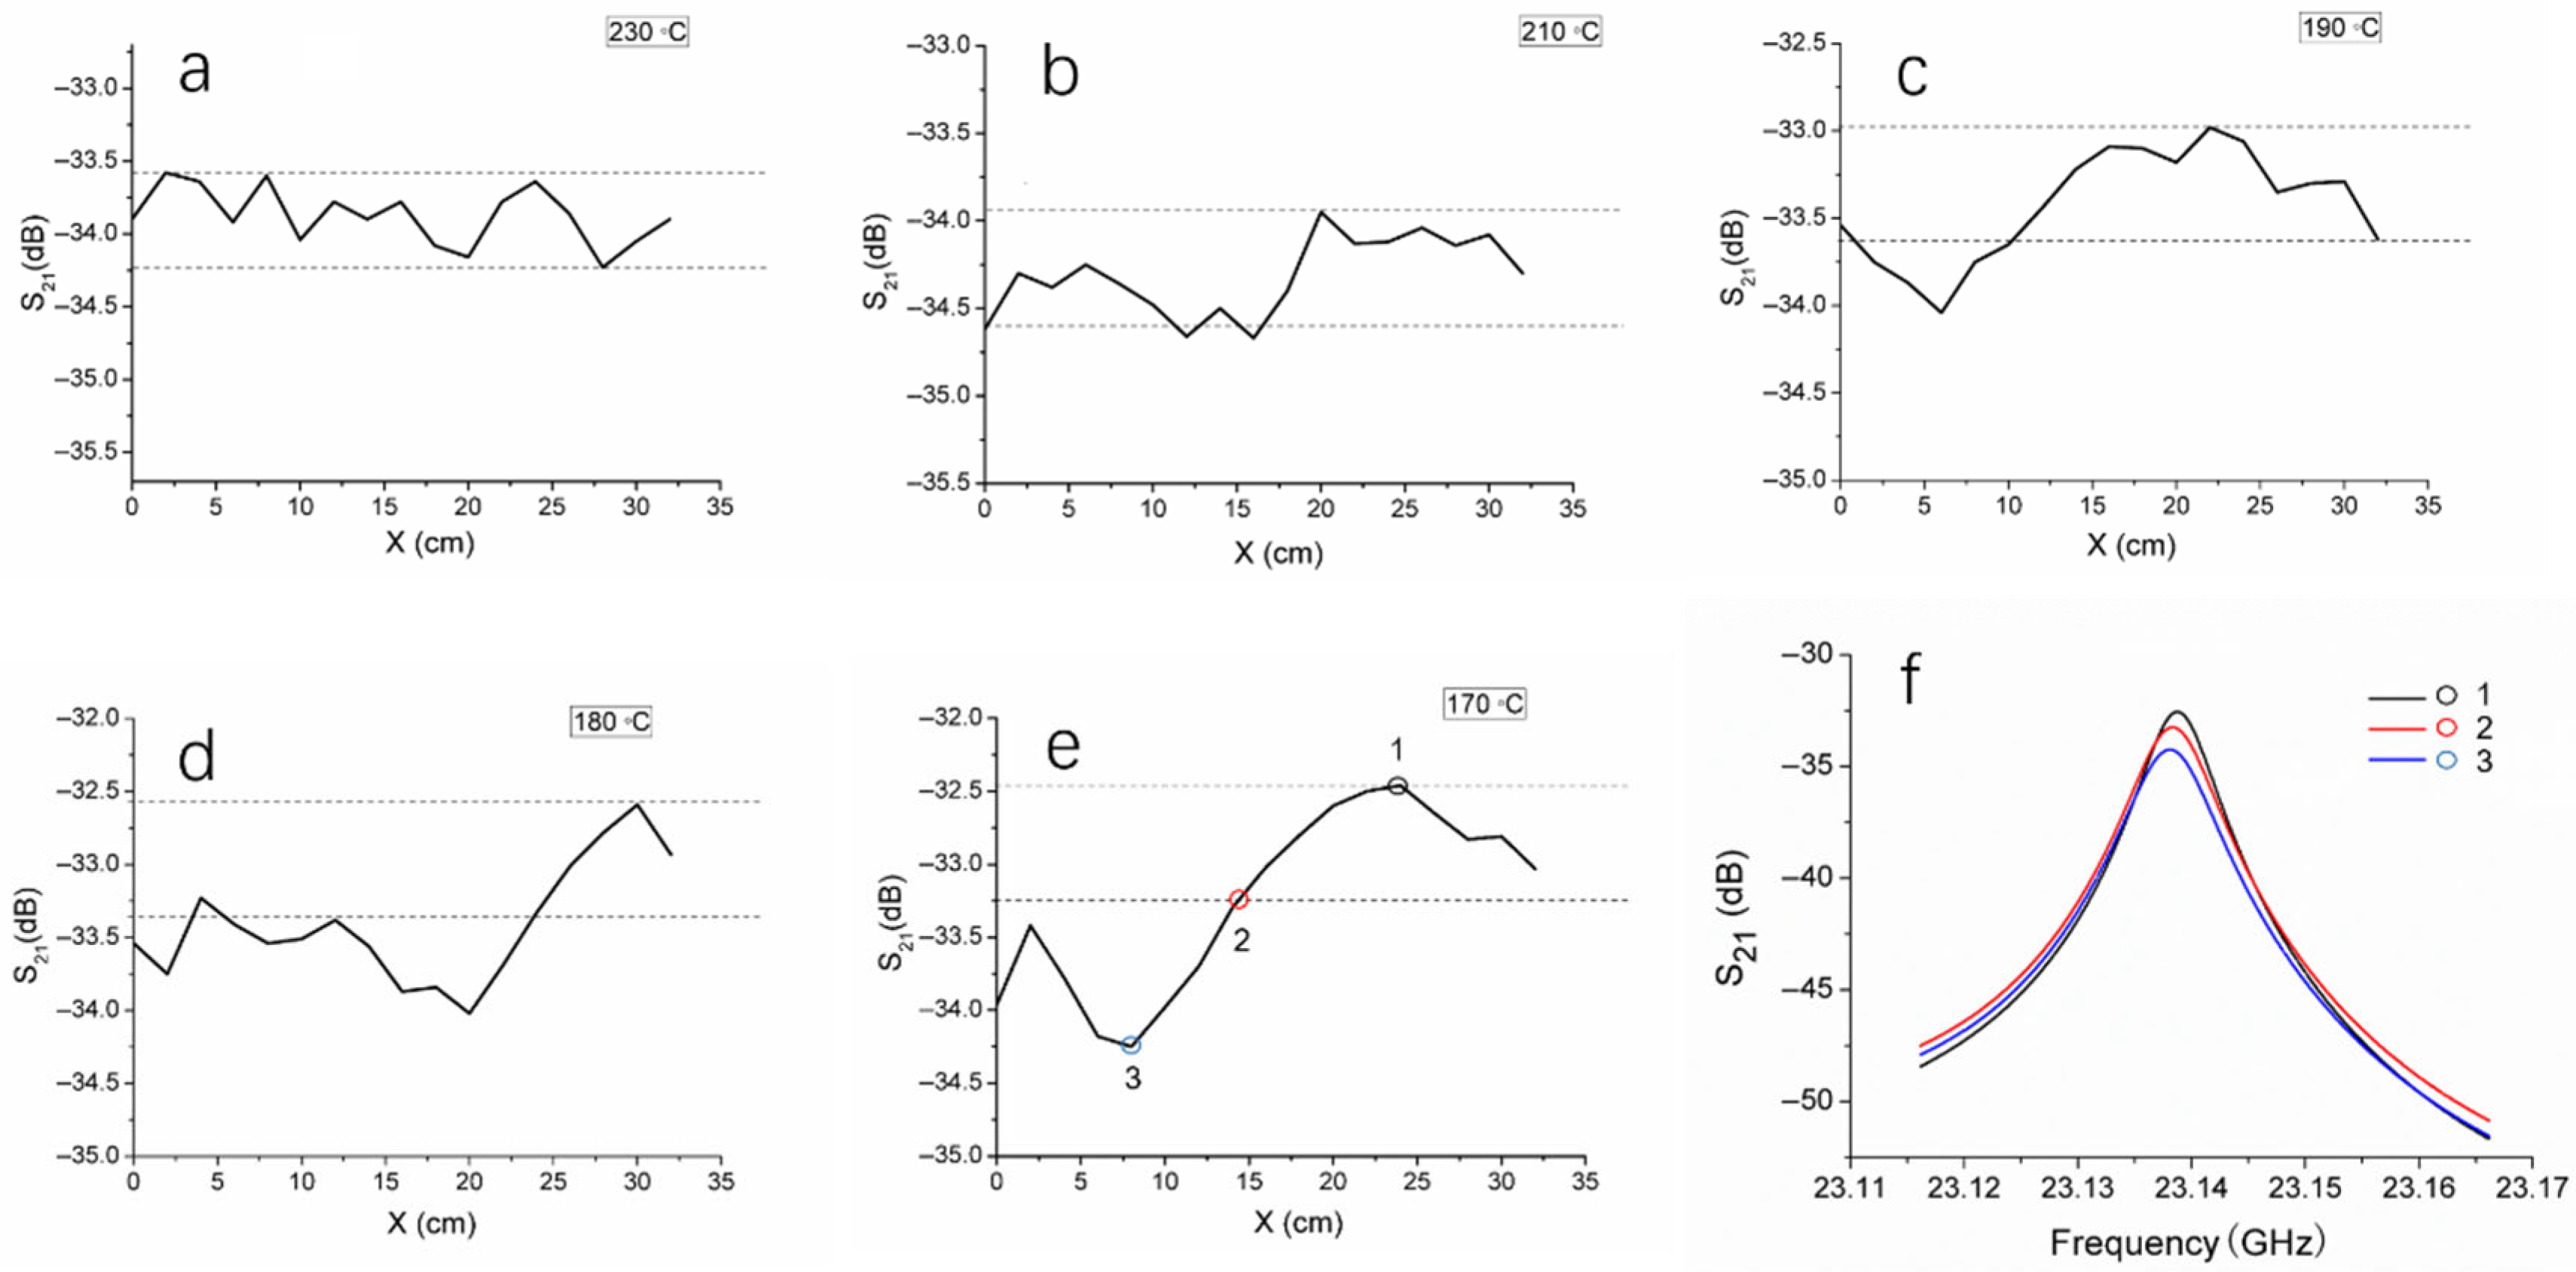
To investigate the ability of the microwave system in identifying cold welding defects in thermal fusion welds of HDPE pipes, HDPE pipes were fused at five different temperatures, namely 170 °C, 180 °C, 190 °C, 210 °C, and 230 °C, producing five thermal fusion welds. The standard temperature range for thermal fusion of HDPE pipe is 210 °C to 230 °C, and temperatures below 210 °C may result in cold welding defects. The microwave resonant probe was positioned at the center of the weld and a 360° circumferential scan was conducted around the pipe, recording the S
21 magnitude corresponding to the resonant peak at each position. The circumferential scanning distance was plotted on the x-axis, and the S
21 magnitude on the y-axis, resulting in the scanning results of the five welds as shown in
Figure 6.
At various positions along the circumference, the S
21 magnitude fluctuations of the 230 °C weld were relatively small, with a difference of 0.66 dB between the maximum and minimum values, represented by the distance between the two dashed lines in
Figure 6a. The temperature of 230 °C is the standard thermal fusion temperature, producing a densely structured fusion joint with a relatively uniform fusion surface. The S
21 magnitude fluctuations for the 210 °C weld were similar to those of the 230 °C joint (
Figure 6b), with a difference of 0.69 dB between the maximum and minimum values, which is very close to the 0.66 dB. When the fusion temperature is below 210 °C, cold welding is highly likely to occur. As shown in
Figure 6c–e, the S
21 magnitude fluctuations of the welds formed at 190 °C, 180 °C, and 170 °C are larger than those at 230 °C and 210 °C, and the fluctuation amplitude increases as the temperature decreases. In each plot, two dashed lines spaced 0.66 dB apart were added, with the upper dashed line positioned at the maximum S
21 magnitude. It is reasonable to infer that when the S
21 magnitude curve is between the two dashed lines, the fluctuations are acceptable, and the corresponding fusion area of the weld is defect-free; when the S
21 magnitude curve falls outside the two dashed lines, a cold welding defect is present in the corresponding area. For the weld fused at 190 °C, the S
21 magnitude falls outside the two dashed lines in the 0–10 cm region, indicating a lack of fusion in this region (
Figure 6c). For the 180 °C weld, most of the 0–22 cm region shows the S
21 magnitude outside the dashed lines, indicating a lack of fusion in this area (
Figure 6d). The lack of fusion area in this weld is larger than that of the 190 °C weld. Additionally, the difference between the maximum and minimum S
21 magnitudes for the 180 °C weld is 1.45 dB, while for the 190 °C weld, the difference is 1.07 dB, indicating that the degree of lack of fusion in the 180 °C weld is greater than that in the 190 °C weld. For the 170 °C weld, though the lack of fusion area (0–15 cm) is smaller than that of the 180 °C weld, the difference between the maximum and minimum S
21 magnitudes is 1.79 dB (
Figure 6e), demonstrating a more severe lack of fusion compared to the 180 °C weld.
Figure 6f shows the corresponding resonance curves at three points on the S
21 magnitude curve in
Figure 6e. Compared with the points located between the two dashed lines, which represent defect-free areas, the resonance curve peaks at points within the lack of fusion area are significantly lower. From the above results, it is evident that the S
21 magnitude at defect locations is lower than at defect-free locations. The material structure at the lack of fusion areas is less compact, which may lead to a decrease in the permittivity. According to Equation (1), when microwaves pass through these areas, their reflection changes, and the resonant state within the cavity is disturbed, causing a change in the S
21 magnitude. However, the resonance frequency seems unaffected by the lack of fusion. All these factors suggest that using a resonant probe to perform circumferential scanning along the center of weld can detect the presence and location of lack of fusion, thereby identifying cold weld and assessing their severity. Thermal fusion welds formed at temperatures below the standard fusion temperature will give rise to cold welding defects. As the fusion temperature decreases, the incidence and severity of defects increase.
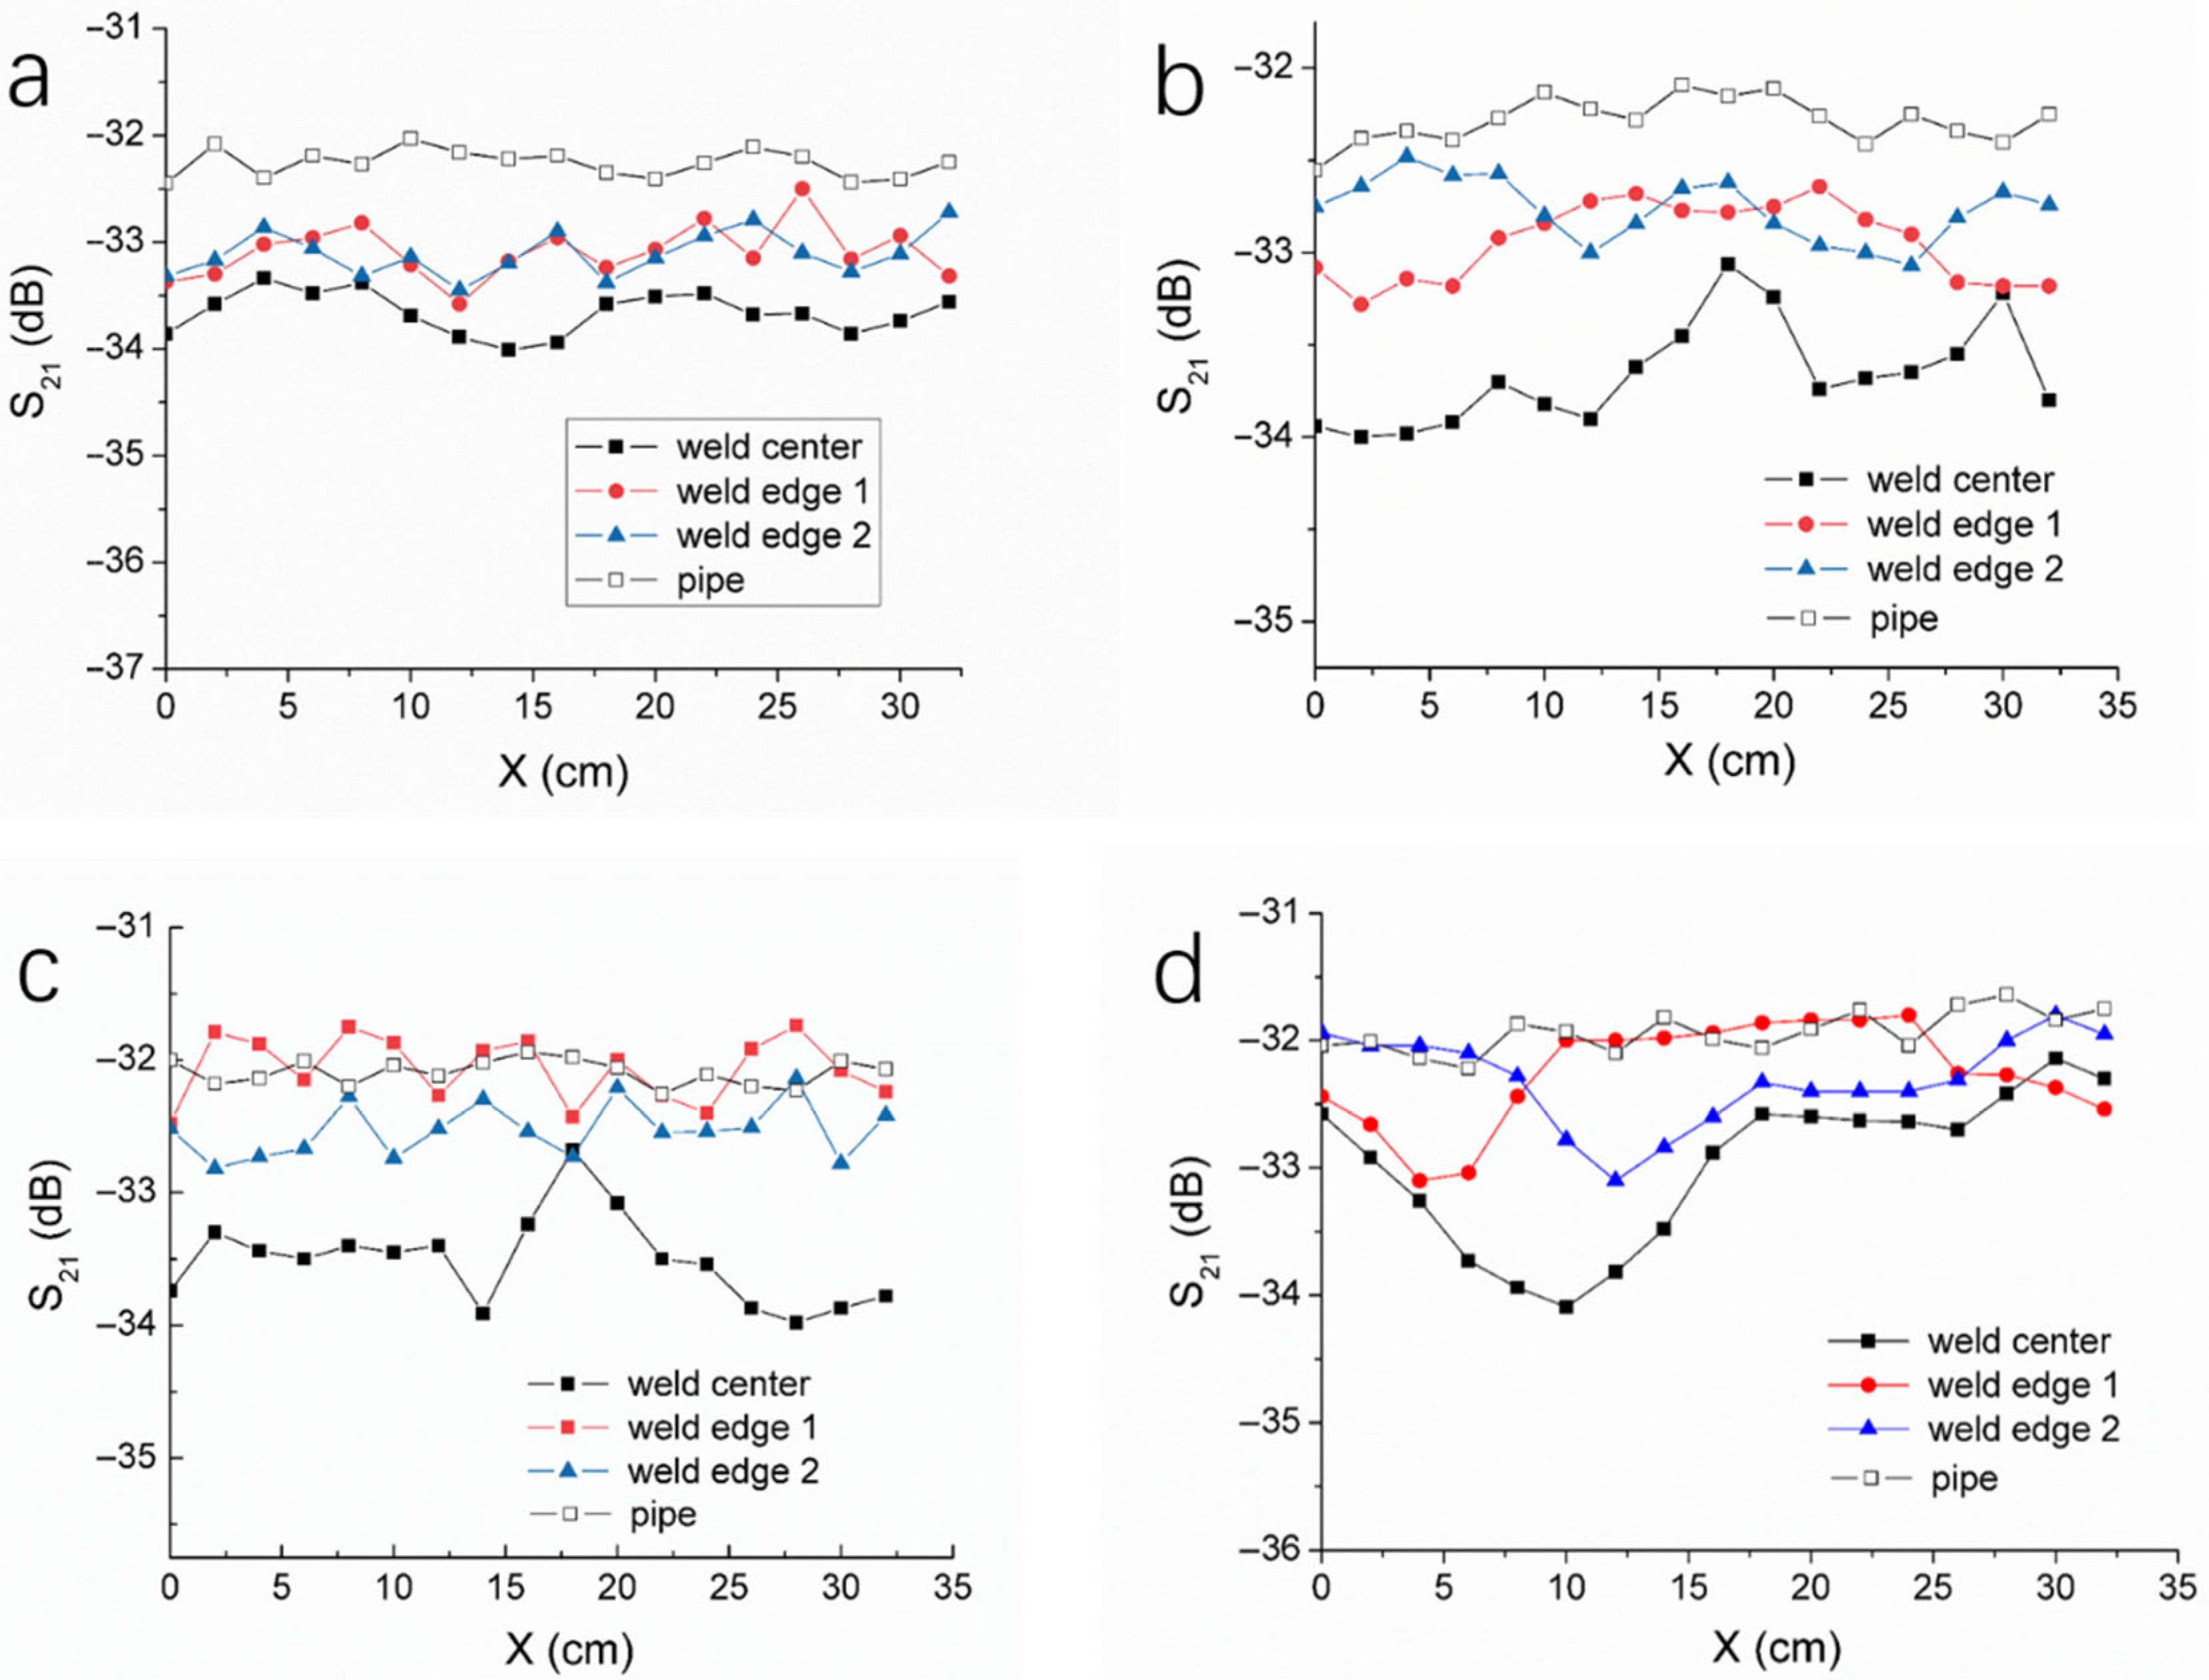
The thermal fusion weld of HDPE pipes has a width, and the heating and pressure conditions during welding differ between the center and the edges of the weld, leading to structural variations in the material. Microwave tests were conducted for the weld samples formed at 230 °C, 190 °C, 180 °C, and 170 °C, respectively. The microwave resonant probe was positioned at the center and the edges of each weld, performing a 360° circumferential scan. The results are shown in
Figure 7, where the S
21 curves obtained from the 360° circumferential scan of the pipe body are also shown. For the 230 °C weld, the S
21 curve of the weld center and the two S
21 curves of the weld edges exhibit relatively small fluctuations around the circumference, with the S
21 magnitude at the weld center being smaller than those at the edges. Compared to the weld center and edges, the pipe body’s S
21 magnitude is larger and shows smaller fluctuations. These results clearly demonstrate that significant microstructural differences exist between the weld zone and the base pipe material, and there are also structural differences between the center and the edges of the weld. This is primarily because, during the thermal fusion process, the PE molecular chains undergo thermal motion and entanglement under the influence of both temperature and pressure, followed by recrystallization during the cooling process, leading to changes in the material structure. The temperature and stress at the edges of the weld are different from those at the center, resulting in corresponding structural differences.
For the welds formed at 190 °C, 180 °C, and 170 °C, the magnitude of S21 at the weld center is also smaller than that at the weld edge and that of the pipe body. Additionally, the fluctuation in the S21 curves at the weld center is significantly greater than those at the weld edges, indicating that the edges of the weld are less affected by lack of fusion. This also suggests that, for better detection of cold welding defects, the probe should be positioned at the weld center and that a circumferential scan should be conducted along the weld seam. Compared with the welds formed at 190 °C and 180 °C, the three S21 curves of the weld formed at 170 °C exhibit a larger variation, further validating the capability of our microwave inspection method for detecting cold welds.
3.3. Microstructure and Mechanical Performance of Cold Welds
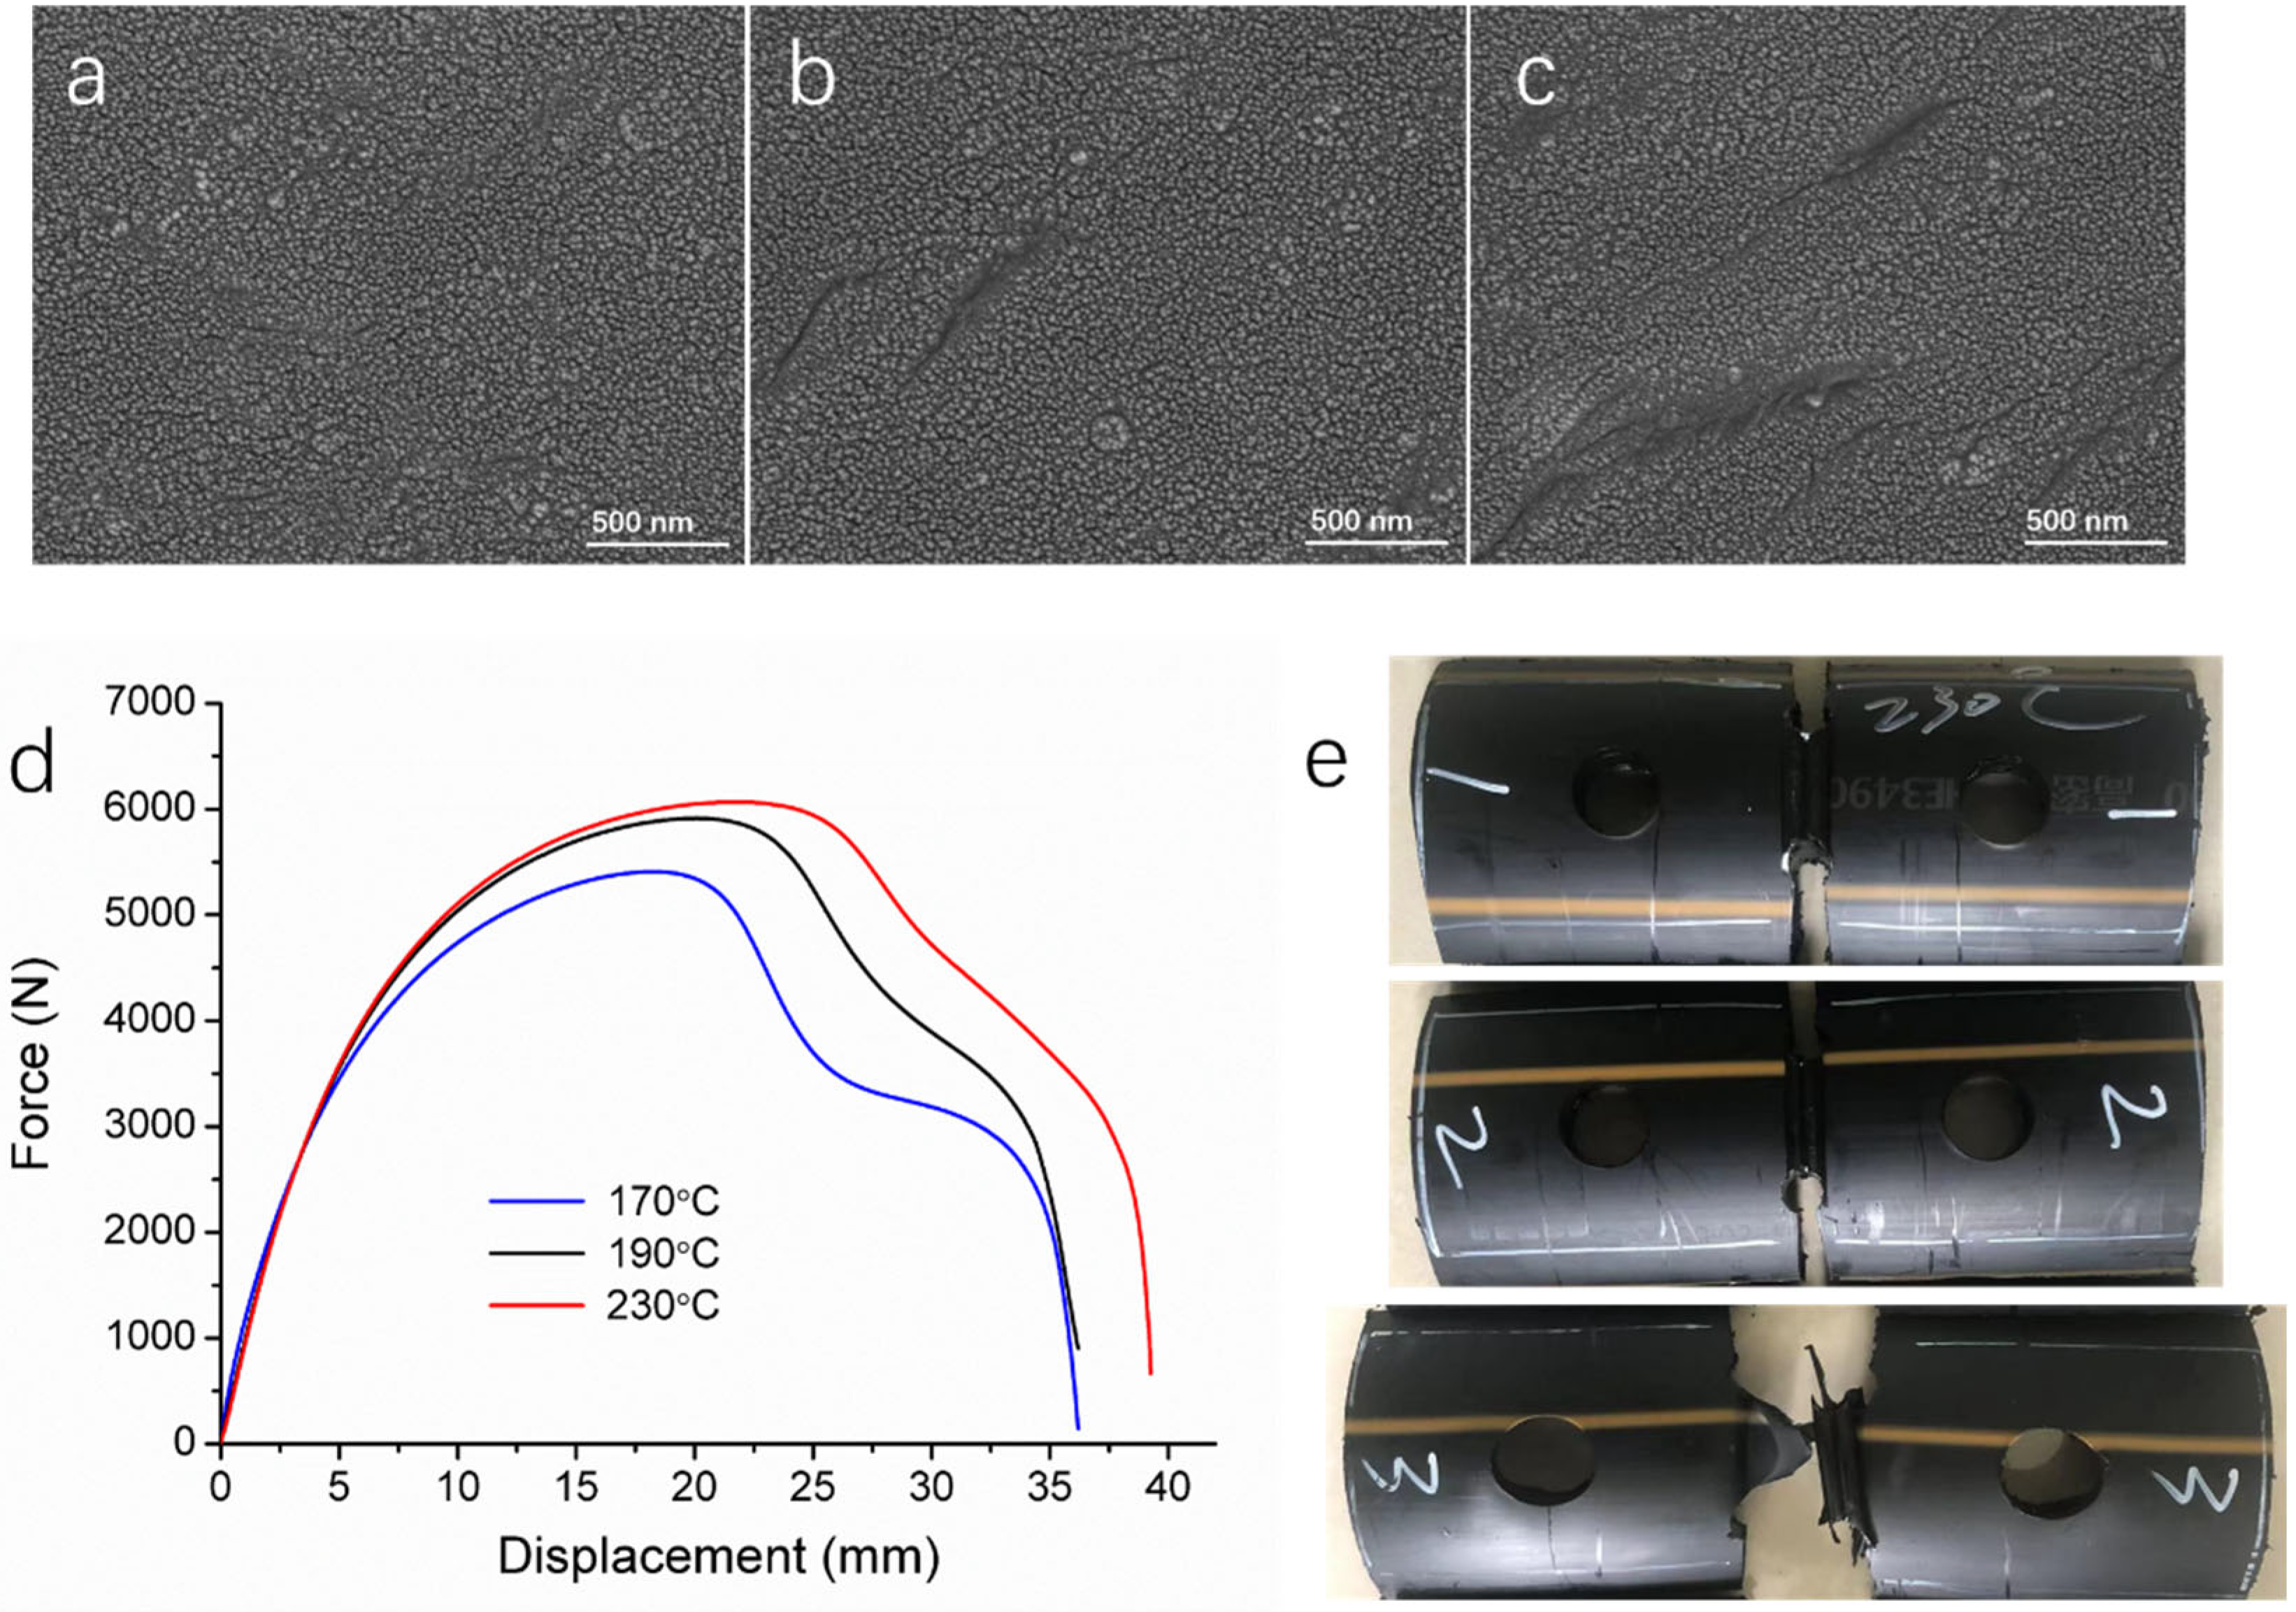
As mentioned above, the lower temperature during thermal fusion hinders the diffusion, aggregation, and entanglement of polyethylene molecular chains, leading to alterations in the material structure and crystallinity of the weld compared to welds formed under normal conditions. This is the underlying cause of cold welding defects. To demonstrate the correlation between the material microstructure and the microwave detection, we conducted sampling analysis for cold welds. The microscopic morphology of welds formed at different temperatures was observed using SEM. As shown in
Figure 8a, the microstructure of welds formed at the normal fusion temperature (230 °C) is uniform and dense, with no apparent defects. In contrast, the microstructures of welds formed at 190 °C and 170 °C exhibit grooves and microcracks, with the latter (170 °C) showing more pronounced defects (
Figure 8b,c).
To further examine the differences in the structural compactness of normal welds and cold welds, true density analysis was adopted for the thermal fusion welds formed at various temperatures. True density refers to the actual mass per unit volume of a material in a fully dense state, excluding internal pores or voids. Cold welds typically result in localized lack of fusion within the weld, leading to less compact material in these areas, which may consequently exhibit lower true density. For true density measurements, small material samples cut from the welds were placed in appropriately sized cells. The results for welds formed at different temperatures, as well as for the pipe body, are presented in
Table 1. The average true density values of welds fused at 230 °C and 210 °C were 0.9404 g/cm
3 and 0.9397 g/cm
3, respectively. These values are lower than the true density of the pipe body, 0.9530 g/cm
3, indicating that thermal fusion welds formed at standard temperatures have a less compact microstructure compared to the pipe body. However, for welds fused at 190 °C, 180 °C, and 170 °C, the true density was even smaller, decreasing progressively with lower temperatures. This trend suggests that welds formed at lower temperatures possess less dense structures with more microvoids, as evidenced by their reduced true density values.
HDPE is a highly crystalline material. When the pipes are connected by thermal fusion, the PE crystals in the heating zone are melted and then recrystallize during the formation of welds. This process affects the crystallinity of the PE in the welds. The materials in the thermal fusion welds were sampled, powdered and characterized by XRD, the results of which are listed in
Table 1. Compared with the pipe body (88.4%), the crystallinity of the welds formed at 230 °C and 210 °C is lower (84.2%), which is ascribed to the thermal fusion processing. As the welding temperature decreases, the crystallinity decreases. The crystallinity of the weld formed at 170 °C is 78.7%, 9.7% lower than that of the normal welds. The crystallinity and true density of thermal fusion welds demonstrate the structural differences between normal welds and cold welds, based on which, microwave non-destructive testing is able to identify the cold welding defects.
Since the presence of cold welding defects compromises the mechanical performance of thermal fusion welds, tensile tests were conducted on three weld samples, with the results shown in
Figure 8d,e and
Table 2. The weld formed at 230 °C exhibits the highest tensile strength, yield strength, and elongation at break. However, as the welding temperature decreases, the tensile mechanical properties deteriorate. The weld formed at 190 °C has a yield strength comparable to that of the weld formed at 230 °C but exhibits lower tensile strength and significantly reduced elongation at break. Meanwhile, the weld formed at 170 °C demonstrates even lower tensile strength and yield strength than the 190 °C weld, though it shows a similar elongation at break. The area under the tensile curve, which represents tensile work and reflects material toughness, is smaller for the two cold welds compared to the normal weld. This indicates that cold welds are likely more brittle and exhibit reduced toughness. The tensile curves and the post-fracture images of the welds (
Figure 8e) reveal that all three welds undergo ductile fracture; however, the weld formed at 170 °C appears more brittle.
These findings underscore the adverse impact of cold welding defects on the mechanical performance of thermal fusion welds. Lower crystallinity decreases tensile strength in most cases. Lower density typically correlates with fewer voids and less porosity, which directly contributes to reduced mechanical properties. Therefore, accurate and efficient identification of cold welding defects using our microwave testing method is critical for ensuring the structural integrity and operational safety of HDPE pipelines.


