
The Effect of the Fiber Diameter, Epoxy-to-Amine Ratio, and Degree of PVA Saponification on CO2 Adsorption Properties of Amine-Epoxy/PVA Nanofibers

 and
and
Abstract
1. Introduction
2. Materials and Methods
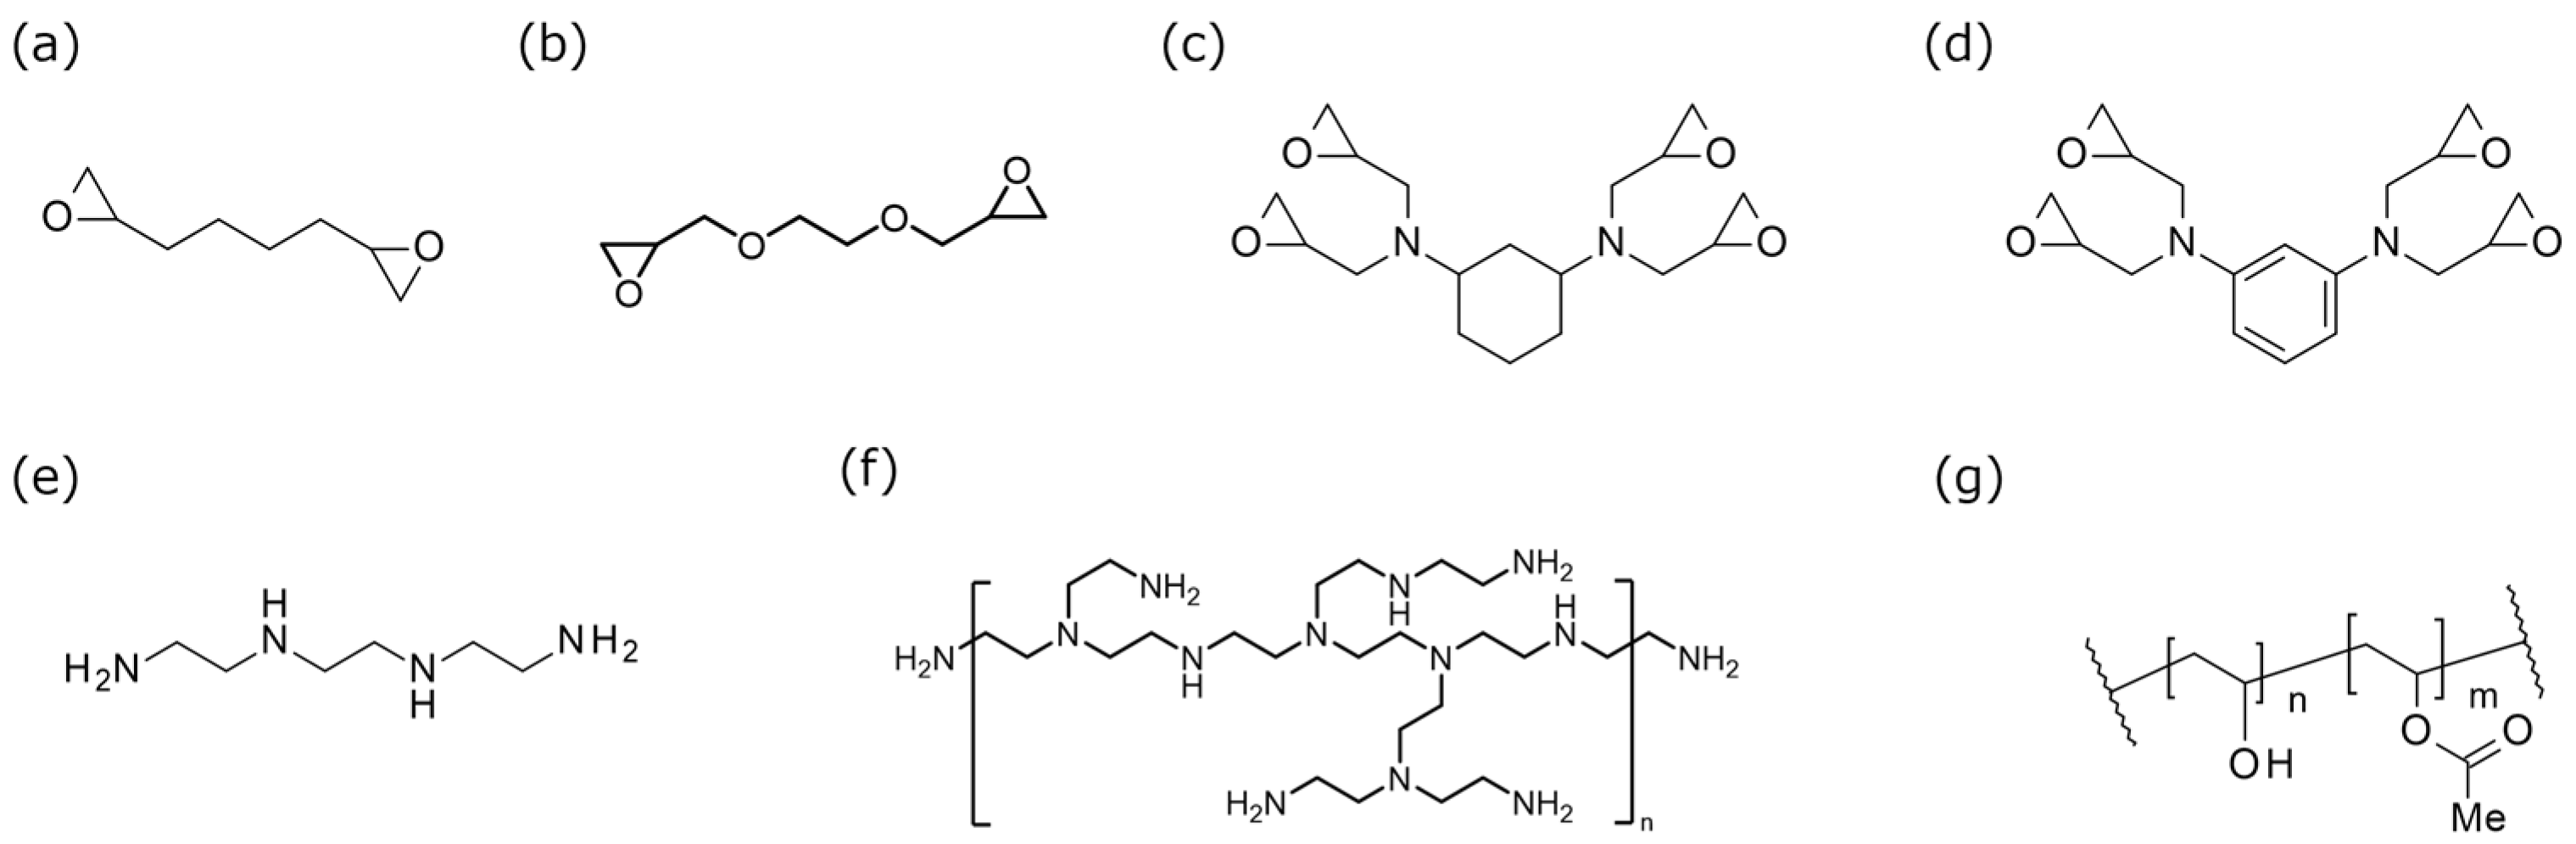
2.1. Materials
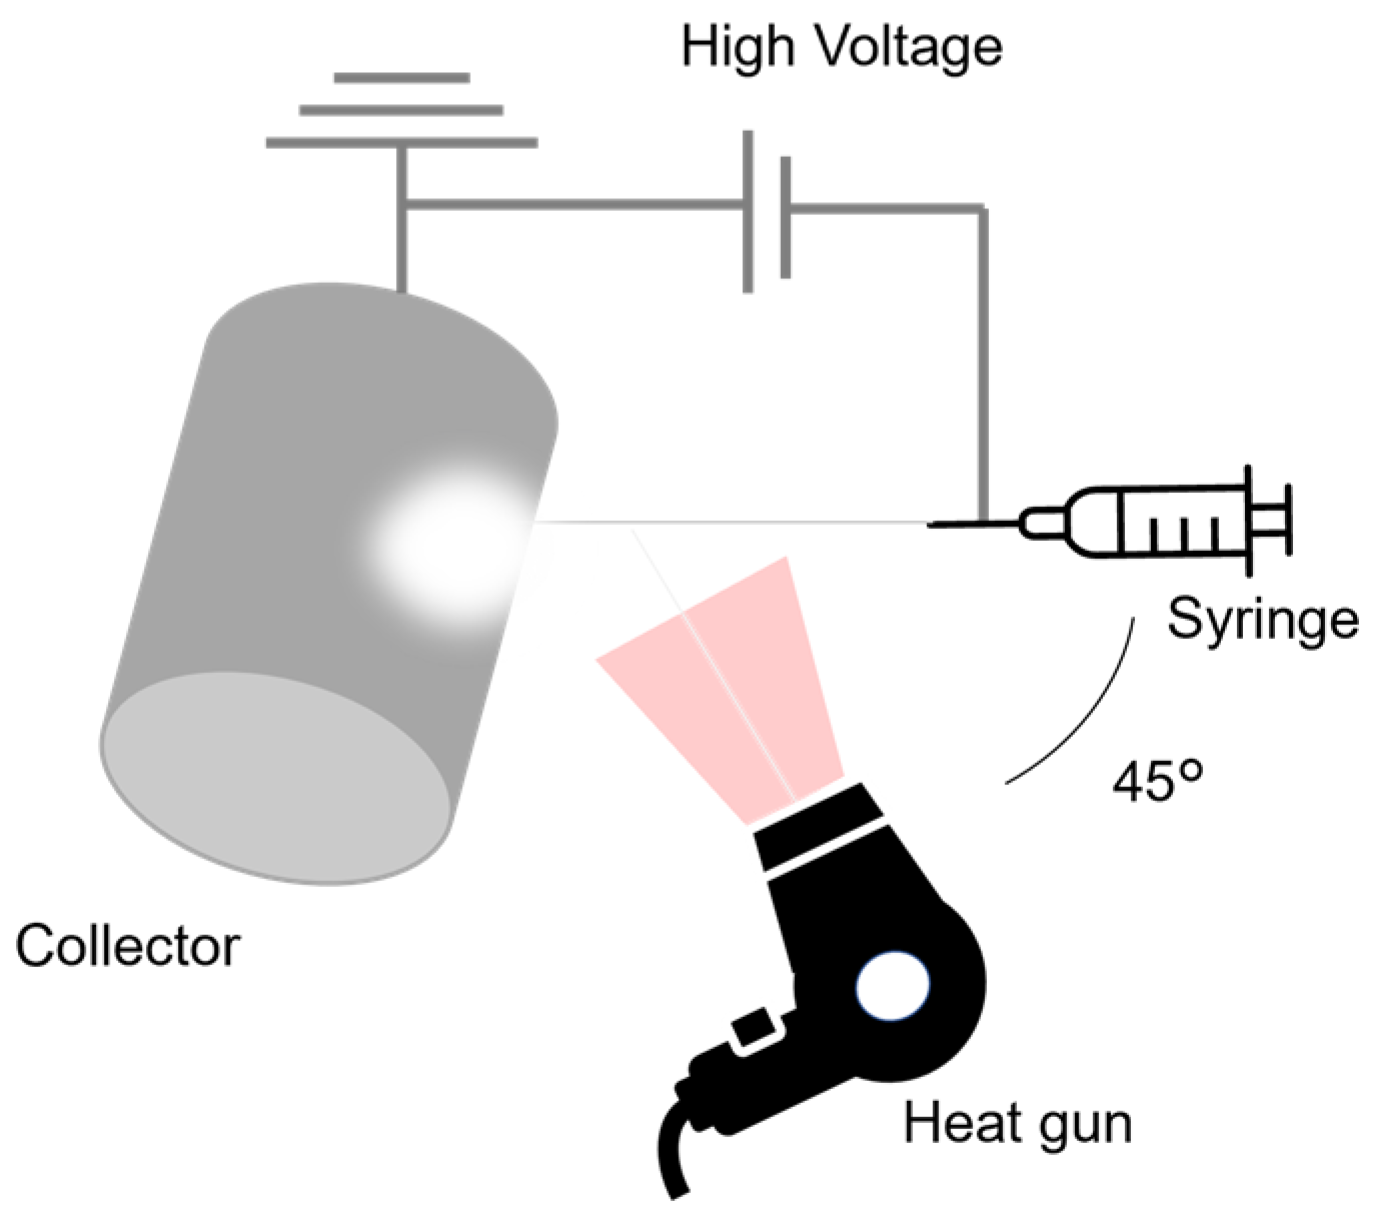
2.2. Electrospinning Equipment and Conditions
2.3. Analysis of the Prepared Web
2.3.1. Scanning Electron Microscopy (SEM)
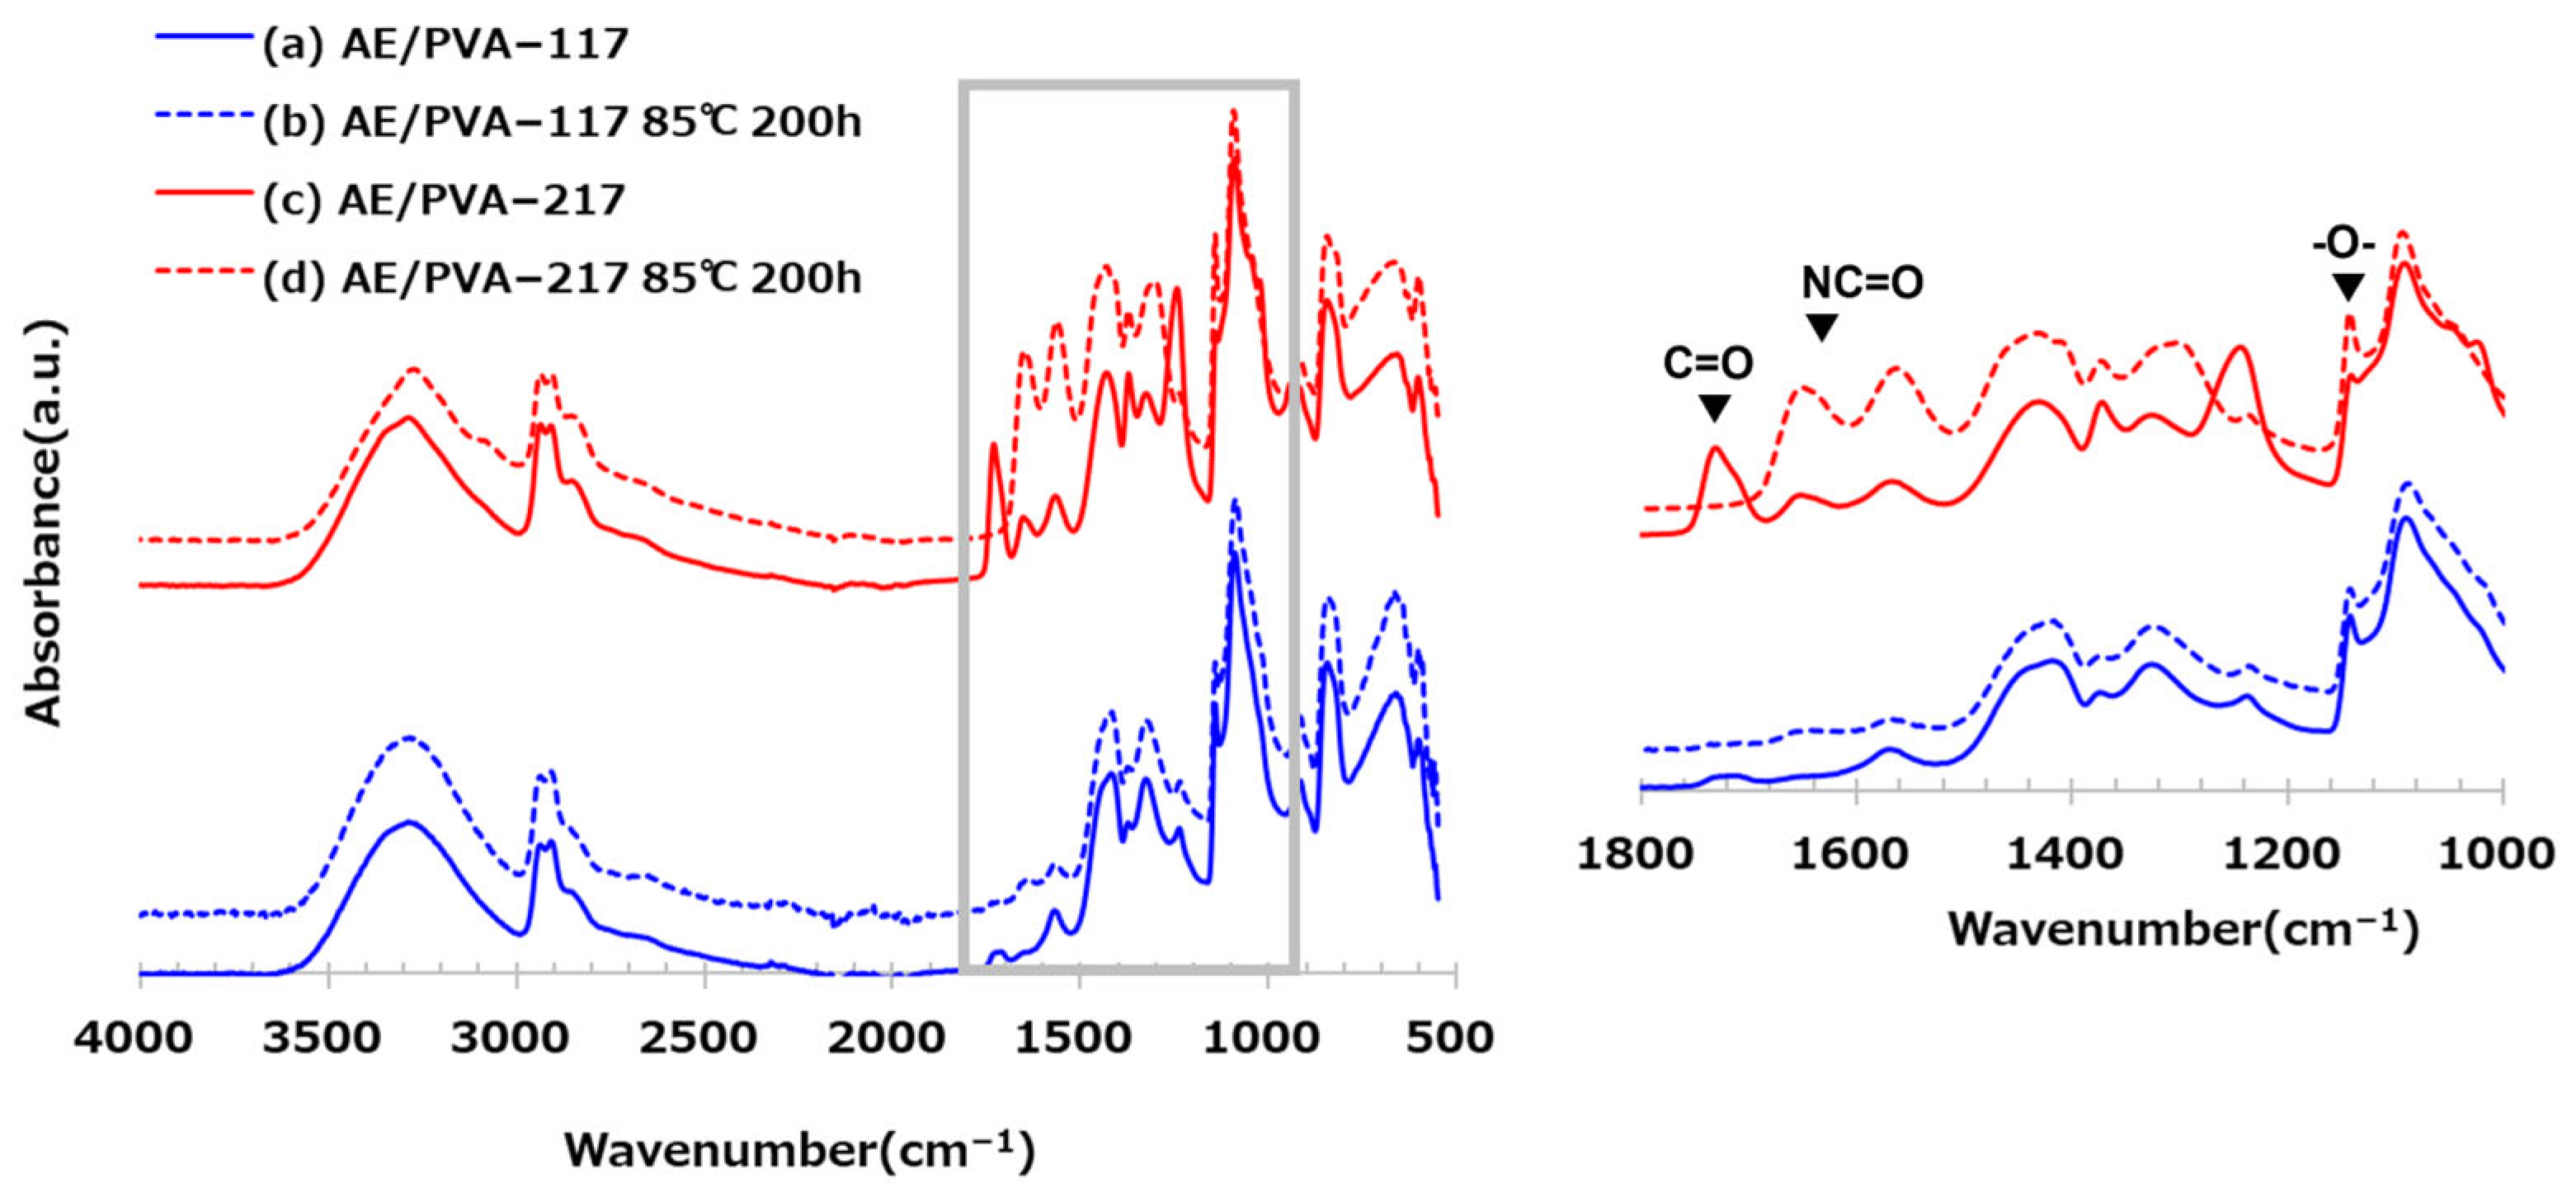
2.3.2. Infrared Absorption Analysis
2.3.3. BET Specific Surface Area
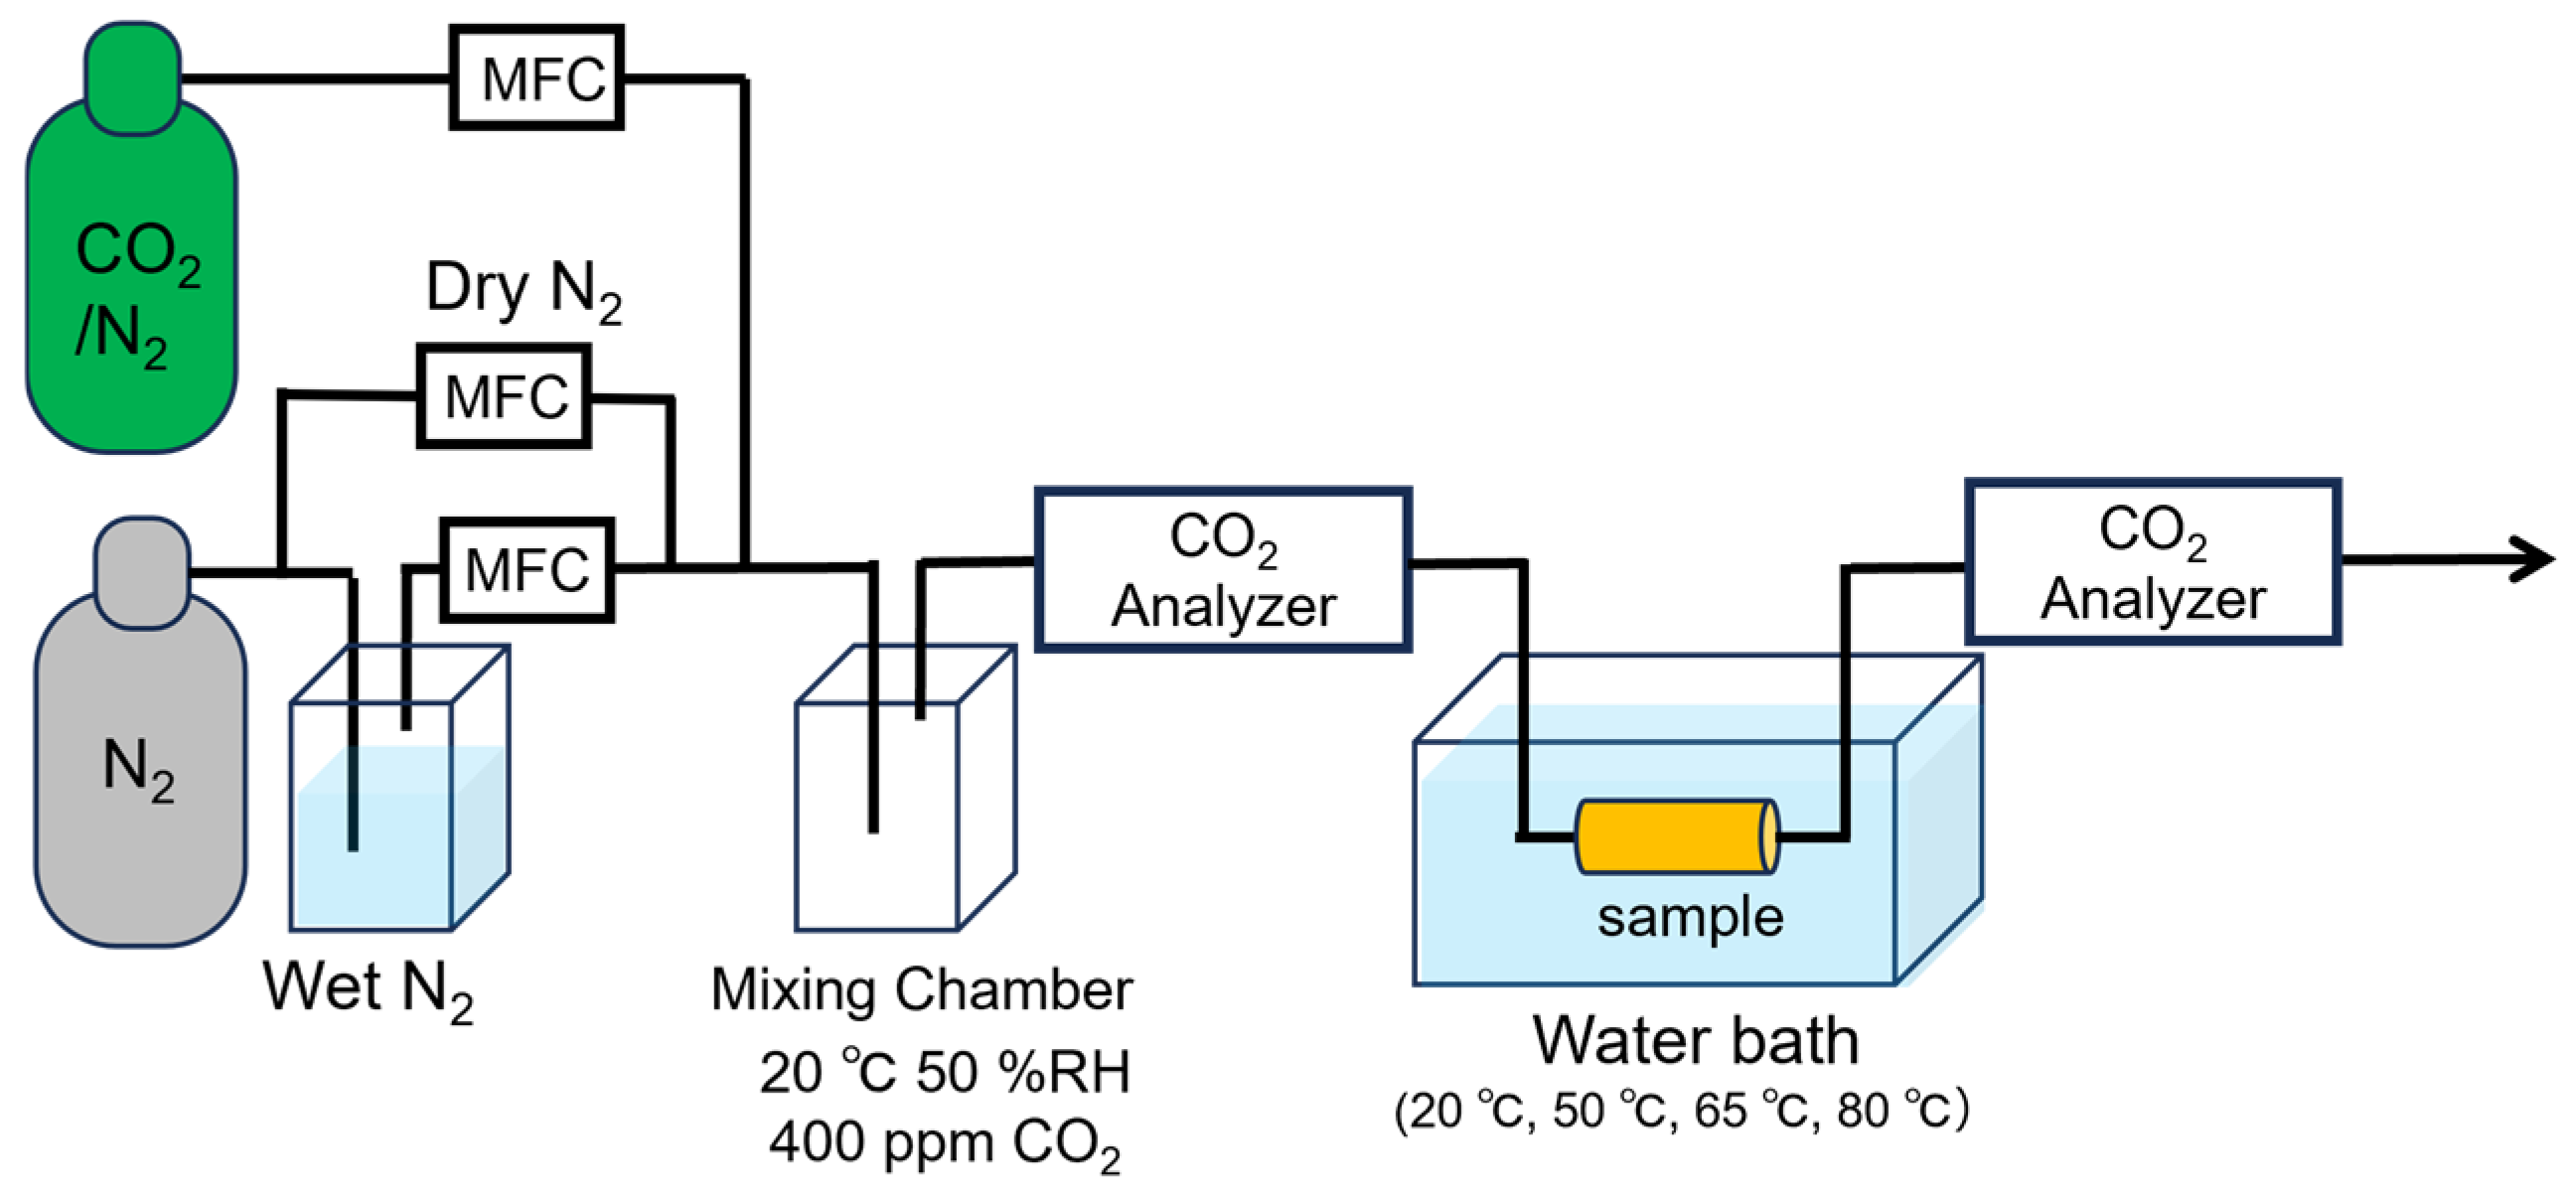
2.3.4. Adsorption/Desorption Test
3. Results
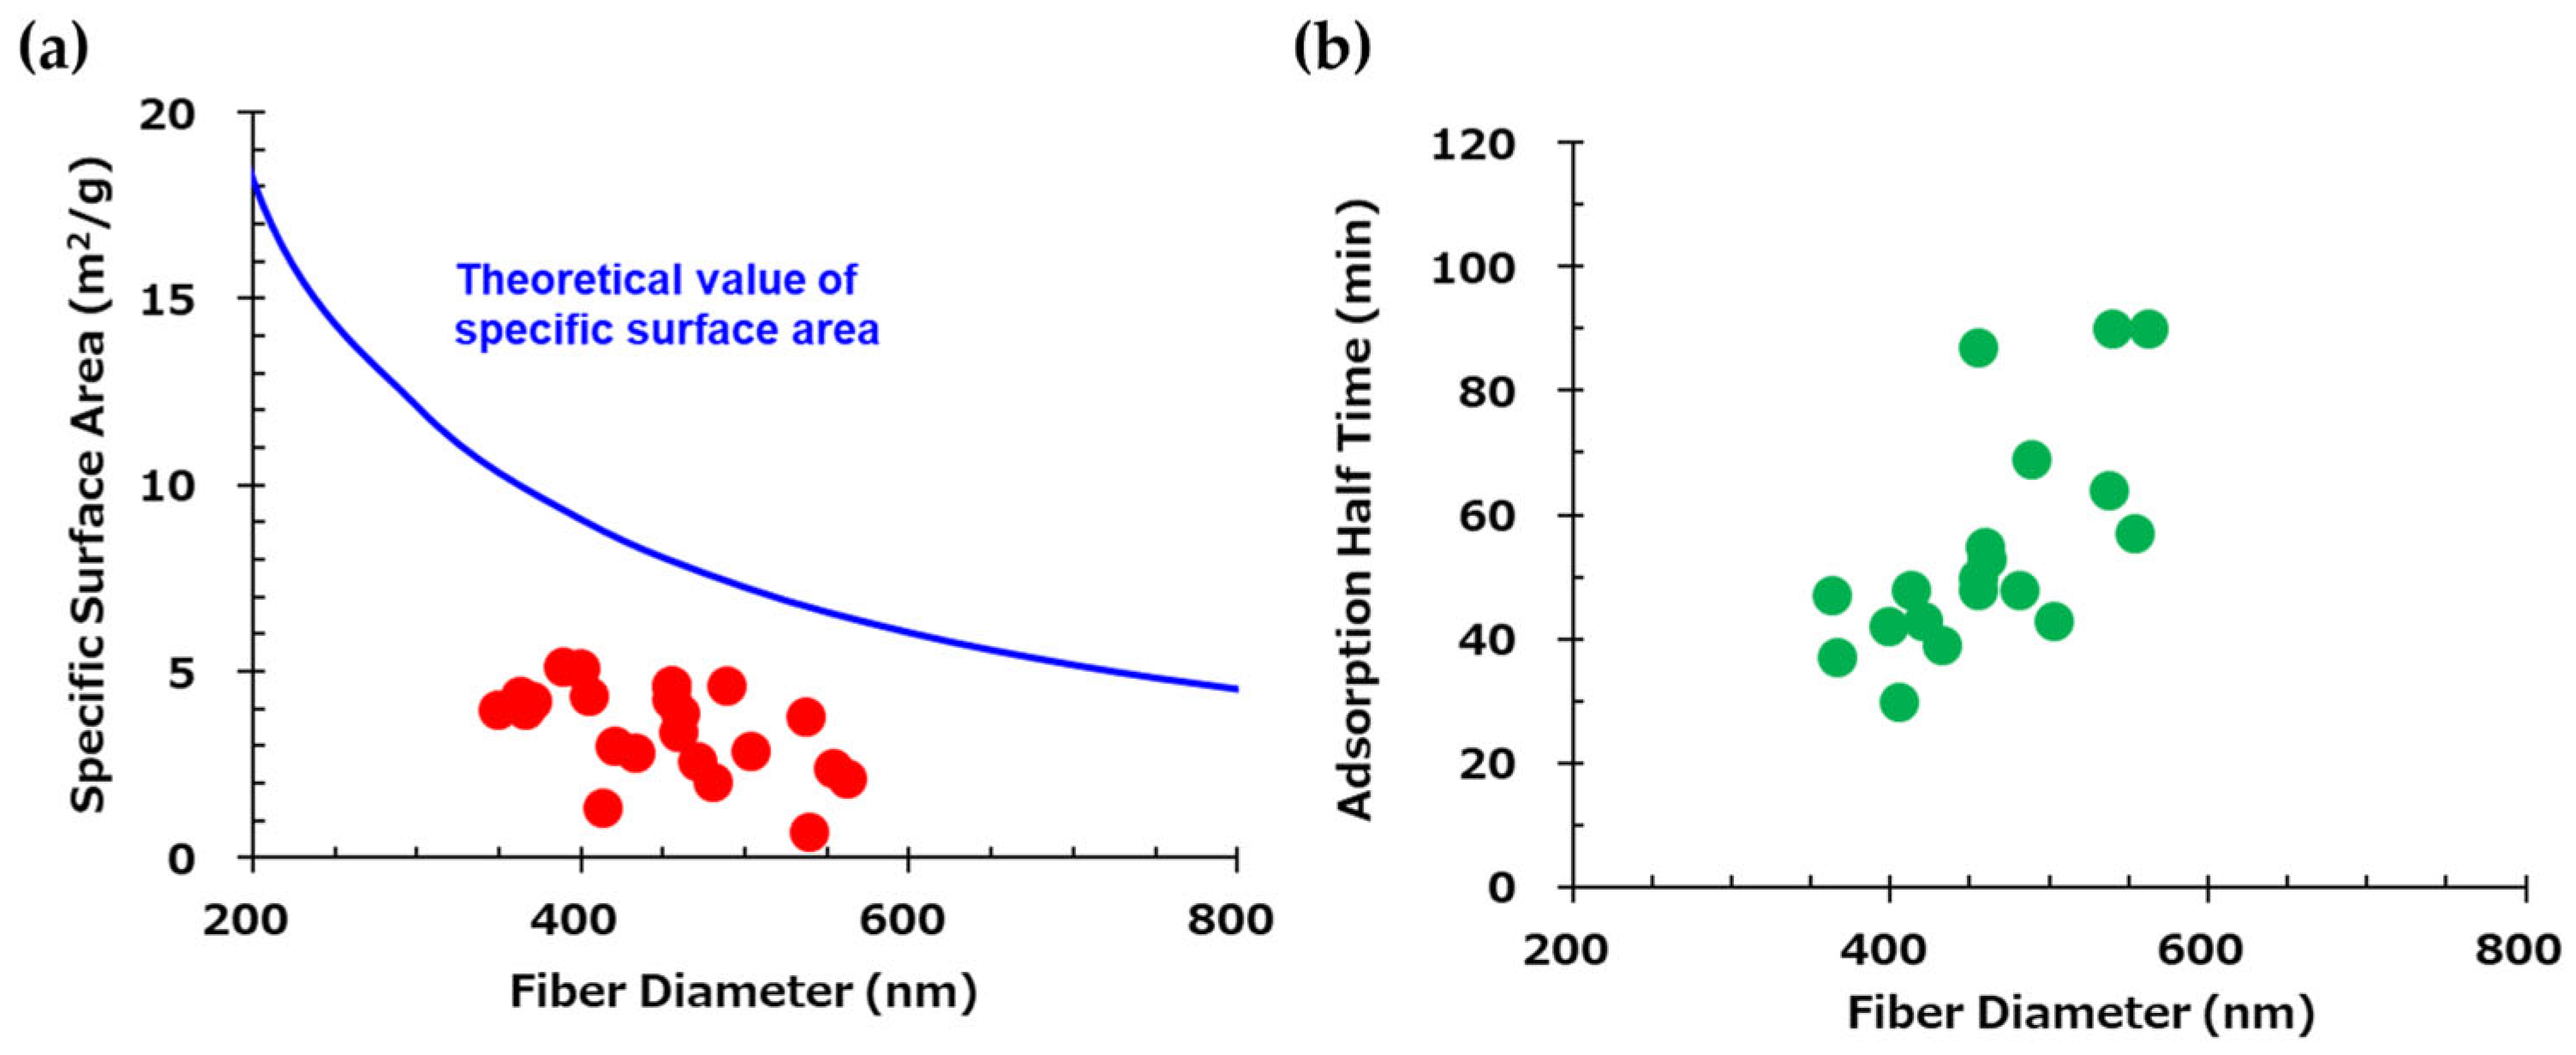
3.1. The Effect of the Fiber Diameter in the CO2 Adsorption Test
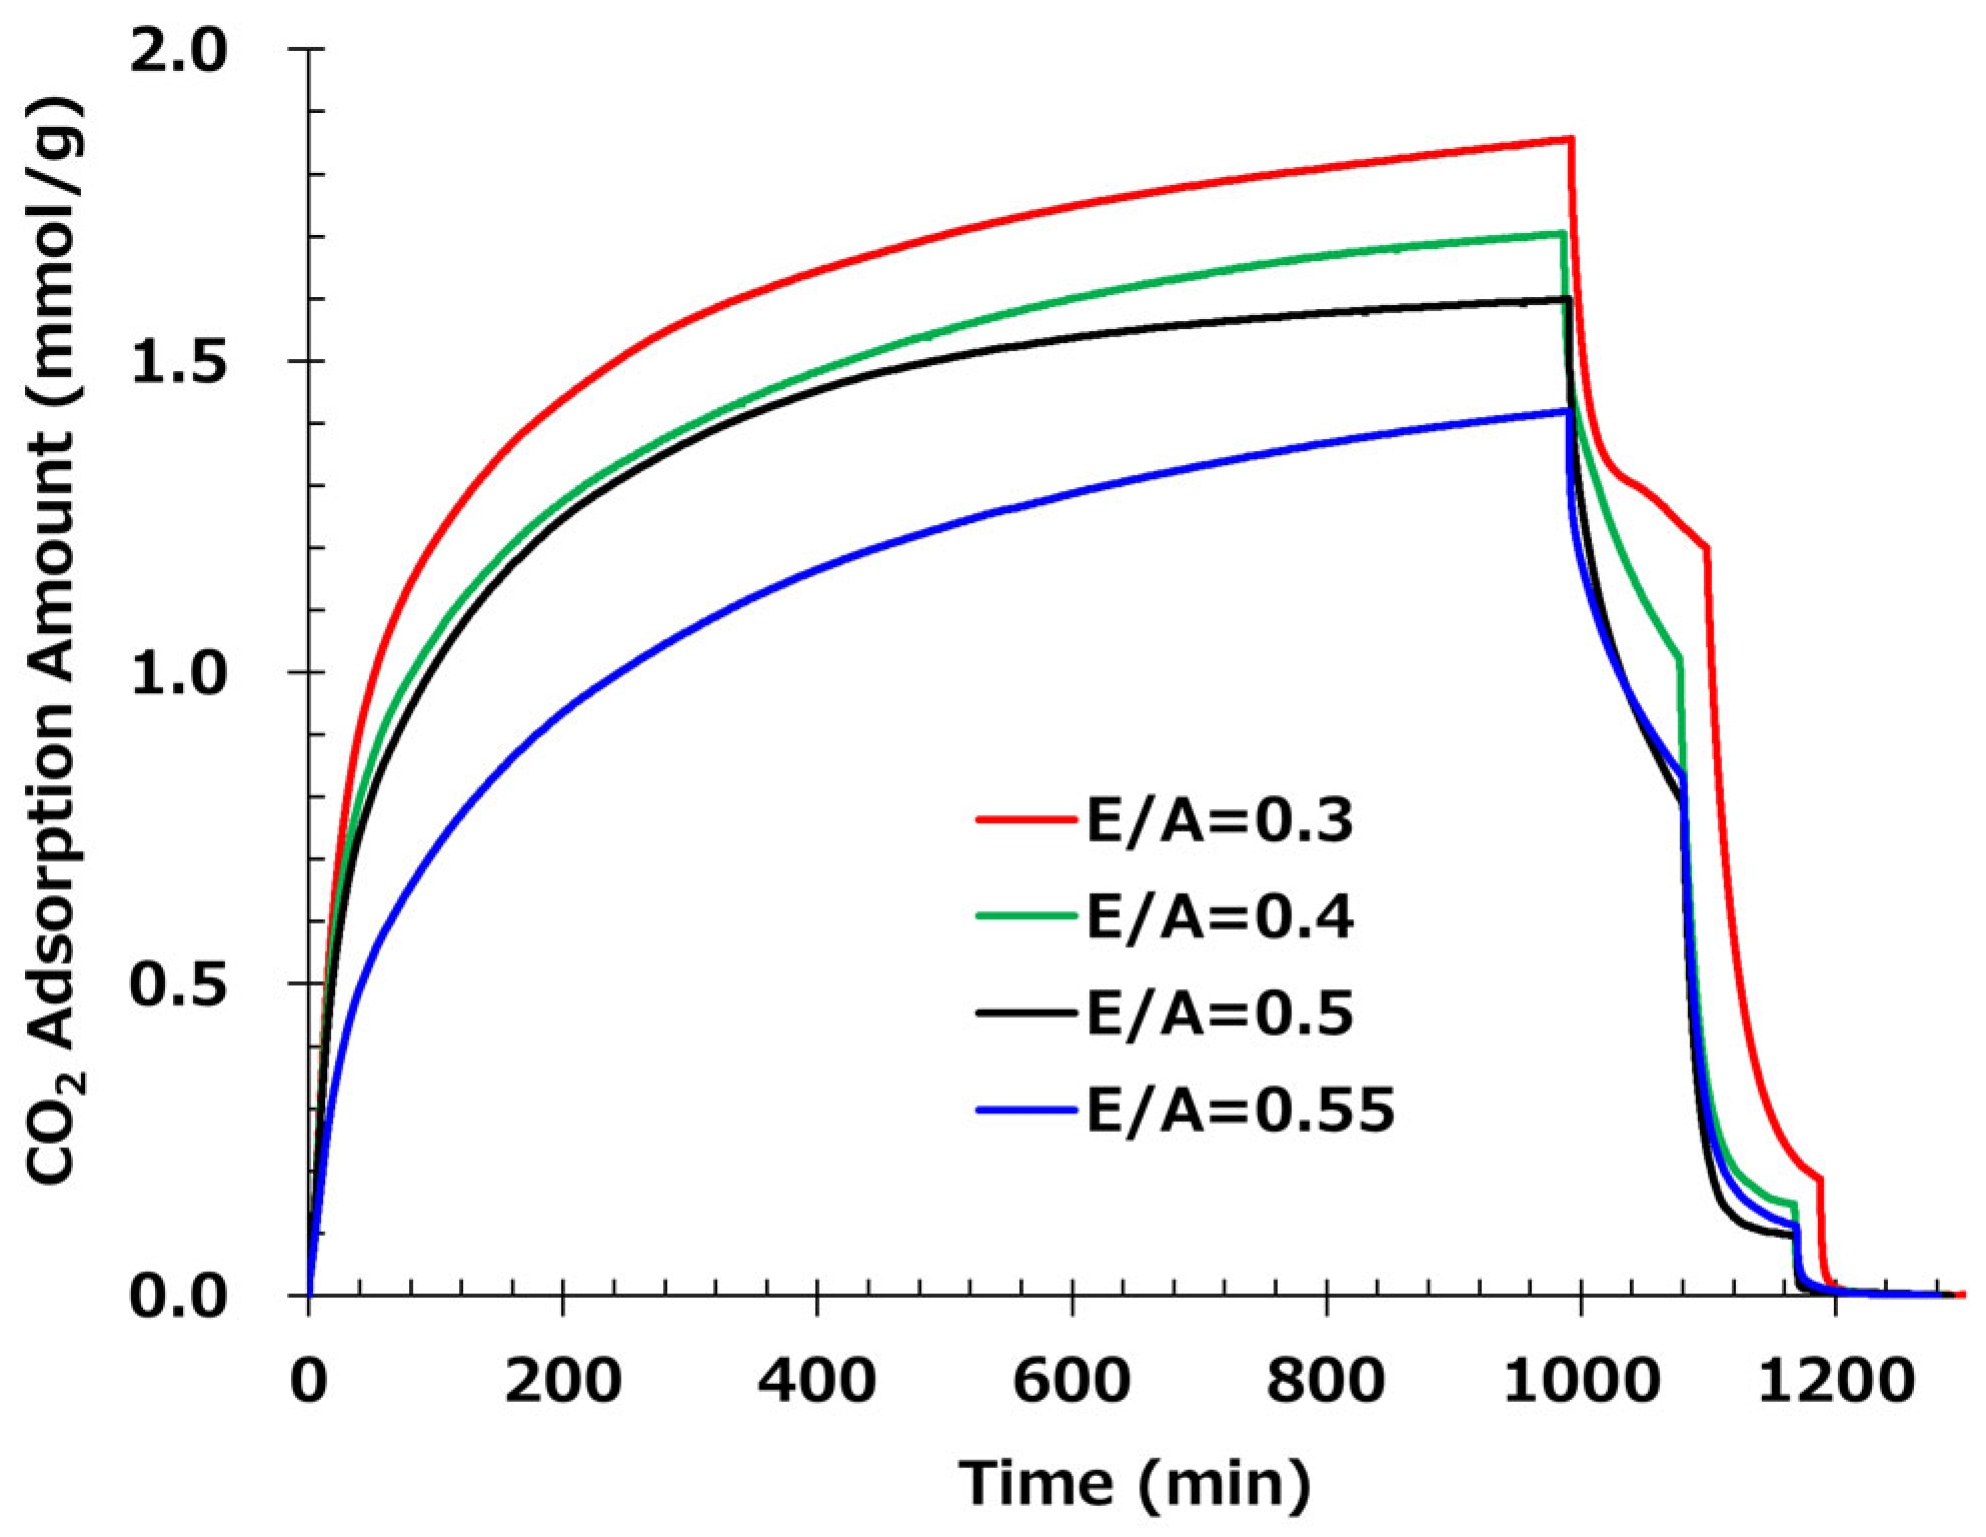
3.2. The Effect of the Epoxy-to-Amine Ratio in the CO2 Adsorption/Desorption Test
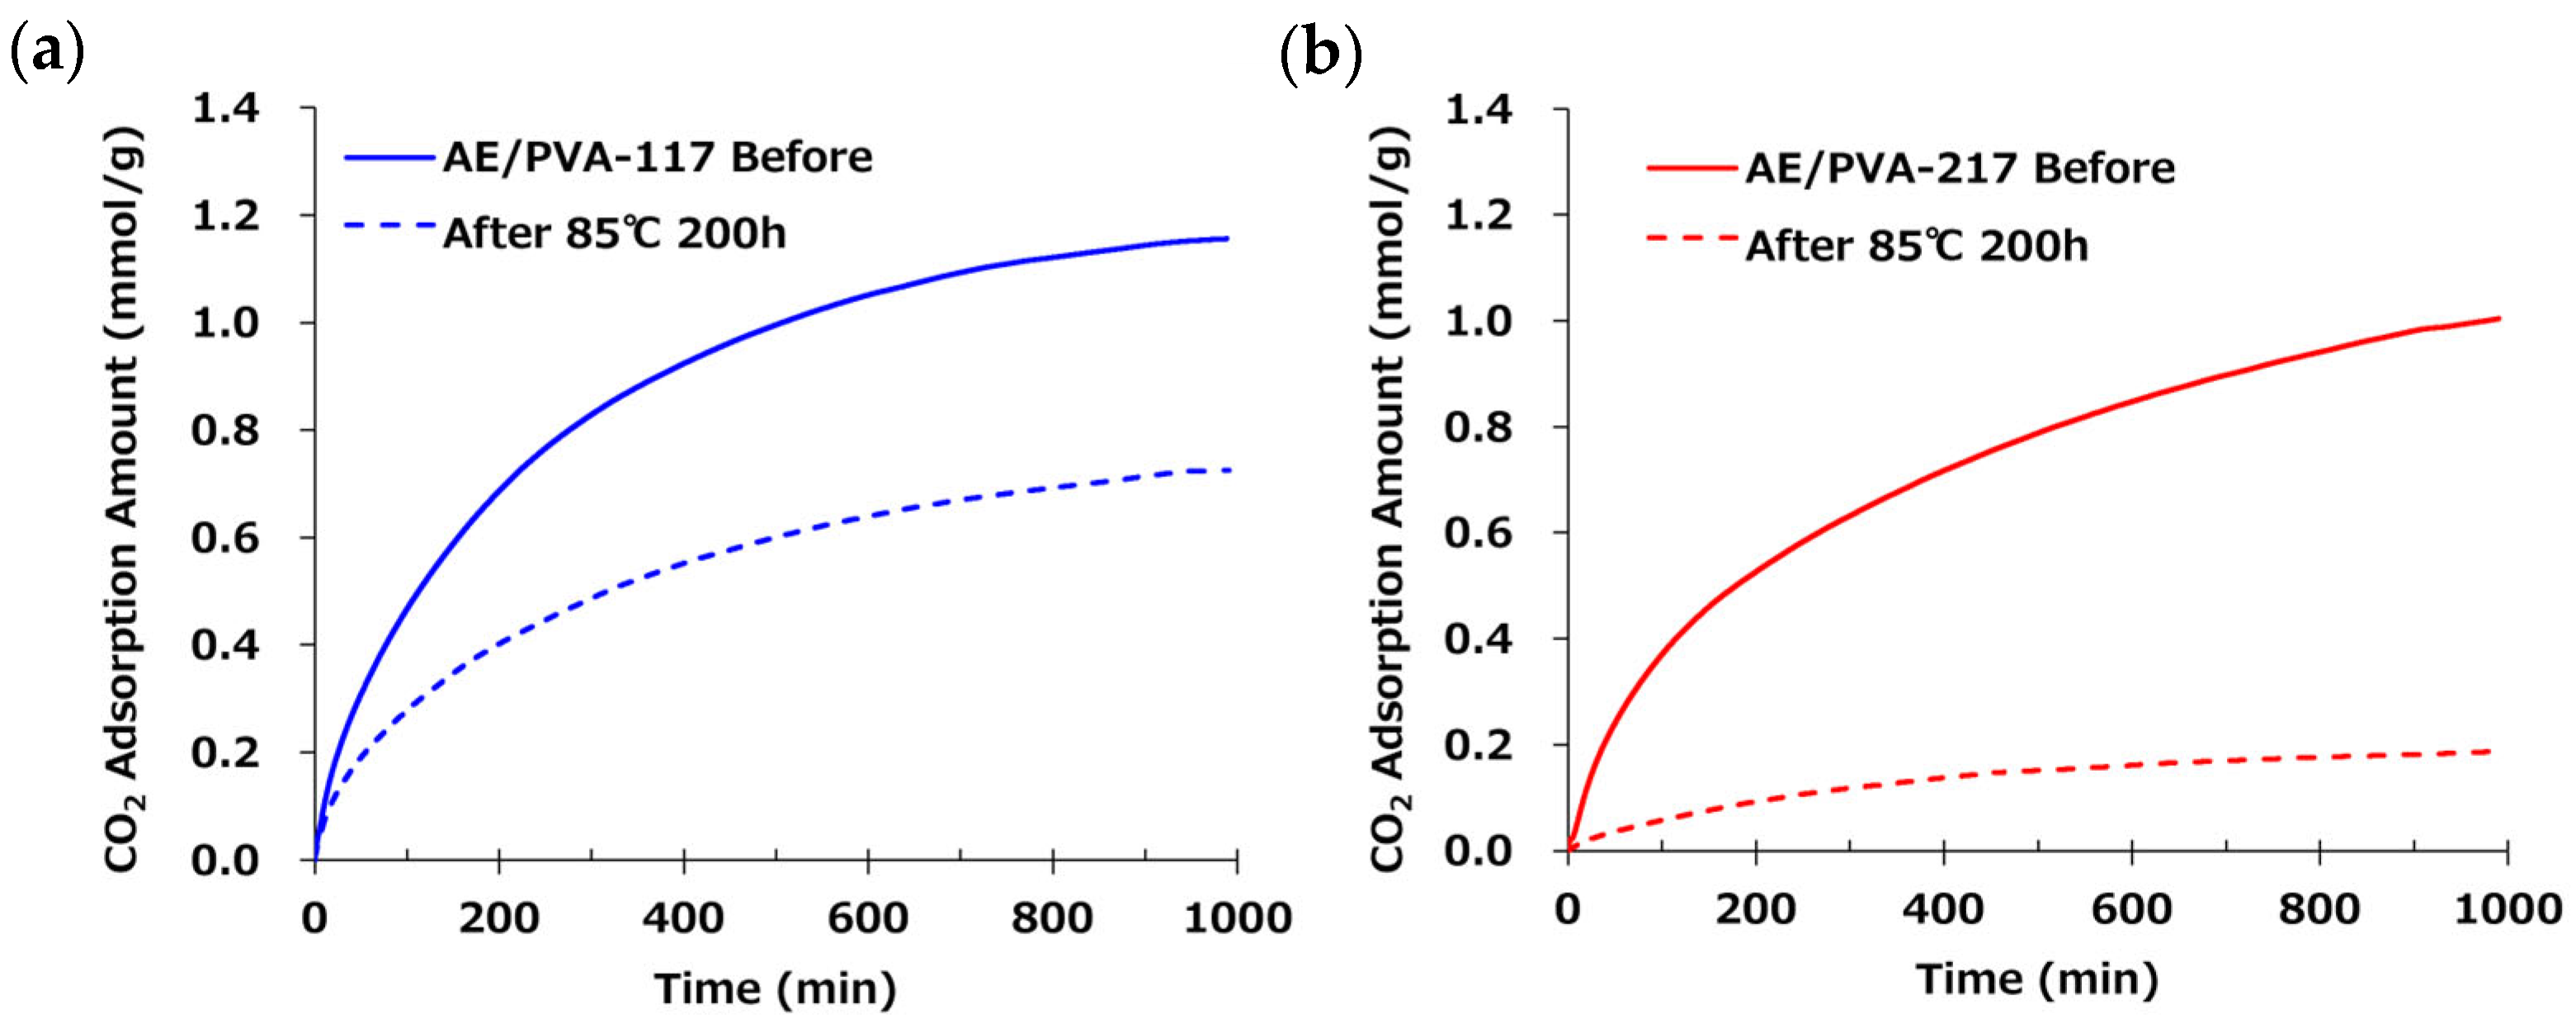
3.3. The Effect of the Degree of Saponification of PVA
4. Discussion
5. Conclusions
Author Contributions
Funding
Institutional Review Board Statement
Data Availability Statement
Acknowledgments
Conflicts of Interest
References
- Stocker, T.F.; Qin, D.; Plattner, G.-K.; Tignor, M.; Allen, S.K.; Boschung, J.; Nauels, A.; Xia, Y.; Bex, V.; Midgley, P.M. (Eds.) Climate Change 2013: The Physical Science Basis. Contribution of Working Group I to the Fifth Assessment Report of the Intergovernmental Panel on Climate Change; Cambridge University Press: Cambridge, UK; New York, NY, USA, 2013; 1535p. [Google Scholar]
- Lenssen, N.J.L.; Schmidt, G.A.; Hansen, J.E.; Menne, M.J.; Persin, A.; Ruedy, R.; Zyss, D. Improvements in the GISTEMP Uncertainty Model. J. Geophys. Res. Atmos. 2019, 124, 6307–6326. [Google Scholar] [CrossRef]
- Ye, J.; Dimitratos, N.; Rossi, L.M.; Thonemann, N.; Beale, A.M.; Wojcieszak, R. Hydrogenation of CO2 for Sustainable Fuel and Chemical Production. Science 2024, 384, 34–41. [Google Scholar] [CrossRef]
- Etheridge, D.M.; Steele, L.P.; Langenfelds, R.L.; Francey, R.J.; Barnola, J.M.; Morgan, V.I. Historical CO2 Records from the Law Dome DE08, DE08-2, and DSS Ice Cores. J. Geophys. Res. Atmos. 1996, 101, 4115–4128. [Google Scholar] [CrossRef]
- Shi, X.; Xiao, H.; Lackner, K.S.; Chen, B. Tying Amines Down for Stable CO2 Capture. Science 2020, 368, 928–932. [Google Scholar] [CrossRef]
- Yamada, H. Amine-Based Capture of CO2 for Utilization and Storage. Polym. J. 2020, 52, 1007–1015. [Google Scholar] [CrossRef]
- Stechemesser, A.; Koch, N.; Mark, E.; Dilger, E.; Klösel, P.; Menicacci, L.; Nachtigall, D.; Pretis, F.; Ritter, N.; Schwarz, M.; et al. Climate Policies That Achieved Major Emission Reductions: Global Evidence from Two Decades. Science 2024, 384, 112–118. [Google Scholar] [CrossRef]
- Chen, Y.; Wu, R.; Hsu, P.-C. Perspective on Distributed Direct Air Capture: What, Why, and How? npj Mater. Sustain. 2025, 4, 56. [Google Scholar] [CrossRef]
- Jung, H.; Jo, D.H.; Lee, C.H.; Chung, W.; Shin, D.; Kim, S.H. Vapor-Phase-Infiltrated AlOx/PIM-1 “Hybrid Scaffolds” as Solution Processable Amine Supports for CO2 Adsorption. Energy Fuels 2014, 28, 3994–4001. [Google Scholar] [CrossRef]
- Yu, H.; Wang, W.; Liu, M.; Zhao, T.; Lin, R.; Hou, M.; Kou, Y.; Chen, L.; Elzatahry, A.A.; Zhang, F.; et al. Versatile Synthesis of Dendritic Mesoporous Rare Earth–Based Nanoparticles. Sci. Adv. 2022, 8, 2356. [Google Scholar] [CrossRef]
- Zoannou, K.-S.; Sapsford, D.J.; Griffiths, A.J. Thermal Degradation of Monoethanolamine and Its Effect on CO2 Capture Capacity. Int. J. Greenhouse Gas Control 2013, 17, 423–430. [Google Scholar] [CrossRef]
- Lepaumier, H.; Picq, D.; Carrette, P.-L. New Amines for CO2 Capture. I. Mechanisms of Amine Degradation in the Presence of CO2. Ind. Eng. Chem. Res. 2009, 48, 9061–9067. [Google Scholar] [CrossRef]
- Zhao, M.; Huang, L.; Gao, Y.; Wang, Z.; Liang, S.; Zhu, X.; Wang, Q.; He, H.; O’Hare, D. Design of Ultra-Stable Solid Amine Adsorbents and Mechanisms of Hydroxyl Group-Dependent Deactivation for Reversible CO2 Capture from Flue Gas. Nano-Micro Lett. 2025, 17, 170. [Google Scholar] [CrossRef] [PubMed]
- Zhu, X.; Xie, W.; Wu, J.; Miao, Y.; Xiang, C.; Chen, C.; Ge, B.; Gan, Z.; Yang, F.; Zhang, M.; et al. Recent Advances in Direct Air Capture by Adsorption. Chem. Soc. Rev. 2022, 51, 6492–6536. [Google Scholar] [CrossRef] [PubMed]
- Zhang, Y.; Li, X.; Wang, J.; Zhao, Y.; Zhang, S.; Wang, Z. Scalable and Highly Porous Membrane Adsorbents for Direct Air Capture of CO2. ACS Appl. Mater. Interfaces 2024, 16, 12345–12356. [Google Scholar] [CrossRef] [PubMed]
- Panda, D.; Kulkarni, V.; Singh, S.K. Evaluation of Amine-Based Solid Adsorbents for Direct Air Capture: A Critical Review. React. Chem. Eng. 2023, 8, 10–40. [Google Scholar] [CrossRef]
- Zhao, S.; Zhang, Y.; Li, L.; Feng, J.; Qiu, W.; Ning, Y.; Huang, Z.; Lin, H. Degradation of Amine-Functionalized Adsorbents in Carbon Capture and Direct Air Capture Applications: Mechanism and Solutions. Sep. Purif. Technol. 2024, 326, 129586. [Google Scholar] [CrossRef]
- Darunte, L.A.; Oetomo, A.D.; Walton, K.S.; Sholl, D.S.; Jones, C.W. Direct Air Capture of CO2 Using Amine Functionalized MIL-101(Cr). ACS Sustain. Chem. Eng. 2016, 4, 5761–5768. [Google Scholar] [CrossRef]
- Anyanwu, J.-T.; Wang, Y.; Yang, R.T. Amine-Grafted Silica Gels for CO2 Capture Including Direct Air Capture. Ind. Eng. Chem. Res. 2020, 59, 7072–7079. [Google Scholar] [CrossRef]
- Didas, S.A.; Choi, S.; Chaikittisilp, W.; Jones, C.W. Amine-Oxide Hybrid Materials for CO2 Capture from Ambient Air. Acc. Chem. Res. 2015, 48, 2680–2687. [Google Scholar] [CrossRef]
- Okada, C.; Hou, Z.; Imoto, H.; Naka, K.; Kikutani, T.; Takasaki, M. In Situ Polymerization Electrospinning of Amine-Epoxy/Poly(vinyl alcohol) Nanofiber Webs for Direct CO2 Capture from the Air. ACS Omega 2024, 9, 50466–50475. [Google Scholar] [CrossRef]
- Okada, C.; Hou, Z.; Imoto, H.; Naka, K.; Kikutani, T.; Takasaki, M. Utilizing B-stage Amine-Epoxy in Electrospinning of Amine-Epoxy/Poly(vinyl alcohol) Nanofiber Webs for Direct CO2 Capture from the Air. J. Fiber Sci. Technol. 2025, 81. [Google Scholar]
- Elkasaby, M.; Hegab, H.A.; Mohany, A.; Rizvi, G.M. Modeling and Optimization of Electrospinning of Polyvinyl Alcohol (PVA). Adv. Theory Simul. 2017, 1, 1800069. [Google Scholar] [CrossRef]
- Ji, D.; Lin, Y.; Guo, X.; Ramasubramanian, B.; Wang, R.; Radacsi, N.; Jose, R.; Qin, X.; Ramakrishna, S. Electrospinning of Nanofibres. Nat. Rev. Mater. 2024, 9, 1. [Google Scholar] [CrossRef]
- Ding, B.; Kim, H.-Y.; Lee, S.-C.; Lee, D.-R.; Choi, K.-J. Preparation and Characterization of Nanoscaled Poly(vinyl alcohol) Fibers via Electrospinning. Fibers Polym. 2002, 3, 73–79. [Google Scholar] [CrossRef]
- Lanigan, R.M.; Starkov, P.; Sheppard, T.D. Direct Synthesis of Amides from Carboxylic Acids and Amines Using B(OCH2CF3)3. J. Org. Chem. 2013, 78, 4512–4523. [Google Scholar] [CrossRef]
- Oldenhuis, N.J.; Whittaker, A.M.; Dong, V.M. Greener Methods for Amide Bond Synthesis. In Green Chemistry in Drug Discovery. Methods in Pharmacology and Toxicology; Springer: Berlin/Heidelberg, Germany, 2021; pp. 35–96. [Google Scholar] [CrossRef]
- Darunte, L.A.; Sen, T.; Bhawanani, C.; Walton, K.S.; Sholl, D.S.; Realff, M.J.; Jones, C.W. Moving Beyond Adsorption Capacity in Design of Adsorbents for CO2 Capture from Ultra-dilute Feeds: Kinetics of CO2 Adsorption in Materials with Stepped Isotherms. Ind. Eng. Chem. Res. 2019, 58, 22438–22447. [Google Scholar] [CrossRef]


| Degree of Saponification (%) | Degree of Polymerization | Molecular Weight | |
|---|---|---|---|
| PVA-117 | 99 | 1700 | 76,000 |
| PVA-217 | 88 | 1700 | 83,000 |
| No.1 | No.2 | No.3 | |
|---|---|---|---|
| Voltage (V) | 15 | 10 | 15 |
| Distance (cm) | 12 | 8 | 8 |
| Voltage/Distance (V/cm) | 1.25 | 1.25 | 1.875 |
| Fiber Diameter (nm) | 383 | 420 | 454 |
| CO2 Adsorption Amount (mmol/g) | 1.67 | 1.56 | 1.49 |
| Adsorption Half Time (min) | 28.3 | 45.7 | 110 |
| SEM ×1 k | 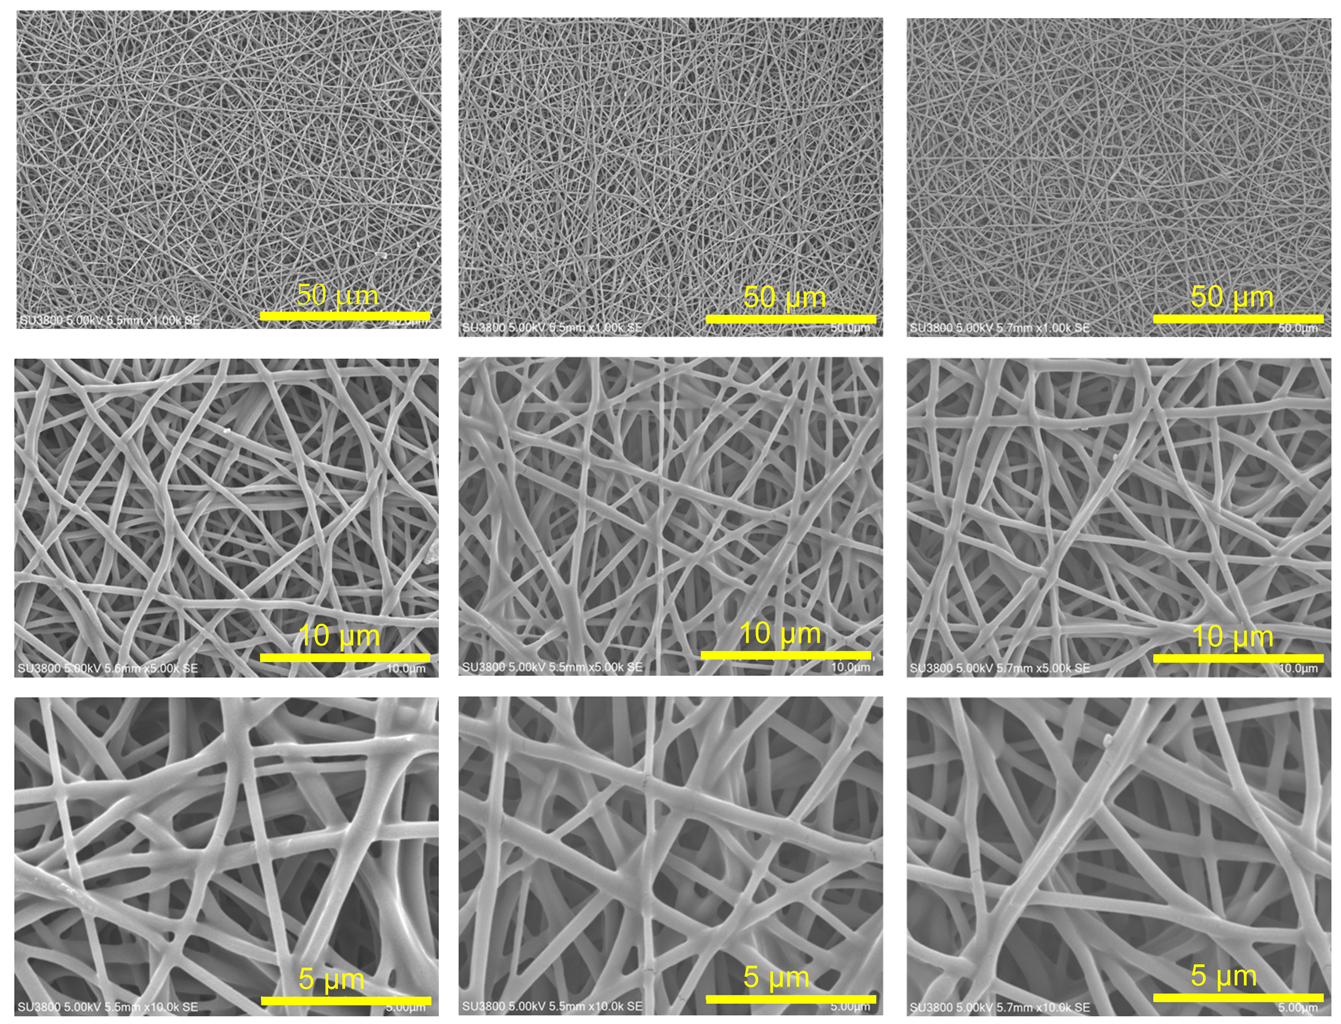 | ||
| SEM ×5 k | |||
| SEM ×10 k | |||
| E/A | 0.3 | 0.4 | 0.5 | 0.55 |
|---|---|---|---|---|
| EDE (g) | 0.8 | 0.8 | 0.8 | 0.8 |
| T-X (g) | 0.2 | 0.2 | 0.2 | 0.2 |
| SP-006 (g) | 2.67 | 2.00 | 1.60 | 1.45 |
| PVA 7 wt% Aq. Solution (g) | 33.0 | 27.0 | 23.4 | 22.1 |
| EDE: T-X | 8:2 | 8:2 | 8:2 | 8:2 |
| AE: PVA Aq. Solution | 1:9 | 1:9 | 1:9 | 1:9 |
| AE/(AE + PVA) (wt%) | 61 | 61 | 61 | 61 |
| E/A | 0.3 | 0.4 | 0.5 | 0.55 |
|---|---|---|---|---|
| Fiber Diameter (nm) | 865 | 661 | 481 | 424 |
| Tg (°C) | 5.1 | 10.3 | 19.0 | 24.8 |
| CO2 Adsorption Amount (mmol/g) | 1.86 | 1.7 | 1.6 | 1.42 |
| Prediction Saturation Value of Adsorption (mmol/g) | 1.91 | 1.84 | 1.64 | 1.59 |
| Desorption Ratio at 50 °C (%) | 37 | 44 | 52 | 48 |
| Desorption Ratio at 65 °C (%) | 90 | 92 | 94 | 93 |
| Desorption Ratio at 80 °C (%) | 100 | 100 | 100 | 100 |
| Heat Resistance (%) | 54 | 67 | 74 | — |
| SEM ×3 k |  | |||
| SEM ×5 k | ||||
| AE/PVA-117 | AE/PVA-217 | |
|---|---|---|
| ODE (g) | 0.8 | 0.8 |
| T-C (g) | 0.2 | 0.2 |
| TETA (g) | 1.6 | 1.6 |
| 8 wt% PVA Aq. Solution (g) | 23.4 | 23.4 |
| ODE: T-C | 8:2 | 8:2 |
| E/A | 0.5 | 0.5 |
| PVA (saponification deg.) | PVA-117 (99%) | PVA-217 (88%) |
| AE: PVA 8 wt% Aq. Solution | 1:9 | 1:9 |
| AE/(AE + PVA) | 58% | 58% |
| AE/PVA-117 | AE/PVA-217 | |
|---|---|---|
| Fiber Diameter (nm) | 362 | 326 |
| CO2 Adsorption Amount (mmol/g) | 1.16 | 1.00 |
| Prediction Saturation Value (mmol/g) | 1.25 | 1.34 |
| Heat Resistance (%) | 68% | 15% |
| SEM ×3 k | 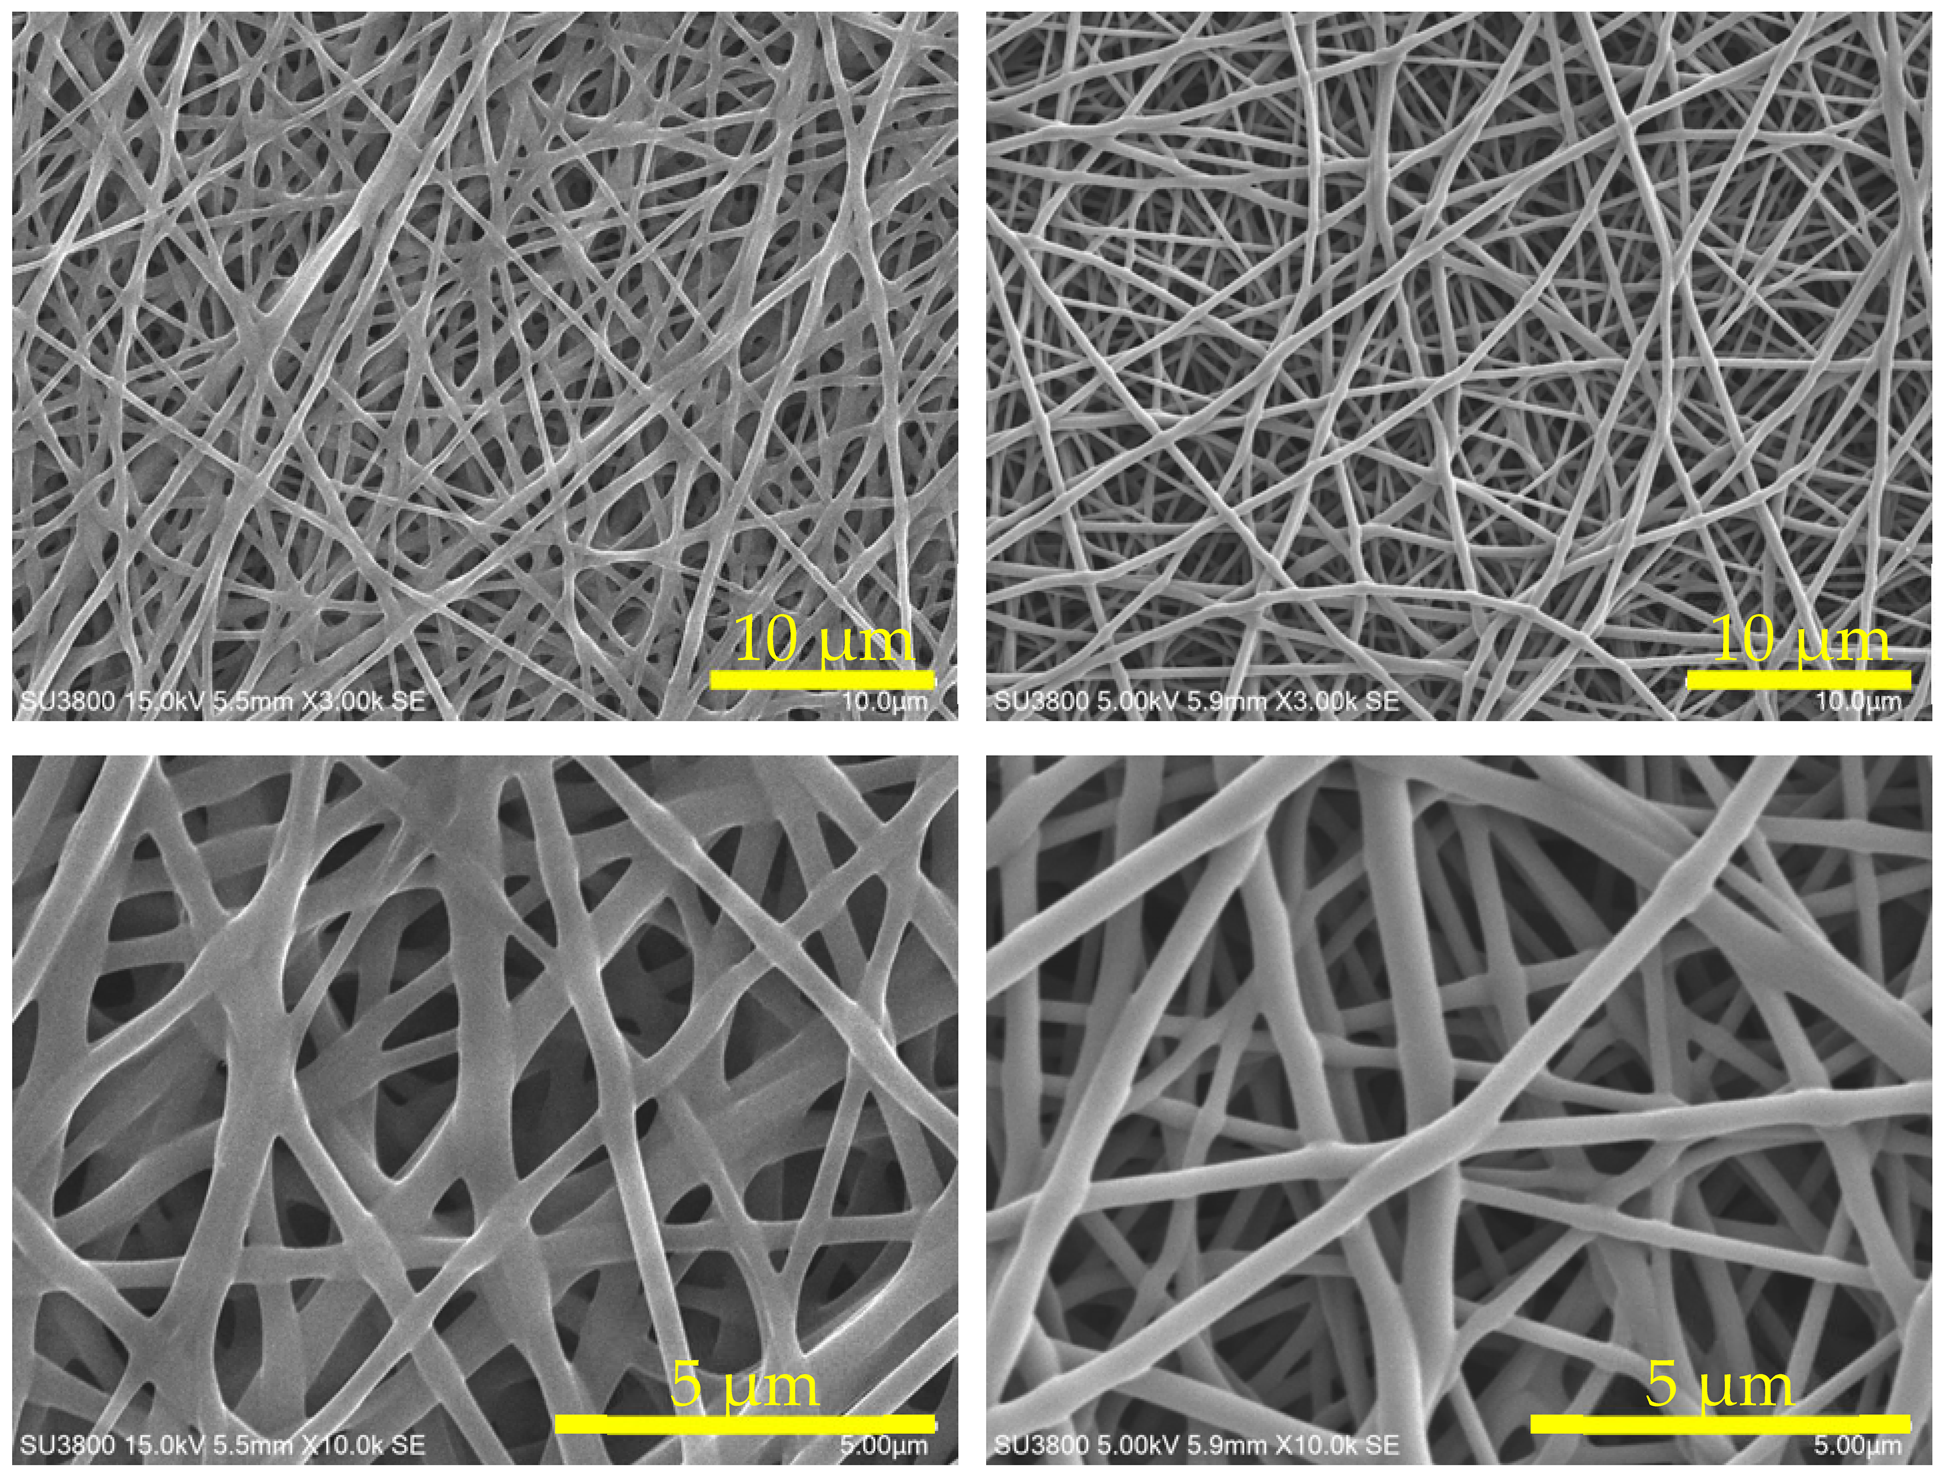 | |
| SEM ×10 k | ||
Disclaimer/Publisher’s Note: The statements, opinions and data contained in all publications are solely those of the individual author(s) and contributor(s) and not of MDPI and/or the editor(s). MDPI and/or the editor(s) disclaim responsibility for any injury to people or property resulting from any ideas, methods, instructions or products referred to in the content. |
© 2025 by the authors. Licensee MDPI, Basel, Switzerland. This article is an open access article distributed under the terms and conditions of the Creative Commons Attribution (CC BY) license (https://creativecommons.org/licenses/by/4.0/).
Share and Cite
Okada, C.; Hou, Z.; Imoto, H.; Naka, K.; Kikutani, T.; Takasaki, M. The Effect of the Fiber Diameter, Epoxy-to-Amine Ratio, and Degree of PVA Saponification on CO2 Adsorption Properties of Amine-Epoxy/PVA Nanofibers. Polymers 2025, 17, 1973. https://doi.org/10.3390/polym17141973
Okada C, Hou Z, Imoto H, Naka K, Kikutani T, Takasaki M. The Effect of the Fiber Diameter, Epoxy-to-Amine Ratio, and Degree of PVA Saponification on CO2 Adsorption Properties of Amine-Epoxy/PVA Nanofibers. Polymers. 2025; 17(14):1973. https://doi.org/10.3390/polym17141973
Chicago/Turabian StyleOkada, Chisato, Zongzi Hou, Hiroaki Imoto, Kensuke Naka, Takeshi Kikutani, and Midori Takasaki. 2025. "The Effect of the Fiber Diameter, Epoxy-to-Amine Ratio, and Degree of PVA Saponification on CO2 Adsorption Properties of Amine-Epoxy/PVA Nanofibers" Polymers 17, no. 14: 1973. https://doi.org/10.3390/polym17141973
APA StyleOkada, C., Hou, Z., Imoto, H., Naka, K., Kikutani, T., & Takasaki, M. (2025). The Effect of the Fiber Diameter, Epoxy-to-Amine Ratio, and Degree of PVA Saponification on CO2 Adsorption Properties of Amine-Epoxy/PVA Nanofibers. Polymers, 17(14), 1973. https://doi.org/10.3390/polym17141973