
Experimental and Numerical Investigation of the Mechanical Properties of ABS Parts Fabricated via Fused Deposition Modeling


Abstract
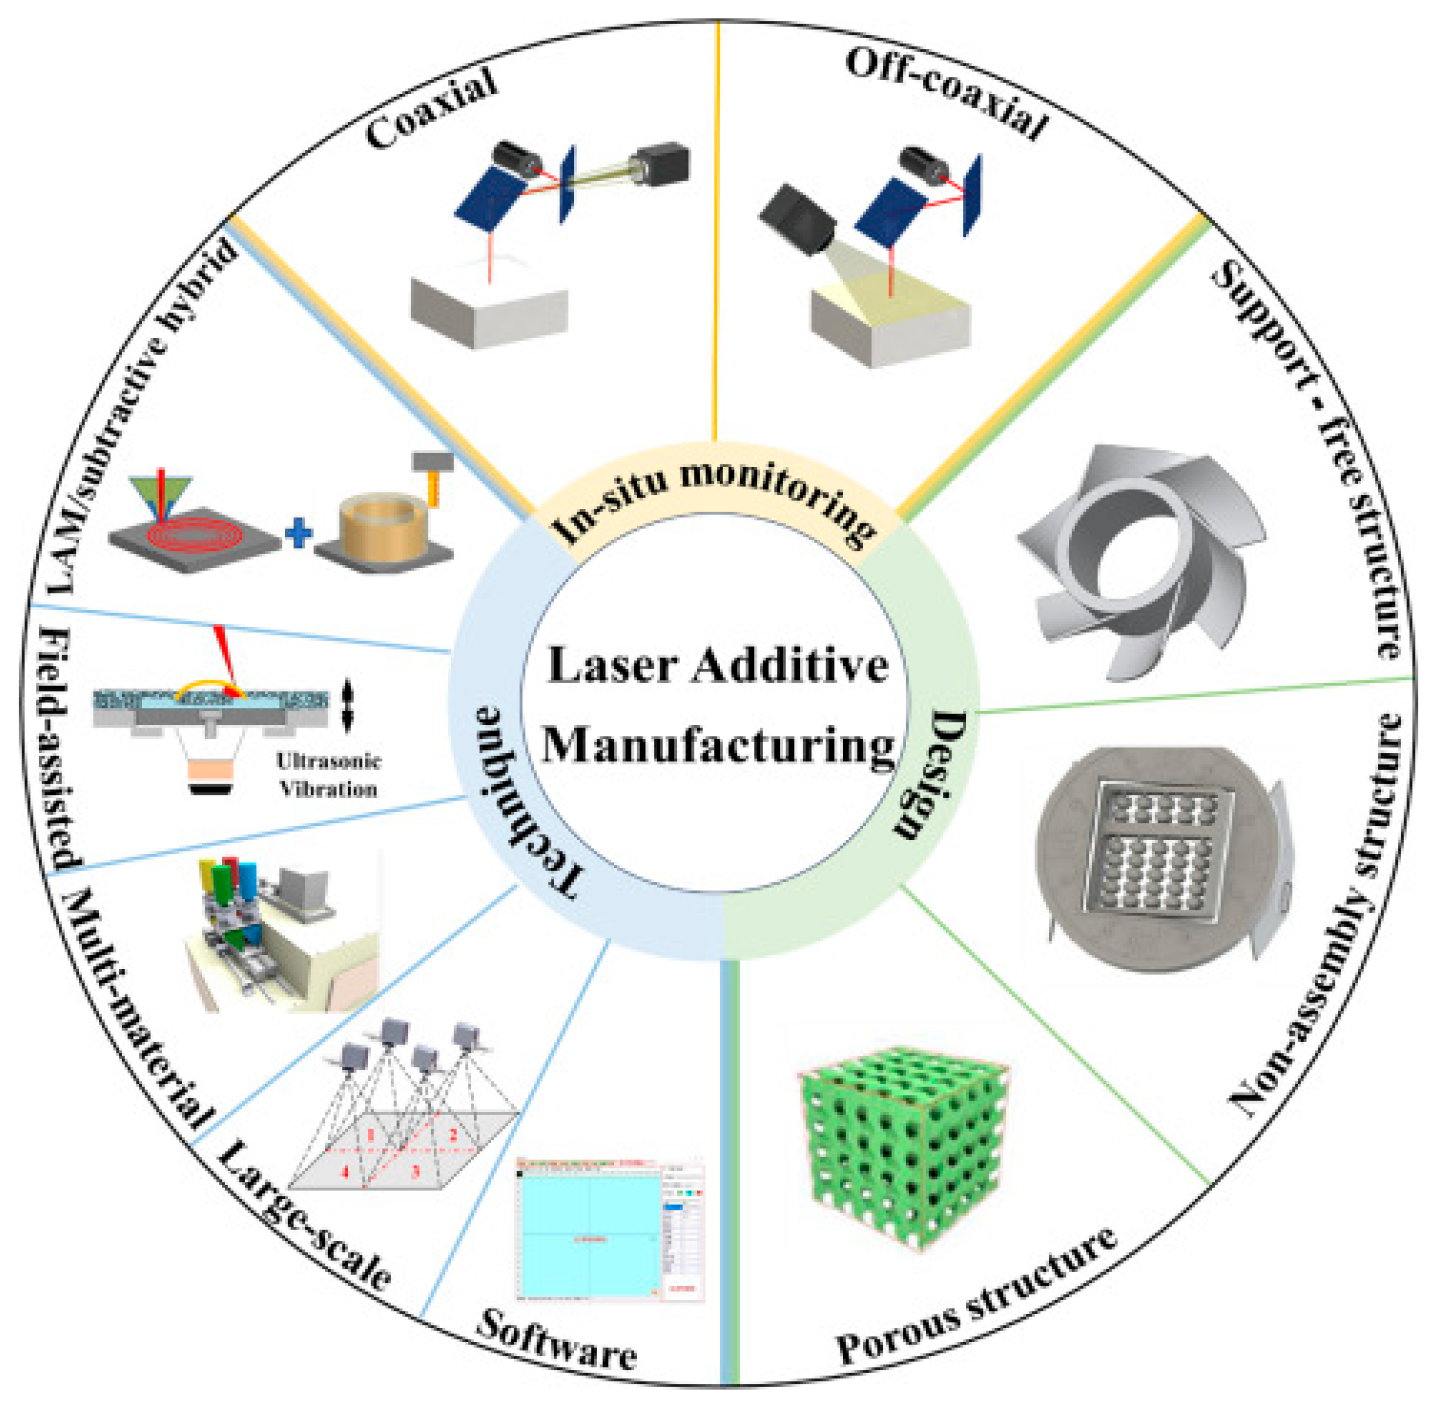
1. Introduction
2. Model Establishment and Simulation Analysis
2.1. Material Property Definition
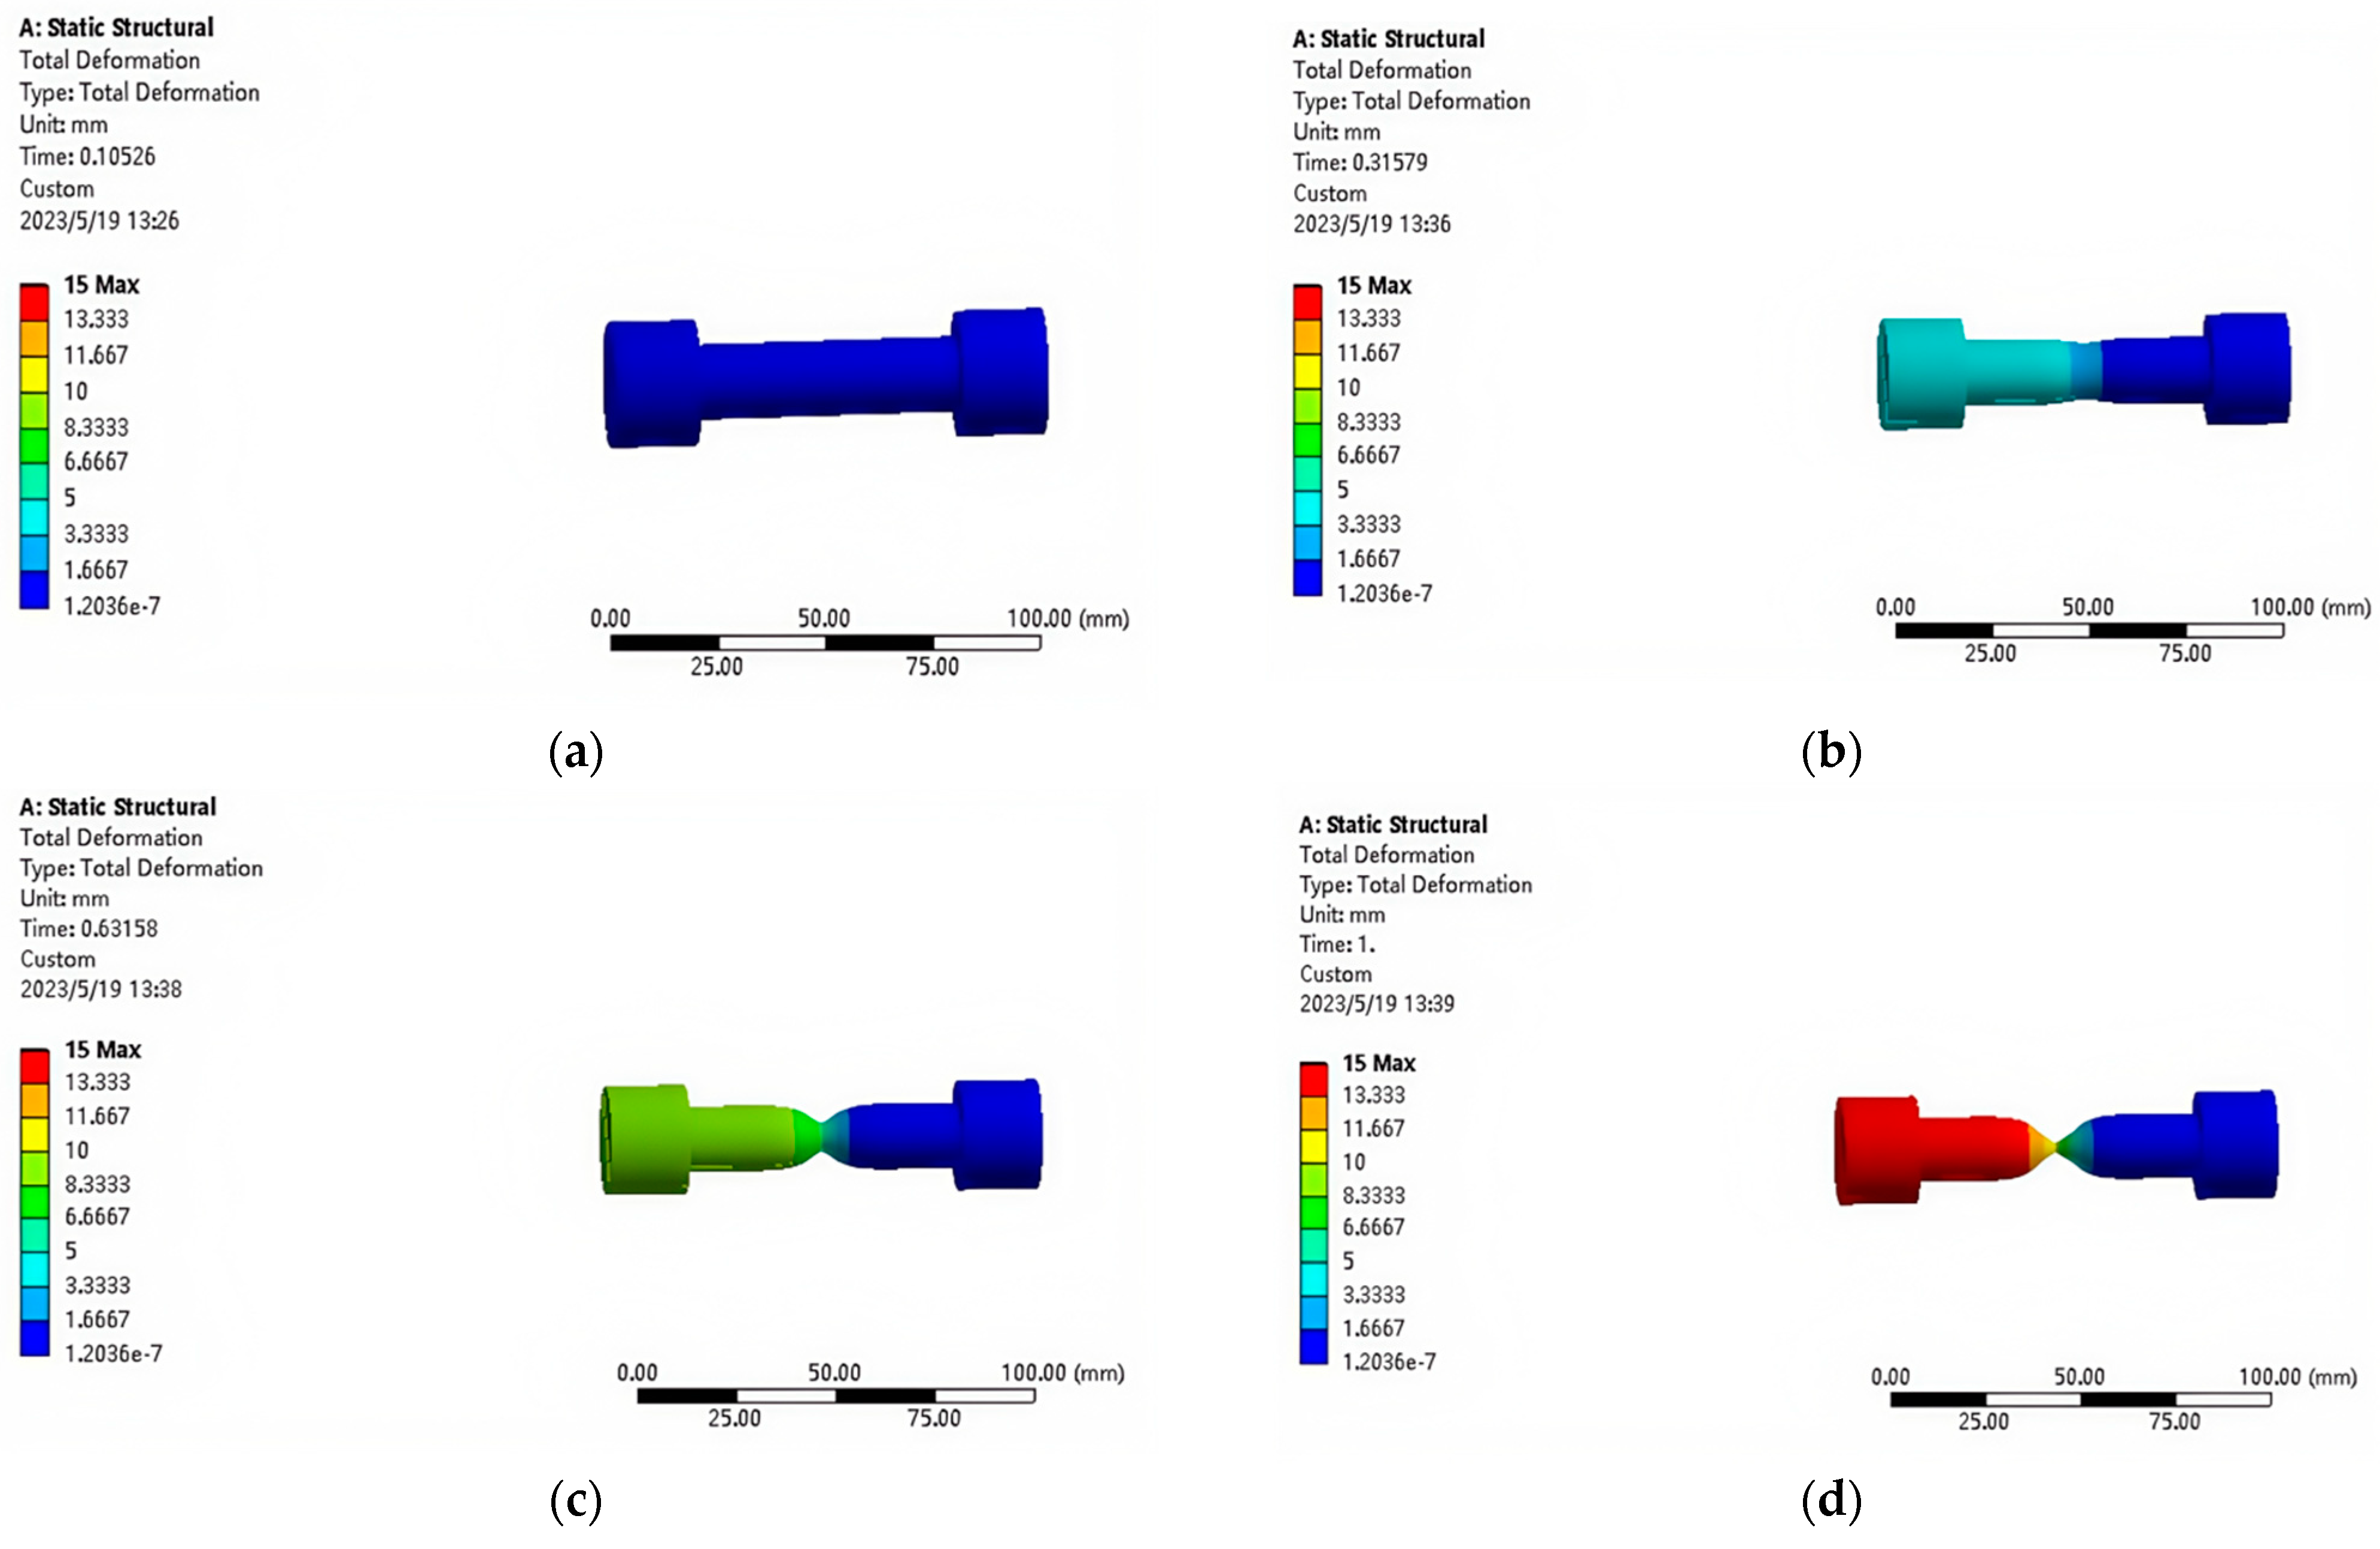
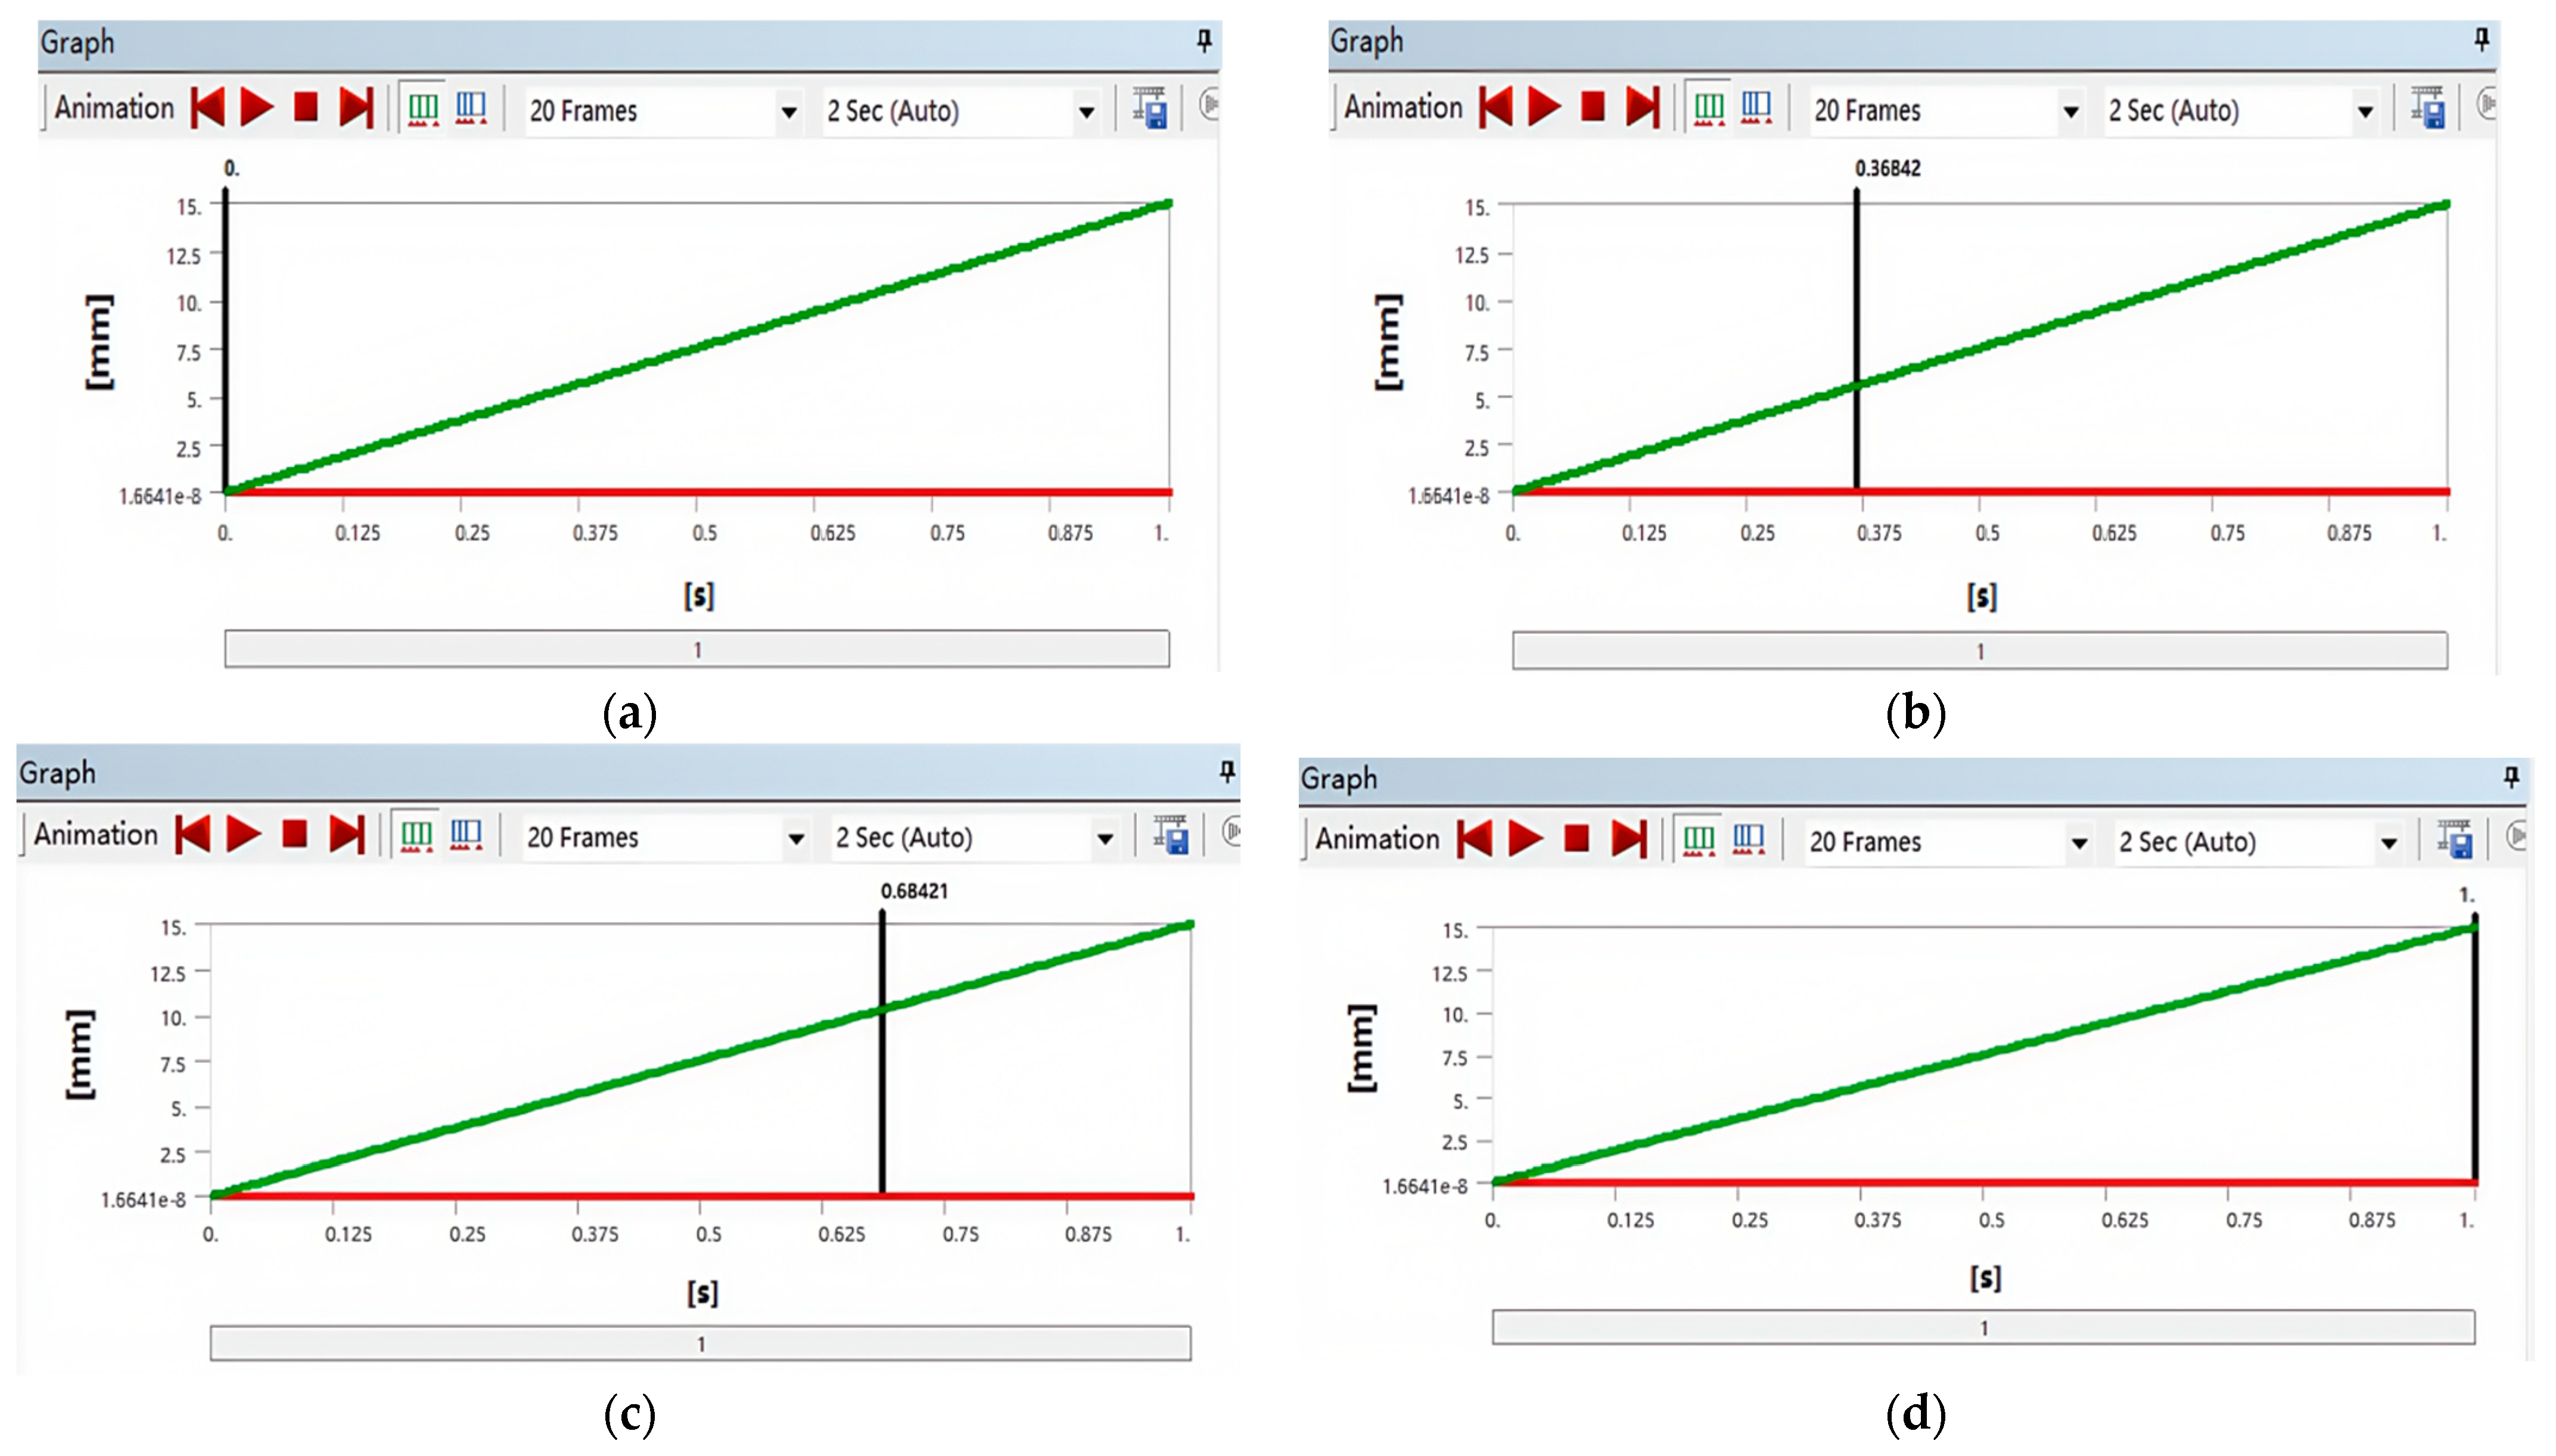
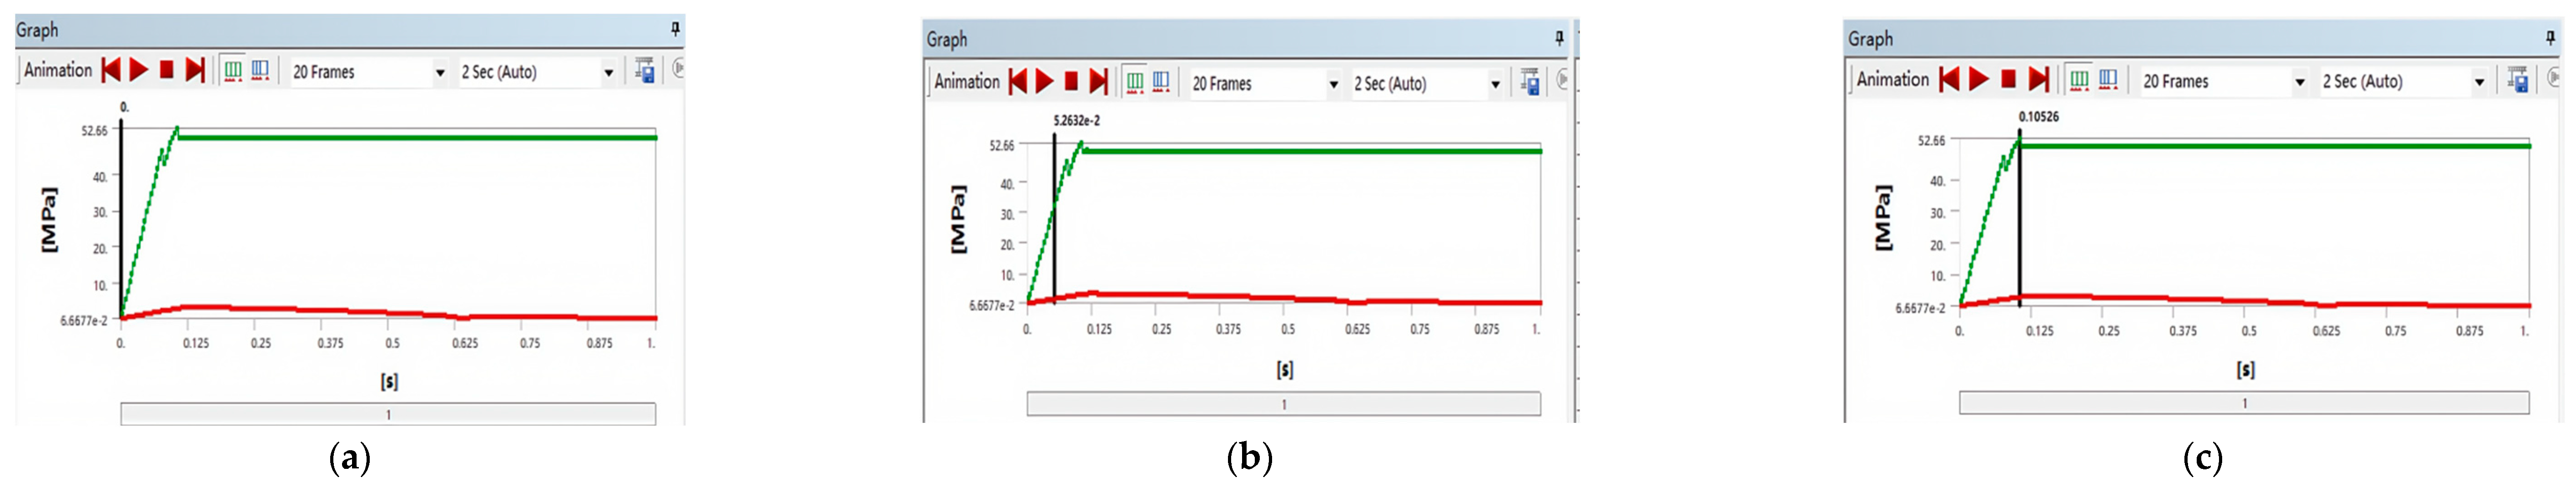
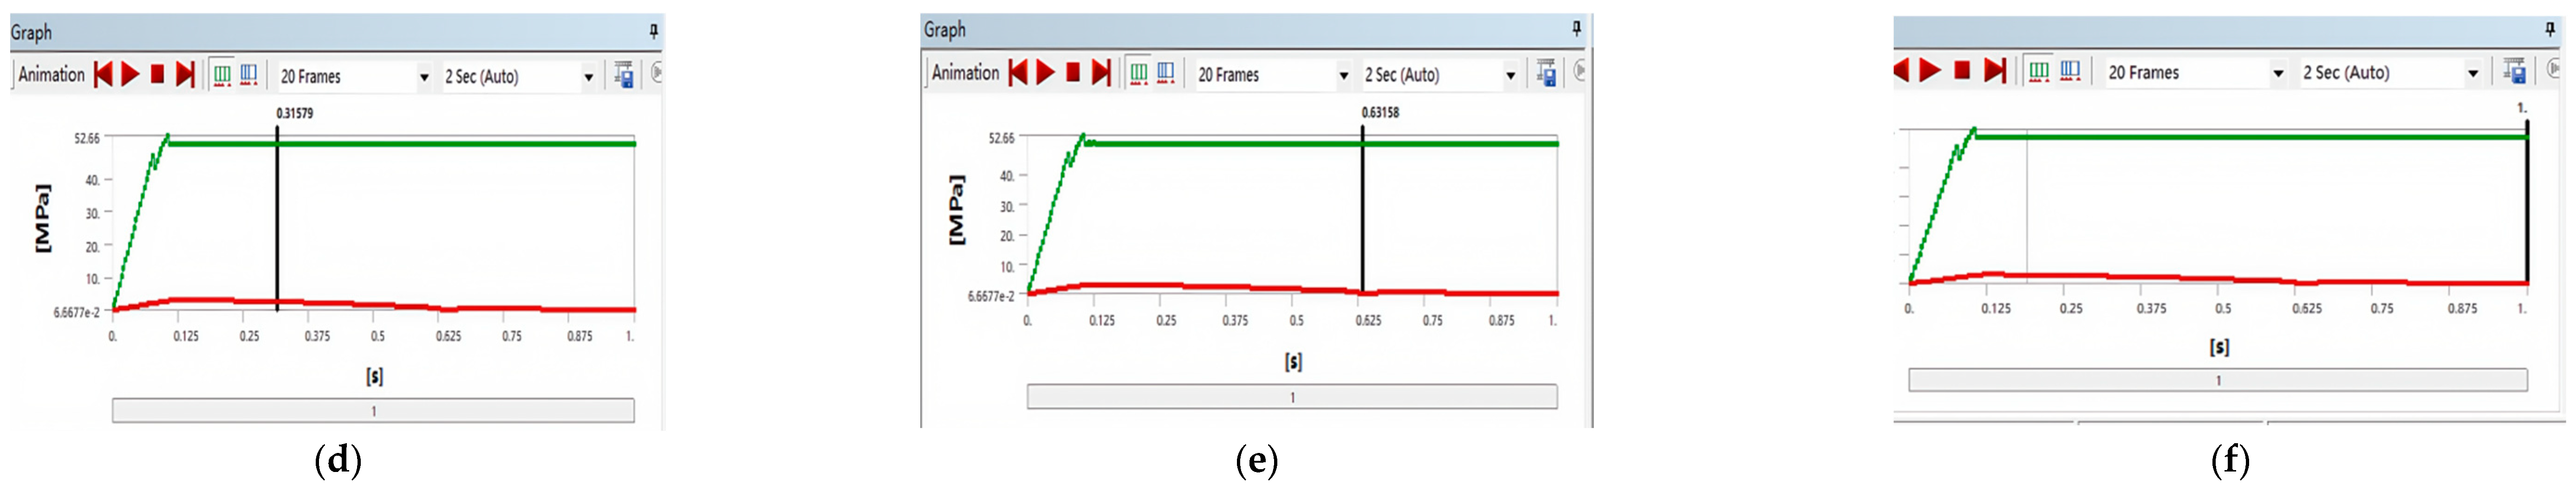
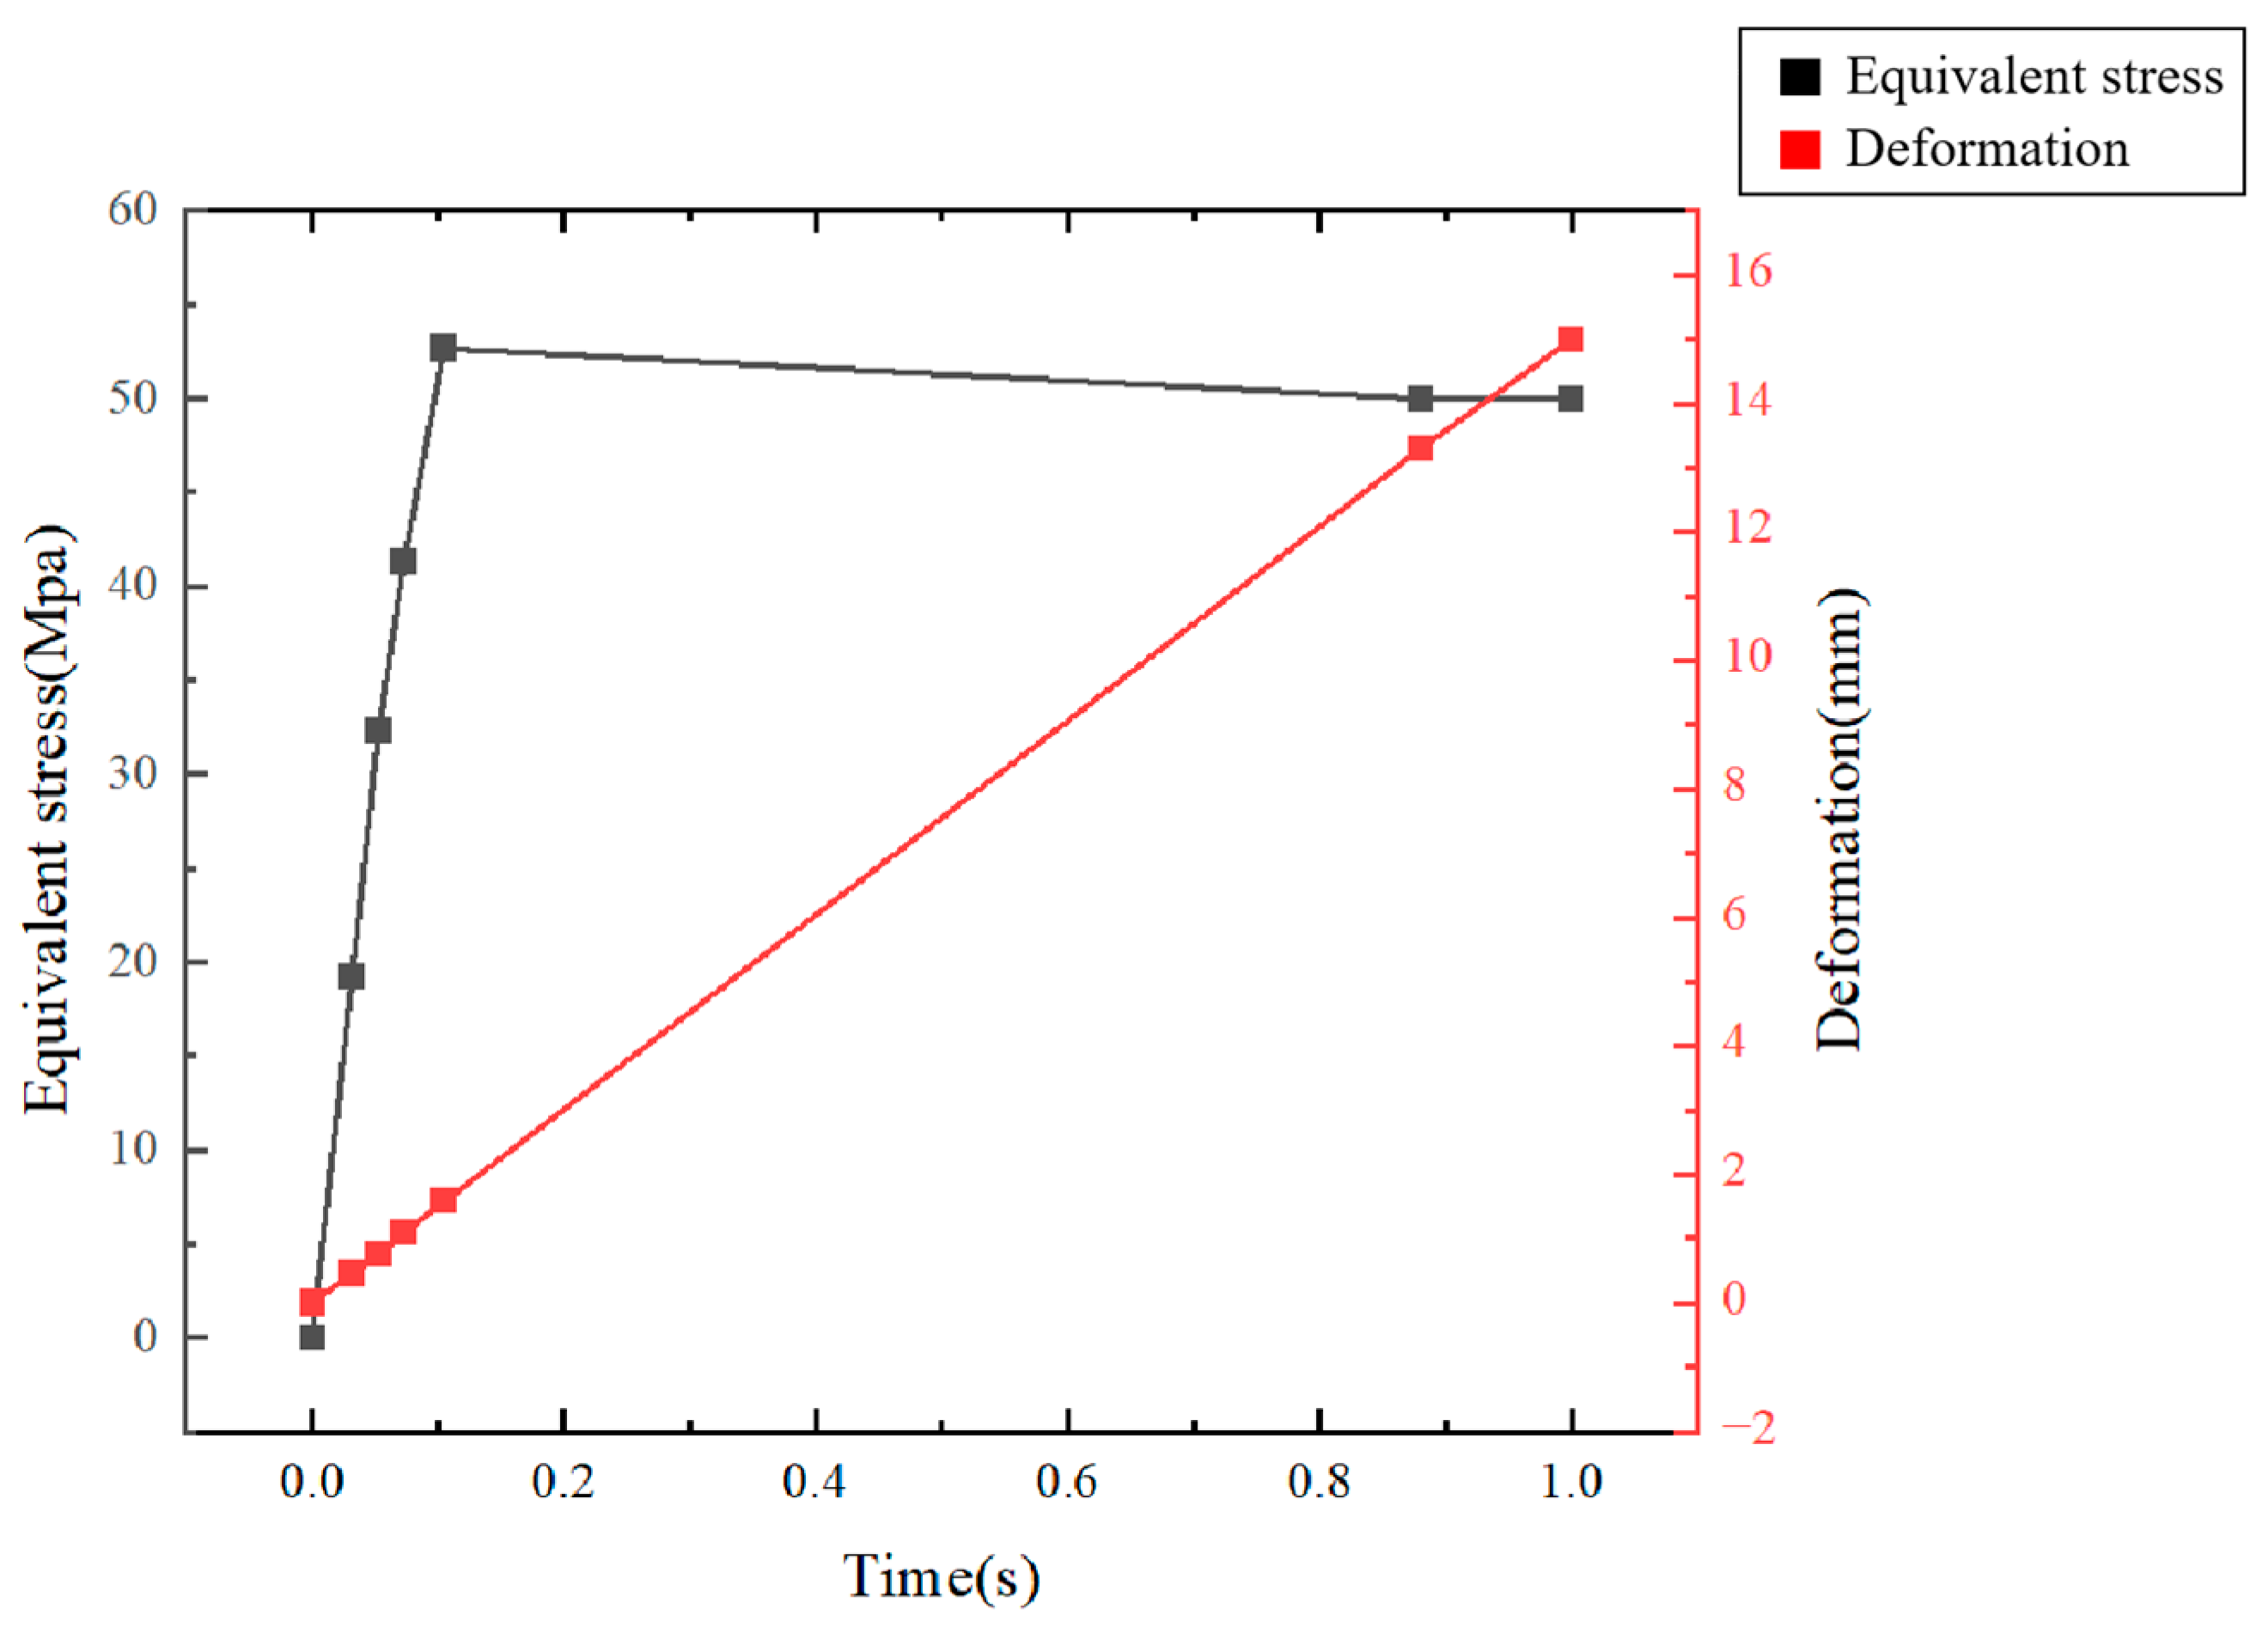
2.2. Simulation Analysis of Equivalent Stress and Deformation
2.3. Statistical Analysis of Equivalent Stress and Deformation
3. Experiment
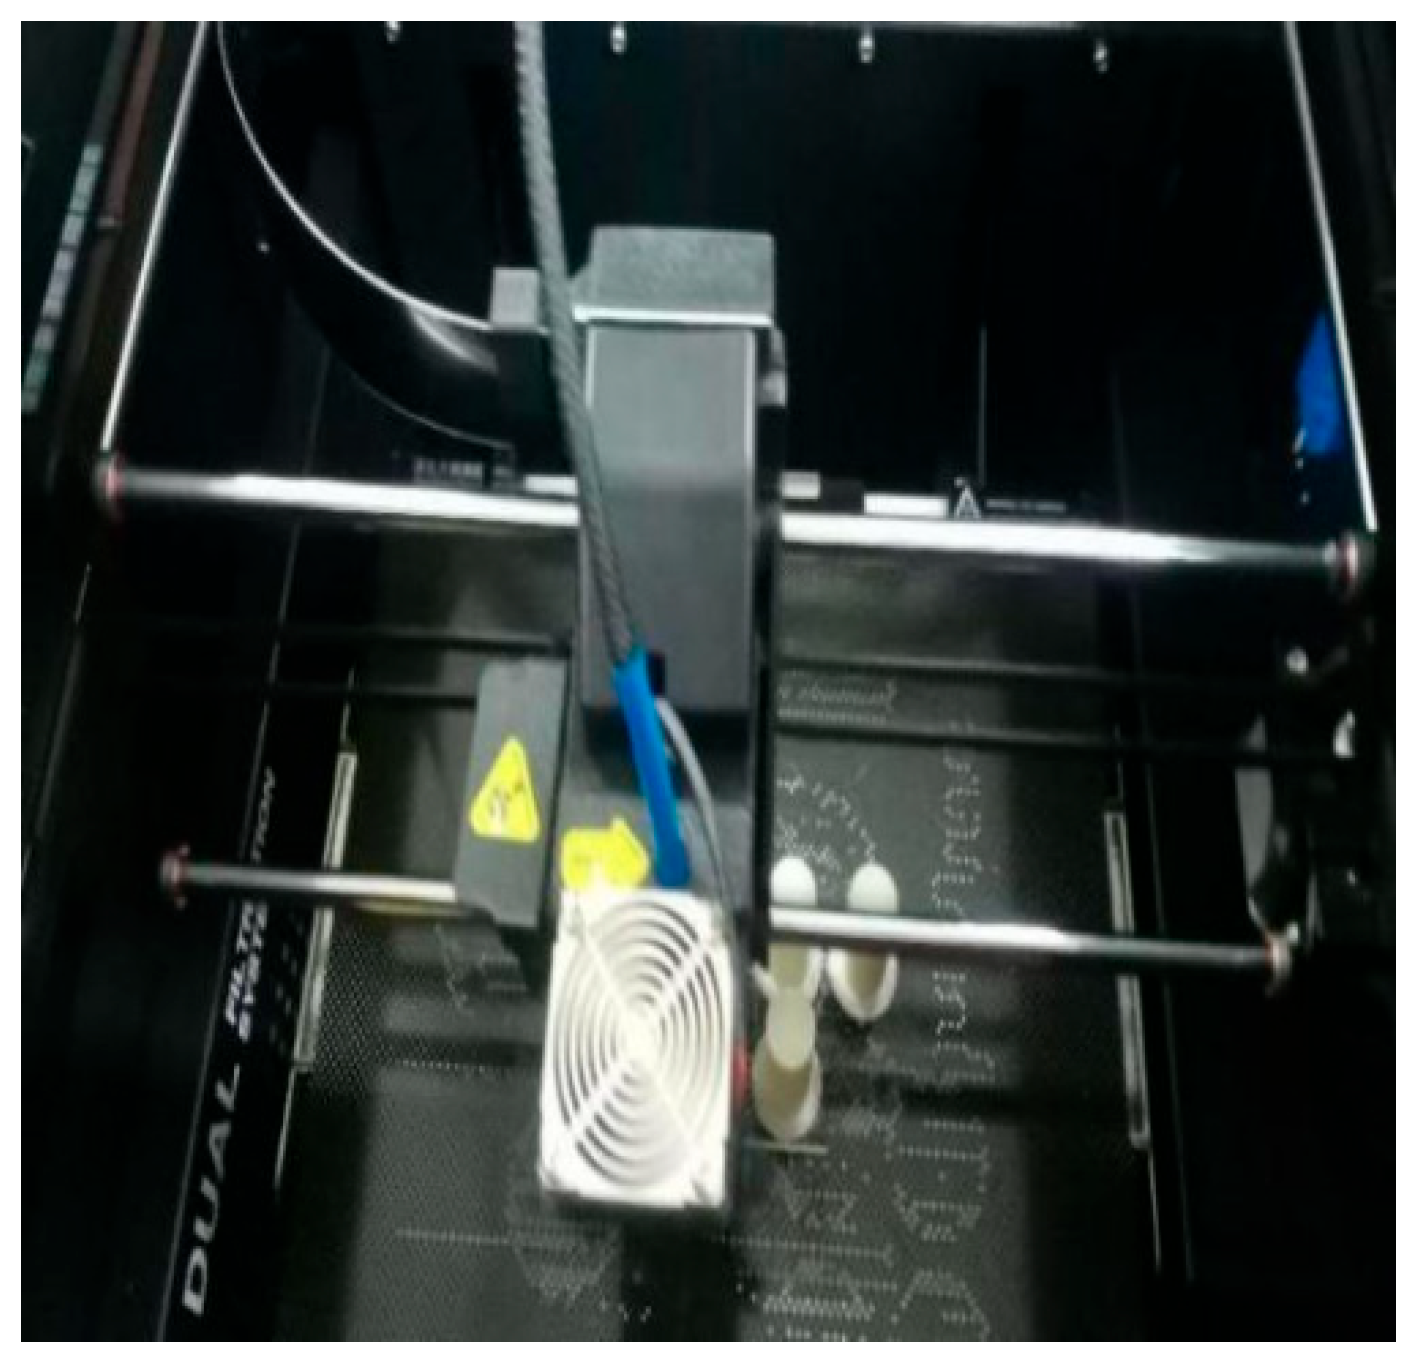
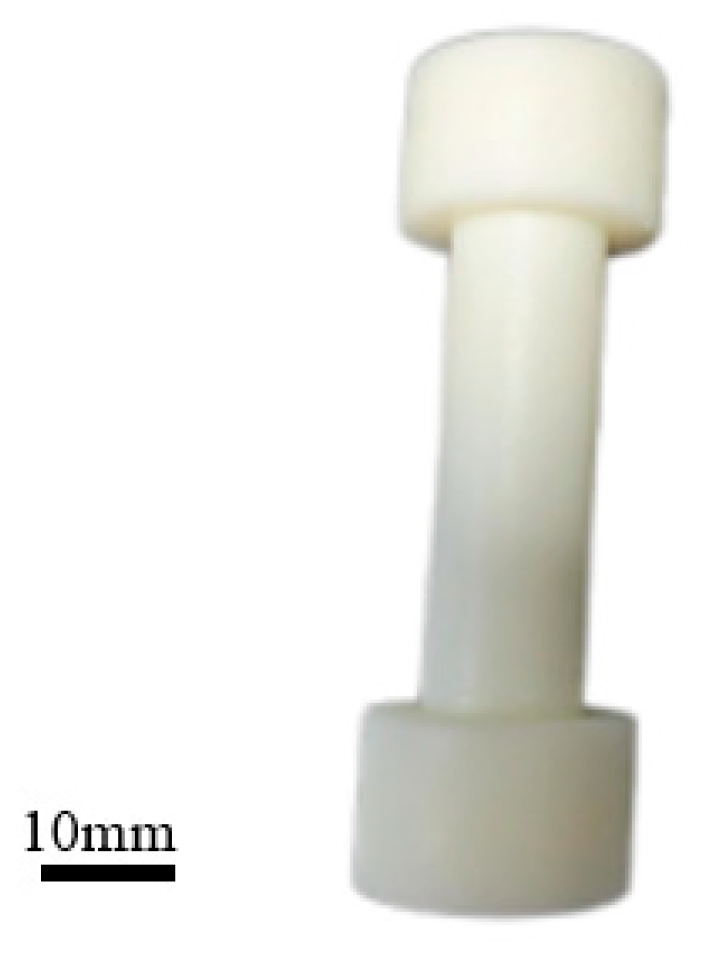
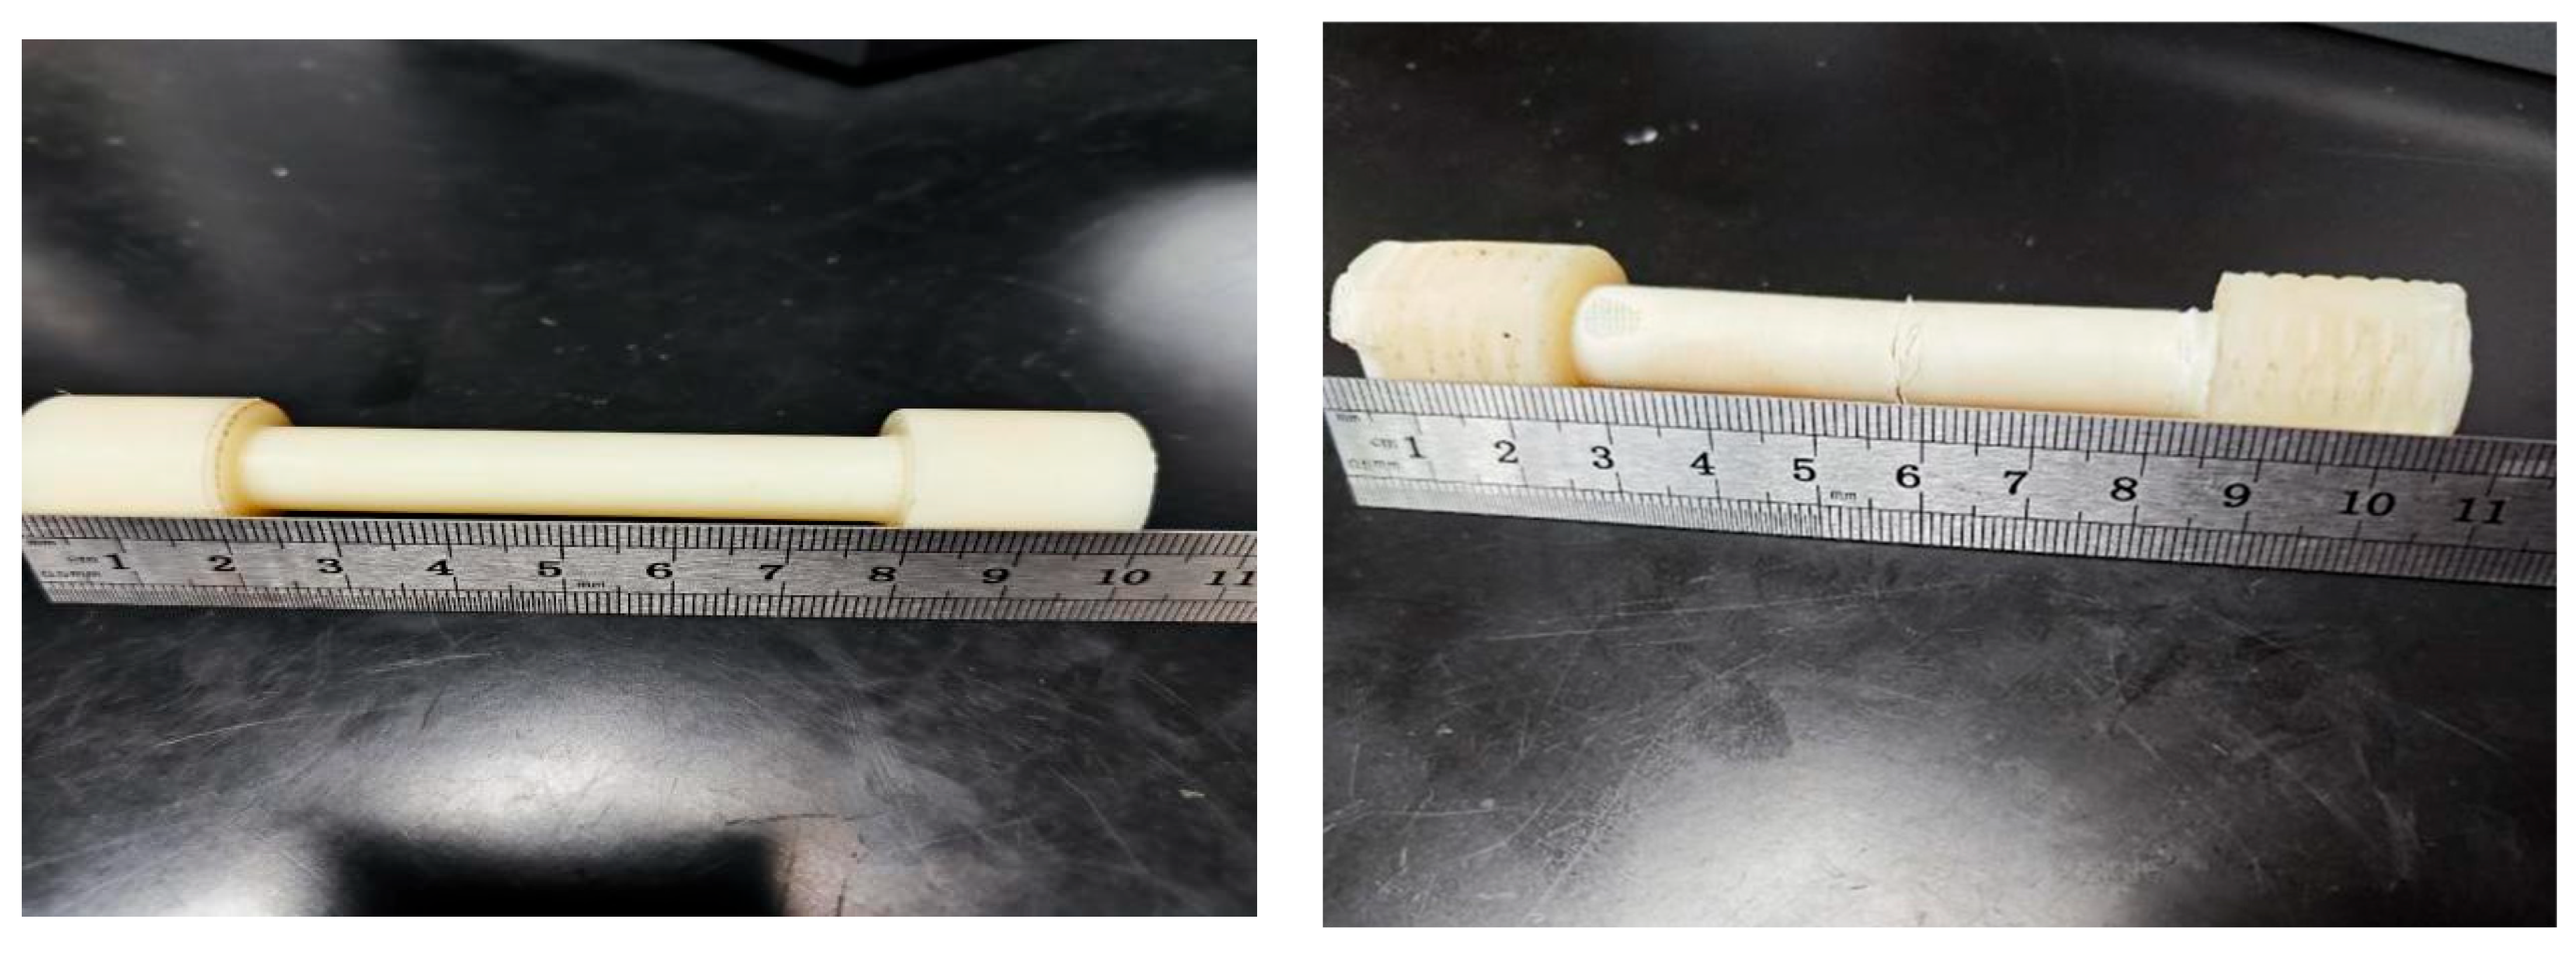
3.1. Material Preparation
3.2. Tensile Testing Setup
3.3. Data Acquisition and Error Analysis
4. Discussion
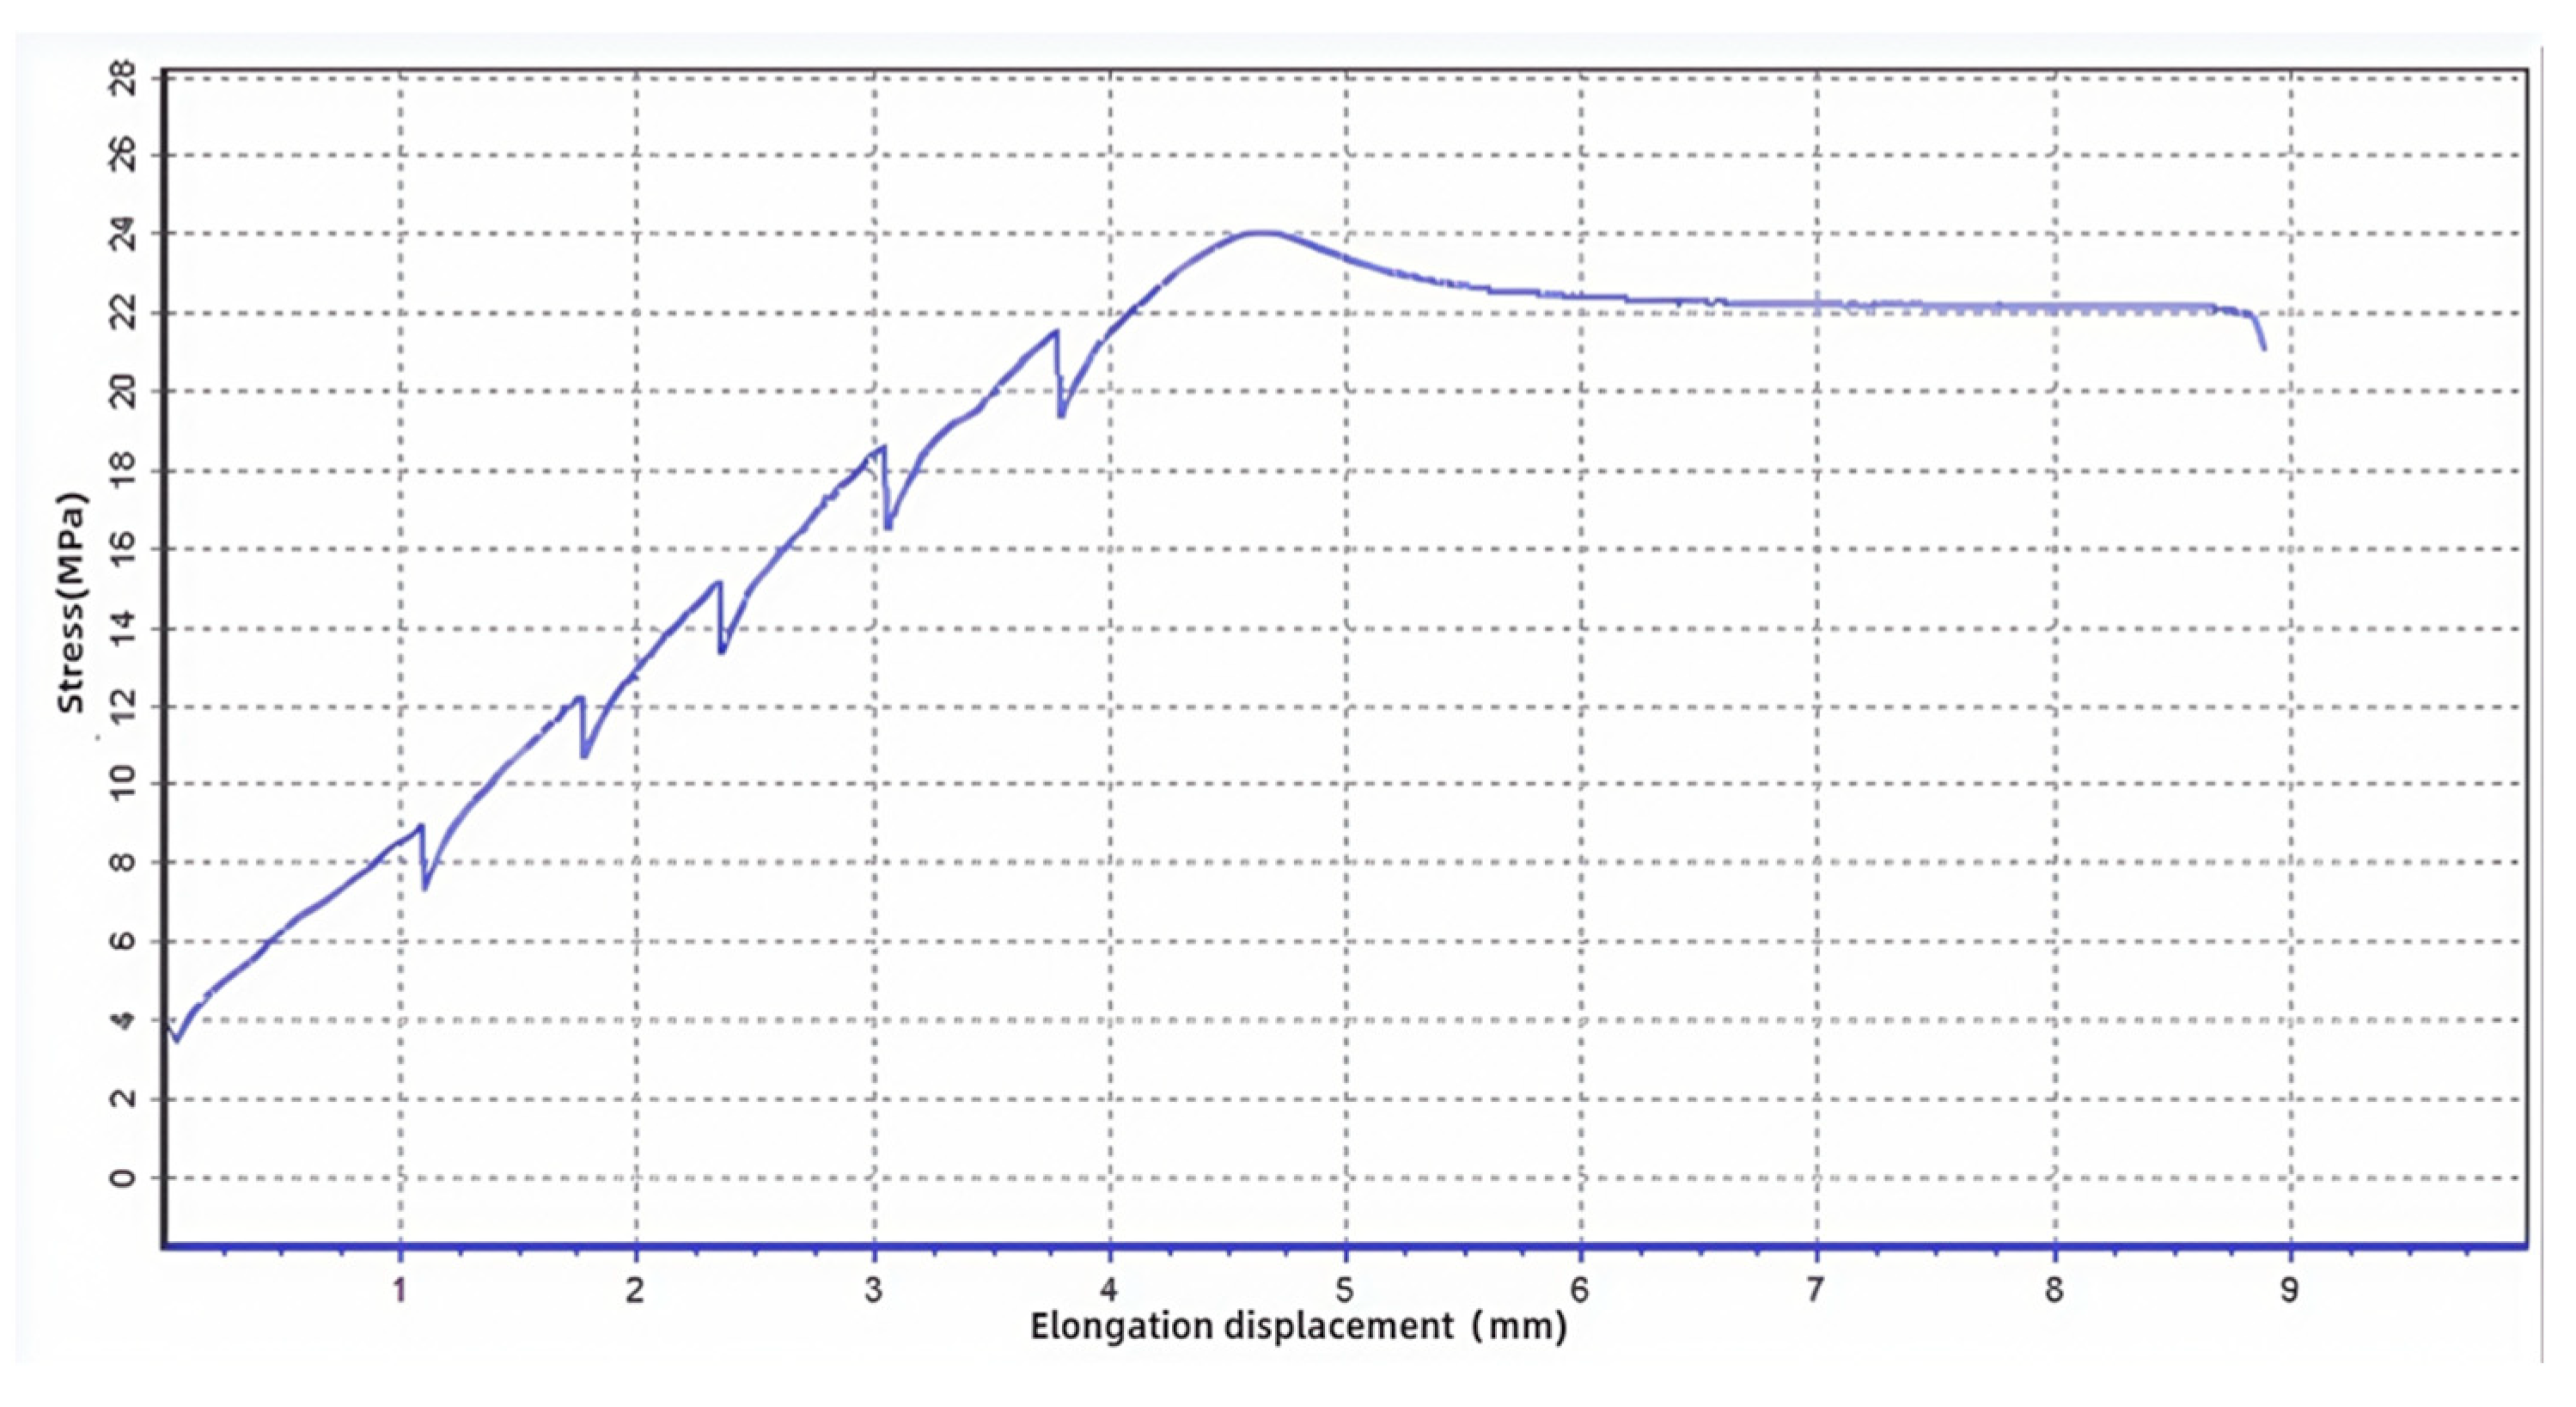
4.1. Classical Mechanistic Properties Analysis
4.2. Mechanistic Analysis of AM-Induced Strength Enhancement
5. Conclusions
Author Contributions
Funding
Institutional Review Board Statement
Data Availability Statement
Conflicts of Interest
References
- Tertuliano, O.A.; DePond, P.J.; Lee, A.C.; Hong, J.; Doan, D.; Capaldi, L.; Brongersma, M.; Gu, X.W.; Matthews, M.J.; Cai, W.; et al. High absorptivity nanotextured powders for AM. Sci. Adv. 2024, 2, eadp0003. [Google Scholar] [CrossRef] [PubMed]
- Zhang, C.; Zhao, C.; Cui, H.; Wang, B.; Luo, C.; Guo, R.; Chen, S.; Gu, W.; Li, W. Molecular Dynamics Study on Thermal Conductivity Properties and Dielectric Behaviors of Graphene-Based Epoxy Resin Nanocomposites. Polymers 2025, 17, 112. [Google Scholar] [CrossRef] [PubMed]
- Zhang, D.; Xu, C.; Zhang, Z.; Wang, L.; Zhou, J.; Li, Y.; Guo, D. Cation escape from hexagonal close-packed lattice for modelling IPMC actuation. Sens. Actuators A Phys. 2025, 383, 116238. [Google Scholar] [CrossRef]
- Vīndedze, E.; Glaskova-Kuzmina, T.; Dejus, D.; Jātnieks, J.; Sevcik, S.; Bute, I.; Sevcenko, J.; Stankevich, S.; Gaidukovs, S. Effects of Printing Orientation on the Tensile, Thermophysical, Smoke Density, and Toxicity Properties of Ultem® 9085. Polymers 2025, 17, 145. [Google Scholar] [CrossRef] [PubMed]
- Fayyaz; Bashmal, S.; Nazir, A.; Khan, S.; Alofi, A. Damping Optimization and Energy Absorption of Mechanical Metamaterials for Enhanced Vibration Control Applications: A Critical Review. Polymers 2025, 17, 237. [Google Scholar] [CrossRef] [PubMed]
- Plamadiala, I.; Croitoru, C.; Pop, M.A.; Roata, I.C. Enhancing Polylactic Acid (PLA) Performance: A Review of Additives in Fused Deposition Modelling (FDM) Filaments. Polymers 2025, 17, 191. [Google Scholar] [CrossRef] [PubMed]
- Pinho, A.C.; Morais, P.V.; Pereira, M.F.; Piedade, A.P. Changes in the Antibacterial Performance of Polymer-Based Nanocomposites Induced by Additive Manufacturing Processing. Polymers 2025, 17, 171. [Google Scholar] [CrossRef] [PubMed]
- Seifert, L.; Leuchtenberger-Engel, L.; Hopmann, C. Development of an Analytical Model for Predicting the Shear Viscosity of Polypropylene Compounds. Polymers 2025, 17, 126. [Google Scholar] [CrossRef] [PubMed]
- Barera, G.; Pegoretti, A. Large-format 3D-printed carbon fiber-reinforced composites in tooling applications. Prog. Addit. Manuf. 2025, 1, 20. [Google Scholar] [CrossRef]
- Lendvai, L.; Jakab, K.S.; Fekete, I.; Rigotti, D.; Pegoretti, A. Effect of filament humidity on the properties of material extrusion 3D-printed acrylonitrile butadiene styrene/hexagonal boron nitride composites. Emergent Mater. 2025, 1, 16. [Google Scholar] [CrossRef]
- Coser, M.; Perin, D.; Fredi, G.; Aliotta, L.; Gigante, V.; Lazzeri, A.; Dorigato, A.; Pegoretti, A. Self-healing of polyamide 6/cyclic olefin copolymer/carbon fiber composites under quasi-static, impact, and fatigue conditions. Compos. Sci. Technol. 2025, 268, 111213. [Google Scholar] [CrossRef]
- Enzo, R.P.D.; Bossio, G.R.; Bruno, M.M. Effect of FDM printing patterns on mechanical properties of ABS. Rapid Prototyp. J. 2023, 29, 2098–2108. [Google Scholar] [CrossRef]
- Rahimipour, S.; Bahri-Laleh, N.; Ehsani, M.; Hedayati-Moghaddam, A.; Mokhtari-Aliabad, J.; Tabatabaei, S.S.; Mirmohammadi, S.A. Preparation and Properties of Enhanced Bio-Based PLA/PA6/Graphene Nanocomposites in the Presence of an Ester–Amide Exchange Catalyst. J. Polym. Environ. 2021, 29, 2302–2309. [Google Scholar] [CrossRef]
- Sharma, S.S.; Singh, I.; Jani, S. Analysis of Temperature Effect for Fused Deposition Modeling-Printed Parts Using Acrylonitrile Butadiene Styrene Material in Additive Manufacturing. J. Mater. Eng. Perform. 2025, 1, 7. [Google Scholar] [CrossRef]
- Rahul, P.; Jani, S.; Ankita, J. Review on multi-objective optimization of FDM process parameters for composite materials. Int. J. Interact. Des. Manuf. 2022, 17, 2115–2125. [Google Scholar] [CrossRef]
- Dhand, A.P.; Davidson, M.D.; Zlotnick, H.M.; Kolibaba, T.J.; Killgore, J.P.; Burdick, J.A. AM of highly entangled polymer networks. Science 2024, 1024, 566–572. [Google Scholar] [CrossRef] [PubMed]
- Gu, D.; Shi, X.; Poprawe, R.; Bourell, D.L.; Setchi, R.; Zhu, J. Material-structure-performance integrated laser-metal AM. Science 2021, 1214, 1487. [Google Scholar] [CrossRef] [PubMed]
- Berman, A.; Hsiao, K.; Root, S.E.; Choi, H.; Ilyn, D.; Xu, C.; Stein, E.; Cutkosky, M.; DeSimone, J.M.; Bao, Z. Additively manufactured micro-lattice dielectrics for multiaxial capacitive sensors. Sci. Adv. 2024, 2, 8866. [Google Scholar] [CrossRef] [PubMed]
- Mayer, F.; Richter, S.; Westhauser, J.; Blasco, E.; Barner-Kowollik, C.; Wegener, M. Multimaterial 3D laser microprinting using an integrated microfluidic system. Sci. Adv. 2019, 2, 9160. [Google Scholar] [CrossRef] [PubMed]
- Yao, Y.; Shapiro, M.G. Using ultrasound to 3D-print materials. Science 2023, 2, 1126. [Google Scholar] [CrossRef] [PubMed]
- Xie, R.; Shi, Y.; Liu, H.; Chen, S. A novel friction and rolling based solid-state AM method: Microstructure and mechanical properties evaluation. Mater. Today Commun. 2021, 4, 103005. [Google Scholar] [CrossRef]
- Wu, W.; Xue, J.; Wang, L.; Zhang, Z.H.; Hu, Y.; Dong, C.W. Forming process, microstructure, and mechanical properties of thin-walled 316L stainless steel using speed-cold-welding AM. Metals 2019, 3, 109. [Google Scholar] [CrossRef]
- Zhang, X.Y.; Fang, G.; Leeflang, S.; Zhou, J. Effect of subtransus heat treatment on the microstructure and mechanical properties of additively manufactured Ti-6Al-4V alloy. J. Alloys Compd. 2018, 4, 1562–1575. [Google Scholar] [CrossRef]
- Yang, Y.Q.; Jiang, R.W.; Han, C.J.; Chen, J.Q.; Li, H.R.; Wang, Y.; Tang, J.R.; Zhou, H.; Hu, W.N.; Zheng, B.Y.; et al. Frontiers in Laser Additive Manufacturing Technology. Addit. Manuf. Front. 2024, 746, 200160. [Google Scholar] [CrossRef]
- Ogi, K.; Nishikawa, T.; Okano, Y.; Taketa, I. Mechanical properties of ABS resin reinforced with recycled CFRP. Adv. Compos. Mater. 2007, 4, 181–194. [Google Scholar] [CrossRef]
- Parpala, R.C.; Popescu, D.; Pupaza, C. Infill parameters influence over the natural frequencies of ABS specimens obtained by extrusion-based 3D printing. Rapid Prototyp. J. 2021, 7, 1273–1285. [Google Scholar] [CrossRef]
- Qi, X.; Shen, X. Multidisciplinary design optimization of turbine disks based on ANSYS workbench platforms. Procedia Eng. 2015, 1279, 1275–1283. [Google Scholar] [CrossRef]
- Saritha, G.; Iswarya, T.; Keerthana, D.; Baig, D.T. Micro universal testing machine system for material property measurement. Mater. Today Proc. 2023, 21, 329. [Google Scholar] [CrossRef]
- Peleg, M. Texture profile analysis parameters obtained by an Instron universal testing machine. J. Food Sci. 1976, 2, 721–722. [Google Scholar] [CrossRef]
- GB/T 228; Metallic Materials—Tensile Testing—Part 1: Method of Test at Room Temperature. Standardization Administration of the People's Republic of China: Beijing, China, 2021.
- ISO 6892-1; Metallic Materials—Tensile Testing—Part 1: Method of Test at Room Temperature. International Organization for Standardization: Geneva, Switzerland, 2016.
- Miled, K.; Roy, R.L.; Sab, K.; Boulay, C. Compressive behavior of an idealized EPS lightweight concrete: Size effects and failure mode. Mech. Mater. 2004, 5, 1031–1046. [Google Scholar] [CrossRef]
- ISO 16269-6; Statistical Interpretation of Data—Part 6: Determination of Statistical Tolerance Intervals. International Organization for Standardization: Geneva, Switzerland, 2005.


| Sequence | Time (s) | Equivalent Stress (MPa) | Deformation (mm) |
|---|---|---|---|
| 1 | 0 | 0 | 0 |
| 2 | 0.032 | 19.221 | 0.470 |
| 3 | 0.053 | 32.330 | 0.750 |
| 4 | 0.073 | 41.286 | 1.095 |
| 5 | 0.105 | 52.664 | 1.578 |
| 6 | 0.88 | 50.000 | 13.297 |
| 7 | 1 | 50.000 | 15.000 |
| average value | 0.306 | 35.072 | 4.599 |
| mean absolute deviation | 0.362 | 15.333 | 5.457 |
| standard deviation | 0.436 | 19.503 | 6.560 |
| relative standard deviation | 142.24% | 55.62% | 142.68% |
| average value | 0.306 | 35.072 | 4.599 |
| Material Type | Non-Proportional Elongation (%) | Elongation at Break (%) | Application Scenarios |
|---|---|---|---|
| General-Purpose ABS | 5~25 | 10~40 | Electronic casings, toys |
| High-Toughness ABS | 20~50 | 30~80 | Automotive parts, sports equipment |
| Glass-Fiber-Reinforced ABS | 1~10 | 2~15 | Structural components (requiring high strength) |
Disclaimer/Publisher’s Note: The statements, opinions and data contained in all publications are solely those of the individual author(s) and contributor(s) and not of MDPI and/or the editor(s). MDPI and/or the editor(s) disclaim responsibility for any injury to people or property resulting from any ideas, methods, instructions or products referred to in the content. |
© 2025 by the authors. Licensee MDPI, Basel, Switzerland. This article is an open access article distributed under the terms and conditions of the Creative Commons Attribution (CC BY) license (https://creativecommons.org/licenses/by/4.0/).
Share and Cite
Li, Y.; Zhu, P.; Zhang, D. Experimental and Numerical Investigation of the Mechanical Properties of ABS Parts Fabricated via Fused Deposition Modeling. Polymers 2025, 17, 1957. https://doi.org/10.3390/polym17141957
Li Y, Zhu P, Zhang D. Experimental and Numerical Investigation of the Mechanical Properties of ABS Parts Fabricated via Fused Deposition Modeling. Polymers. 2025; 17(14):1957. https://doi.org/10.3390/polym17141957
Chicago/Turabian StyleLi, Yanqin, Peihua Zhu, and Dehai Zhang. 2025. "Experimental and Numerical Investigation of the Mechanical Properties of ABS Parts Fabricated via Fused Deposition Modeling" Polymers 17, no. 14: 1957. https://doi.org/10.3390/polym17141957
APA StyleLi, Y., Zhu, P., & Zhang, D. (2025). Experimental and Numerical Investigation of the Mechanical Properties of ABS Parts Fabricated via Fused Deposition Modeling. Polymers, 17(14), 1957. https://doi.org/10.3390/polym17141957