


Effects of Process Parameters on Tensile Properties of 3D-Printed PLA Parts Fabricated with the FDM Method


Abstract
1. Introduction
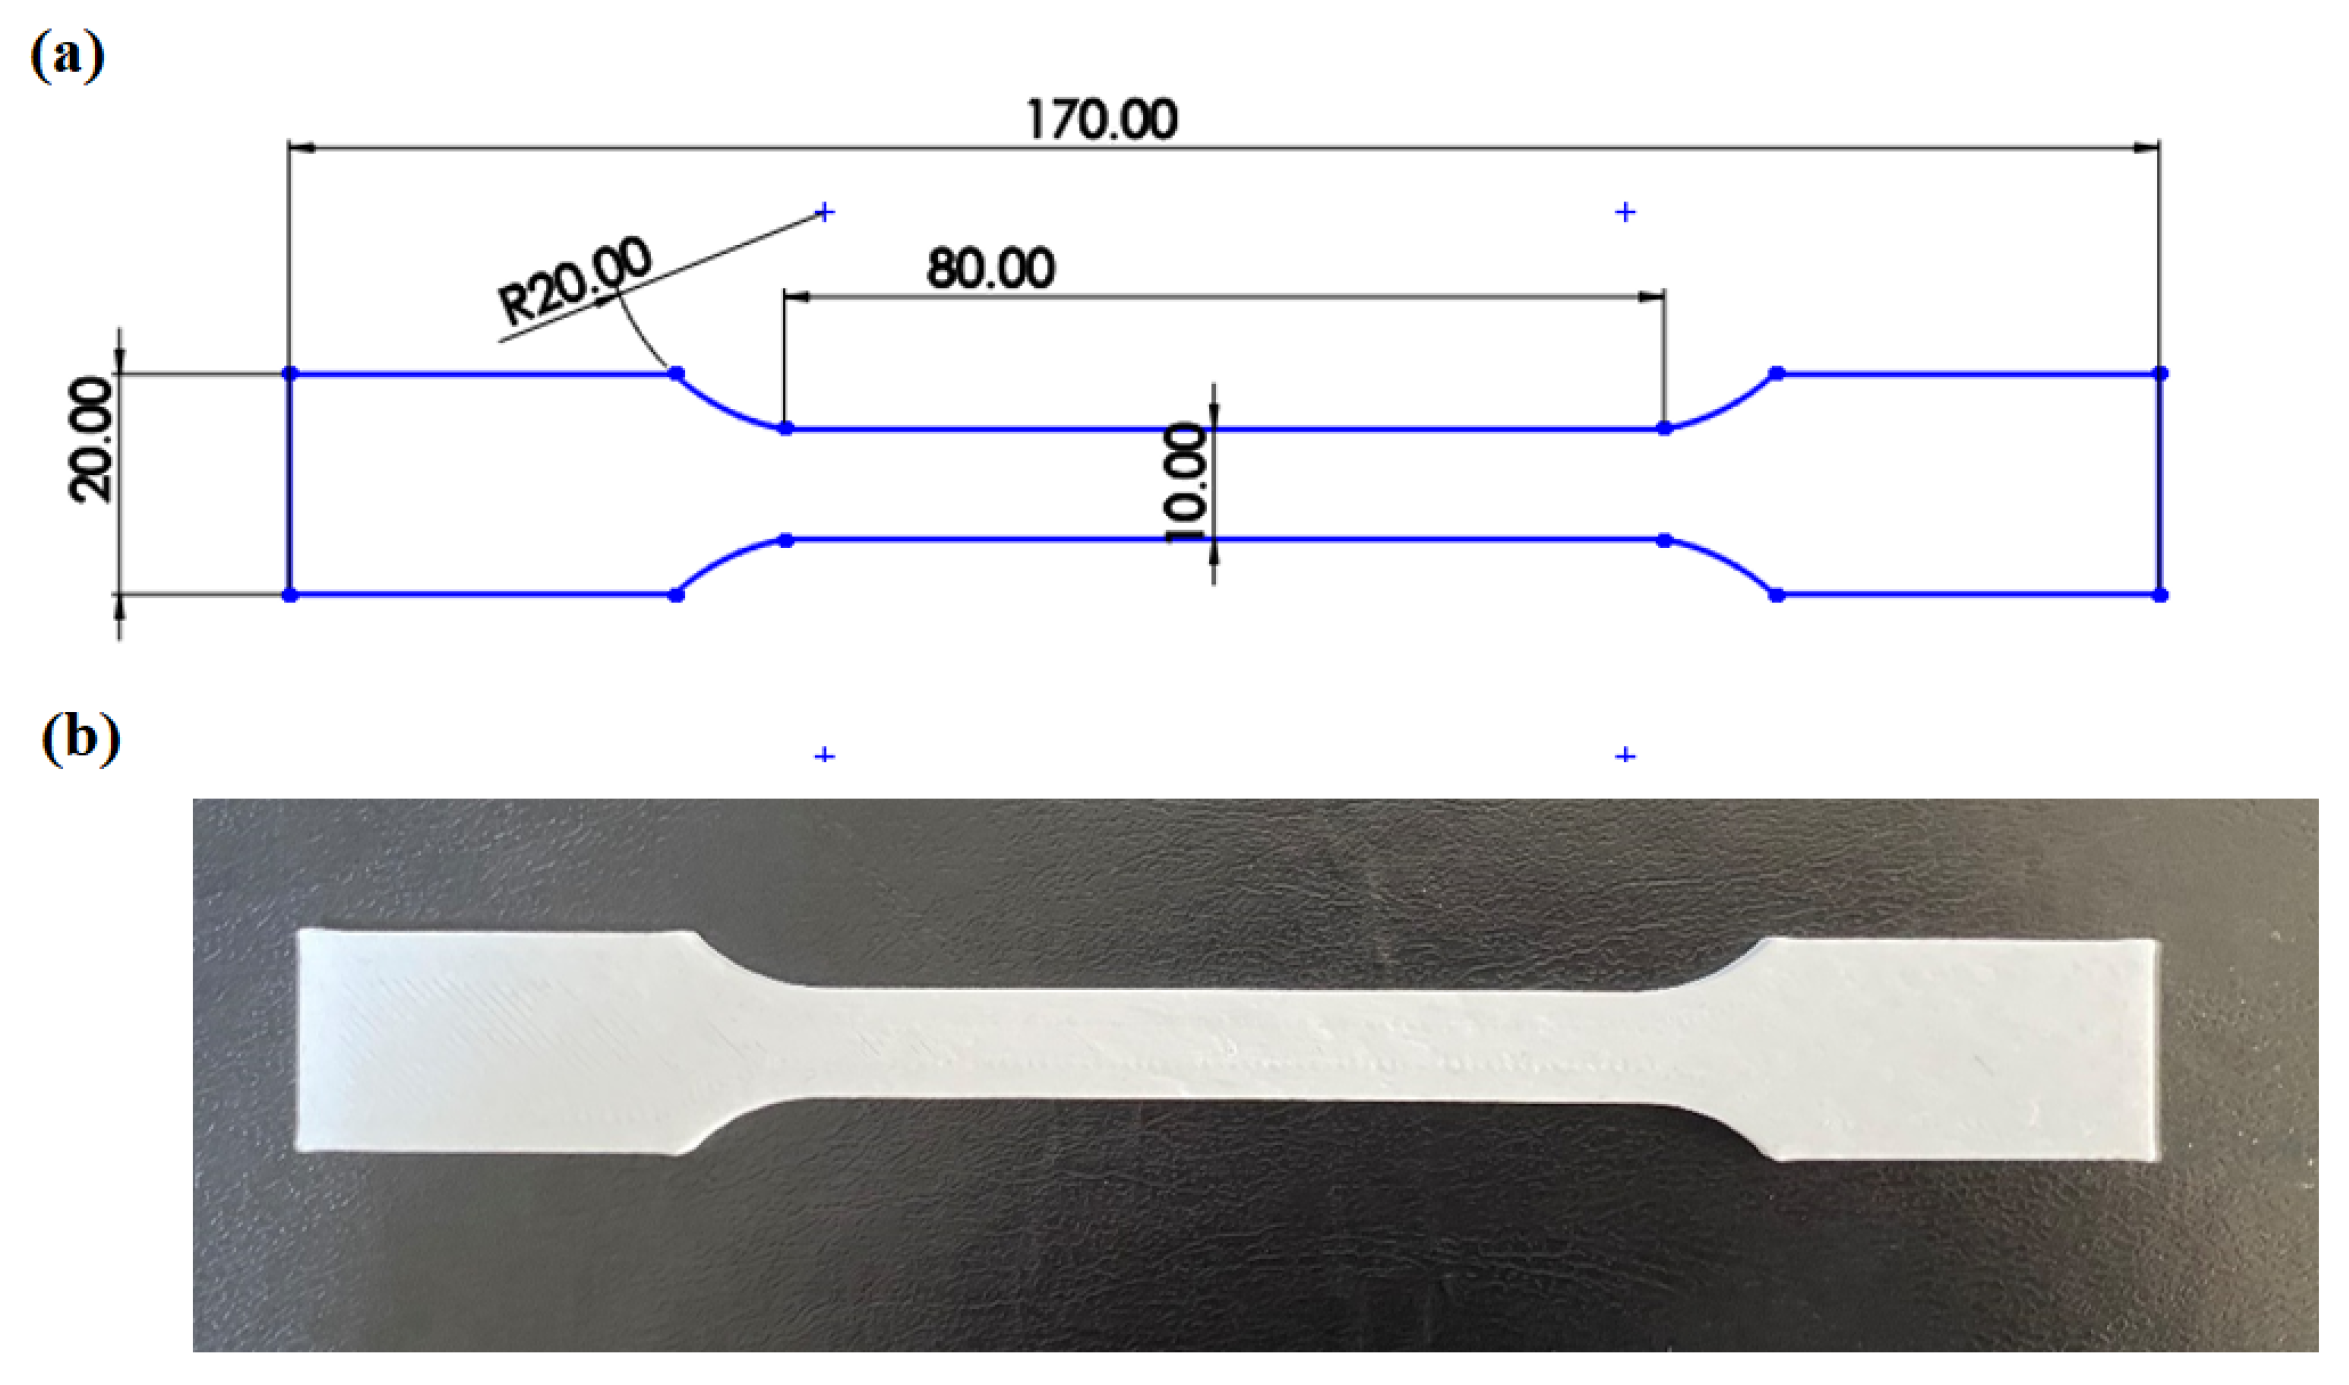
2. Materials and Methods
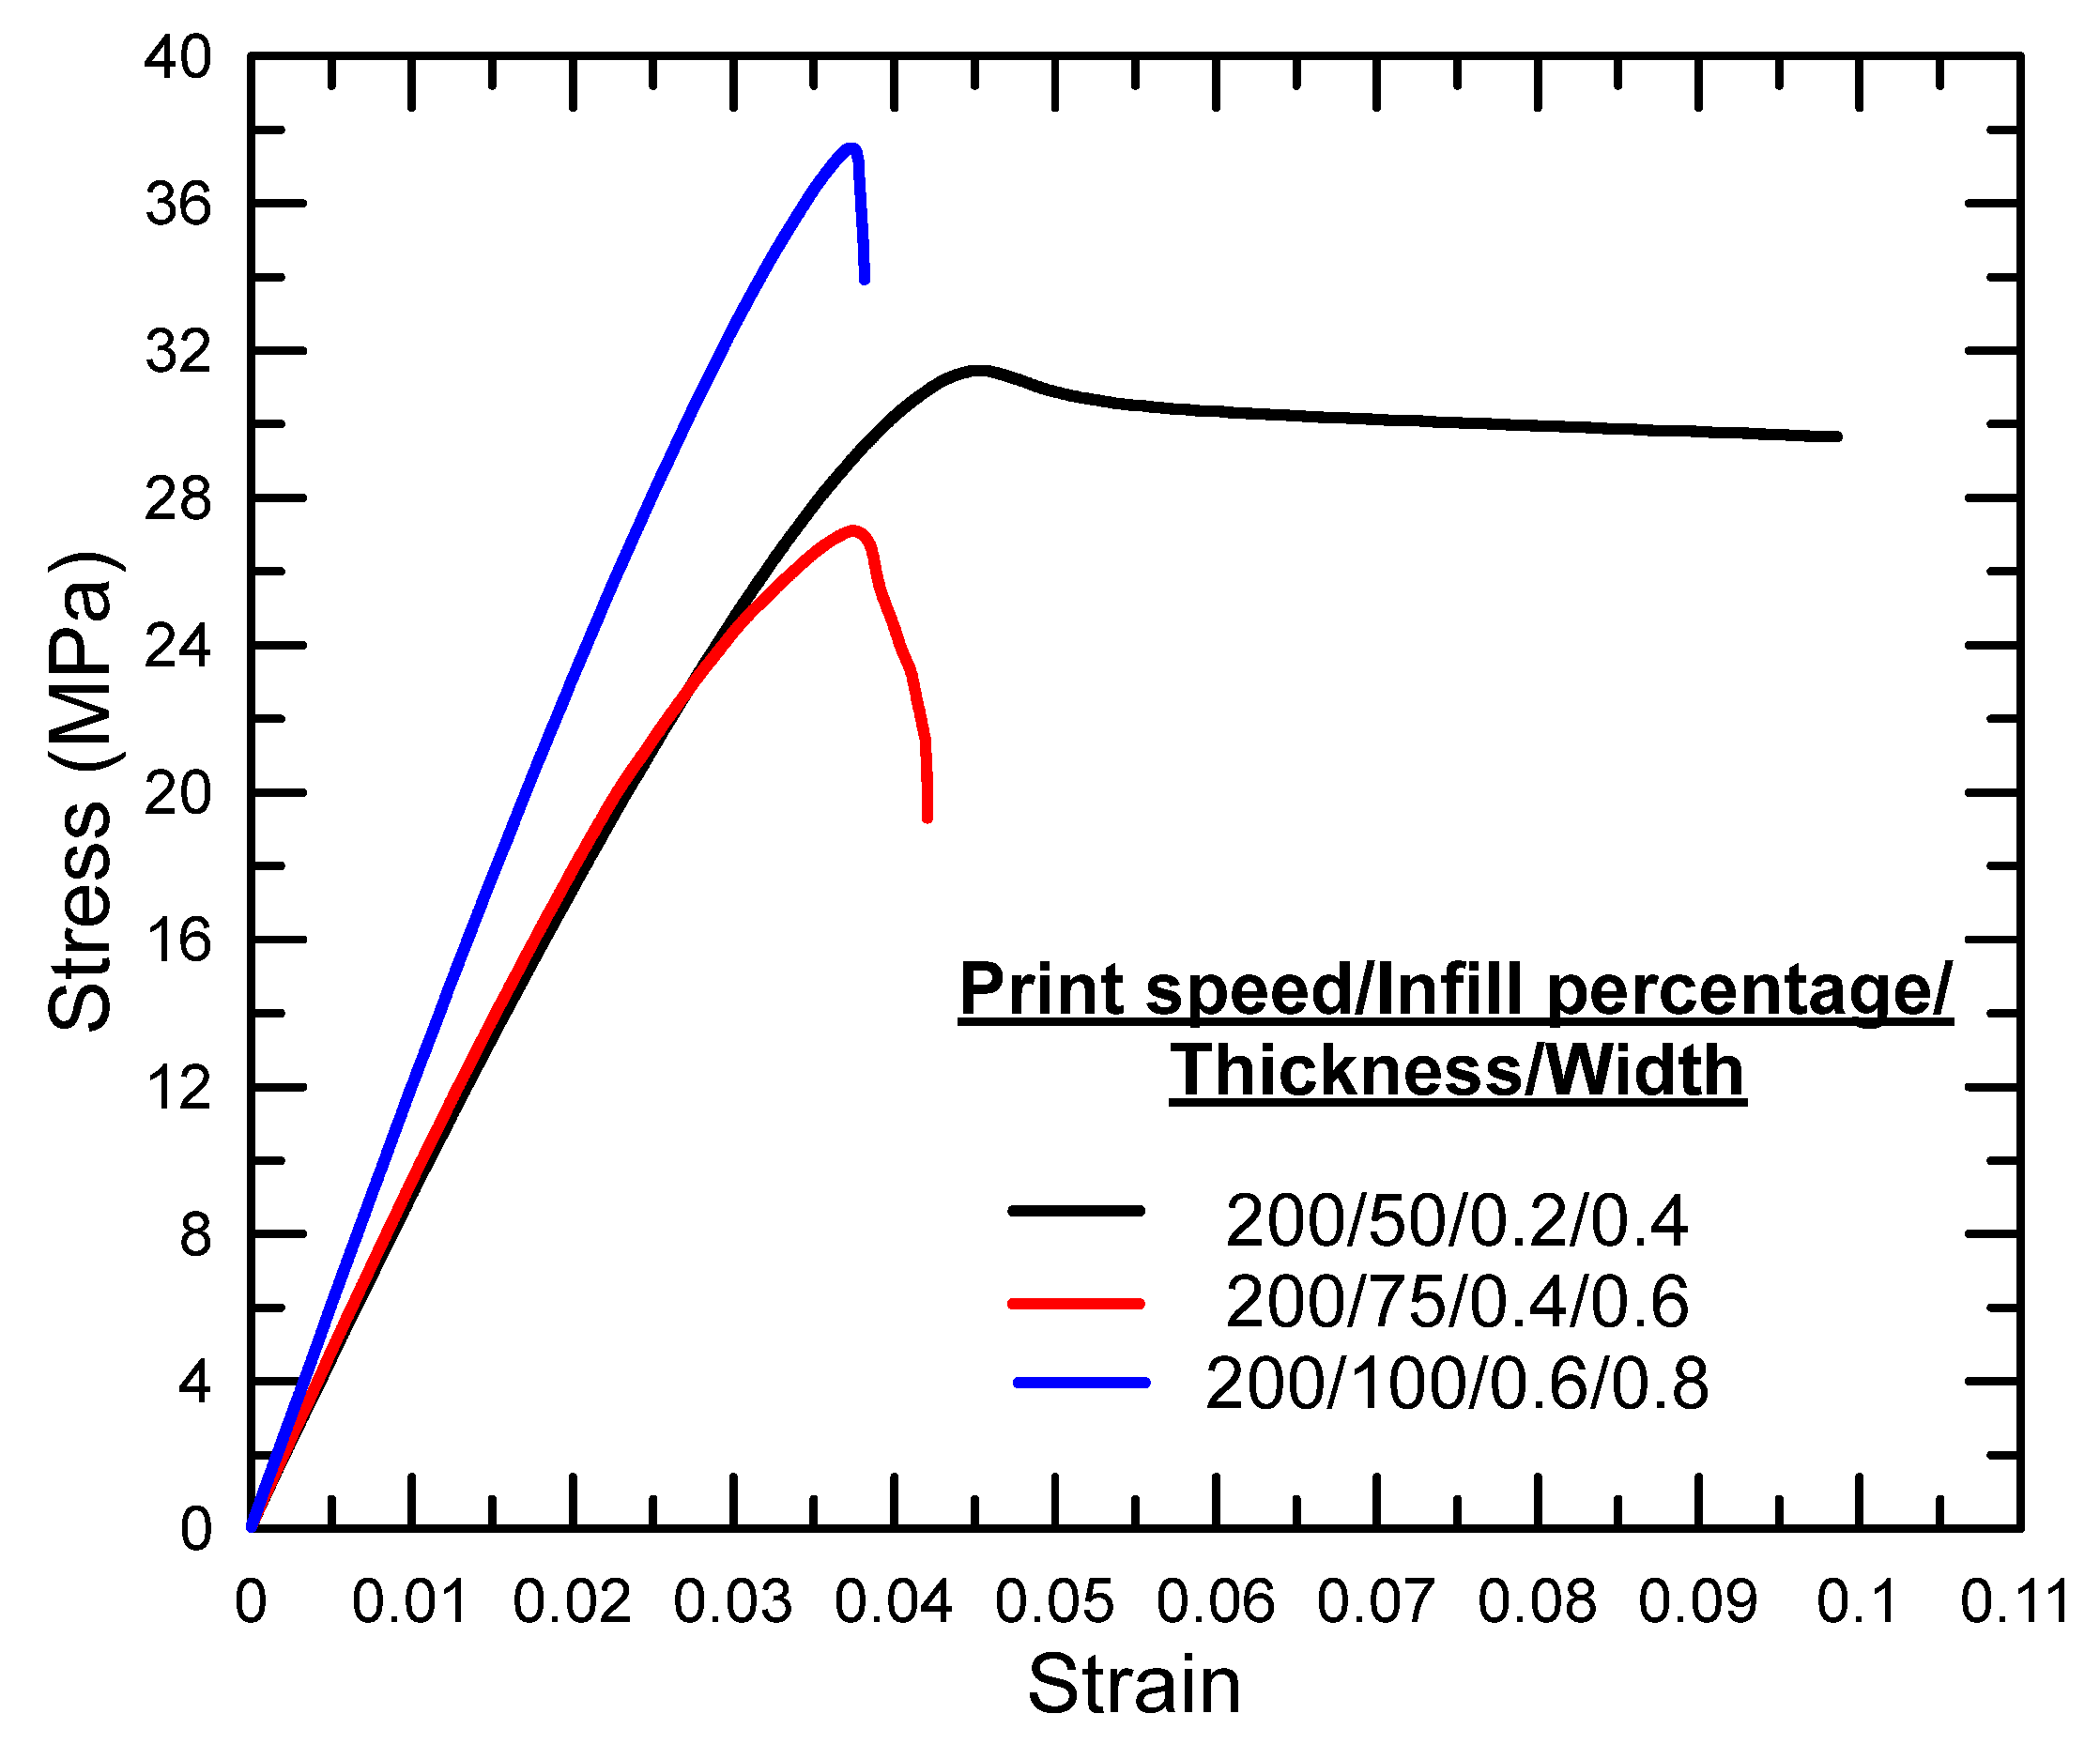
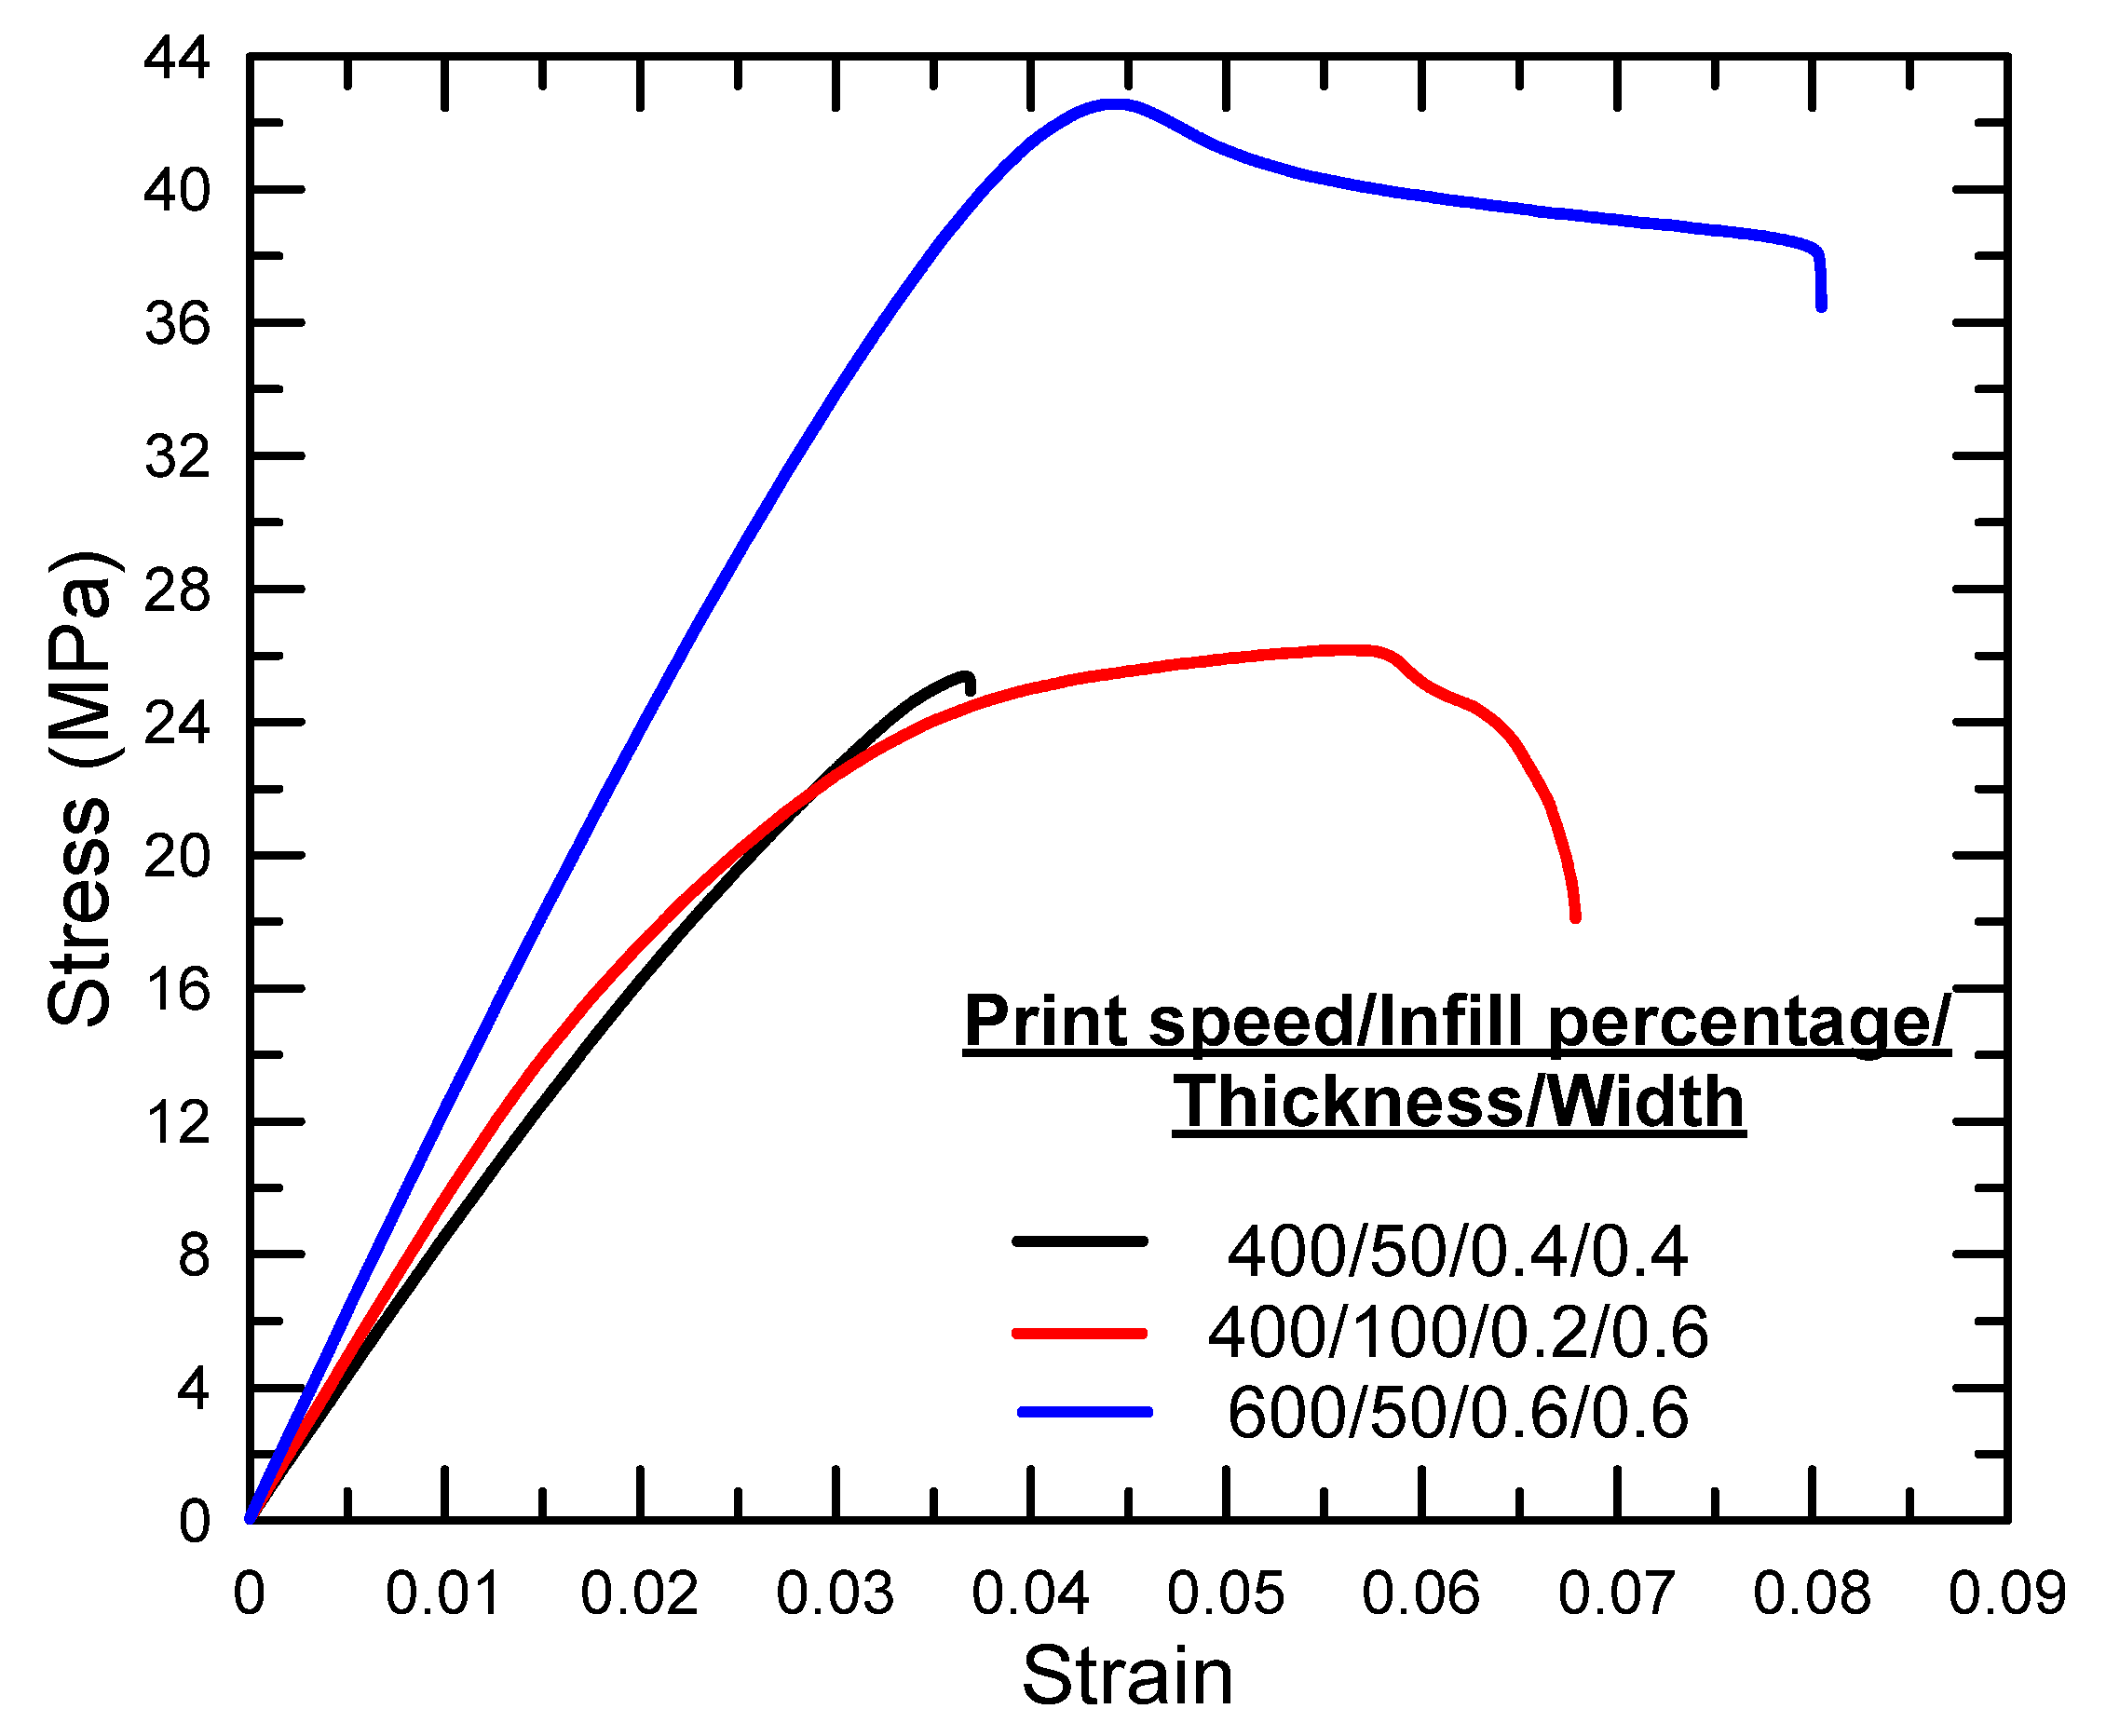
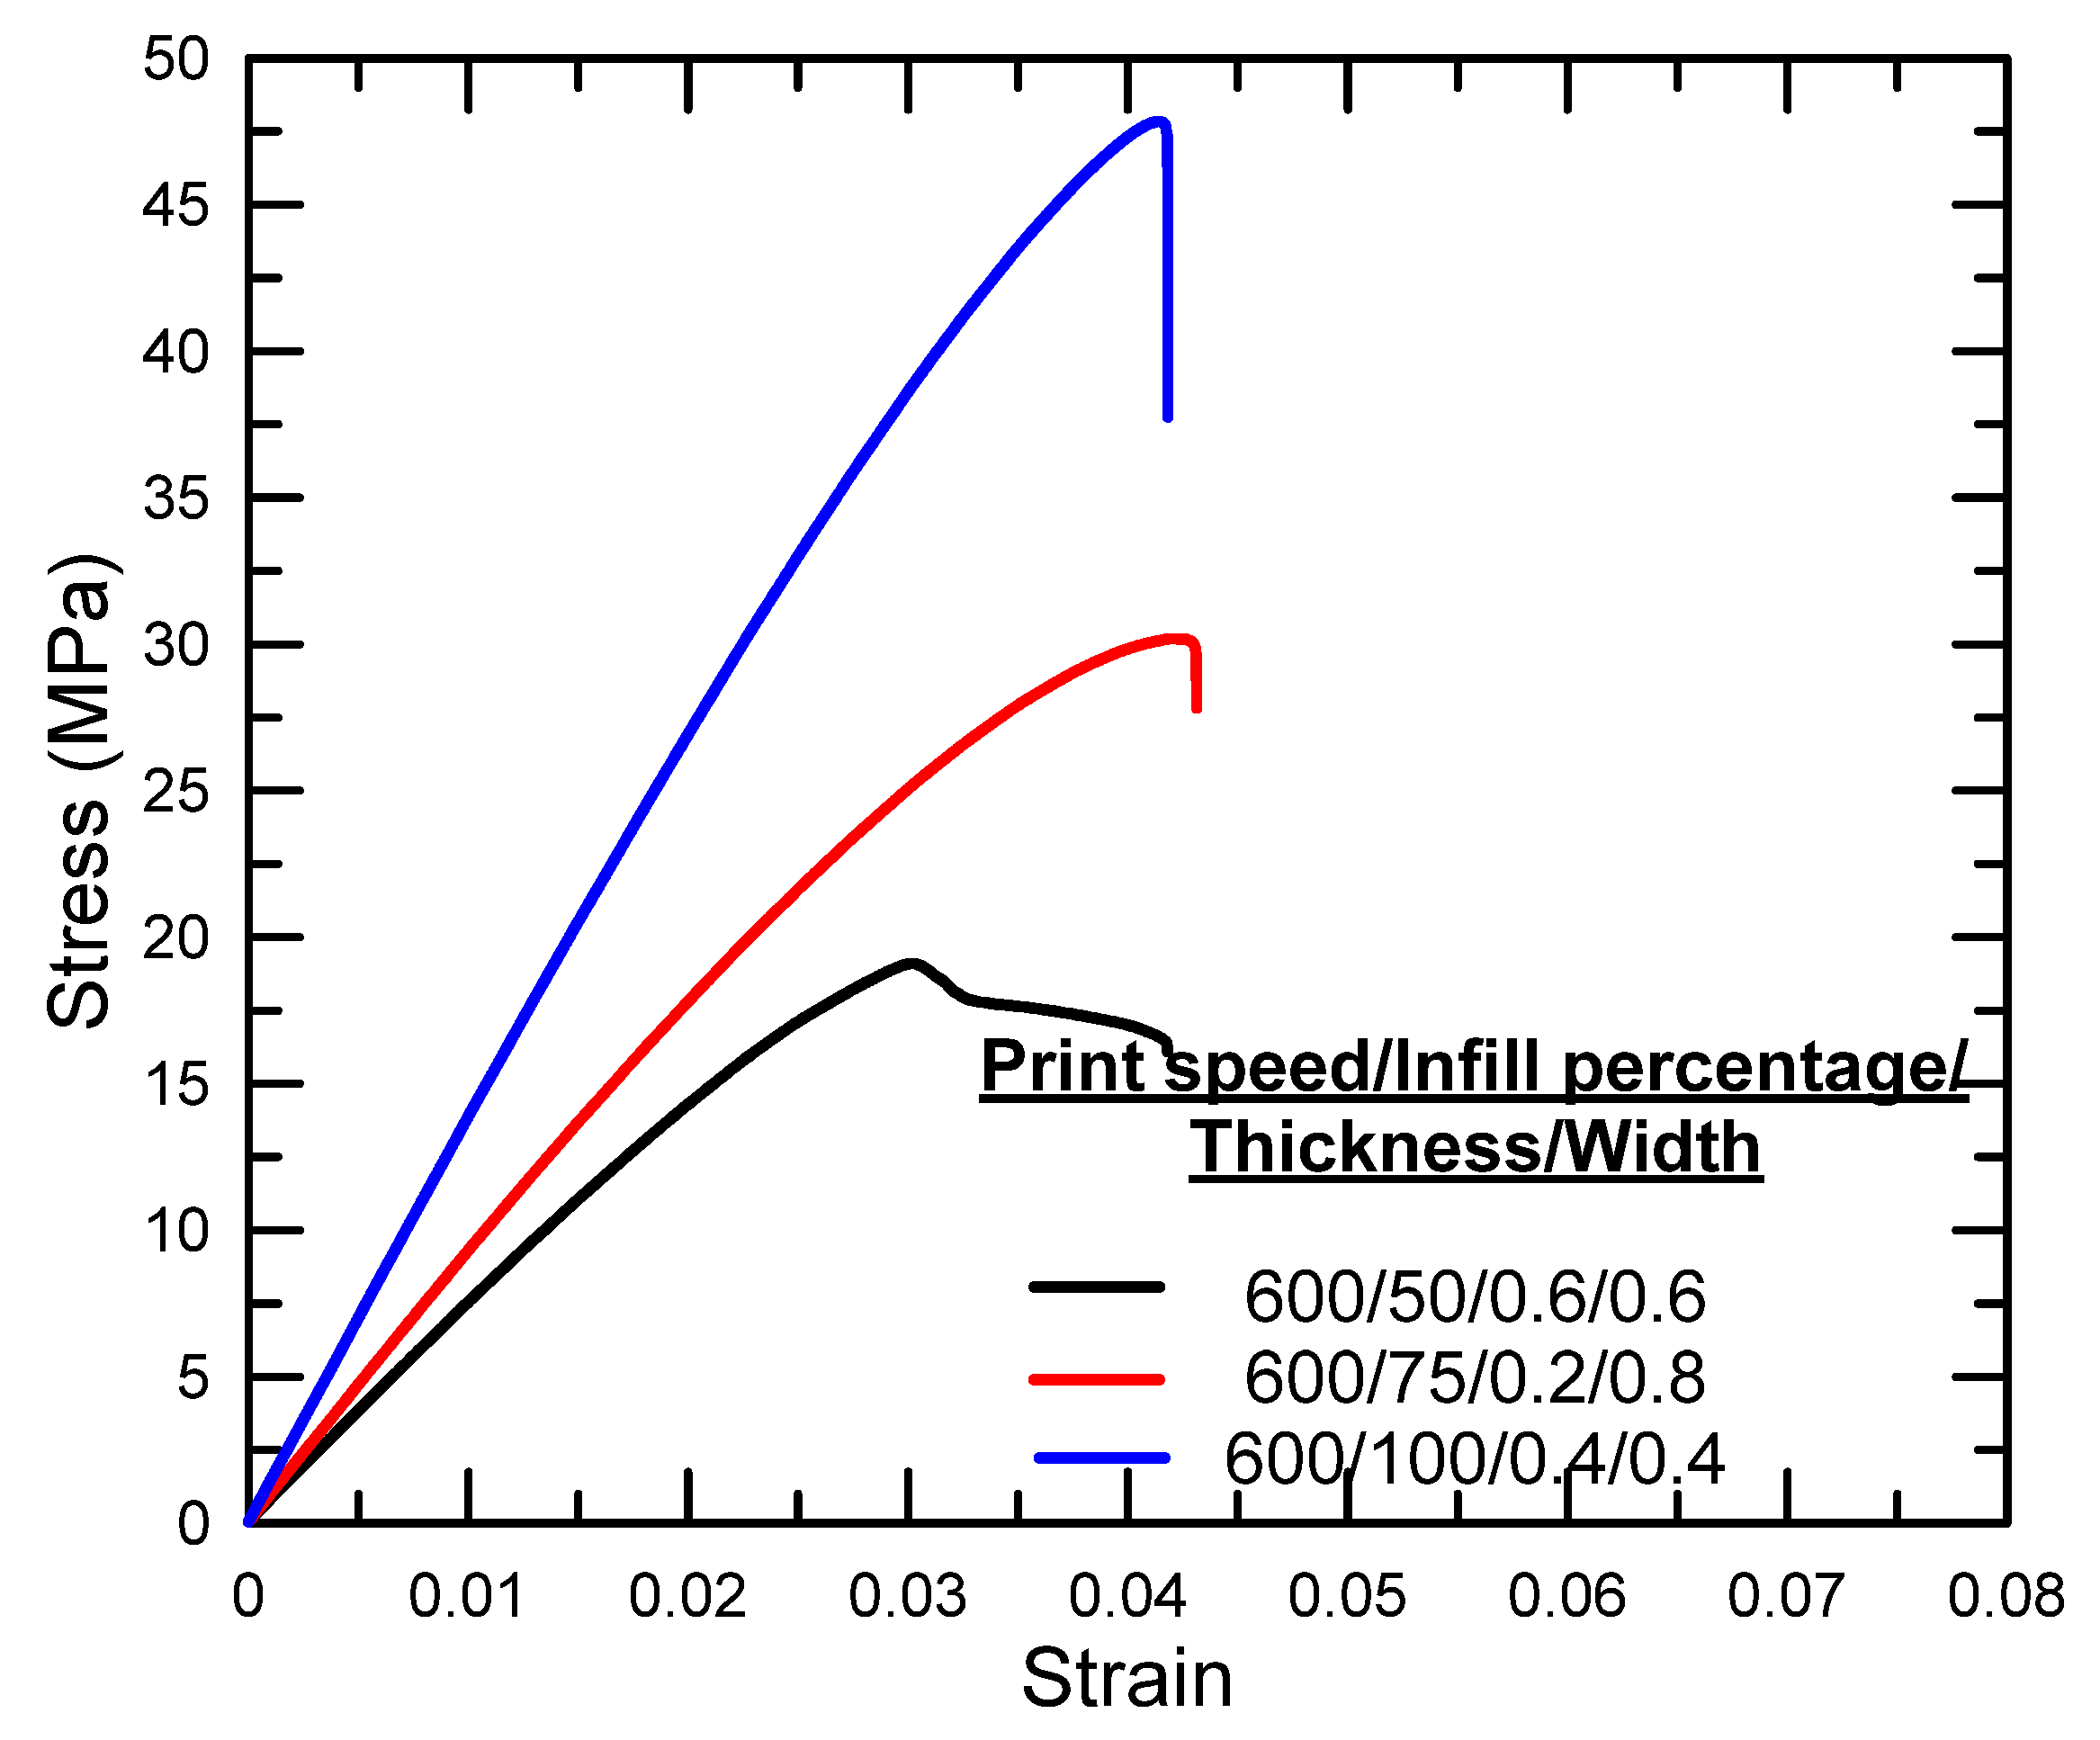
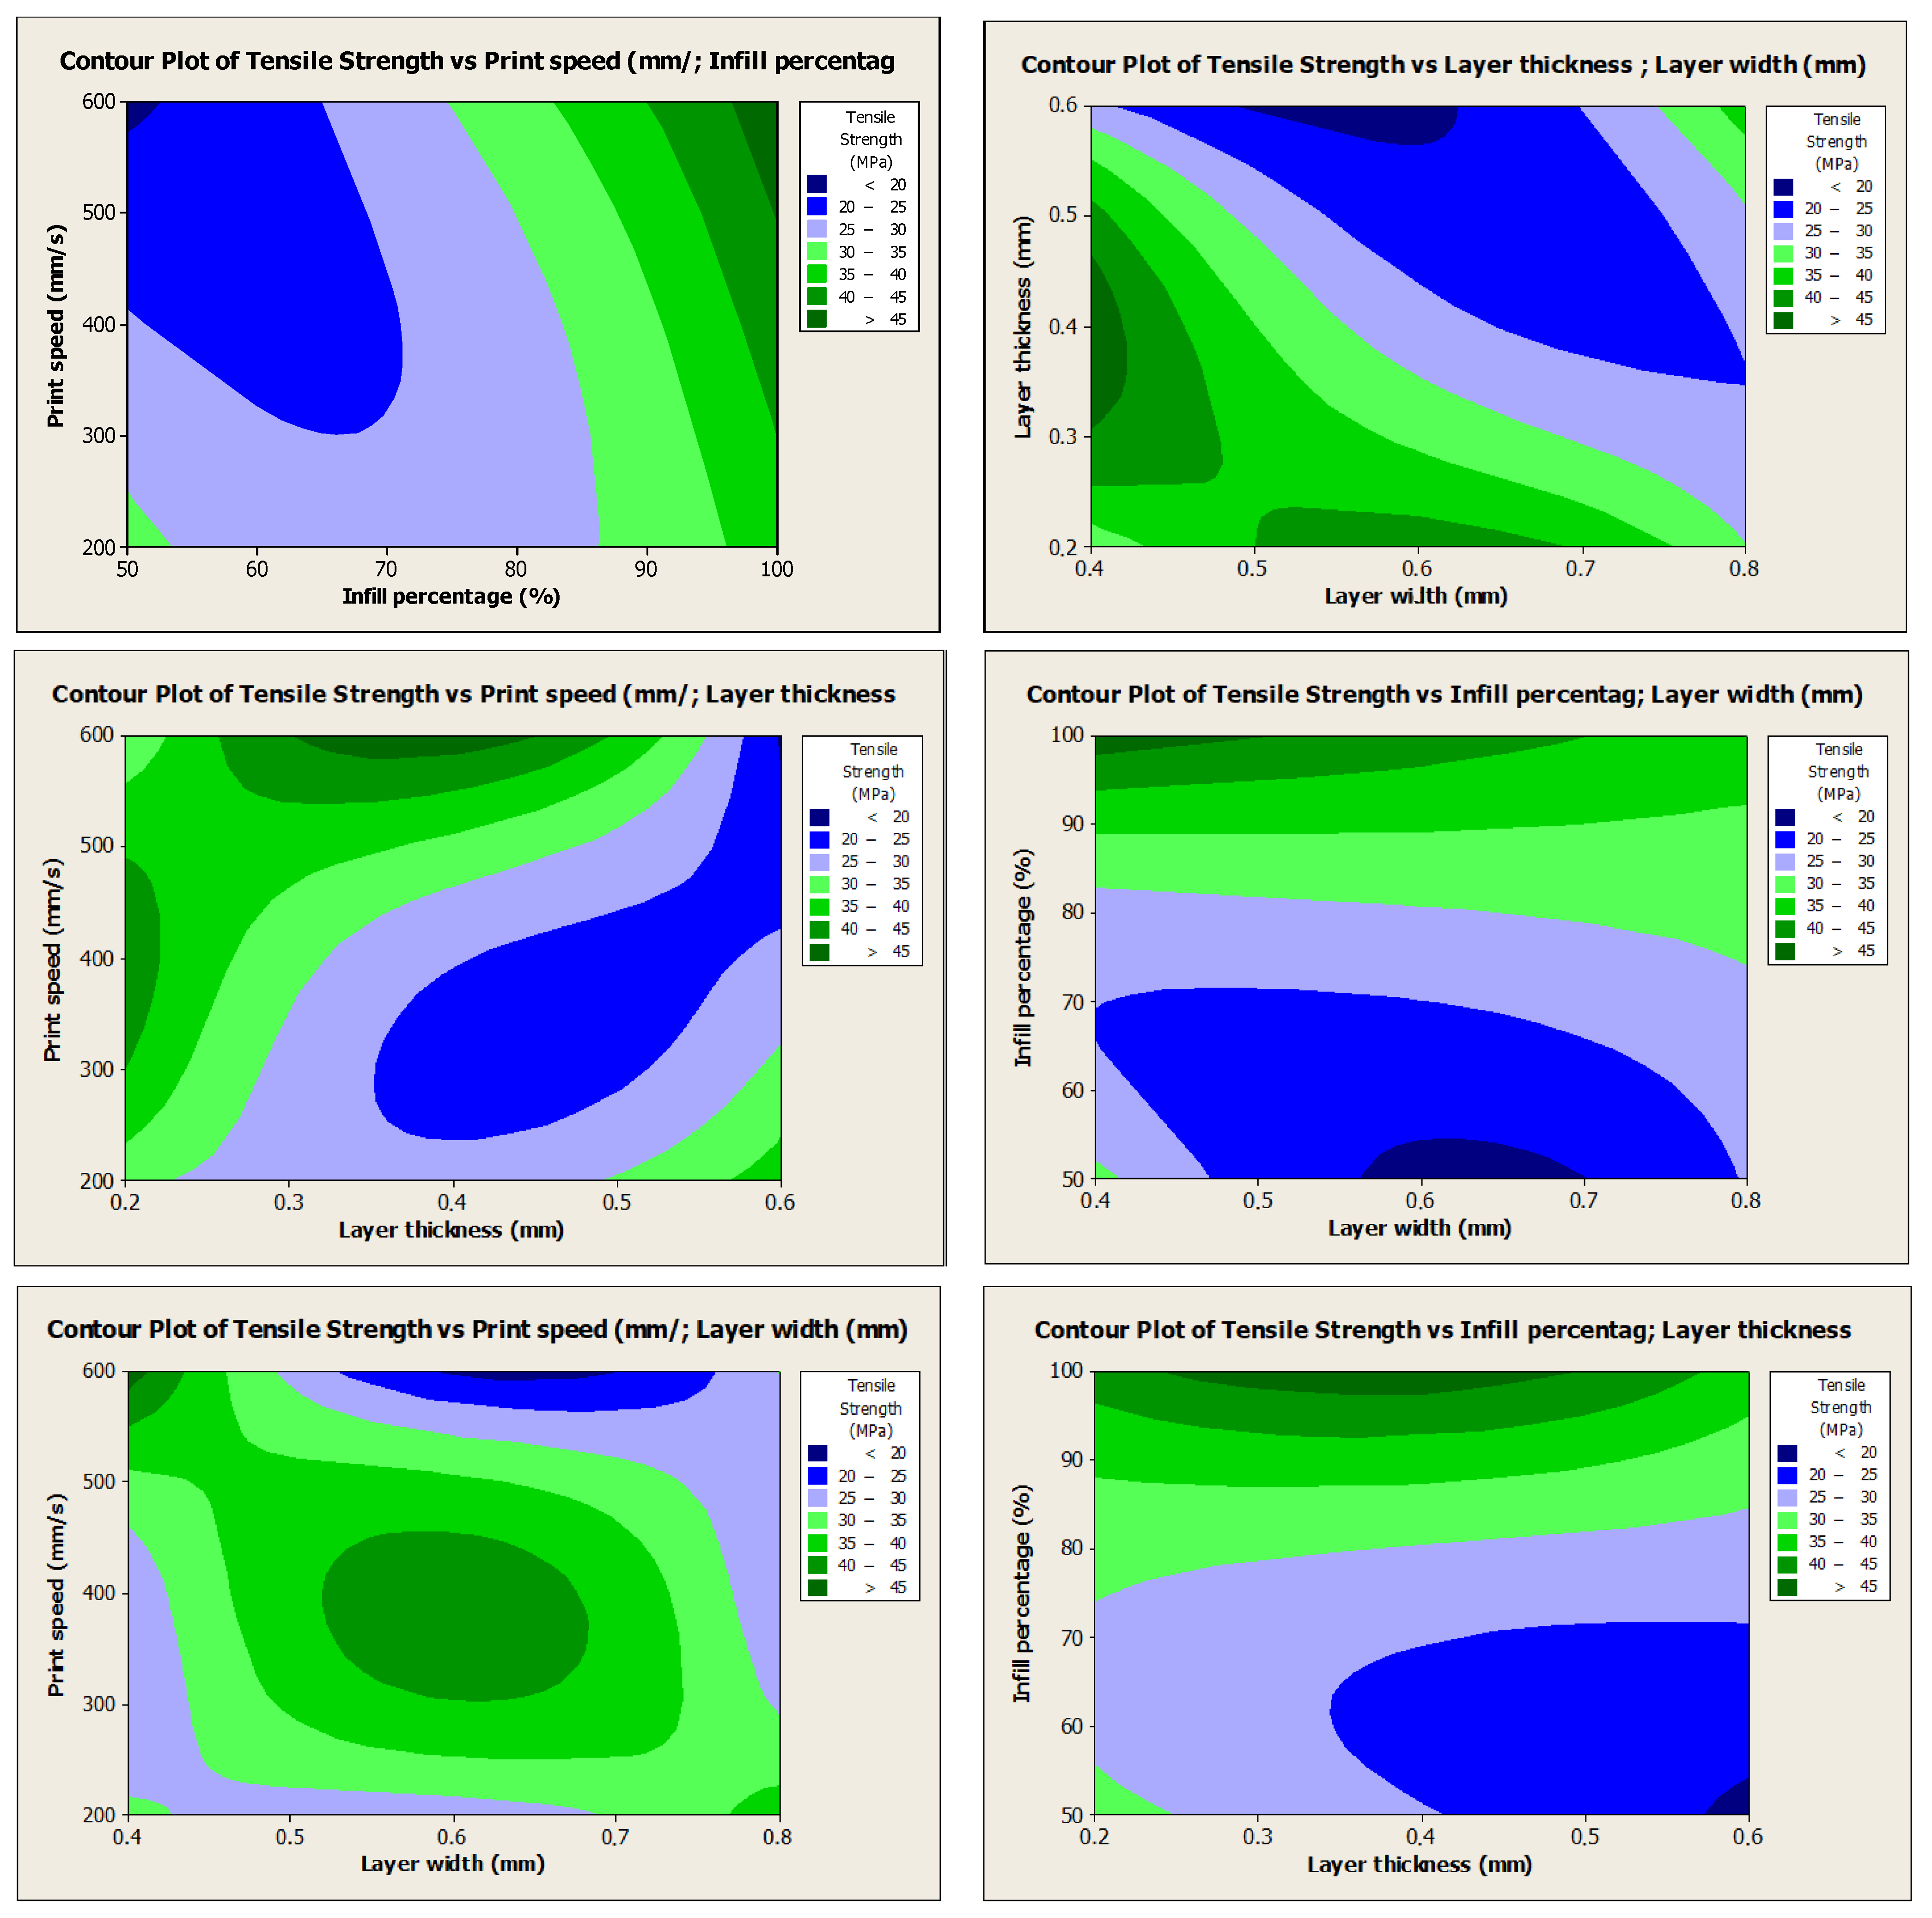
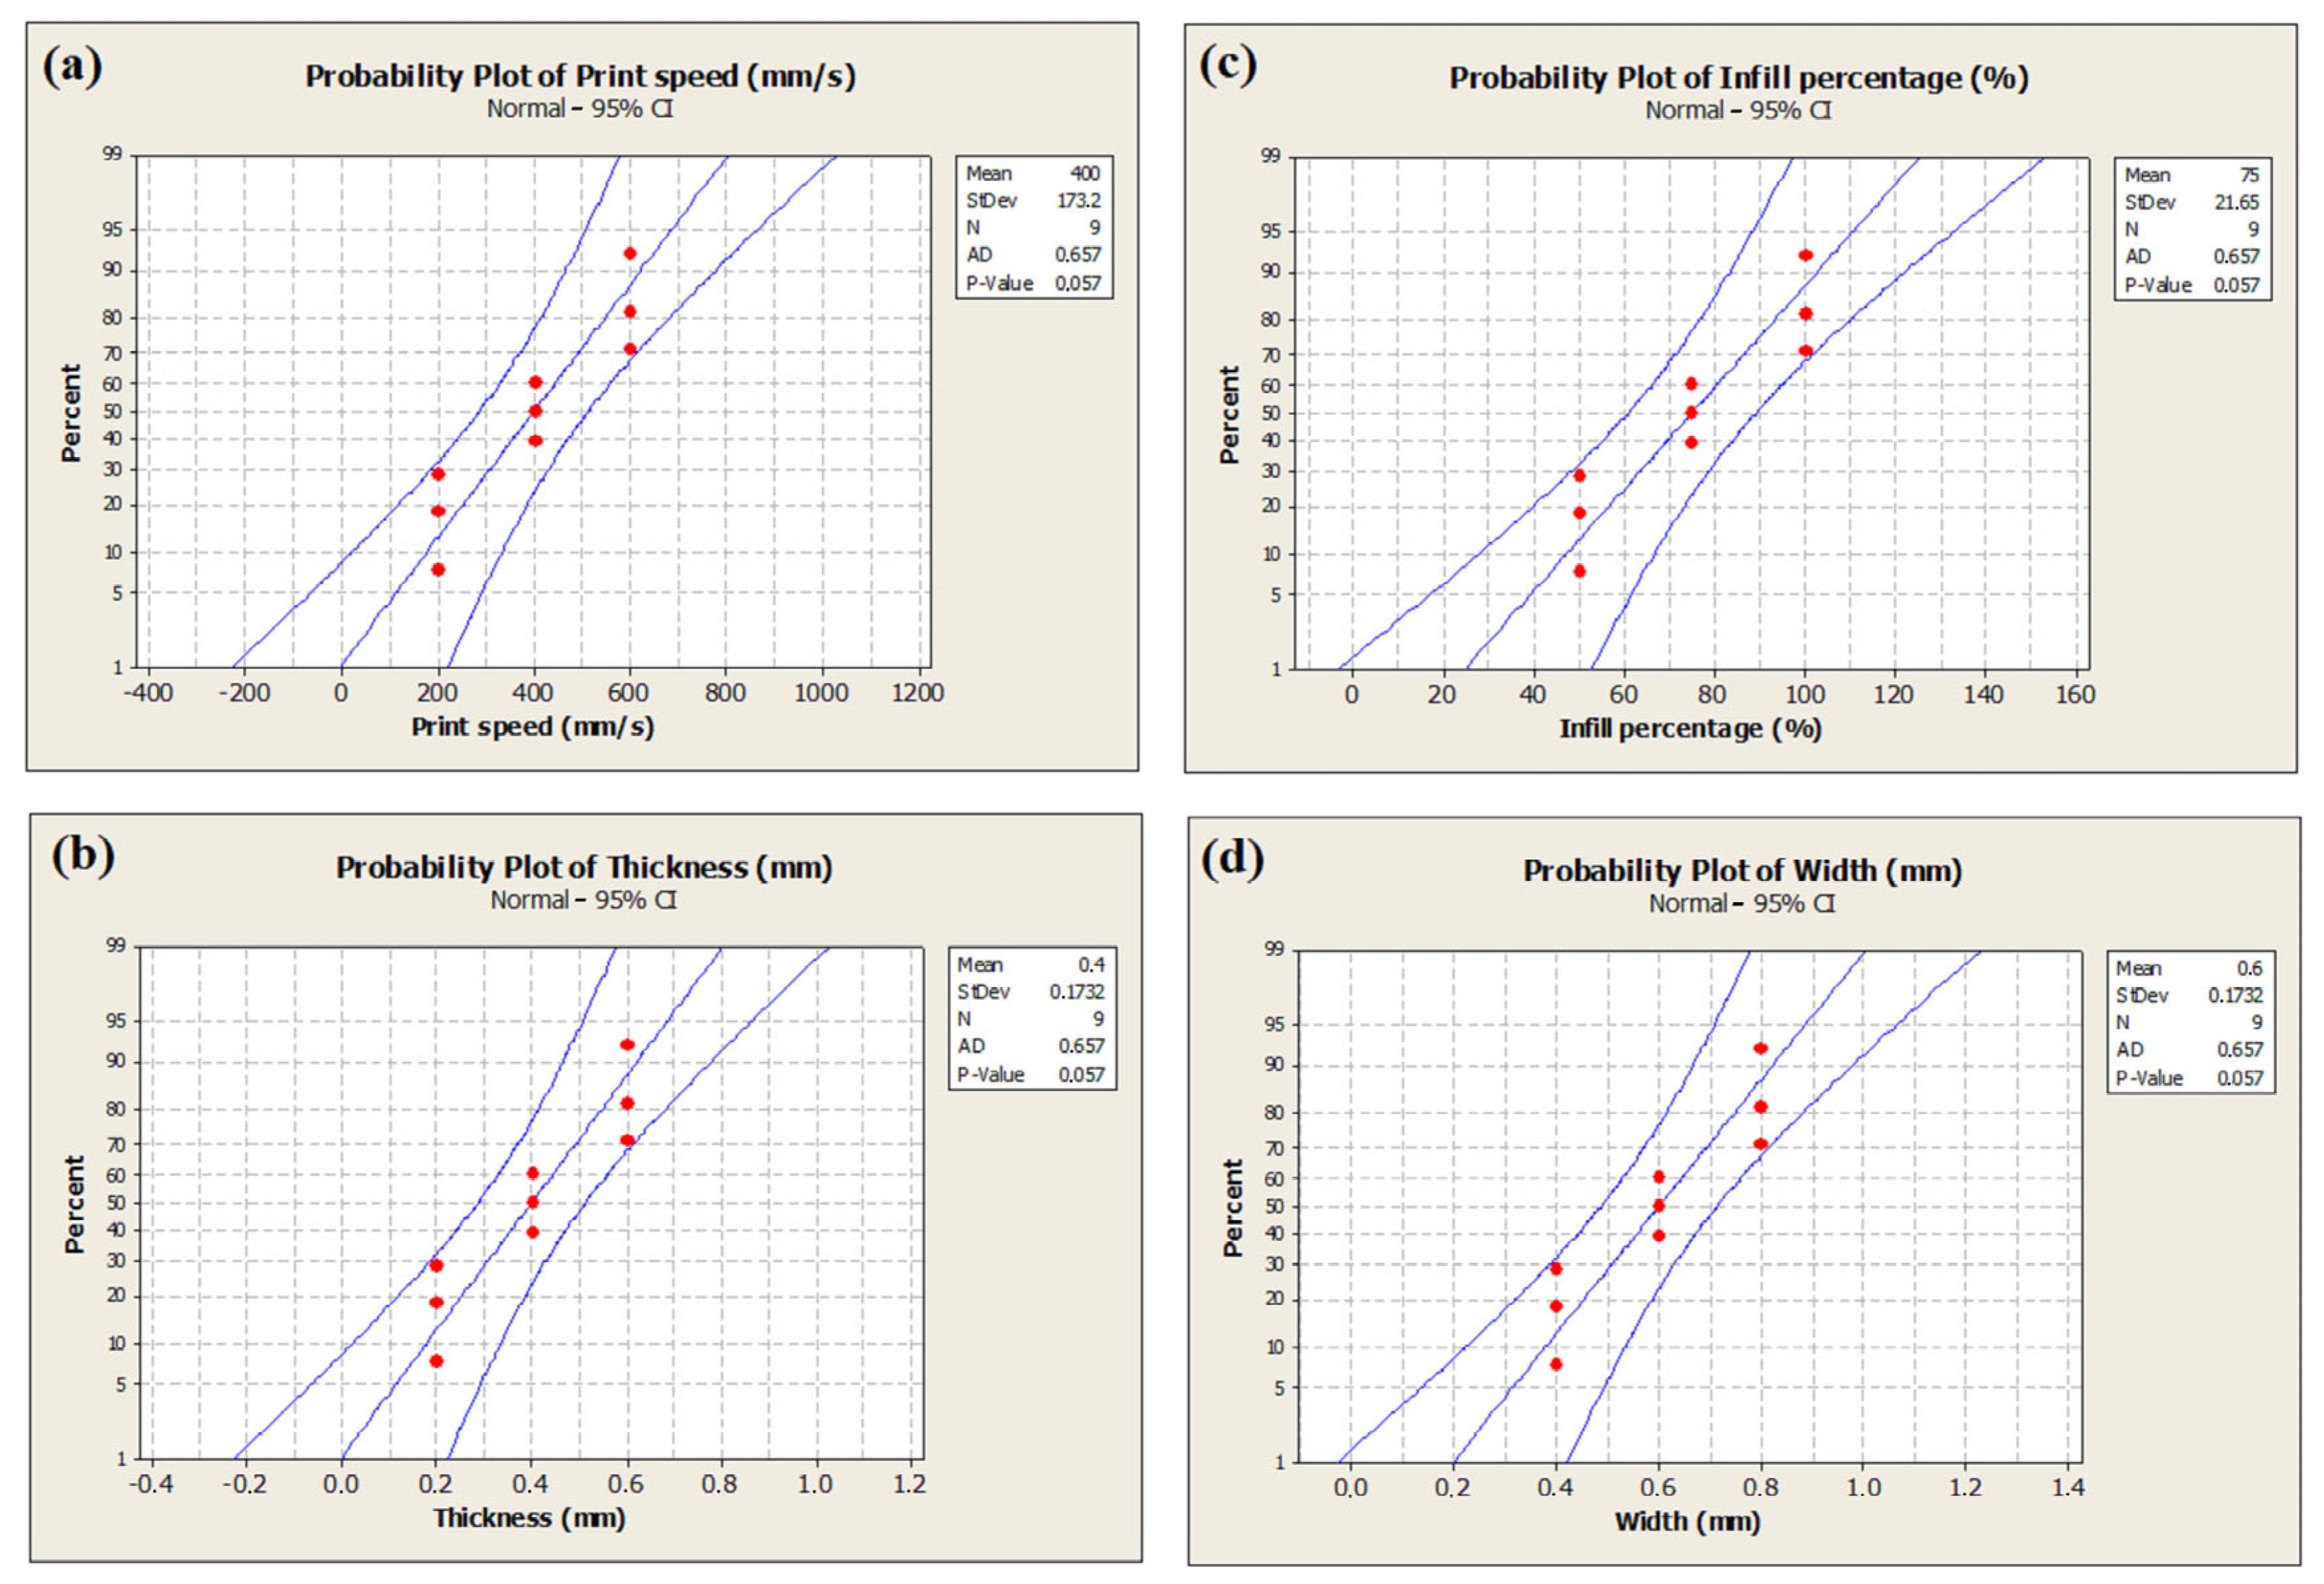
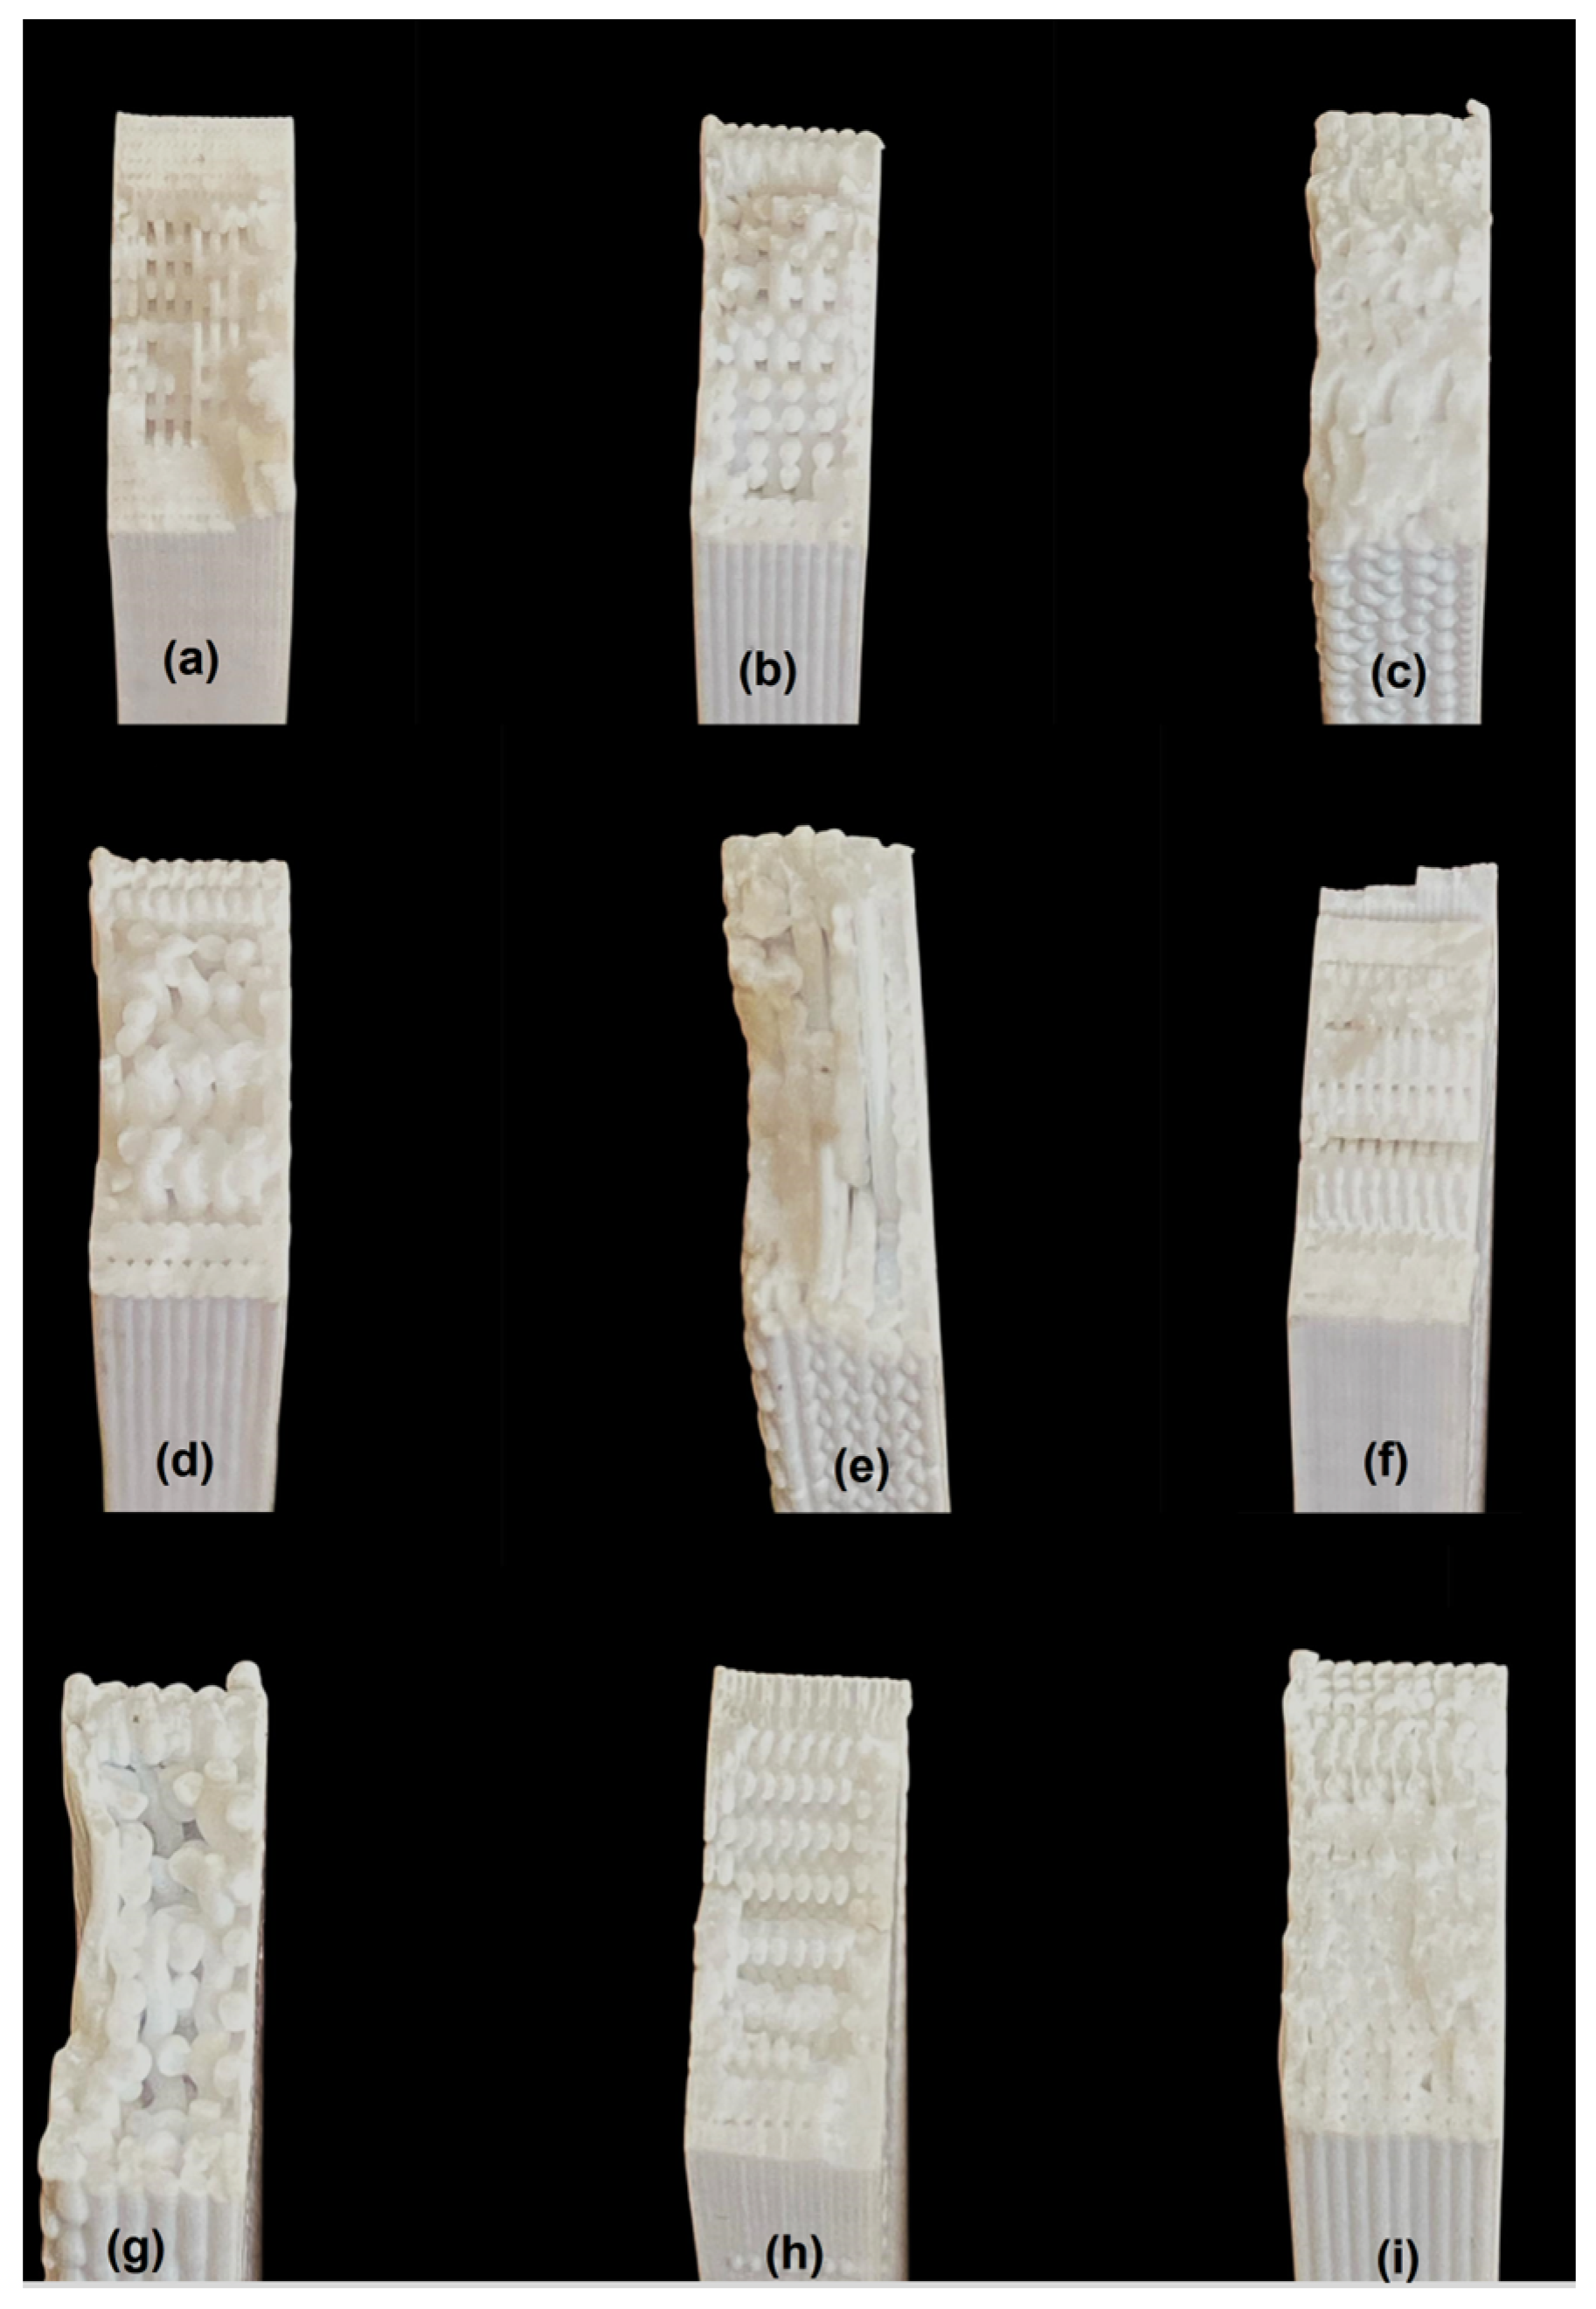
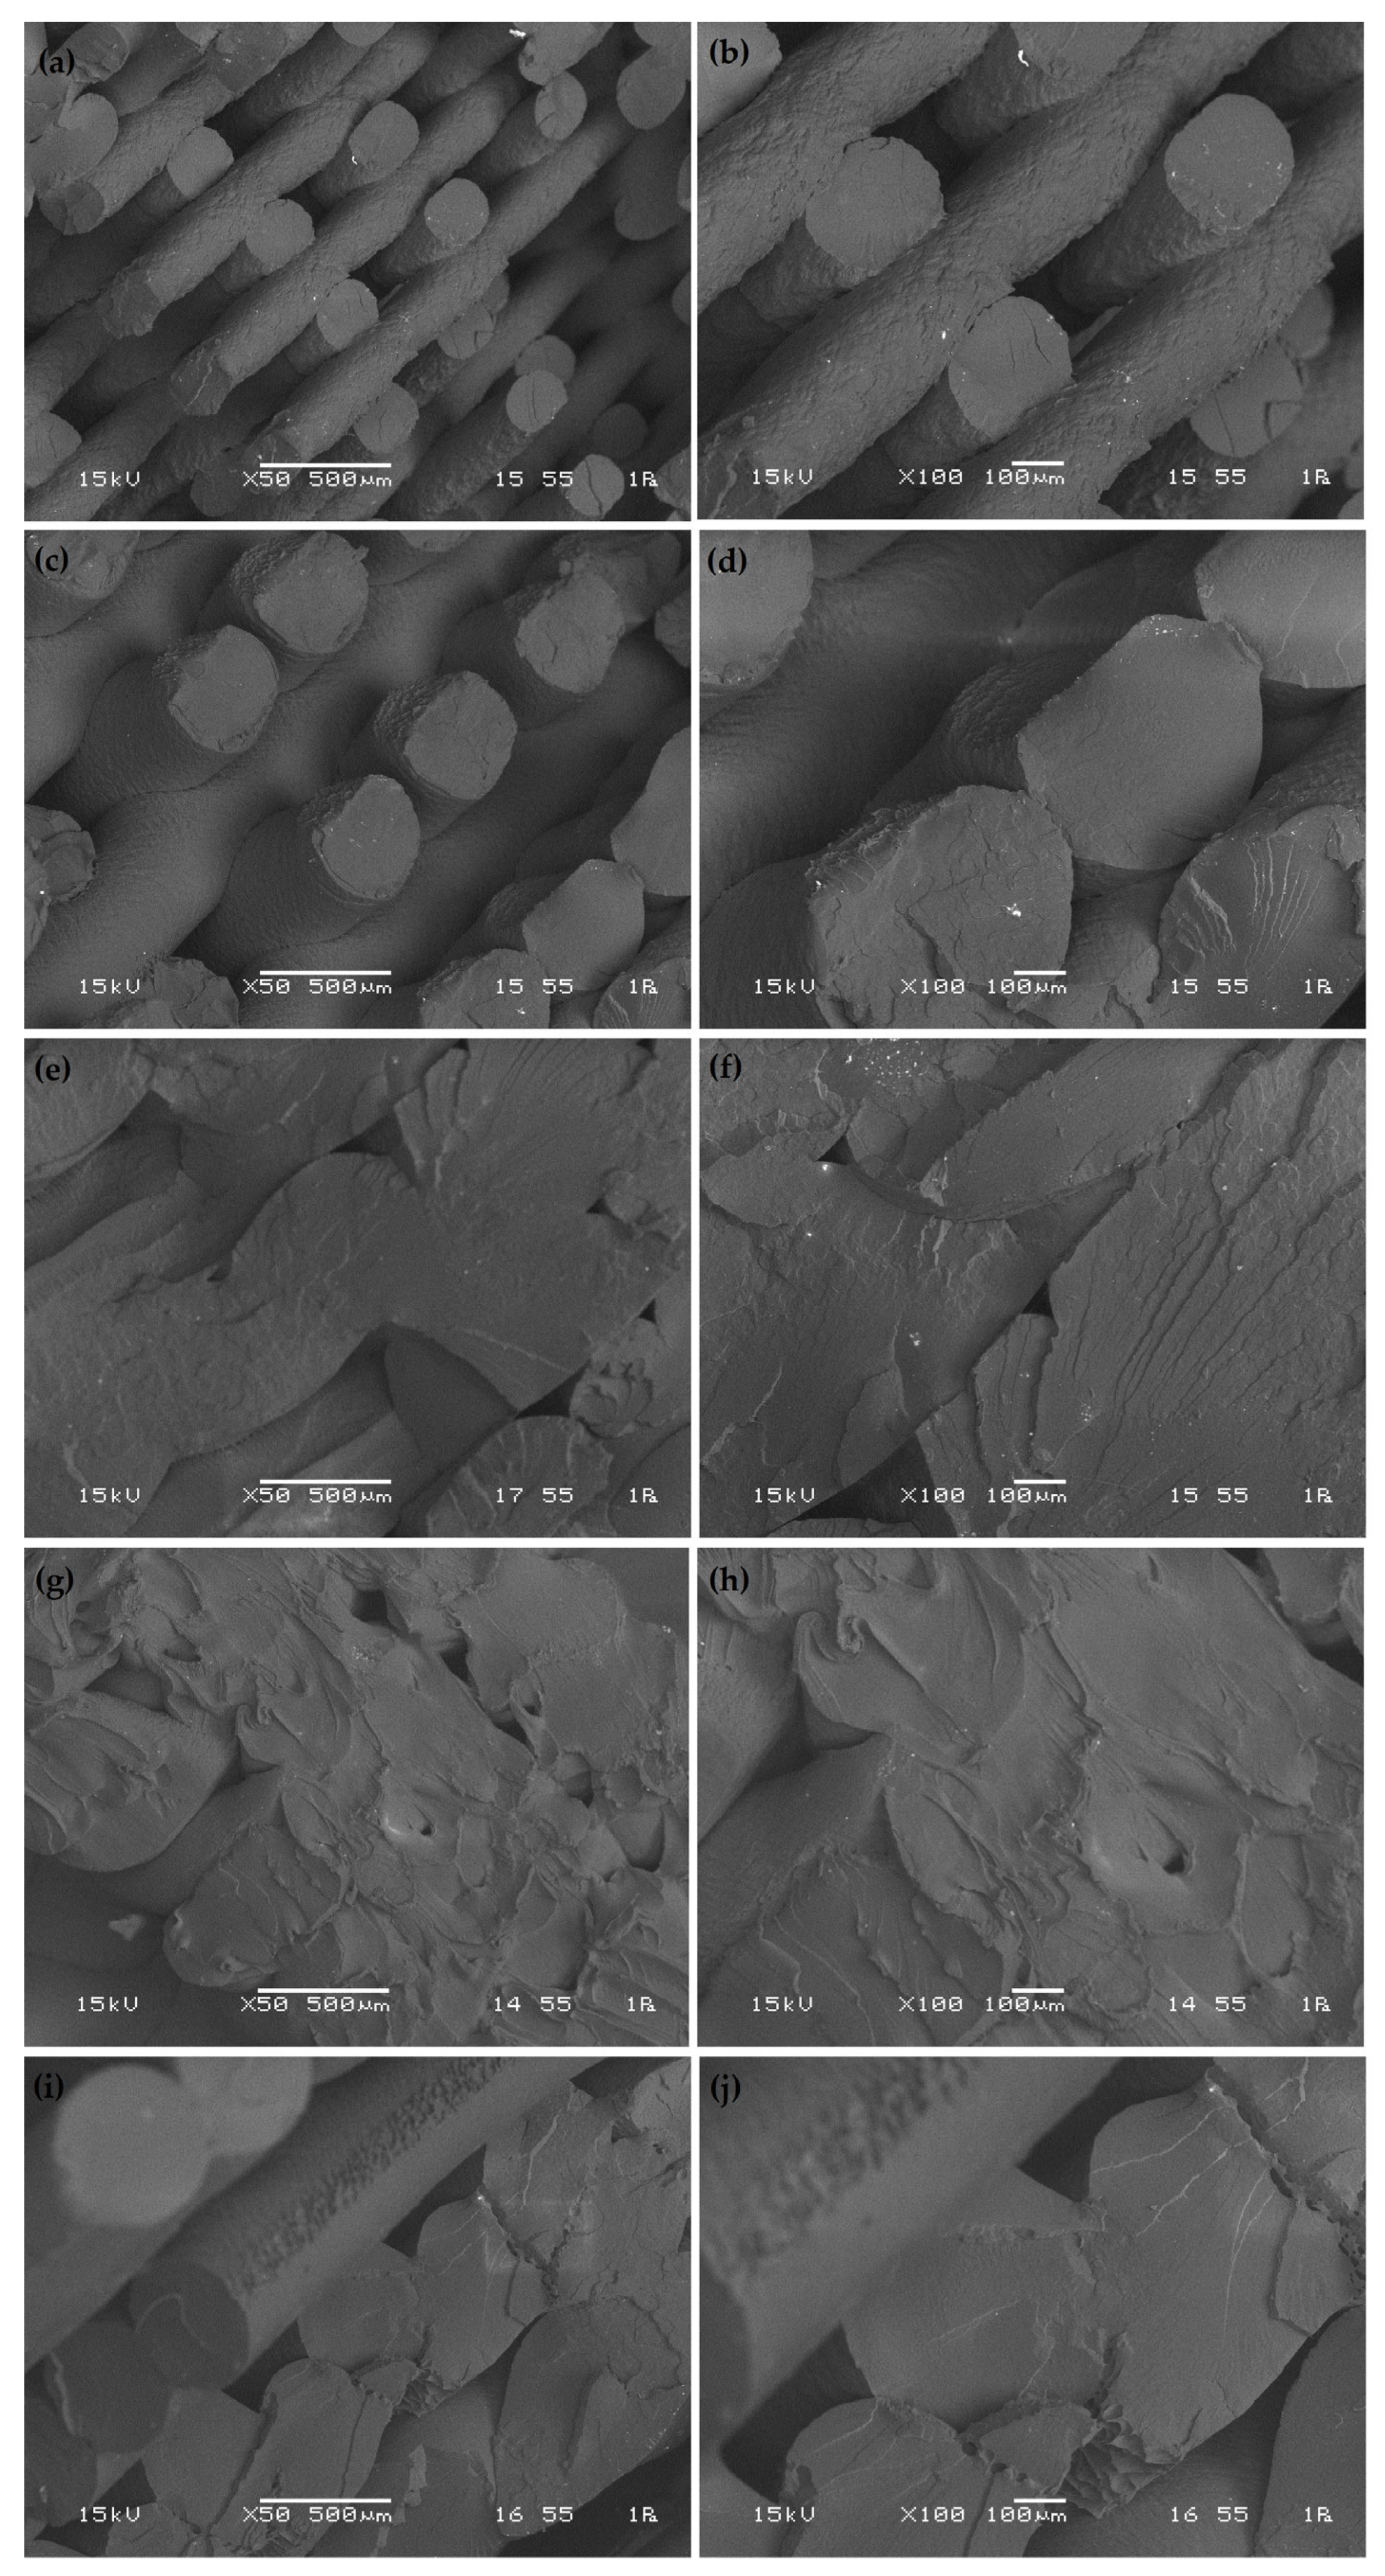
3. Results and Discussion
4. Conclusions
Author Contributions
Funding
Institutional Review Board Statement
Data Availability Statement
Conflicts of Interest
References
- Ngo, T.D.; Kashani, A.; Imbalzano, G.; Nguyen, K.T.Q.; Hui, D. Additive Manufacturing (3D Printing): A Review of Materials, Methods, Applications and Challenges. Compos. B Eng. 2018, 143, 172–196. [Google Scholar] [CrossRef]
- Chacón, J.M.; Caminero, M.A.; García-Plaza, E.; Núñez, P.J. Additive Manufacturing of PLA Structures Using Fused Deposition Modelling: Effect of Process Parameters on Mechanical Properties and Their Optimal Selection. Mater. Des. 2017, 124, 143–157. [Google Scholar] [CrossRef]
- Bembenek, M.; Kowalski, Ł.; Kosoń-Schab, A. Research on the Influence of Processing Parameters on the Specific Tensile Strength of FDM Additive Manufactured PET-G and PLA Materials. Polymers 2022, 14, 2446. [Google Scholar] [CrossRef]
- Bondarenko, A.V.; Islamov, S.R.; Ignatyev, K.V.; Mardashov, D.V. Laboratory studies of polymer compositions for well-kill under increased fracturing. Perm J. Pet. Min. Eng. 2020, 20, 37–48. [Google Scholar] [CrossRef] [PubMed]
- Głowacki, M.; Skórczewska, K.; Lewandowski, K.; Mazurkiewicz, A.; Szewczykowski, P. Evaluation of the Effect of Mineral Oil Exposure on Changes in the Structure and Mechanical Properties of Polymer Parts Produced by Additive Manufacturing Techniques. Materials 2024, 17, 3680. [Google Scholar] [CrossRef] [PubMed] [PubMed Central]
- Popescu, D.; Zapciu, A.; Amza, C.; Baciu, F.; Marinescu, R. FDM Process Parameters Influence over the Mechanical Properties of Polymer Specimens: A Review. Polym. Test. 2018, 69, 157–166. [Google Scholar] [CrossRef]
- Ambade, V.; Rajurkar, S.; Awari, G.; Yelamasetti, B.; Shelare, S. Influence of FDM Process Parameters on Tensile Strength of Parts Printed by PLA Material. Int. J. Interact. Des. Manuf. 2023, 19, 573–584. [Google Scholar] [CrossRef]
- Mazzanti, V.; Malagutti, L.; Mollica, F. FDM 3D Printing of Polymers Containing Natural Fillers: A Review of Their Mechanical Properties. Polymers 2019, 11, 1094. [Google Scholar] [CrossRef]
- Chokshi, H.; Shah, D.B.; Patel, K.M.; Joshi, S.J. Experimental Investigations of Process Parameters on Mechanical Properties for PLA during Processing in FDM. Adv. Mater. Process. Technol. 2022, 8, 696–709. [Google Scholar] [CrossRef]
- Muhamedagic, K.; Berus, L.; Potočnik, D.; Cekic, A.; Begic-Hajdarevic, D.; Cohodar Husic, M.; Ficko, M. Effect of Process Parameters on Tensile Strength of FDM Printed Carbon Fiber Reinforced Polyamide Parts. Appl. Sci. 2022, 12, 6028. [Google Scholar] [CrossRef]
- Kamaal, M.; Anas, M.; Rastogi, H.; Bhardwaj, N.; Rahaman, A. Effect of FDM Process Parameters on Mechanical Properties of 3D-Printed Carbon Fibre–PLA Composite. Prog. Addit. Manuf. 2021, 6, 63–69. [Google Scholar] [CrossRef]
- Popović, M.; Pjević, M.; Milovanović, A.; Mladenović, G.; Milošević, M. Printing Parameter Optimization of PLA Material Concerning Geometrical Accuracy and Tensile Properties Relative to FDM Process Productivity. J. Mech. Sci. Technol. 2023, 37, 697–706. [Google Scholar] [CrossRef]
- Domingo-Espin, M.; Puigoriol-Forcada, J.M.; Garcia-Granada, A.A.; Llumà, J.; Borros, S.; Reyes, G. Mechanical Property Characterization and Simulation of Fused Deposition Modeling Polycarbonate Parts. Mater. Des. 2015, 83, 670–677. [Google Scholar] [CrossRef]
- Chadha, A.; Ul Haq, M.I.; Raina, A.; Singh, R.R.; Penumarti, N.B.; Bishnoi, M.S. Effect of Fused Deposition Modelling Process Parameters on Mechanical Properties of 3D Printed Parts. World J. Eng. 2019, 16, 550–559. [Google Scholar] [CrossRef]
- Tang, C.; Liu, J.; Yang, Y.; Liu, Y.; Jiang, S.; Hao, W. Effect of Process Parameters on Mechanical Properties of 3D Printed PLA Lattice Structures. Compos. Part C Open Access 2020, 3, 100076. [Google Scholar] [CrossRef]
- Wang, S.; Ma, Y.; Deng, Z.; Zhang, S.; Cai, J. Effects of Fused Deposition Modeling Process Parameters on Tensile, Dynamic Mechanical Properties of 3D Printed Polylactic Acid Materials. Polym. Test. 2020, 86, 106483. [Google Scholar] [CrossRef]
- Hsueh, M.H.; Lai, C.J.; Chung, C.F.; Wang, S.H.; Huang, W.C.; Pan, C.Y.; Zeng, Y.S.; Hsieh, C.H. Effect of Printing Parameters on the Tensile Properties of 3d-Printed Polylactic Acid (Pla) Based on Fused Deposition Modeling. Polymers 2021, 13, 2387. [Google Scholar] [CrossRef]
- Lanzotti, A.; Grasso, M.; Staiano, G.; Martorelli, M. The Impact of Process Parameters on Mechanical Properties of Parts Fabricated in PLA with an Open-Source 3-D Printer. Rapid Prototyp. J. 2015, 21, 604–617. [Google Scholar] [CrossRef]
- Luzanin, O.; Movrin, D.; Stathopoulos, V.; Pandis, P.; Radusin, T.; Guduric, V. Impact of Processing Parameters on Tensile Strength, in-Process Crystallinity and Mesostructure in FDM-Fabricated PLA Specimens. Rapid Prototyp. J. 2019, 25, 1398–1410. [Google Scholar] [CrossRef]
- Vǎlean, C.; Marşavina, L.; Mǎrghitaşl, M.; Linul, E.; Razavi, N.; Berto, F. Effect of Manufacturing Parameters on Tensile Properties of FDM Printed Specimens. Procedia Struct. Integr. 2020, 26, 313–320. [Google Scholar] [CrossRef]
- Sadooghi, A.; Ebrahimian, M.R.; Hashemi, S.J.; Sayar, R.; Rahmani, K.; Bodaghi, M. Impact of Infill Density and Glass Fiber Reinforcement on the Compressive and Bending Strength of Acrylonitrile Butadiene 3D-Printed Corrugated Sandwich Panels. Adv. Eng. Mater. 2025, 27, 2401842. [Google Scholar] [CrossRef]
- Dou, H.; Cheng, Y.; Ye, W.; Zhang, D.; Li, J.; Miao, Z.; Rudykh, S. Effect of Process Parameters on Tensile Mechanical Properties of 3D Printing Continuous Carbon Fiber-Reinforced PLA Composites. Materials 2020, 13, 3850. [Google Scholar] [CrossRef] [PubMed]
- Behzadnasab, M.; Yousefi, A.A.; Ebrahimibagha, D.; Nasiri, F. Effects of Processing Conditions on Mechanical Properties of PLA Printed Parts. Rapid Prototyp. J. 2020, 26, 381–389. [Google Scholar] [CrossRef]
- Megersa, G.K.; Sitek, W.; Nowak, A.J.; Tomašić, N. Investigation of the Influence of Fused Deposition Modeling 3D Printing Process Parameters on Tensile Properties of Polylactic Acid Parts Using the Taguchi Method. Materials 2024, 17, 5951. [Google Scholar] [CrossRef]
- Kam, M.; İpekçi, A.; Şengül, Ö. Investigation of the Effect of FDM Process Parameters on Mechanical Properties of 3D Printed PA12 Samples Using Taguchi Method. J. Thermoplast. Compos. Mater. 2023, 36, 307–325. [Google Scholar] [CrossRef]
- Ahmed, B.A.; Nadeem, U.; Hakeem, A.S.; Ul-Hamid, A.; Khan, M.Y.; Younas, M.; Saeed, H.A. Printing Parameter Optimization of Additive Manufactured PLA Using Taguchi Design of Experiment. Polymers 2023, 15, 4370. [Google Scholar] [CrossRef]
- Maguluri, N.; Suresh, G.; Rao, K.V. Assessing the Effect of FDM Processing Parameters on Mechanical Properties of PLA Parts Using Taguchi Method. J. Thermoplast. Compos. Mater. 2023, 36, 1472–1488. [Google Scholar] [CrossRef]
- Hikmat, M.; Rostam, S.; Ahmed, Y.M. Investigation of Tensile Property-Based Taguchi Method of PLA Parts Fabricated by FDM 3D Printing Technology. Results Eng. 2021, 11, 100264. [Google Scholar] [CrossRef]
- Heidari-Rarani, M.; Ezati, N.; Sadeghi, P.; Badrossamay, M.R. Optimization of FDM Process Parameters for Tensile Properties of Polylactic Acid Specimens Using Taguchi Design of Experiment Method. J. Thermoplast. Compos. Mater. 2022, 35, 2435–2452. [Google Scholar] [CrossRef]
- Casavola, C.; Cazzato, A.; Moramarco, V.; Pappalettere, C. Orthotropic mechanical properties of fused deposition modelling parts described by classical laminate theory. Mater. Des. 2016, 90, 453–458. [Google Scholar] [CrossRef]
- Haque, M.M.M.; Dhrubo, S.R.; Pranto, A.F.Z.; Ahmed, A.; Arefin, M.M.; Arifuzzaman, M.; Islam, M.S. Impact of process parameters and material selection on the mechanical performance of FDM 3D-Printed components. Hybrid Adv. 2025, 10, 100502. [Google Scholar] [CrossRef]
- Milovanović, A.; Galațanu, S.-V.; Sedmak, A.; Marșavina, L.; Trajković, I.; Popa, C.-F.; Milošević, M. Layer thickness influence on impact properties of FDM printed PLA material. Procedia Struct. Integr. 2024, 56, 190–197. [Google Scholar] [CrossRef]
- Gupta, T.K.; Mounika, N.; Saxena, A.; Maurya, N.K.; Jagga, M.; Sood, G. Influence of raster angle on mechanical properties for FDM 3D-printed PLA polymer. Green Mater. 2025; ahead of print. [Google Scholar] [CrossRef]
- Rajpurohit, S.R.; Dave, H.K.; Bodaghi, M. Classical laminate theory for flexural strength prediction of FDM 3D printed PLAs. Mater. Today Proc. 2024, 101, 51–58. [Google Scholar] [CrossRef]
- Javadian, M.; Dadashi, A.; Bagheri, A.; Azadi, M. Fatigue Behavior and Failure Mechanism of 3D-Printed Continuous Glass Fiber-Reinforced PLA Composites Under Rotating Bending Fatigue. Compos. Part C Open Access 2025, 17, 100623. [Google Scholar] [CrossRef]
- Talati-Ahmad, M.; Dezianian, S.; Azadi, M.; Ghoddosian, A. Metamaterial structure impacts on stress and bending fatigue lifetime of additive-manufactured 3D-printed PLA specimens. J. Eng. Res. 2024, in press. [CrossRef]
- Kianifar, M.; Azadi, M.; Heidari, F. Effect of simulated body fluid on the fatigue resistance of 3D-printed PLA and PLA-wood structures under cyclic bending loading. Int. J. Fatigue 2025, 195, 108876. [Google Scholar] [CrossRef]
- Kiani, P.; Sedighi, M.; Kasaeian-Naeini, M.; Jabbari, A. Investigation of mechanical integrity and high-cycle fatigue behavior of 3D-printed PLA/PCL blend after exposure to a physiological environment. J. Mater. Res. Technol. 2025, 36, 3671–3683. [Google Scholar] [CrossRef]
- Ray, N.C.; Saha, R.K.; Mollah, E.; Rakib, S.; Ali, Y. Enhancing mechanical and surface properties of 3D-Printed Kevlar-reinforced ABS/PLA composites through FDM process. Hybrid Adv. 2025, 11, 100510. [Google Scholar] [CrossRef]
- Nugraha, A.D.; Adi, R.K.; Kumar, V.V.; Kusumawanto, A.; Prawara, B.; Junianto, E.; Hikmawan, M.F.; Muflikhun, M.A. Investigating the mechanical properties and crashworthiness of hybrid PLA/GFRP composites fabricated using FDM-filament winding. Heliyon 2024, 10, e39062. [Google Scholar] [CrossRef]
- Rota, I.; Bertolo, D.; Gastaldi, D. Printing fidelity assessment and micro-mechanical characterization of FDM-printed PLA/HA composite for maxillofacial and oral applications. J. Mech. Behav. Biomed. Mater. 2025, 168, 106987. [Google Scholar] [CrossRef]
- Kumar, G.S.P.; Keshavamurthy, R.; Panigrahi, S.P.; Thomas, S.; R, T.; Hebbar, G.S.; Prasad, C.D.; Aden, A.A. Enhanced mechanical properties of CNT/Graphene reinforced PLA-based composites fabricated via fused deposition modelling. Results Eng. 2025, 25, 104472. [Google Scholar] [CrossRef]
- Hasanzadeh, R.; Mihankhah, P.; Azdast, T.; Aghaiee, S.; Park, C.B. Optimization of Process Parameters of Fused Filament Fabrication of Polylactic Acid Composites Reinforced by Aluminum Using Taguchi Approach. Metals 2023, 13, 1013. [Google Scholar] [CrossRef]
- Santosh, S.; Muthiah, M.S.S.; Nishad, K.S. Influence of infill density on the mechanical properties and fracture behavior of 3D-printed PLA+ components. Macromol. Res. 2025; ahead of print. [Google Scholar] [CrossRef]


| Process Parameter | Symbol | Level 1 | Level 2 | Level 3 |
|---|---|---|---|---|
| Print speed (mm/s) | A | 200 | 400 | 600 |
| Infill percentage (%) | B | 50 | 75 | 100 |
| Layer thickness (mm) | C | 0.2 | 0.4 | 0.6 |
| Layer width (mm) | D | 0.4 | 0.6 | 0.8 |
| Experiment Number | Print Speed (mm/s) | Infill Percentage (%) | Layer Thickness (mm) | Layer Width (mm) |
|---|---|---|---|---|
| 1 | 200 | 50 | 0.2 | 0.4 |
| 2 | 200 | 75 | 0.4 | 0.6 |
| 3 | 200 | 100 | 0.6 | 0.8 |
| 4 | 400 | 50 | 0.4 | 0.8 |
| 5 | 400 | 75 | 0.6 | 0.4 |
| 6 | 400 | 100 | 0.2 | 0.6 |
| 7 | 600 | 50 | 0.6 | 0.6 |
| 8 | 600 | 75 | 0.2 | 0.8 |
| 9 | 600 | 100 | 0.4 | 0.4 |
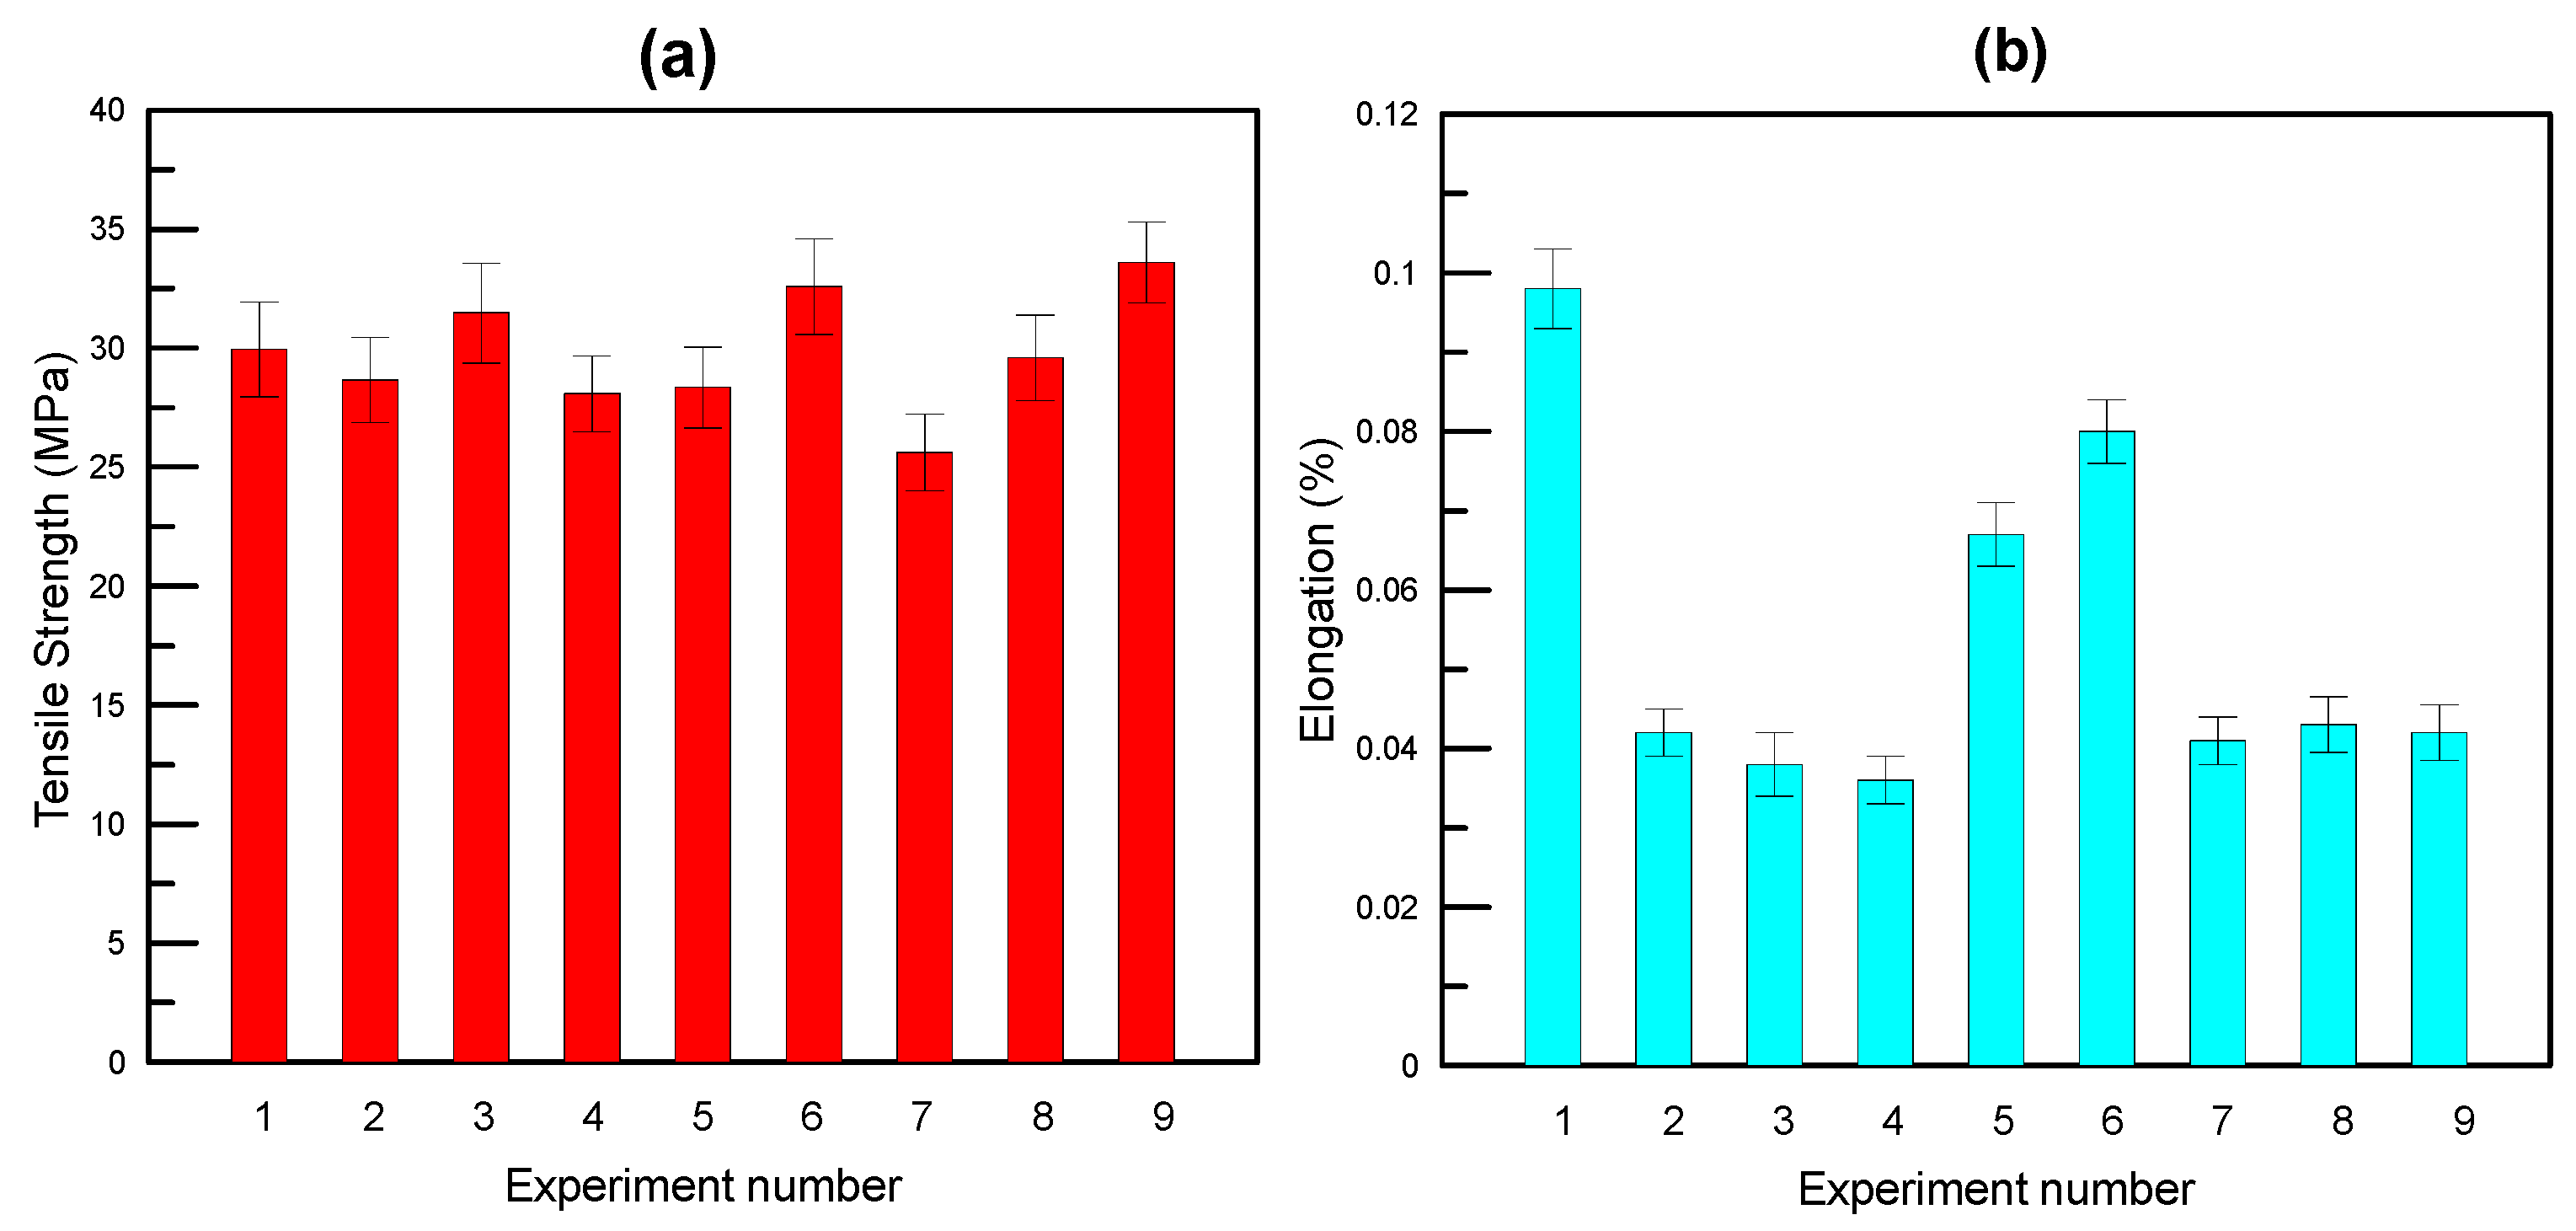
| Experiment Number | Tensile Strength (MPa) | S/N of Tensile Strength | % Elongation | S/N of % Elongation |
|---|---|---|---|---|
| 1 | 31.46 | 29.9552 | 0.098 | −20.1755 |
| 2 | 27.10 | 28.6594 | 0.042 | −27.5350 |
| 3 | 37.51 | 31.4829 | 0.038 | −28.4043 |
| 4 | 25.37 | 28.0864 | 0.036 | −28.8739 |
| 5 | 26.16 | 28.3528 | 0.067 | −23.4785 |
| 6 | 42.56 | 32.5800 | 0.080 | −21.9382 |
| 7 | 19.10 | 25.6207 | 0.041 | −27.7443 |
| 8 | 30.19 | 29.5973 | 0.043 | −27.3306 |
| 9 | 47.84 | 33.5958 | 0.042 | −27.5350 |
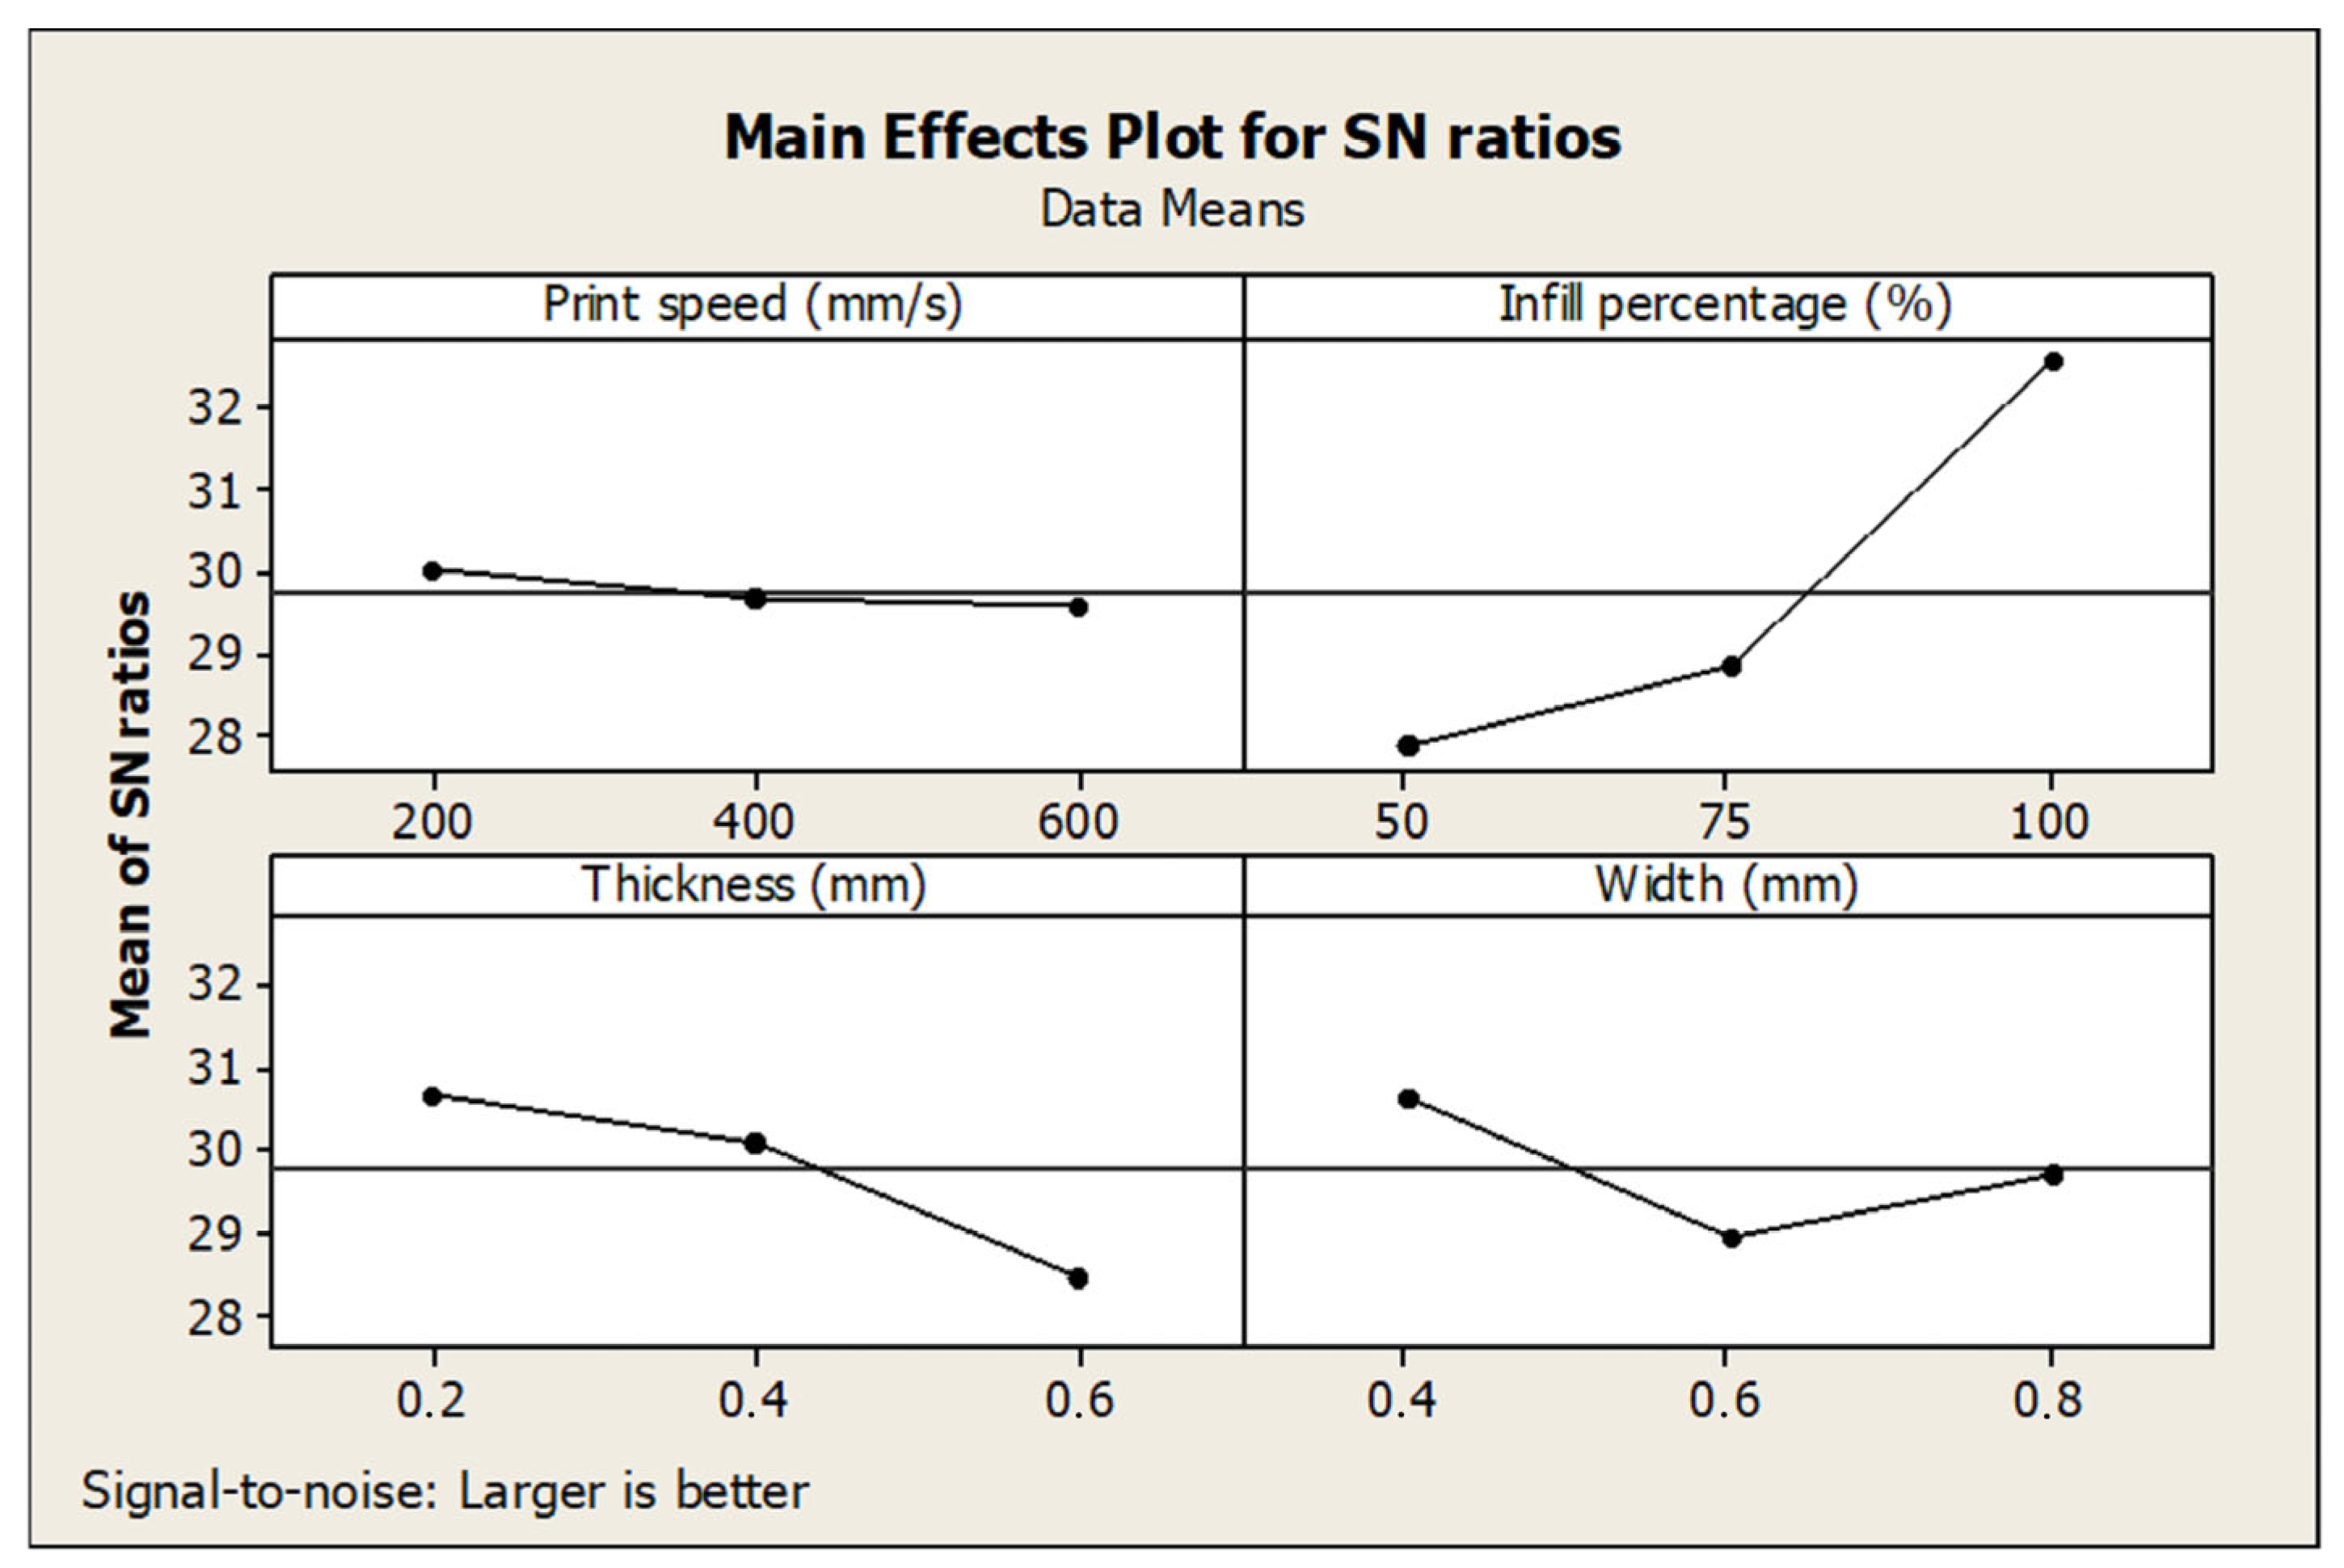
| Level | Print Speed | Infill Percentage | Layer Thickness | Layer Width |
|---|---|---|---|---|
| 1 | 30.03 | 27.89 | 30.71 | 30.63 |
| 2 | 29.67 | 28.87 | 30.11 | 28.95 |
| 3 | 29.60 | 32.55 | 28.49 | 29.72 |
| Delta | 0.43 | 4.67 | 2.23 | 1.68 |
| Rank | 4 | 1 | 2 | 3 |
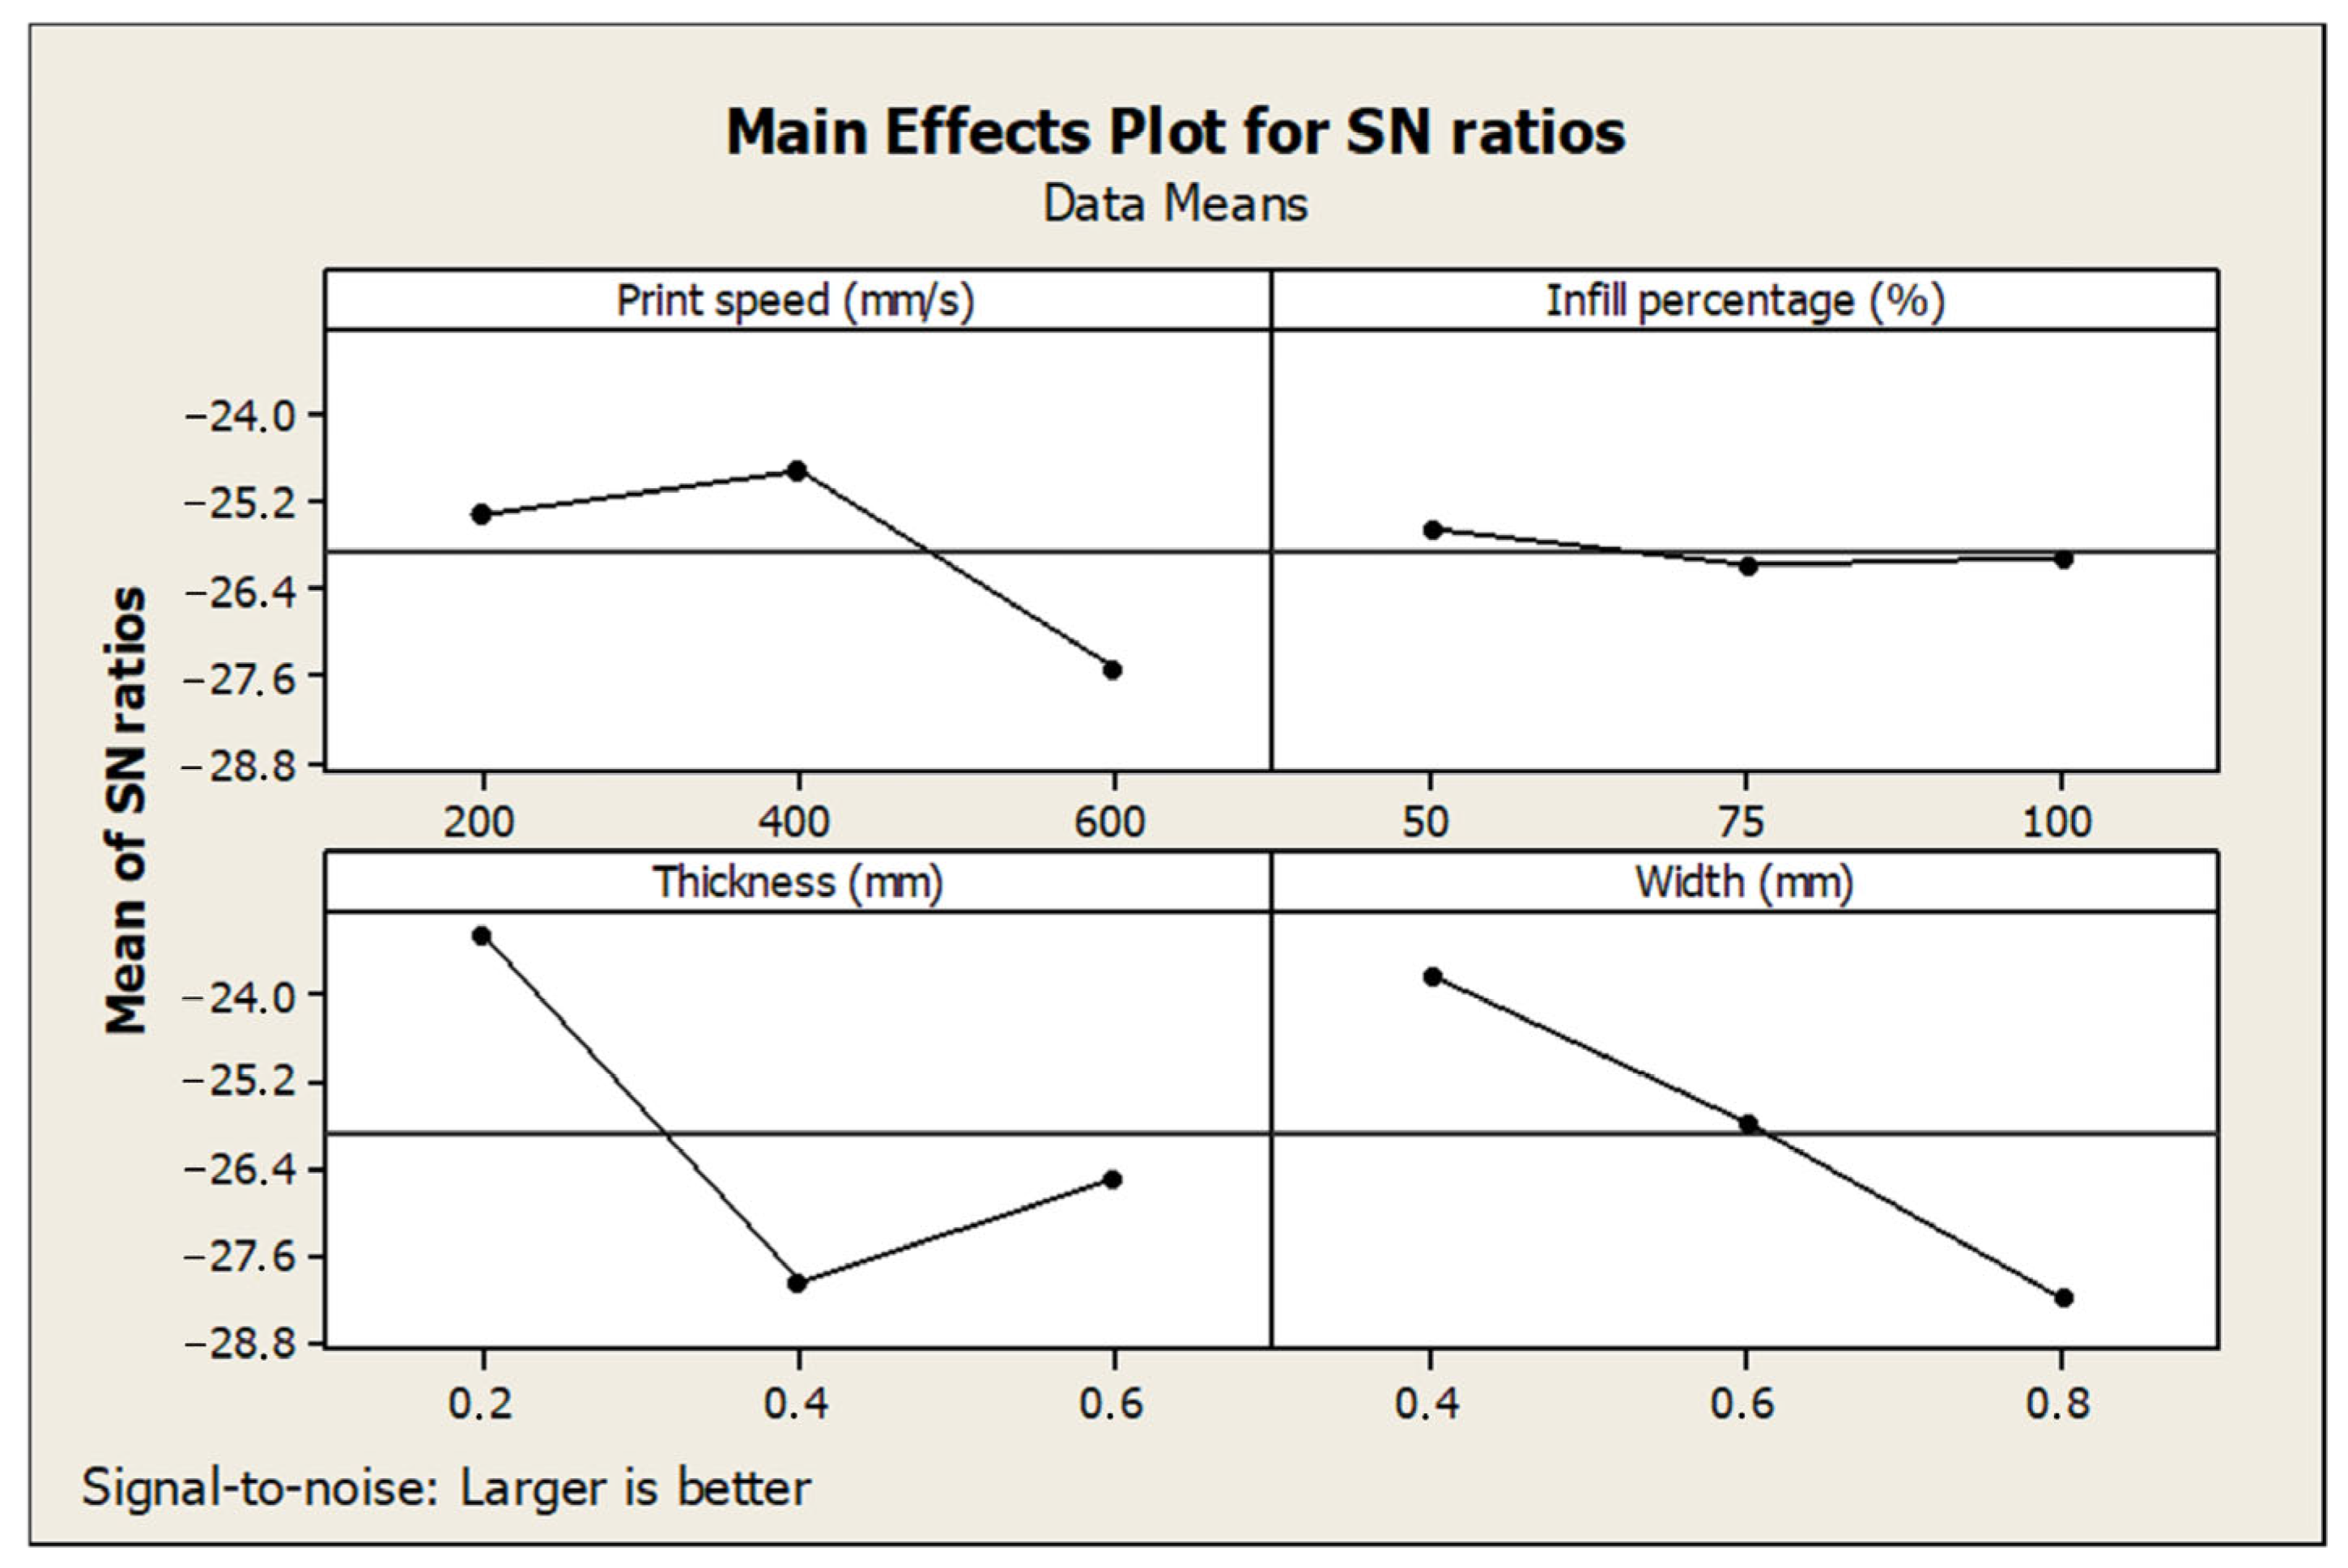
| Level | Print Speed | Infill Percentage | Layer Thickness | Layer Width |
|---|---|---|---|---|
| 1 | −25.37 | −25.60 | −23.15 | −23.73 |
| 2 | −24.76 | −26.11 | −27.98 | −25.74 |
| 3 | −27.54 | −25.96 | −26.54 | −28.20 |
| Delta | 2.77 | 0.52 | 4.83 | 4.47 |
| Rank | 3 | 4 | 1 | 2 |
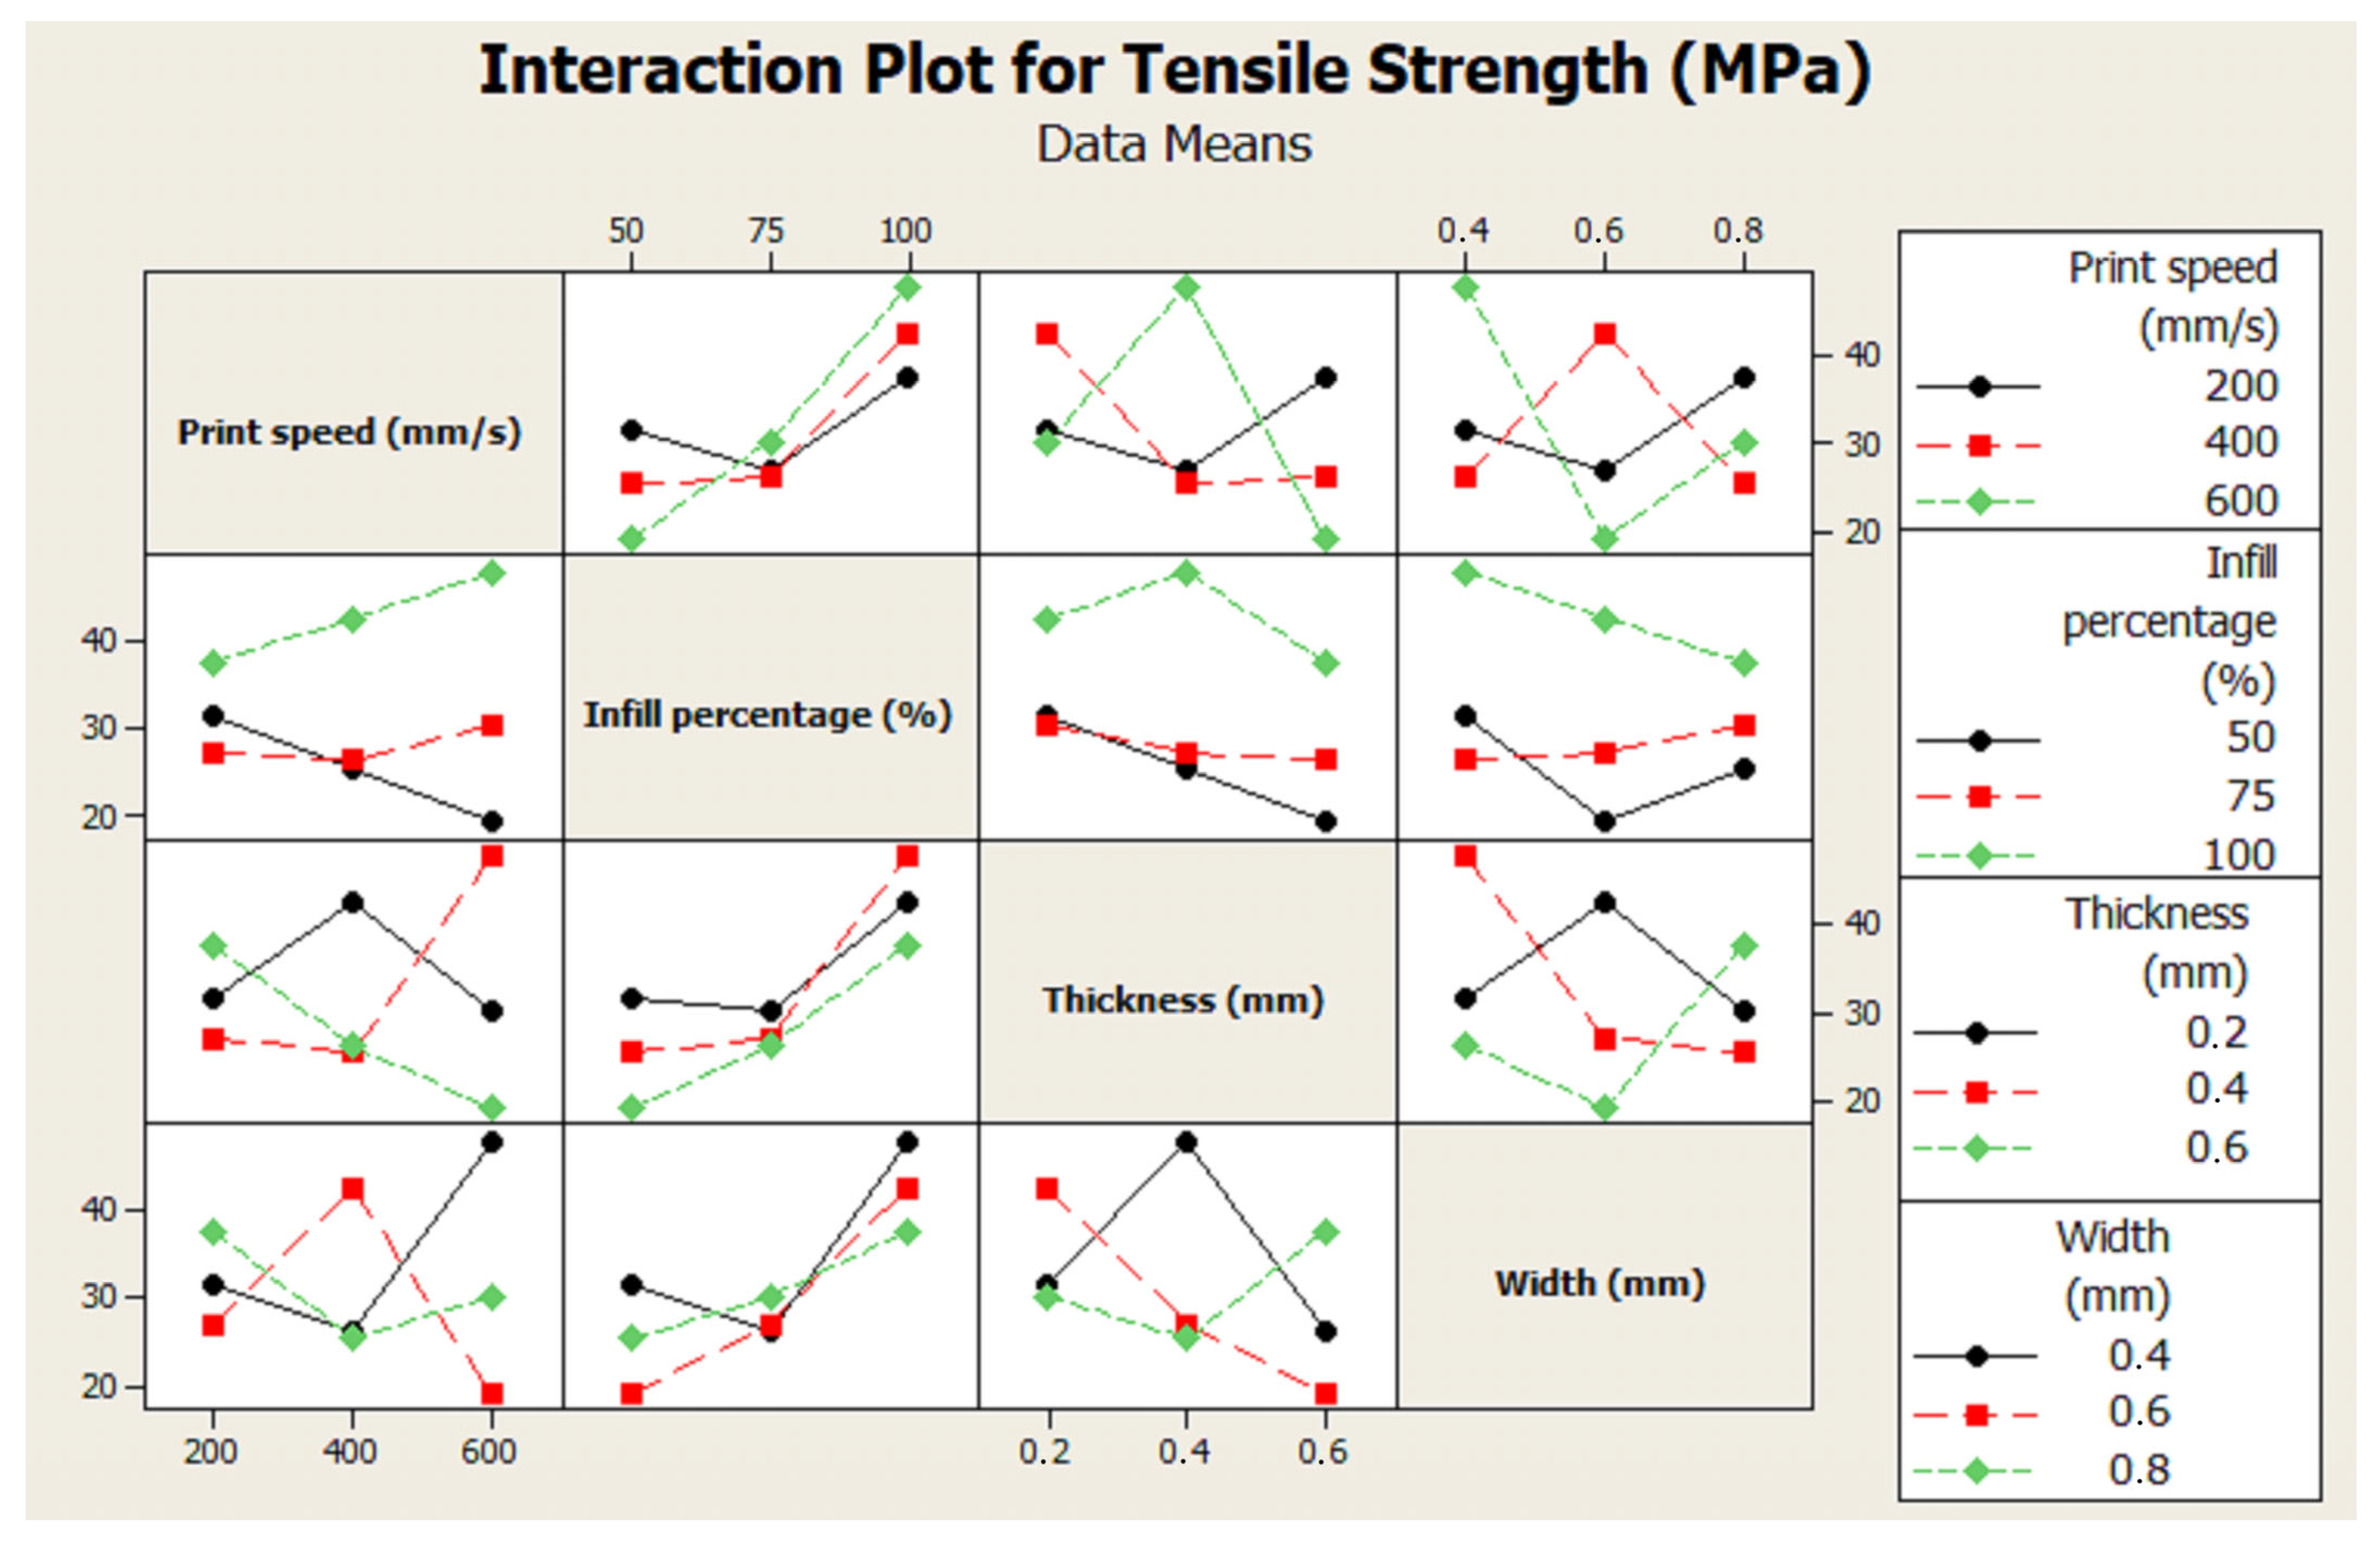
| Source | DF | SS | MS | F-Value | p-Value | Cont % |
|---|---|---|---|---|---|---|
| Print speed | 1 | 0.187 | 0.187 | 0.01 | 0.939 | 0.03 |
| Infill percentage | 1 | 450.320 | 450.320 | 16.07 | 0.016 | 67.77 |
| Layer thickness | 1 | 76.612 | 76.612 | 2.73 | 0.174 | 11.52 |
| Layer width | 1 | 25.585 | 25.585 | 0.91 | 0.393 | 3.88 |
| Error | 4 | 112.069 | 28.017 | 16.80 | ||
| Total | 8 | 664.773 | 100 |
Disclaimer/Publisher’s Note: The statements, opinions and data contained in all publications are solely those of the individual author(s) and contributor(s) and not of MDPI and/or the editor(s). MDPI and/or the editor(s) disclaim responsibility for any injury to people or property resulting from any ideas, methods, instructions or products referred to in the content. |
© 2025 by the authors. Licensee MDPI, Basel, Switzerland. This article is an open access article distributed under the terms and conditions of the Creative Commons Attribution (CC BY) license (https://creativecommons.org/licenses/by/4.0/).
Share and Cite
Ekşi, S.; Karakaya, C. Effects of Process Parameters on Tensile Properties of 3D-Printed PLA Parts Fabricated with the FDM Method. Polymers 2025, 17, 1934. https://doi.org/10.3390/polym17141934
Ekşi S, Karakaya C. Effects of Process Parameters on Tensile Properties of 3D-Printed PLA Parts Fabricated with the FDM Method. Polymers. 2025; 17(14):1934. https://doi.org/10.3390/polym17141934
Chicago/Turabian StyleEkşi, Seçil, and Cetin Karakaya. 2025. "Effects of Process Parameters on Tensile Properties of 3D-Printed PLA Parts Fabricated with the FDM Method" Polymers 17, no. 14: 1934. https://doi.org/10.3390/polym17141934
APA StyleEkşi, S., & Karakaya, C. (2025). Effects of Process Parameters on Tensile Properties of 3D-Printed PLA Parts Fabricated with the FDM Method. Polymers, 17(14), 1934. https://doi.org/10.3390/polym17141934