

A Wavelength Rule for the Analysis of Clusteroluminescence


Abstract

1. Introduction
- Their luminescence is greatly enhanced in the solid state, but negligible in dilute solutions [26], also known as aggregation-induced emission.
2. Material and Methods
2.1. Samples
- (1)
- In the unmodified class, 14 light-coloured wood species were chosen to reduce the effect of reabsorption: Abies alba, Acer ssp., Alnus glutinosa, Betula pendula, Carpinus betulus, Fagus sylvatica, Fraxinus excelsior, Ochroma ssp., Picea abies, Prunus avium sapwood, Terminalia superba, Tilia ssp., and Triplochiton scleroxylon.
- (2)
- The degraded wood samples included Fagus sylvatica wood degraded by Trametes versicolor, Picea abies wood degraded by Serpula lacrymans, and photodegraded Acer ssp. wood.
- (3)
- The isolated and related lignocellulosic materials comprised bacterial cellulose, cellulose for column chromatography, cotton nettle, chitin from shrimp shells, fluffy mycelium of Serpula lacrymans, D (+) Xylose, filter paper, microcrystalline cellulose with varying moisture content, and organosolv lignin from Eucalyptus ssp. A detailed list of sample origin and treatments is given in the Supplementary Materials. All samples were stored in the dark at room temperature until measured, unless otherwise stated.
2.2. Fluorescence Spectroscopy
2.3. Literature Analysis
- (1)
- An absence of extended conjugated structures able to explain conventional fluorescence.
- (2)
- An excitation maximum substantially different from the absorption maximum.
- (3)
- Excitation-dependent emission.
3. Results
4. Discussion
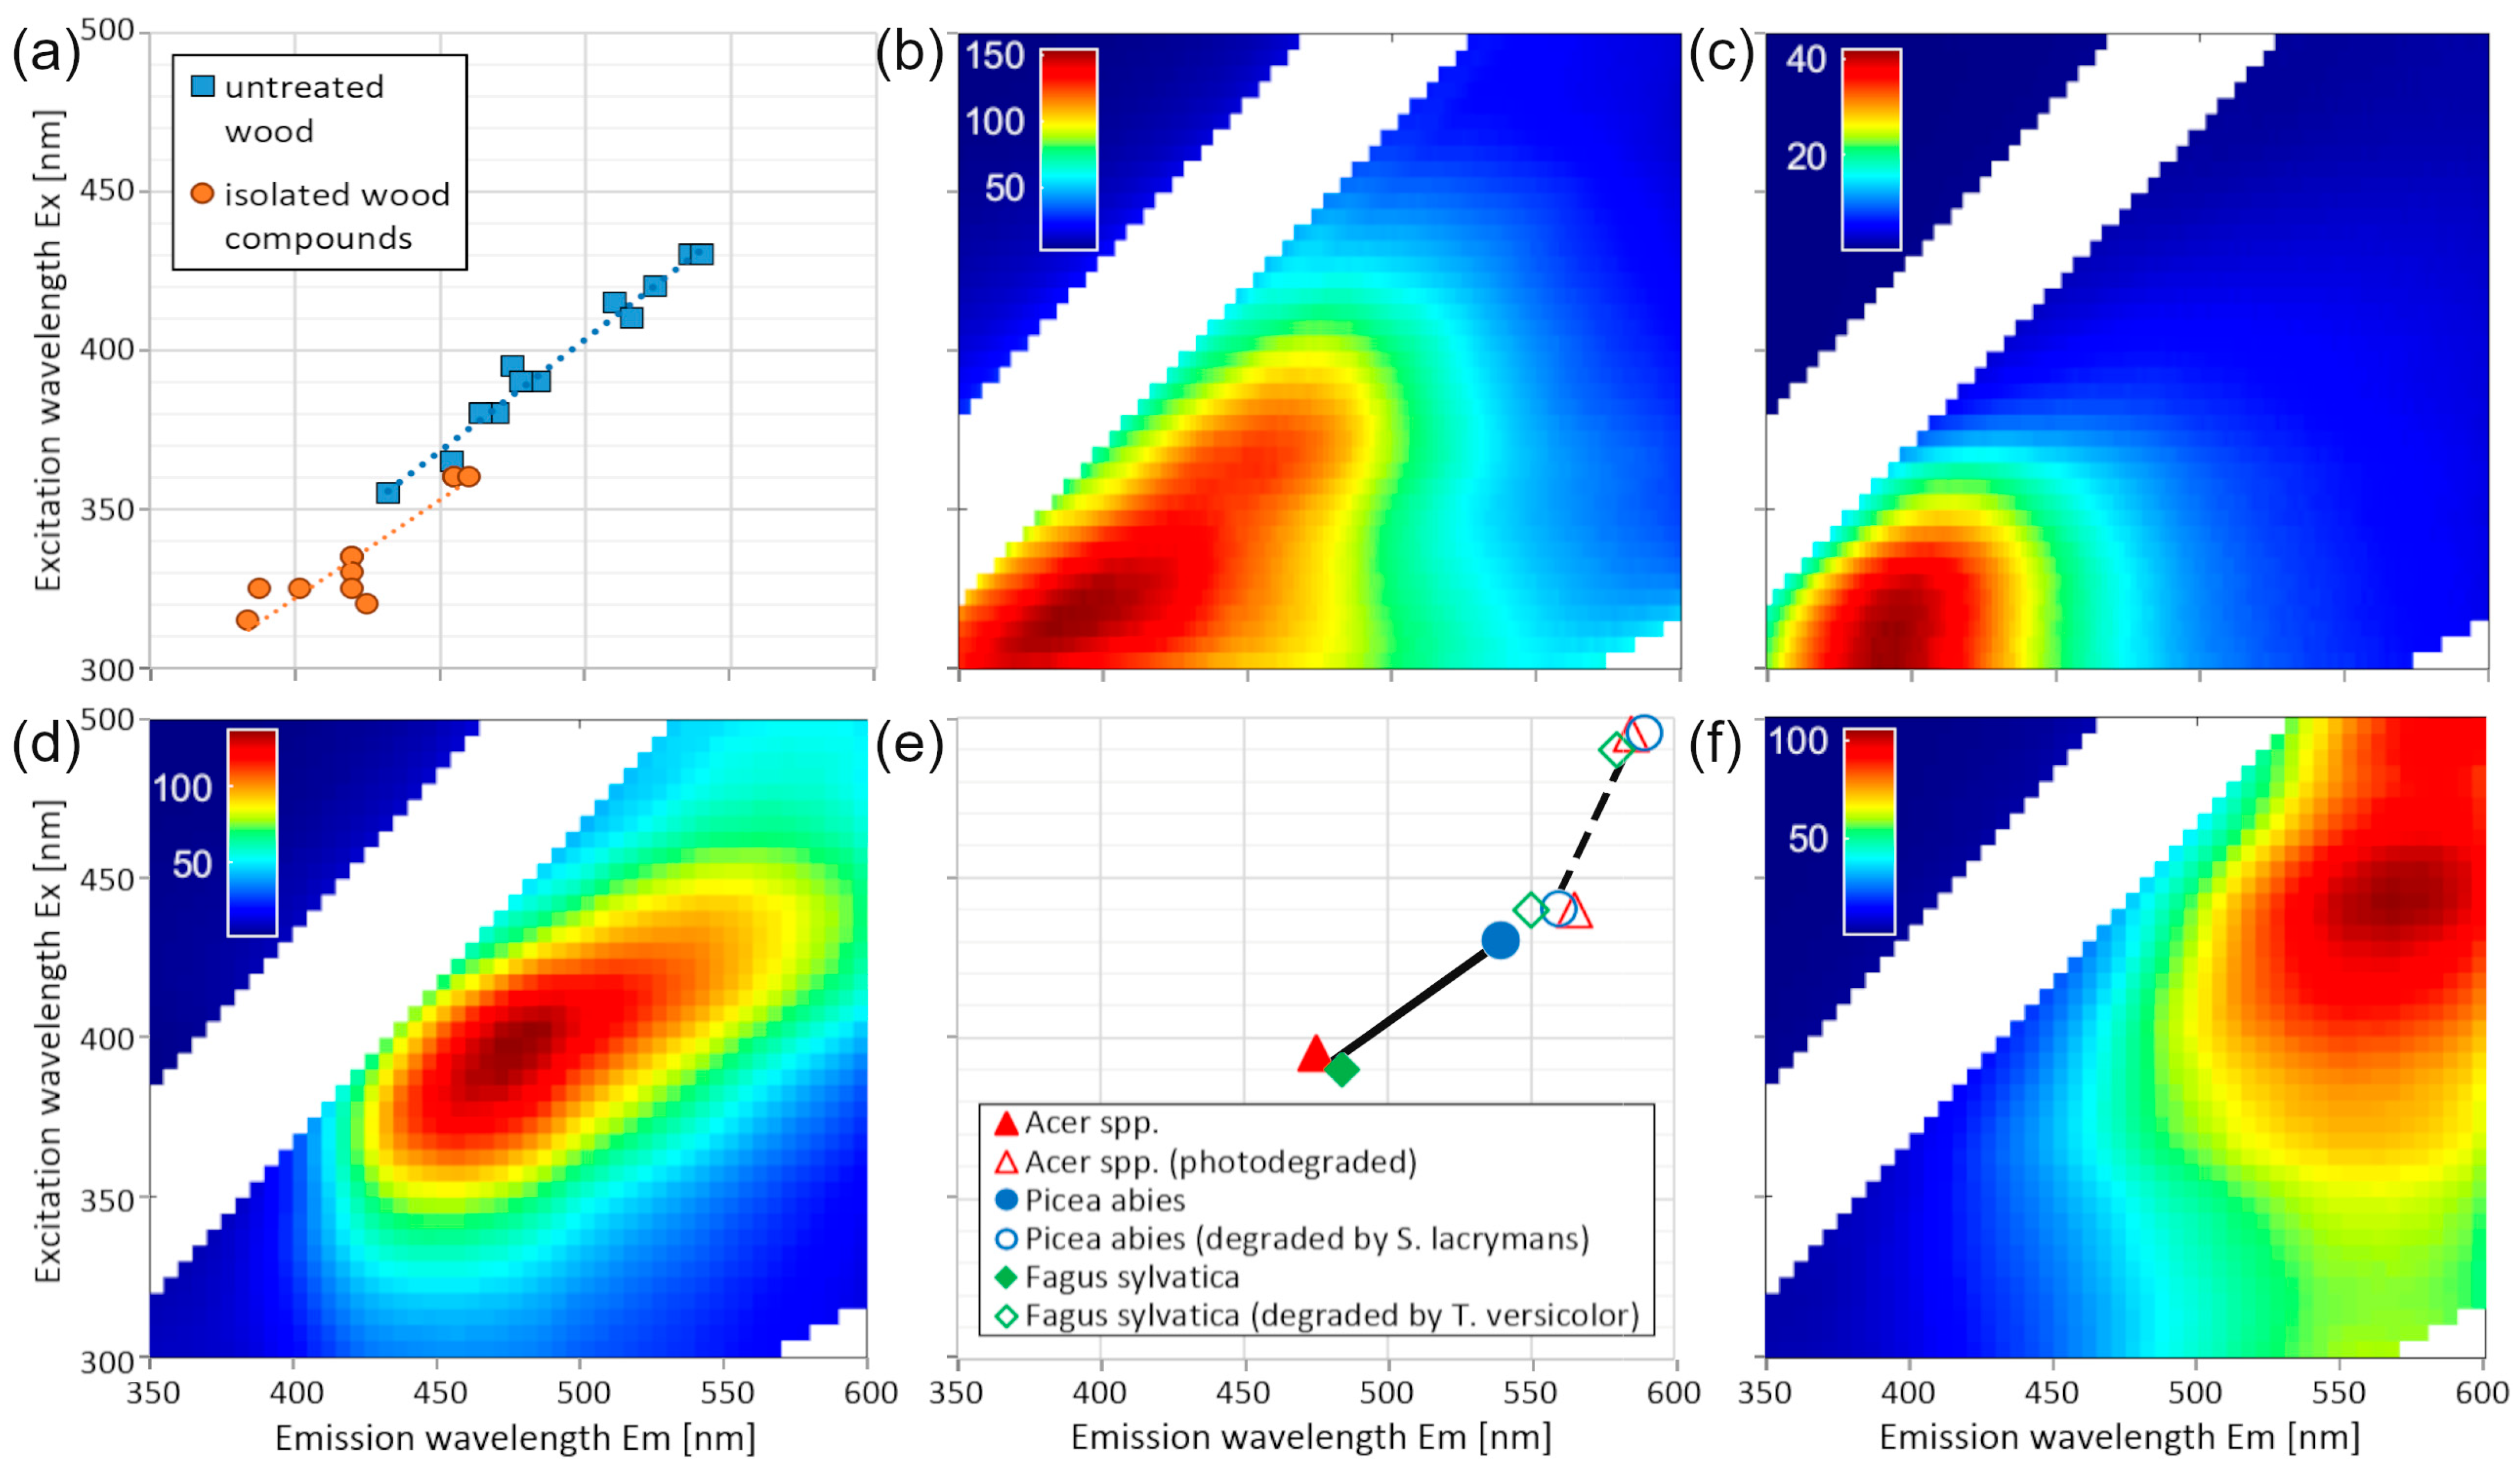
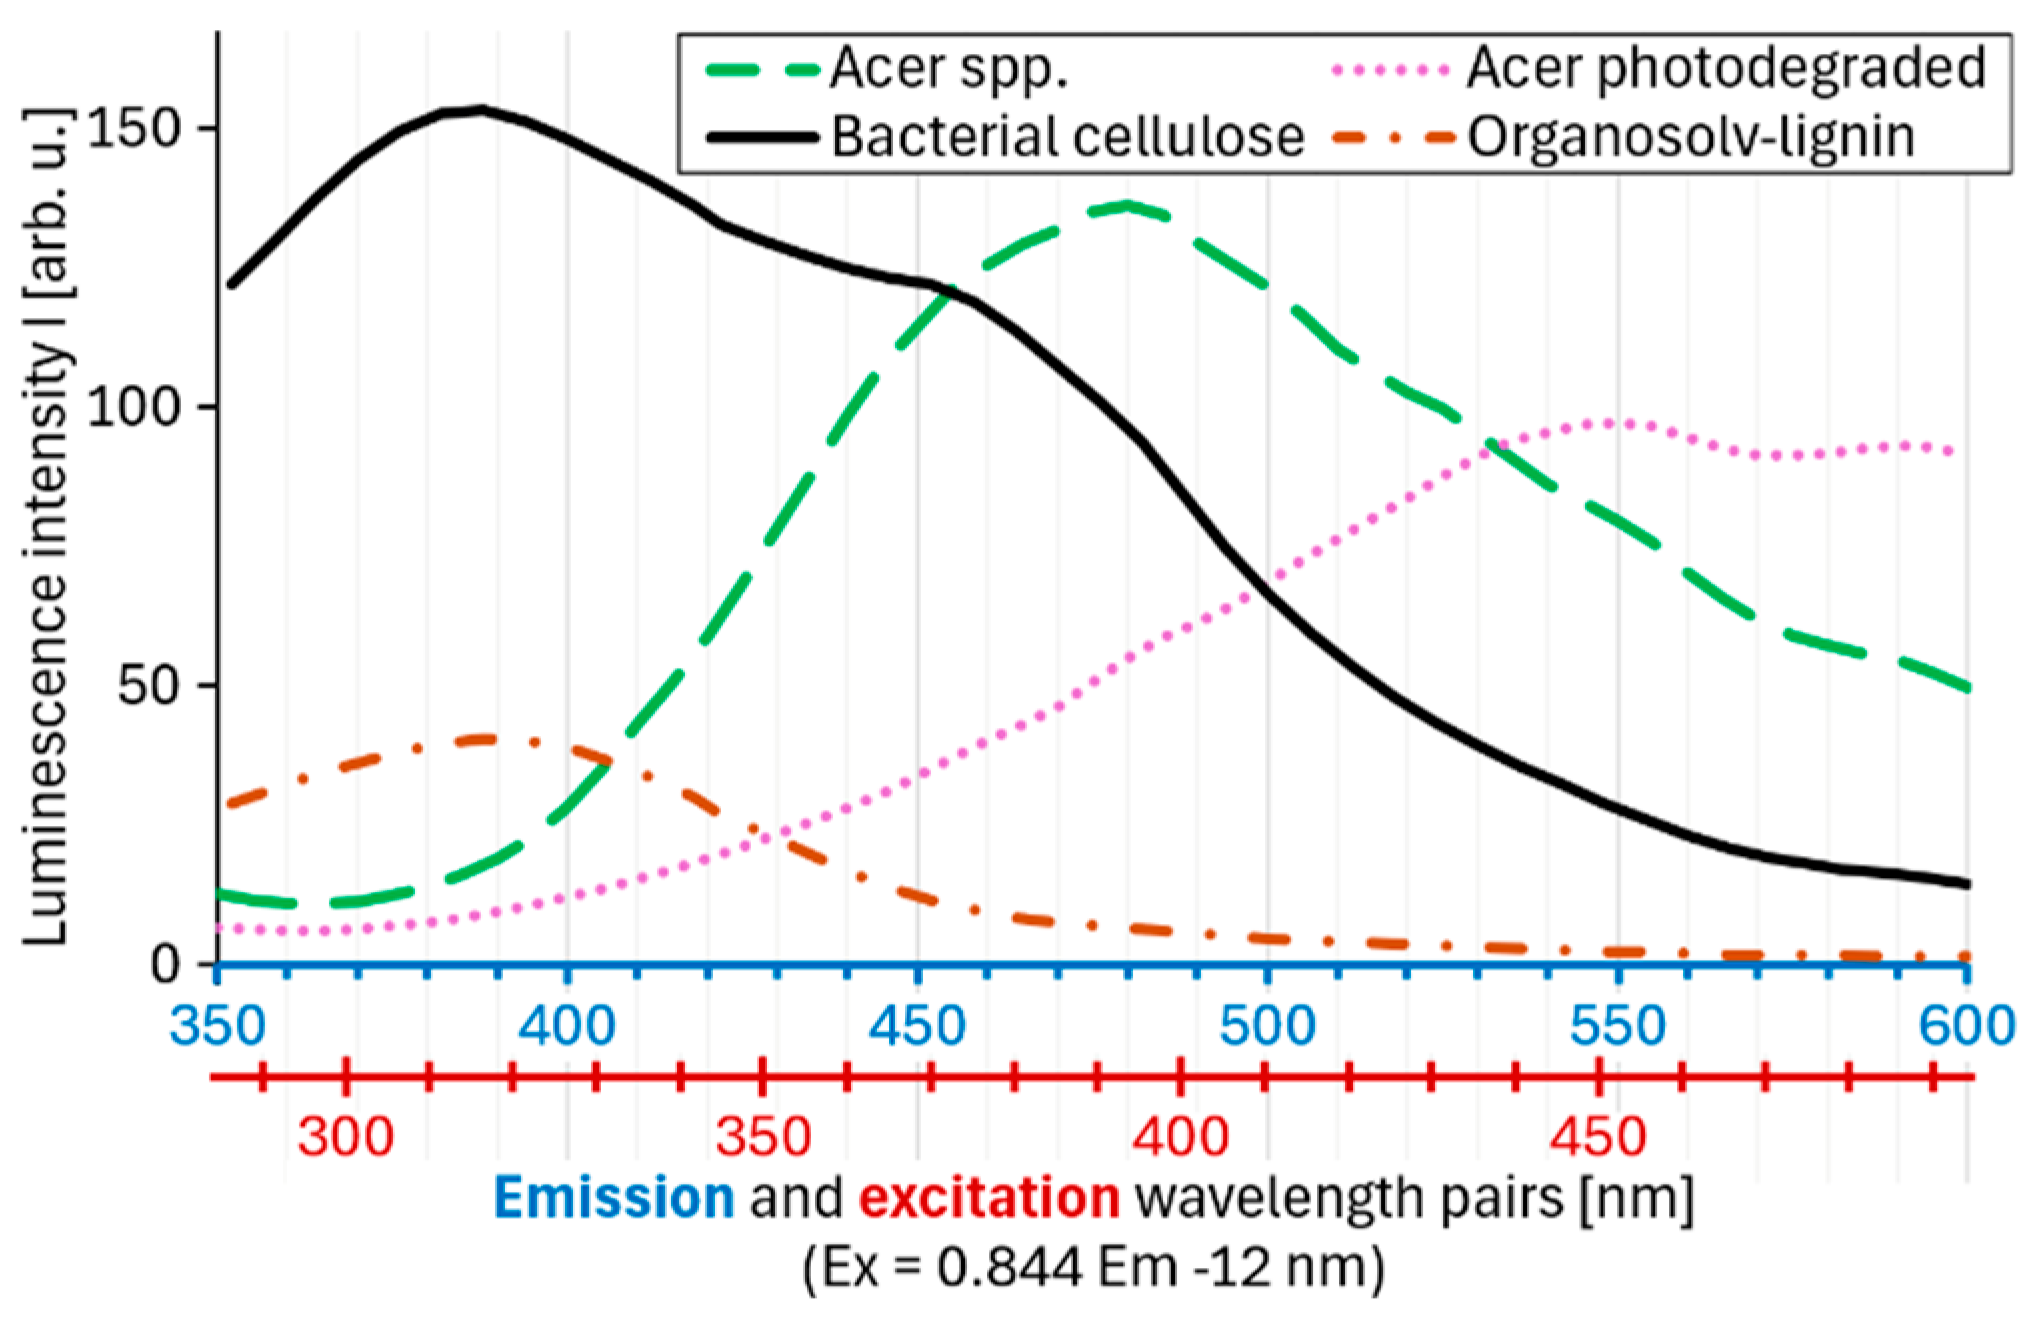
4.1. Correlation Between the Wavelengths of Excitation and Emission Maxima
4.2. Analytical Interpretation of the Peak Position on the Regression Line
4.3. Implications for Analytical Methods
- Variability in peak positions: The same substance can contribute to both short- and long-wavelength luminescence along the regression line (Figure 1), depending on its molecular environment (e.g., cellulose in pure form, in wood, or in degraded wood). This means that there is no specific peak position for one chemical compound in mixtures of clusteroluminogens.
- Reduced number of independent variables: Since the excitation and emission maxima are not independent from each other (see Equation (1)), the informative value of excitation-emission matrices (EEMs) is effectively reduced by one dimension. This decreases the specificity of EEMs when analysing clusteroluminogens.
- Violation of Kasha’s rule: Unlike conventional fluorophores, clusteroluminogens emit from multiple emissive states, resulting in excitation-dependent emission [10]. The record of one excitation and one emission spectrum does therefore not reveal the true shape of a clusteroluminescence peak.
- No linear correlation between concentration and intensity: Since clusteroluminogens emit best in a concentrated and solid state, they cannot be dissolved or diluted without affecting their emission properties.
- Faster spectra acquisition: Instead of acquiring a full EEM, excitation and emission wavelengths can be scanned simultaneously.
- Little to no sample preparation needed: Since clusteroluminogens emit best in the solid or concentrated state, clusteroluminescence enables direct measurement in front-face mode. This allows rapid and non-destructive analysis for industrial in-line and on-line applications.
5. Conclusions
Supplementary Materials
Author Contributions
Funding
Institutional Review Board Statement
Data Availability Statement
Acknowledgments
Conflicts of Interest
References
- Bresolí-Obach, R.; Castro-Osma, J.A.; Nonell, S.; Lara-Sánchez, A.; Martín, C. Polymers showing cluster triggered emission as potential materials in biophotonic applications. J. Photochem. Photobiol. C Photochem. Rev. 2024, 58, 100653. [Google Scholar] [CrossRef]
- Chatterjee, D.P.; Pakhira, M.; Nandi, A.K. Fluorescence in “Nonfluorescent” Polymers. ACS Omega 2020, 5, 30747–30766. [Google Scholar] [CrossRef]
- Sakhno, T.V.; Sakhno, Y.; Kuchmiy, S.Y. Clusteroluminescence in Organic, Inorganic, and Hybrid Systems: A Review. Theor. Exp. Chem. 2022, 58, 297–327. [Google Scholar] [CrossRef]
- Sakhno, T.V.; Sakhno, Y.E.; Kuchmiy, S.Y. Clusteroluminescence of Unconjugated Polymers: A Review. Theor. Exp. Chem. 2023, 59, 75–106. [Google Scholar] [CrossRef]
- Wang, Z.; Zhang, H.; Li, S.; Lei, D.; Tang, B.Z.; Ye, R. Recent Advances in Clusteroluminescence. Top. Curr. Chem. 2021, 379, 14. [Google Scholar] [CrossRef] [PubMed]
- Liu, B.; Chu, B.; Zhu, L.; Zhang, H.; Yuan, W.-Z.; Zhao, Z.; Wan, W.-M.; Zhang, X.-H. Clusteroluminescence: A gauge of molecular interaction. Chin. Chem. Lett. 2023, 34, 107909. [Google Scholar] [CrossRef]
- Zhao, Z.; Li, A.; Yuan, W.Z. Nonconventional Luminophores: Emission Mechanism, Regulation, and Applications. Acc. Chem. Res. 2025, 58, 612–624. [Google Scholar] [CrossRef]
- Valeur, B.; Berberan-Santos, M.N. Molecular Fluorescence: Principles and Applications, 2nd ed.; Wiley-VCH: Weinheim, Germany, 2012; ISBN 9783527650002. [Google Scholar]
- Tang, S.; Yang, T.; Zhao, Z.; Zhu, T.; Zhang, Q.; Hou, W.; Yuan, W.Z. Nonconventional luminophores: Characteristics, advancements and perspectives. Chem. Soc. Rev. 2021, 50, 12616–12655. [Google Scholar] [CrossRef]
- Tao, S.; Zhu, S.; Feng, T.; Zheng, C.; Yang, B. Crosslink-Enhanced Emission Effect on Luminescence in Polymers: Advances and Perspectives. Angew. Chem. Int. Ed Engl. 2020, 59, 9826–9840. [Google Scholar] [CrossRef]
- Tomalia, D.A.; Klajnert-Maculewicz, B.; Johnson, K.A.-M.; Brinkman, H.F.; Janaszewska, A.; Hedstrand, D.M. Non-traditional intrinsic luminescence: Inexplicable blue fluorescence observed for dendrimers, macromolecules and small molecular structures lacking traditional/conventional luminophores. Prog. Polym. Sci. 2019, 90, 35–117. [Google Scholar] [CrossRef]
- Zhang, H.; Tang, B.Z. Through-Space Interactions in Clusteroluminescence. JACS Au 2021, 1, 1805–1814. [Google Scholar] [CrossRef] [PubMed]
- Avella, T.; Dechamps, R.; Bastin, M. Fluorescence Study of 10,610 Woody Species from the Tervuren (Tw) Collection, Belgium. IAWA J./Int. Assoc. Wood Anat. 1988, 9, 346–352. [Google Scholar] [CrossRef]
- Wheeler, E.; Baas, P.; Gasson, P.E. IAWA List of Microscopic Features for Hardwood Identification. IAWA J./Int. Assoc. Wood Anat. 1989, 10, 219–332. [Google Scholar]
- Donaldson, L. Autofluorescence in Plants. Molecules 2020, 25, 2393. [Google Scholar] [CrossRef]
- Maceda, A.; Terrazas, T. Fluorescence Microscopy Methods for the Analysis and Characterization of Lignin. Polymers 2022, 14, 961. [Google Scholar] [CrossRef] [PubMed]
- Ding, Q.; Han, W.; Li, X.; Jiang, Y.; Zhao, C. New insights into the autofluorescence properties of cellulose/nanocellulose. Sci. Rep. 2020, 10, 21387. [Google Scholar] [CrossRef]
- Olmstead, J.A.; Gray, D.G. Fluorescence Spectroscopy of Cellulose, Lignin and Mechanical Pulps: A Review. J. Pulp Pap. Sci. JPPS 1997, 23, J571. [Google Scholar]
- Dou, X.; Zhou, Q.; Chen, X.; Tan, Y.; He, X.; Lu, P.; Sui, K.; Tang, B.Z.; Zhang, Y.; Yuan, W.Z. Clustering-Triggered Emission and Persistent Room Temperature Phosphorescence of Sodium Alginate. Biomacromolecules 2018, 19, 2014–2022. [Google Scholar] [CrossRef]
- Wang, D.; Ju, J.; Wang, S.; Tan, Y. Research progress on the luminescence of biomacromolecules. J. Mater. Sci. Technol. 2021, 76, 60–75. [Google Scholar] [CrossRef]
- Peters, F.B.; Rapp, A.O. Wavelength-dependent photodegradation of wood and its effects on fluorescence. Holzforschung 2021, 76, 60–67. [Google Scholar] [CrossRef]
- Peters, F.B.; Rapp, A.O. Moisture as key for understanding the fluorescence of lignocellulose in wood. Cellulose 2024, 31, 4149–4160. [Google Scholar] [CrossRef]
- Dal Fovo, A.; Cicchi, R.; Gagliardi, C.; Baria, E.; Fioravanti, M.; Fontana, R. Detecting Early Degradation of Wood Ultrastructure with Nonlinear Optical Imaging and Fluorescence Lifetime Analysis. Polymers 2024, 16, 3590. [Google Scholar] [CrossRef] [PubMed]
- Werner, T.; Pecina, H. Versuche zur Anwendung der Fluoreszenz-Spektroskopie in der Holztechnologie für die Bewertung von Pilzbefall in Holz. Holz Als Roh-Und Werkst. 1995, 53, 49–55. [Google Scholar] [CrossRef]
- Zhang, H.; Zhao, Z.; McGonigal, P.R.; Ye, R.; Liu, S.; Lam, J.W.; Kwok, R.T.; Yuan, W.Z.; Xie, J.; Rogach, A.L.; et al. Clusterization-triggered emission: Uncommon luminescence from common materials. Mater. Today 2020, 32, 275–292. [Google Scholar] [CrossRef]
- Du, L.-L.; Jiang, B.-L.; Chen, X.-H.; Wang, Y.-Z.; Zou, L.-M.; Liu, Y.-L.; Gong, Y.-Y.; Wei, C.; Yuan, W.-Z. Clustering-triggered Emission of Cellulose and Its Derivatives. Chin. J. Polym. Sci. 2019, 37, 409–415. [Google Scholar] [CrossRef]
- Xue, Y.; Qiu, X.; Wu, Y.; Qian, Y.; Zhou, M.; Deng, Y.; Li, Y. Aggregation-induced emission: The origin of lignin fluorescence. Polym. Chem. 2016, 7, 3502–3508. [Google Scholar] [CrossRef]
- Khalid, A.; Zhang, L.; Tetienne, J.-P.; Abraham, A.N.; Poddar, A.; Shukla, R.; Shen, W.; Tomljenovic-Hanic, S. Intrinsic fluorescence from cellulose nanofibers and nanoparticles at cell friendly wavelengths. APL Photonics 2019, 4, 20803. [Google Scholar] [CrossRef]
- Zhang, H.; Wang, X.; Wang, J.; Chen, Q.; Huang, H.; Huang, L.; Cao, S.; Ma, X. UV–visible diffuse reflectance spectroscopy used in analysis of lignocellulosic biomass material. Wood Sci. Technol. 2020, 54, 837–846. [Google Scholar] [CrossRef]
- Djikanović, D.; Kalauzi, A.; Radotić, K.; Lapierre, C.; Jeremić, M. Deconvolution of lignin fluorescence spectra: A contribution to the comparative structural studies of lignins. Russ. J. Phys. Chem. 2007, 81, 1425–1428. [Google Scholar] [CrossRef]
- Grönroos, P.; Bessonoff, M.; Salminen, K.; Paltakari, J.; Kulmala, S. Phosphorescence and fluorescence of fibrillar cellulose films. Nord. Pulp Pap. Res. J. 2018, 33, 246–255. [Google Scholar] [CrossRef]
- Takada, M.; Okazaki, Y.; Kawamoto, H.; Sagawa, T. Tunable Light Emission from Lignin: Various Photoluminescence Properties Controlled by the Lignocellulosic Species, Extraction Method, Solvent, and Polymer. ACS Omega 2022, 7, 5096–5103. [Google Scholar] [CrossRef]
- Kasha, M. Characterization of electronic transitions in complex molecules. Discuss. Faraday Soc. 1950, 9, 14. [Google Scholar] [CrossRef]
- Peters, F.B.; Rapp, A.O. A simple light path modifying device to reduce scattering in front-face fluorescence spectra. Methods Appl. Fluoresc. 2024, 12, 037001. [Google Scholar] [CrossRef] [PubMed]
- Auxenfans, T.; Terryn, C.; Paës, G. Seeing biomass recalcitrance through fluorescence. Sci. Rep. 2017, 7, 8838. [Google Scholar] [CrossRef] [PubMed]
- Dramićanin, T.; Lenhardt Acković, L.; Zeković, I.; Dramićanin, M.D. Detection of Adulterated Honey by Fluorescence Excitation-Emission Matrices. J. Spectrosc. 2018, 2018, 8395212. [Google Scholar] [CrossRef]
- Geng, Z.; Zhang, H.; Xiong, Q.; Zhang, Y.; Zhao, H.; Wang, G. A fluorescent chitosan hydrogel detection platform for the sensitive and selective determination of trace mercury(ii) in water. J. Mater. Chem. A 2015, 3, 19455–19460. [Google Scholar] [CrossRef]
- Gong, Y.; Tan, Y.; Mei, J.; Zhang, Y.; Yuan, W.; Zhang, Y.; Sun, J.; Tang, B.Z. Room temperature phosphorescence from natural products: Crystallization matters. Sci. China Chem. 2013, 56, 1178–1182. [Google Scholar] [CrossRef]
- Hoque, M.; Kamal, S.; Raghunath, S.; Foster, E.J. Unraveling lignin degradation in fibre cement via multidimensional fluorometry. Sci. Rep. 2023, 13, 8385. [Google Scholar] [CrossRef]
- Huang, J.; Wang, Y.-L.; Yu, X.-D.; Zhou, Y.-N.; Chu, L.-Q. Enhanced fluorescence of carboxymethyl chitosan via metal ion complexation in both solution and hydrogel states. Int. J. Biol. Macromol. 2020, 152, 50–56. [Google Scholar] [CrossRef]
- Jiang, J.; Lu, S.; Liu, M.; Li, C.; Zhang, Y.; Yu, T.B.; Yang, L.; Shen, Y.; Zhou, Q. Tunable Photoluminescence Properties of Microcrystalline Cellulose with Gradually Changing Crystallinity and Crystal Form. Macromol. Rapid Commun. 2021, 42, e2100321. [Google Scholar] [CrossRef]
- Li, M.; Li, X.; An, X.; Chen, Z.; Xiao, H. Clustering-Triggered Emission of Carboxymethylated Nanocellulose. Front. Chem. 2019, 7, 447. [Google Scholar] [CrossRef]
- Li, Q.; Wang, X.; Huang, Q.; Li, Z.; Tang, B.Z.; Mao, S. Molecular-level enhanced clusterization-triggered emission of nonconventional luminophores in dilute aqueous solution. Nat. Commun. 2023, 14, 409. [Google Scholar] [CrossRef]
- Nakamura, R.; Tanaka, Y.; Ogata, A.; Masakazu, N. Scientific evidence by fluorescence spectrometry for safflower red on ancient Japanese textiles stored in the Shosoin Treasure House repository. Stud. Conserv. 2014, 59, 367–376. [Google Scholar] [CrossRef]
- Radotić, K.; Kalauzi, A.; Djikanović, D.; Jeremić, M.; Leblanc, R.M.; Cerović, Z.G. Component analysis of the fluorescence spectra of a lignin model compound. J. Photochem. Photobiol. B Biol. 2006, 83, 1–10. [Google Scholar] [CrossRef] [PubMed]
- Bao, J.; Tong, C.; He, M.; Zhang, H. Luminescent polypeptides. Luminescence 2024, 39, e4594. [Google Scholar] [CrossRef]
- Chen, X.; Luo, W.; Ma, H.; Peng, Q.; Yuan, W.Z.; Zhang, Y. Prevalent intrinsic emission from nonaromatic amino acids and poly(amino acids). Sci. China Chem. 2018, 61, 351–359. [Google Scholar] [CrossRef]
- Komura, T.; Yamanaka, M.; Nishimura, K.; Hara, K.; Nishikawa, Y. Autofluorescence as a noninvasive biomarker of senescence and advanced glycation end products in Caenorhabditis elegans. npj Aging Mech. Dis. 2021, 7, 12. [Google Scholar] [CrossRef] [PubMed]
- Millington, K.R. Anomalous fluorescence of white hair compared to other unpigmented keratin fibres. Int. J. Cosmet. Sci. 2020, 42, 289–301. [Google Scholar] [CrossRef]
- Séro, L.; Sanguinet, L.; Blanchard, P.; Dang, B.T.; Morel, S.; Richomme, P.; Séraphin, D.; Derbré, S. Tuning a 96-well microtiter plate fluorescence-based assay to identify AGE inhibitors in crude plant extracts. Molecules 2013, 18, 14320–14339. [Google Scholar] [CrossRef]
- Xu, L.; Liang, X.; Zhong, S.; Gao, Y.; Cui, X. Clustering-Triggered Emission from Natural Products: Gelatin and Its Multifunctional Applications. ACS Sustain. Chem. Eng. 2020, 8, 18816–18823. [Google Scholar] [CrossRef]
- Zhao, J.; Feng, F.; Tsai, M.; Zeng, H.; McLean, D.; Ruvolo, E.; Kollias, N.; Lui, H. Fluorescence Excitation Emission Matrix Spectroscopy for Endogenous Skin Fluorescence Characterization. Meet. Abstr. 2010, MA2010-01, 1037. [Google Scholar] [CrossRef]
- Zhao, W.; Gao, M.; Kong, L.; Yu, S.; Zhao, C.; Chen, C. Chirality-Regulated Clusteroluminescence in Polypeptides. Biomacromolecules 2024, 25, 1897–1905. [Google Scholar] [CrossRef]
- Xie, W.; Deng, J.; Bai, Y.; Xiao, J.; Wang, H. Hydrogen-Bonding-Driven Nontraditional Photoluminescence of a β-Enamino Ester. Molecules 2023, 28, 5950. [Google Scholar] [CrossRef]
- Zhang, Q.; Mao, Q.; Shang, C.; Chen, Y.-N.; Peng, X.; Tan, H.; Wang, H. Simple aliphatic oximes as nonconventional luminogens with aggregation-induced emission characteristics. J. Mater. Chem. C 2017, 5, 3699–3705. [Google Scholar] [CrossRef]
- Chu, B.; Zhang, H.; Chen, K.; Liu, B.; Yu, Q.-L.; Zhang, C.-J.; Sun, J.; Yang, Q.; Zhang, X.-H.; Tang, B.Z. Aliphatic Polyesters with White-Light Clusteroluminescence. J. Am. Chem. Soc. 2022, 144, 15286–15294. [Google Scholar] [CrossRef] [PubMed]
- Miao, X.; Liu, T.; Zhang, C.; Geng, X.; Meng, Y.; Li, X. Fluorescent aliphatic hyperbranched polyether: Chromophore-free and without any N and P atoms. Phys. Chem. Chem. Phys. 2016, 18, 4295–4299. [Google Scholar] [CrossRef]
- Shang, C.; Wei, N.; Zhuo, H.; Shao, Y.; Zhang, Q.; Zhang, Z.; Wang, H. Highly emissive poly(maleic anhydride-alt-vinyl pyrrolidone) with molecular weight-dependent and excitation-dependent fluorescence. J. Mater. Chem. C 2017, 5, 8082–8090. [Google Scholar] [CrossRef]
- Wang, J.; Xu, L.; Zhong, S.; Yang, Y.; Feng, G.; Meng, Q.; Gao, Y.; Cui, X. Clustering-triggered emission of poly(vinyl) alcohol. Polym. Chem. 2021, 12, 7048–7055. [Google Scholar] [CrossRef]
- Zhang, Y.; Fu, Q.; Shi, W. Synthesis and intrinsic blue fluorescence study of hyperbranched poly(ester-amide-ether). Sci. China Chem. 2010, 53, 2452–2460. [Google Scholar] [CrossRef]
- Zhou, Q.; Cao, B.; Zhu, C.; Xu, S.; Gong, Y.; Yuan, W.Z.; Zhang, Y. Clustering-Triggered Emission of Nonconjugated Polyacrylonitrile. Small 2016, 12, 6586–6592. [Google Scholar] [CrossRef]
- Bavya, V.; Pillai, A.S.; Surendran, K.P.; Rajan, T.P.D.; Suresh, K.I. Fluorescent Carbon Dots from Bamboo Stem Waste: Synthesis, Characterization, and Inkjet Printing. ChemistrySelect 2024, 9, e202303346. [Google Scholar] [CrossRef]
- Wang, J.; Sahu, S.; Sonkar, S.K.; Tackett II, K.N.; Sun, K.W.; Liu, Y.; Maimaiti, H.; Anilkumar, P.; Sun, Y.-P. Versatility with carbon dots—From overcooked BBQ to brightly fluorescent agents and photocatalysts. RSC Adv. 2013, 3, 15604. [Google Scholar] [CrossRef]
- Zattar, P.; Pires, A.; de Mesquita, P.; Pereira, J.; Vargas, F. Luminescent carbon dots obtained from cellulose and their applications as sensors for metal ions. Mater. Chem. Phys. 2022, 290, 126633. [Google Scholar] [CrossRef]
- Zhu, S.; Zhang, J.; Wang, L.; Song, Y.; Zhang, G.; Wang, H.; Yang, B. A general route to make non-conjugated linear polymers luminescent. Chem. Commun. 2012, 48, 10889–10891. [Google Scholar] [CrossRef]
- Zhu, S.; Meng, Q.; Wang, L.; Zhang, J.; Song, Y.; Jin, H.; Zhang, K.; Sun, H.; Wang, H.; Yang, B. Highly photoluminescent carbon dots for multicolor patterning, sensors, and bioimaging. Angew. Chem. Int. Ed Engl. 2013, 52, 3953–3957. [Google Scholar] [CrossRef]
- Zhu, S.; Wang, L.; Zhou, N.; Zhao, X.; Song, Y.; Maharjan, S.; Zhang, J.; Lu, L.; Wang, H.; Yang, B. The crosslink enhanced emission (CEE) in non-conjugated polymer dots: From the photoluminescence mechanism to the cellular uptake mechanism and internalization. Chem. Commun. 2014, 50, 13845–13848. [Google Scholar] [CrossRef]
- McNamara, G. PubSpectra: Open Data Access Fluorescence Spectra. 2012. Available online: http://works.bepress.com/gmcnamara/9/ (accessed on 10 January 2025).
- Cory, R.M.; Miller, M.P.; McKnight, D.M.; Guerard, J.J.; Miller, P.L. Effect of instrument-specific response on the analysis of fulvic acid fluorescence spectra. Limnol. Oceangr. Methods 2010, 8, 67–78. [Google Scholar] [CrossRef]
- Girard, V.-D.; Chaussé, J.; Vermette, P. Bacterial cellulose: A comprehensive review. J. Appl. Polym. Sci. 2024, 141, e55163. [Google Scholar] [CrossRef]
- Fengel, D.; Wegener, G. Wood: Chemistry, Ultrastructure, Reactions; Kessel: Remagen, Germany, 2003; ISBN 3935638396. [Google Scholar]
- Watkinson, S.C.; Eastwood, D.C. Serpula lacrymans, Wood and Buildings. Adv. Appl. Microbiol. 2012, 78, 121–149. [Google Scholar] [CrossRef]
- Evans, P.D. Weathering of Wood and Wood Composites. In Handbook of Wood Chemistry and Wood Composites, 2nd ed.; Rowell, R.M., Ed.; CRC Press: Boca Raton, FA, USA, 2013; pp. 151–216. ISBN 9781439853801. [Google Scholar]
- Niyangoda, C.; Miti, T.; Breydo, L.; Uversky, V.; Muschol, M. Carbonyl-based blue autofluorescence of proteins and amino acids. PLoS ONE 2017, 12, e0176983. [Google Scholar] [CrossRef]
- Tarekegne, A.T.; Janting, J.; Ou, H. Strong visible-light emission in annealed poly(acrylic acid). Opt. Mater. Express 2020, 10, 3424. [Google Scholar] [CrossRef]
- Kollias, N.; Gillies, R.; Moran, M.; Kochevar, I.E.; Anderson, R.R. Endogenous skin fluorescence includes bands that may serve as quantitative markers of aging and photoaging. J. Investig. Dermatol. 1998, 111, 776–780. [Google Scholar] [CrossRef] [PubMed]
- Beisswenger, P.J.; Howell, S.; Mackenzie, T.; Corstjens, H.; Muizzuddin, N.; Matsui, M.S. Two fluorescent wavelengths, 440(ex)/520(em) nm and 370(ex)/440(em) nm, reflect advanced glycation and oxidation end products in human skin without diabetes. Diabetes Technol. Ther. 2012, 14, 285–292. [Google Scholar] [CrossRef]
- Morales, F.; van Boekel, M. A study on advanced Maillard reaction in heated casein/sugar solutions. Int. Dairy J. 1997, 7, 675–683. [Google Scholar] [CrossRef]
- Risum, A.B.; Bevilacqua, M.; Li, C.; Engholm-Keller, K.; Poojary, M.M.; Rinnan, Å.; Lund, M.N. Resolving fluorescence spectra of Maillard reaction products formed on bovine serum albumin using parallel factor analysis. Food Res. Int. 2024, 178, 113950. [Google Scholar] [CrossRef]
- Shi, T.; Xu, L.; Wang, Y.-N.; Liu, S.-C.; Liu, Z.-H.; Zhao, G.-J.; Li, B.-Z.; Yuan, Y.-J. Aminated and amidated structures introduced by ethylenediamine pretreatment endow lignin with bright fluorescence. Green Chem. 2022, 24, 9040–9054. [Google Scholar] [CrossRef]
- Wang, J.; Wang, J.; Xiao, W.; Geng, Z.; Tan, D.; Wei, L.; Li, J.; Xue, L.; Wang, X.; Zhu, J. Lignin-derived red-emitting carbon dots for colorimetric and sensitive fluorometric detection of water in organic solvents. Anal. Methods 2020, 12, 3218–3224. [Google Scholar] [CrossRef]
- Liu, X.; Chu, B.; Xiong, Z.; Liu, B.; Tu, W.; Zhang, Z.; Zhang, H.; Sun, J.Z.; Zhang, X.; Tang, B.Z. Heteroatom-facilitated blue to near-infrared emission of nonconjugated polyesters. Mater. Horiz. 2024, 11, 1579–1587. [Google Scholar] [CrossRef]
- Chu, B.; Liu, X.; Xiong, Z.; Zhang, Z.; Liu, B.; Zhang, C.; Sun, J.Z.; Yang, Q.; Zhang, H.; Tang, B.Z.; et al. Enabling nonconjugated polyesters emit full-spectrum fluorescence from blue to near-infrared. Nat. Commun. 2024, 15, 366. [Google Scholar] [CrossRef]
- Hou, X.; Xu, J.; Zhou, P.; Dai, L.; Zhang, J.; Xiao, X.; Huo, K. A shining transmutation of lignin into multicolor carbon dots via the dynamic solvent-fractionation engineering. Chem. Eng. J. 2023, 478, 147363. [Google Scholar] [CrossRef]
- Wang, R.; Xia, G.; Zhong, W.; Chen, L.; Chen, L.; Wang, Y.; Min, Y.; Li, K. Direct transformation of lignin into fluorescence-switchable graphene quantum dots and their application in ultrasensitive profiling of a physiological oxidant. Green Chem. 2019, 21, 3343–3352. [Google Scholar] [CrossRef]
- Liukko, S.; Tasapuro, V.; Liitiä, T. Fluorescence spectroscopy for chromophore studies on bleached kraft pulps. Holzforschung 2007, 61, 509–515. [Google Scholar] [CrossRef]
- He, B.; Zhang, J.; Zhang, J.; Zhang, H.; Wu, X.; Chen, X.; Kei, K.H.S.; Qin, A.; Sung, H.H.Y.; Lam, J.W.Y.; et al. Clusteroluminescence from Cluster Excitons in Small Heterocyclics Free of Aromatic Rings. Adv. Sci. 2021, 8, 2004299. [Google Scholar] [CrossRef]
- Ye, R.; Liu, Y.; Zhang, H.; Su, H.; Zhang, Y.; Xu, L.; Hu, R.; Kwok, R.T.K.; Wong, K.S.; Lam, J.W.Y.; et al. Non-conventional fluorescent biogenic and synthetic polymers without aromatic rings. Polym. Chem. 2017, 8, 1722–1727. [Google Scholar] [CrossRef]
- Zhao, Z.; Cai, Y.; Zhang, Q.; Li, A.; Zhu, T.; Chen, X.; Yuan, W.Z. Photochromic luminescence of organic crystals arising from subtle molecular rearrangement. Nat. Commun. 2024, 15, 5054. [Google Scholar] [CrossRef] [PubMed]
- Dhillon, A.K.; Barman, S.; Siddhanta, S. Unravelling the Mechanism of Cluster-Triggered Emission in Carboxy Nanocellulose and Modulation through the Conjugation of Plasmonic Nanoparticles for Analyte Detection. J. Phys. Chem. C 2025, 129, 6502–6510. [Google Scholar] [CrossRef]
- Zhao, E.; Lam, J.W.Y.; Meng, L.; Hong, Y.; Deng, H.; Bai, G.; Huang, X.; Hao, J.; Tang, B.Z. Poly[(maleic anhydride)-alt-(vinyl acetate)]: A Pure Oxygenic Nonconjugated Macromolecule with Strong Light Emission and Solvatochromic Effect. Macromolecules 2015, 48, 64–71. [Google Scholar] [CrossRef]
- Lai, Y.; Zhao, Z.; Zheng, S.; Yuan, W.Z. Polymorphism-Dependent Emission of Nonaromatic Luminophores. Acta Chim. Sin. 2021, 79, 93. [Google Scholar] [CrossRef]
- Bro, R. PARAFAC. Tutorial and applications. Chemom. Intell. Lab. Syst. 1997, 38, 149–171. [Google Scholar] [CrossRef]
- Murphy, K.R.; Stedmon, C.A.; Graeber, D.; Bro, R. Fluorescence spectroscopy and multi-way techniques. PARAFAC. Anal. Methods 2013, 5, 6557. [Google Scholar] [CrossRef]
- Murphy, K.R.; Stedmon, C.A.; Wenig, P.; Bro, R. OpenFluor—An online spectral library of auto-fluorescence by organic compounds in the environment. Anal. Methods 2014, 6, 658–661. [Google Scholar] [CrossRef]
- Schneide, P.-A.; Bro, R.; Gallagher, N.B. Shift-invariant tri-linearity—A new model for resolving untargeted gas chromatography coupled mass spectrometry data. J. Chemom. 2023, 37, e3501. [Google Scholar] [CrossRef]


| Factor | Shift | Substance | Ref. | |
|---|---|---|---|---|
| Chemical changes in the structural heterogeneity | Thermal ageing | Red | Proteins | [74] |
| Thermal degradation (200 to 400 °C) | Red | Poly (acrylic acid) | [75] | |
| Ageing by lifetime and photoageing | Red | Skin (mouse) | [76] | |
| Glycation (Maillard reaction) and oxidation | Red | Proteins, advanced glycation end products | [77,78,79] | |
| Photodegradation | Red | Wood | [21] | |
| Introduction of amino groups into an oxygenic clustering system | Red | Lignin | [80,81] | |
| Introduction of N and S atoms into an oxygenic clustering system | Red | Aliphatic polyesters | [82,83] | |
| Hydrothermal treatment | Red | Lignin | [84,85] | |
| Increased variety of monomers used for copolymerisation | Red | Dehydrogenated polymer from 100% coniferyl alcohol compared to 50% coniferyl alc. with 50% sinapyl alc. | [35] | |
| H2O2 bleaching (=reduction of carbonyl groups) | Blue | Mechanical pulp | [17,86] | |
| Removal of impurities | Blue | Dithiosuccinimide | [87] | |
| Changes in interactions between existing cluster entities | Change of secondary structure (helix to straight to planar folded) | Red | Aliphatic polyesters | [56] |
| Increase in degree of polymerisation | Red | Poly (maleic anhydride-alt-vinyl pyrrolidone) | [58] | |
| Increase in degree of polymerisation | Red | Oligo-L-alanine vs. poly-L-alanine | [88] | |
| Reversible molecular rearrangement (by light) | Red | Dimethyl terephthalate | [89] | |
| Ball milling from nanofibers to particles | Red | Cellulose nanofibers and nanoparticles | [28] | |
| Increase in pH (maximum Em at pH10) | Red | Carboxy-nanocellulose | [90] | |
| Transfer to solvents with electron-rich atoms | Red | Poly (maleic anhydride-alt-vinyl acetate) | [91] | |
| Crystallisation from different solvent (polymorph) | Red/Blue | Furan-maleic anhydride and furan-maleimide | [92] | |
| Dissolution of solids | Blue | Rice, starch, cellulose | [38] | |
| Dissolution of solids | Blue | Gelatin | [53] | |
| Dissolution of solids | Blue | Maleimide and succinimide | [87] | |
| Dissolution of solids | Blue | Aliphatic polyesters | [56] | |
| Steam explosion | Blue | Various lignocellulosics | [35] | |
| Moisture swelling | Blue | Pinus sylvestris wood | [22] |
Disclaimer/Publisher’s Note: The statements, opinions and data contained in all publications are solely those of the individual author(s) and contributor(s) and not of MDPI and/or the editor(s). MDPI and/or the editor(s) disclaim responsibility for any injury to people or property resulting from any ideas, methods, instructions or products referred to in the content. |
© 2025 by the authors. Licensee MDPI, Basel, Switzerland. This article is an open access article distributed under the terms and conditions of the Creative Commons Attribution (CC BY) license (https://creativecommons.org/licenses/by/4.0/).
Share and Cite
Peters, F.B.; Rapp, A.O. A Wavelength Rule for the Analysis of Clusteroluminescence. Polymers 2025, 17, 1908. https://doi.org/10.3390/polym17141908
Peters FB, Rapp AO. A Wavelength Rule for the Analysis of Clusteroluminescence. Polymers. 2025; 17(14):1908. https://doi.org/10.3390/polym17141908
Chicago/Turabian StylePeters, Frank B., and Andreas O. Rapp. 2025. "A Wavelength Rule for the Analysis of Clusteroluminescence" Polymers 17, no. 14: 1908. https://doi.org/10.3390/polym17141908
APA StylePeters, F. B., & Rapp, A. O. (2025). A Wavelength Rule for the Analysis of Clusteroluminescence. Polymers, 17(14), 1908. https://doi.org/10.3390/polym17141908