Article

Effect of Build Orientation on Surface Finish and Hydrodynamic Stability of Inkjet 3D-Printed Microfluidic Channels

1
Department of Electrical Electronic and Computer Science Engineering, University of Catania, Via Santa Sofia 64, 95125 Catania, Italy
2
Department of Civil Engineering and Architecture, University of Catania, Via Santa Sofia 64, 95125 Catania, Italy
3
Department of Chemical Sciences, University of Catania, Viale A. Doria 6, 95125 Catania, Italy
*
Authors to whom correspondence should be addressed.
These authors contributed equally to this work.
Polymers 2025, 17(13), 1864; https://doi.org/10.3390/polym17131864
Submission received: 30 May 2025 / Revised: 21 June 2025 / Accepted: 1 July 2025 / Published: 3 July 2025
(This article belongs to the Section Polymer Analysis and Characterization)

Abstract

This study examined the effect of build orientation on the surface finish of micro-optofludic (MoF) devices fabricated via a polydimethylsiloxane (PDMS)-based 3D-printing primary–secondary fabrication protocol, where an inkjet 3D-printing technique was implemented. The molds (i.e., primaries) for fabricating the MoF devices were 3D-printed in two orientations: along X Y (Dev-1) and across Y X (Dev-2) the printhead direction. Next, the surface finish was characterized using a profilometer to acquire the primary profile of the surface along the microchannel’s edge. The results indicated that the build orientation had a strong influence on the latter, since Dev-1 displayed a tall and narrow Gaussian distribution for a channel width of 398.43 ± 0.29 µm; Dev-2 presented a slightly lower value of 393.74 ± 1.67 µm, characterized by a flat and broader distribution, highlighting greater variability due to more disruptive, orthogonally oriented, and striated patterns. These results were also confirmed by hydrodynamically testing the two MoF devices with an air–water slug flow process. A large experimental study was conducted by analyzing the mean period trend in the slug flow with respect to the imposed flow rate and build orientation. Dev-1 showed greater sensitivity to flow rate changes, attributed to its smoother, more consistent microchannel geometry. The slightly narrower average channel width in Dev-2 contributed to increased flow velocity at the expense of having worse discrimination capability at different flow rates. This study is relevant for optimizing 3D-printing strategies for the fabrication of high-performance microfluidic devices, where precise flow control is essential for applications in biomedical engineering, chemical processing, and lab-on-a-chip systems. These findings highlight the effect of microchannel morphology in tuning a system’s sensitivity to flow rate modulation.

1. Introduction

Additive manufacturing (AM) is a fabrication process for producing 3D objects from 3D model data, i.e., CAD (computer-aided design) [1], by adding material layer-by-layer until the object is completed [2,3,4]. In accordance with the ASTM F2792-12a standard [5], AM processes are classified into seven categories according to their operating principle [6] and present different properties in terms of resolution, accuracy, manufacturing rate, porosity, implemented materials, mechanical features, and so on. AM techniques have been used to create final products with custom shapes quickly, accurately, and consistently, even those with a high degree of geometry complexity [7,8,9,10]. Among the existing AM techniques, in the material jetting (MJ) process, tiny droplets of liquid material are sprayed layer-by-layer onto a surface and then hardened using UV light. This process allows for producing highly detailed and accurate parts, making it particularly suitable for applications that require precision and fine features [11,12,13]. In microfluidic device fabrication, material jetting offers several key advantages. Its high resolution and smooth surface finish are ideal for creating tiny channels that guide fluid flow. MJ 3D printing is also valuable in the production of molds for primary–secondary applications [14,15]. It allows for the rapid creation of detailed and complex mold geometries without the need for traditional machining. This speeds up the prototyping process, reduces manufacturing costs [16], and has a precision that produces high-quality molds that can be used to replicate parts with great accuracy. However, it must be taken into account that the quality of the manufactured product, such as the surface finish consistency, is affected by several process factors: building part orientation, part location on the building platform, printhead positioning gantry velocity, printhead movements, nozzle tip, and so on [17,18,19,20]. However, only few studies have been carried out to understand how these parameters affect the surface finish of functional parts manufactured via MJ 3D printing. While these studies have investigated how the layer thickness [21,22], the part build orientation [21,23,24,25,26,27,28], the finish type or build style (matte or glossy) [21,22,23,25,27], the size of the part [25], and the implemented post-processing protocol [25] influence the part’s surface roughness or mechanical properties, to the best of our knowledge, no mention has been made regarding the final functionality in terms of the hydrodynamic behavior properties of slug flow in micro-optofluidic (MoF) devices fabricated via the MJ 3D printing of polydimethylsiloxane (PDMS)-based primary–secondary approach.
Microfluidic systems have emerged as powerful platforms for precise fluid manipulation at the microscale, enabling advancements in chemical synthesis [14,29], biological analysis [30], and medical diagnostics [31,32]. Among the various flow regimes observed in microchannels, slug flow is particularly advantageous due to its wide employment in real-world multiphase flow applications, including heat transfer and micromixing systems [33], droplet-based microfluidics [34], lab-on-a-chip (LoC) systems [35], and microreactors [36]. The slug flow regime in microfluidic channels is characterized by alternating segments (slugs) of immiscible liquids or gas [37,38,39,40]. However, morphological irregularities within the microchannels can disrupt the consistent formation and spacing of these slugs [41,42]. When inkjet 3D printing is used to fabricate microfluidic structures, it can introduce layer lines and surface textures that vary depending on the print path and build orientation [43,44]. These striated surface patterns directly influence the resulting surface finish, playing a significant role in influencing the slug flow behavior within microfluidic channels. In particular, when the layer lines are aligned parallel to the flow direction, they tend to create smoother flow paths with less disruption to slug integrity and motion. In contrast, when the layer lines are orthogonal to the flow direction, they act as periodic surface ridges, resulting in jagged channel walls, bends, sudden expansions or contractions, and non-uniform cross-sections [45]. These can induce flow resistance and promote disturbances that can lead to premature slug breakup or coalescence. These directional surface textures alter local hydrodynamics and interfacial interactions, ultimately affecting slug length, velocity, and formation frequency [46,47].
In this context, the novelty of this study is investigating for the first time how build orientation impacts the surface finish and the hydrodynamic slug flow stability in micro-optofluidic (MoF) devices manufactured using a PDMS-based primary–secondary fabrication process, in which the primaries are produced via inkjet 3D printing. Two build orientations were considered: one aligned with the X Y plane (Dev-1) and another across the Y X plane (Dev-2) relative to the printhead direction. The surface finish was characterized by using profilometry to obtain the primary surface profile along the microchannel edge. Furthermore, the hydrodynamic behavior of the two devices was evaluated by means of optical signal acquisition under an air–water slug flow regime through an extensive experimental campaign, analyzing how slug flow periodicity varied with flow rate and build orientation. A key advantage of the proposed approach lies in its reliance on optical signal acquisition, which enables the high-frequency monitoring of slug flow dynamics. This method allows for the precise and non-invasive mapping of evolving multiphase structures and their interactions within the microchannel, providing valuable insights into transient phenomena. Together, these findings underscore the importance of microchannel morphology and having a monitoring methodology for tuning a system’s sensitivity to flow rate modulation.
This paper is organized as follows: Section 2 discusses the materials and methodologies, including the materials employed (Section 2.1), the MoF device design, working principles, the manufacturing protocol (Section 2.2), the methodologies used for the surface finish quality assessment (Section 2.3 and Section 2.4) and its effect on hydrodynamic slug flow stability (Section 2.5). The results are discussed in Section 3, while the conclusions and future developments are presented in Section 4.

2. Materials and Methods

2.1. Materials

The mold for the polydimethylsiloxane (PDMS) casting was fabricated using a photopolymer VeroWhitePlus RGD835 (OVERMACH S.p.A., Parma, Italy), a proprietary blend of acrylate monomers and photoactivators. The PDMS used for device fabrication was SYLGARD™184 Silicone Elastomer kit (Dow Corning, Midland, MI, USA), consisting of a base and curing agent, purchased from Farnell Italia S.R.L. (Milan, Italy).

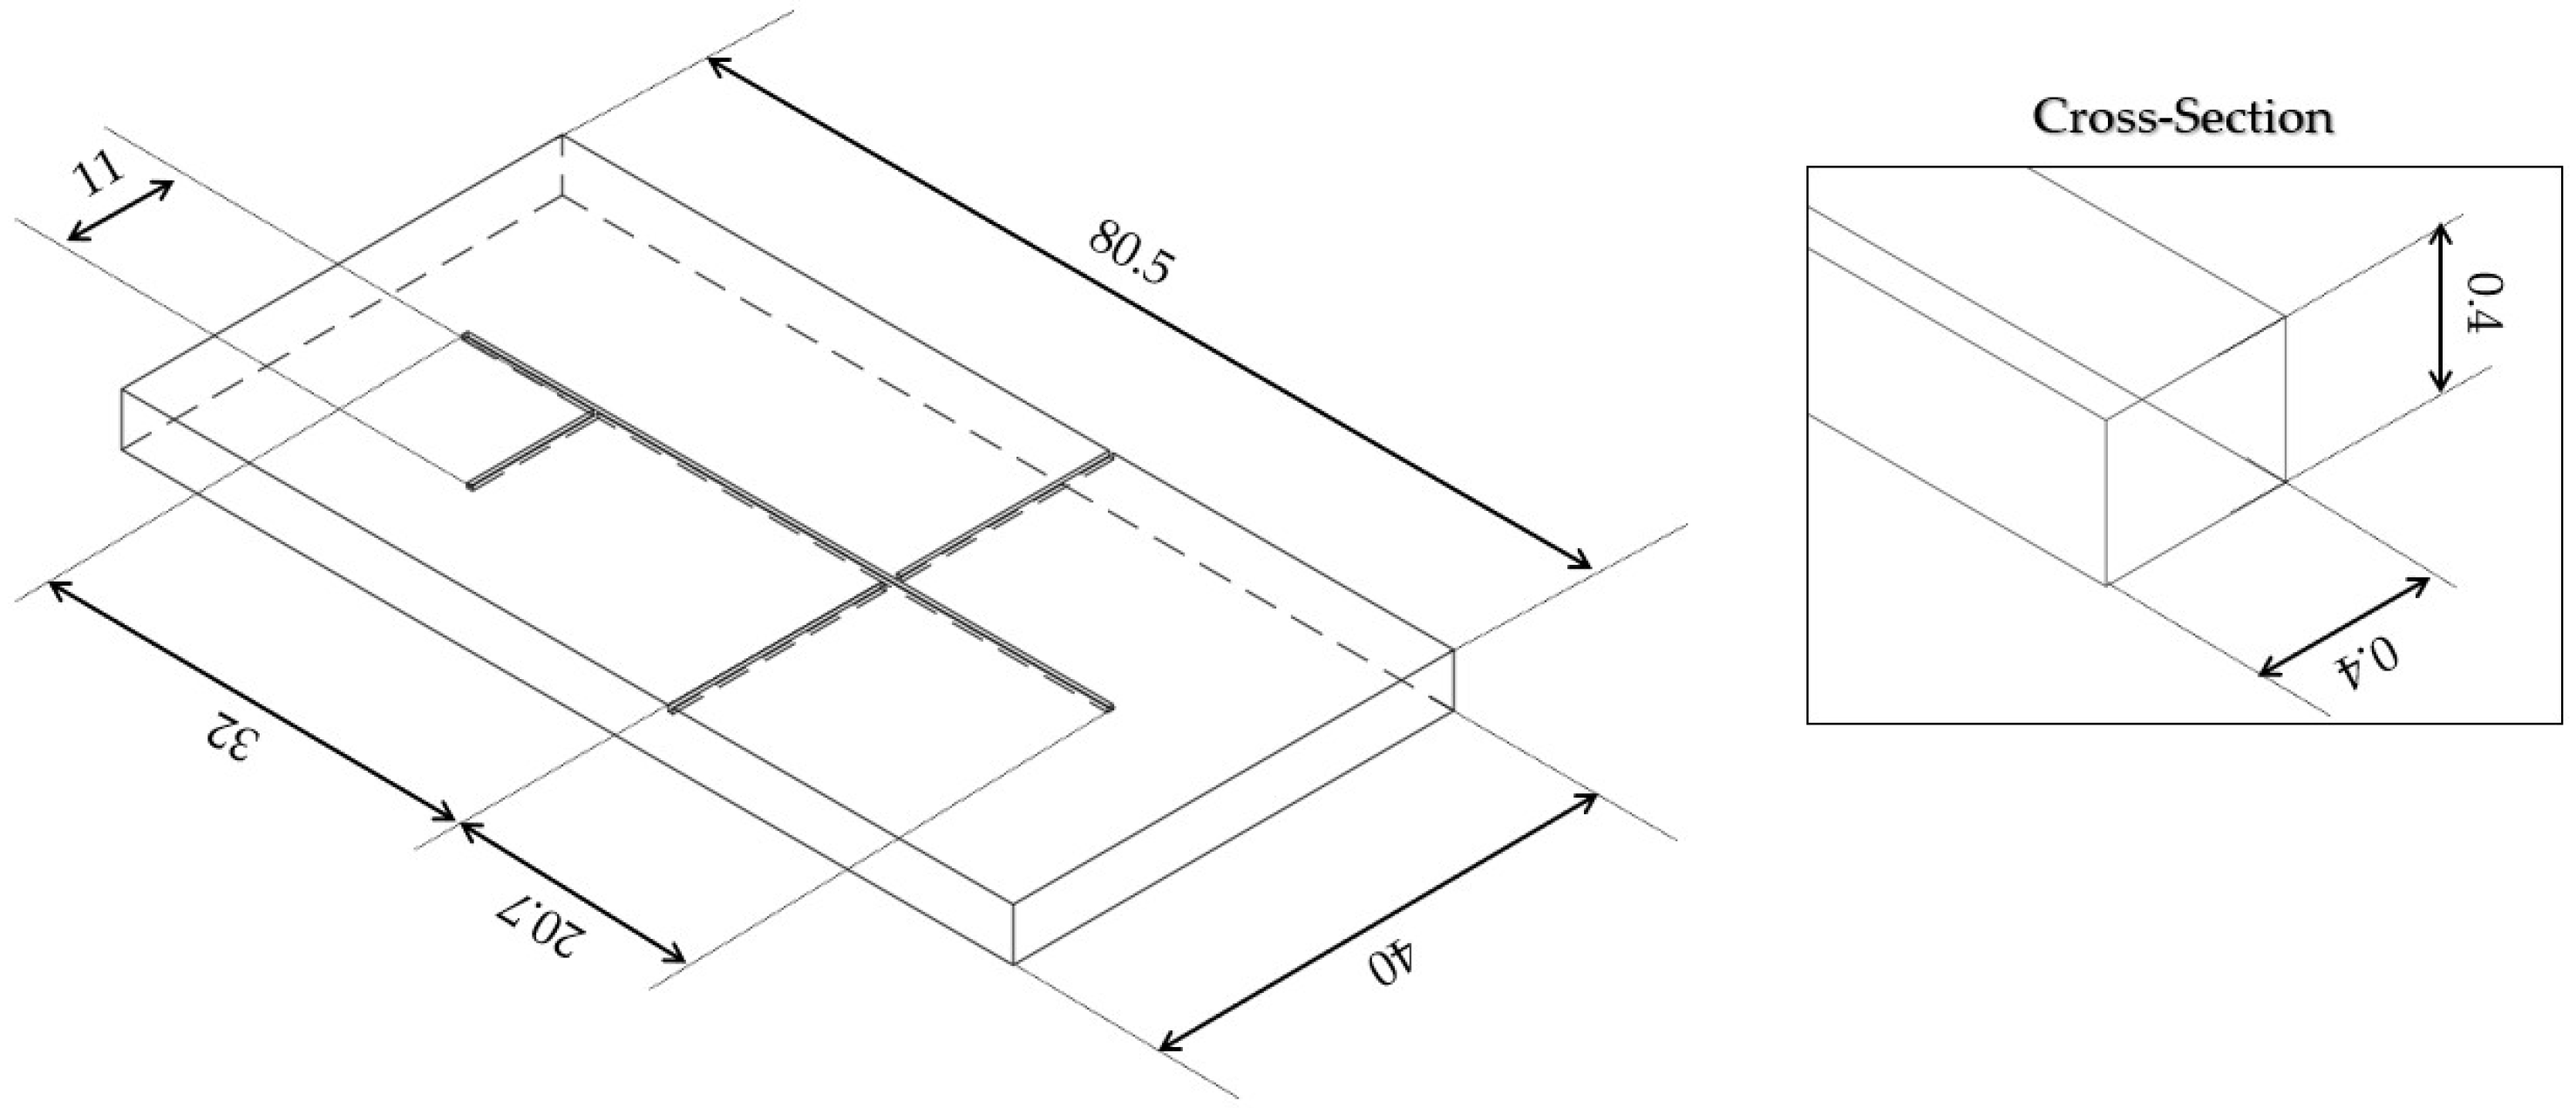
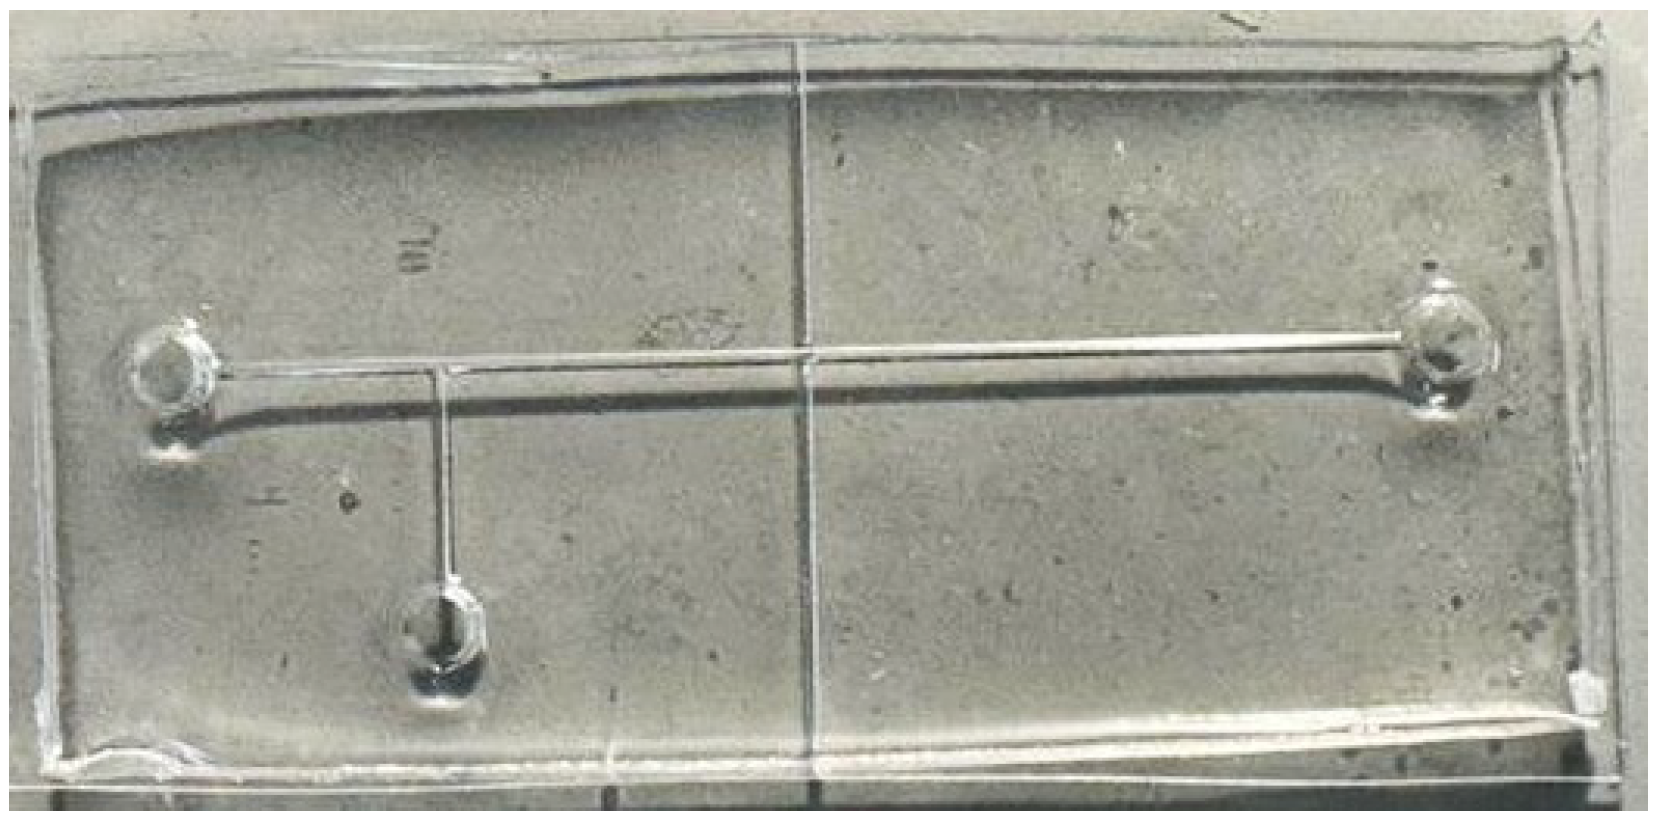
2.2. MoF Device: Design, Working Principle, and Manufacturing Protocol

The two micro-optofluidic (MoF) devices investigated in this study featured a T-junction formed by two intersecting microchannels, enabling the generation of the slug flow. The setup included two inlets for introducing fluids into the microchannel and a single outlet for their discharge. An actuation optical fiber was inserted into the device to direct a light beam toward the region of interest within the microchannel. As the light interacted with the alternating fluids in the slug flow, the resulting optical signals were collected by a detection optical fiber positioned on the opposite side of the channel (see Figure 1).
The MoF device was designed to detect slug flow composed of immiscible fluids, operating based on the principles of light absorption. The interaction between the incident laser beam and each fluid depends on the fluid’s refractive index, which influences the amount of light transmitted. As a result, the detected optical signal varies in amplitude, depending on the interacting fluid at a given moment. Specifically, the signal exhibits a square-wave pattern, with two distinct levels corresponding to the two different fluids in the slug flow.
The MoF devices were fabricated using PDMS through a primary–secondary approach based on inkjet 3D printing, described in detail elsewhere [14,40]. Briefly, the fabrication process followed a multi-step workflow: (i.) mold design in Autodesk®Fusion 360 (v.2.0.17721) software; (ii.) slicing and G-code generation with Objet Studio T M software (v.9.2.11.6825); (iii.) mold fabrication using a PolyJet 3D printer. The 3D printer was a Stratasys Objet260 Connex1 (Stratasys, Los Angeles, CA, USA). PDMS was prepared by mixing the silicone elastomer base and curing agent in a 10:1 ratio for the device layer and a 5:1 ratio for the cover layer, which was then degassed, poured into the mold, and cured at room temperature for 48 h. The cured parts were demolded and bonded using a reversible process, with both surfaces plasma-treated for 3 min using a Plasma Bonding Pen (Elveflow, Paris, France) to enhance adhesion. The final bonded device is shown in Figure 2.

2.3. Quality Control of Consistency of MoF Device’s Surface Finish

Although the settings used for the printing profile for the mold manufacturing ensured the optimum surface roughness results (as confirmed in previous studies [26]), in terms of smooth surface finish and fine detail resolution, the final outcome was not entirely free from surface artifacts. In fact, due to the layer-by-layer deposition process and the nature of using multiple inkjet printheads, a wave-like pattern or striated surface patterns are often observed on the surfaces of printed objects [48]. When a microchannel is 3D-printed, this surface waviness due to inkjet head layering (known as an artifact in this 3D-printing technique), when properly combined with its build orientation, may significantly affect its final dimensional accuracy. Thus, when a microchannel is oriented parallel to the direction of printhead travel (i.e., along the X-axis), the printhead deposits material along the length of the channel. This orientation tends to provide superior dimensional accuracy and surface consistency, as the channel structure is printed in continuous, uninterrupted passes. Since each pass of the printhead aligns with the channel axis, the chances of errors caused by inter-pass misalignment or swath boundaries are reduced. As a result, the sidewalls along the channel length are smoother, and the channel maintains a more uniform cross-section. Conversely, orienting a microchannel orthogonally (i.e., along the Y-axis) to the printhead movement introduces several dimensional challenges. In this case, the printhead must create the channel by interleaving multiple swaths, each slightly offset. The resulting surface can exhibit visible striations or ridges, potentially causing asymmetry in the channel cross-section.
To examine how the mold build orientation affected the surface consistency of the MoF device’s microchannels, the following procedure was implemented:
  • Step 1. Definition of mold manufacturing. Two different molds were 3D-printed: the 1st one with the microchannel oriented along ( X Y ) the printing head direction (see Figure 3a), named Dev-1; the 2nd one with the microchannel oriented across ( Y X ) the printing head direction (see Figure 3b), named Dev-2.
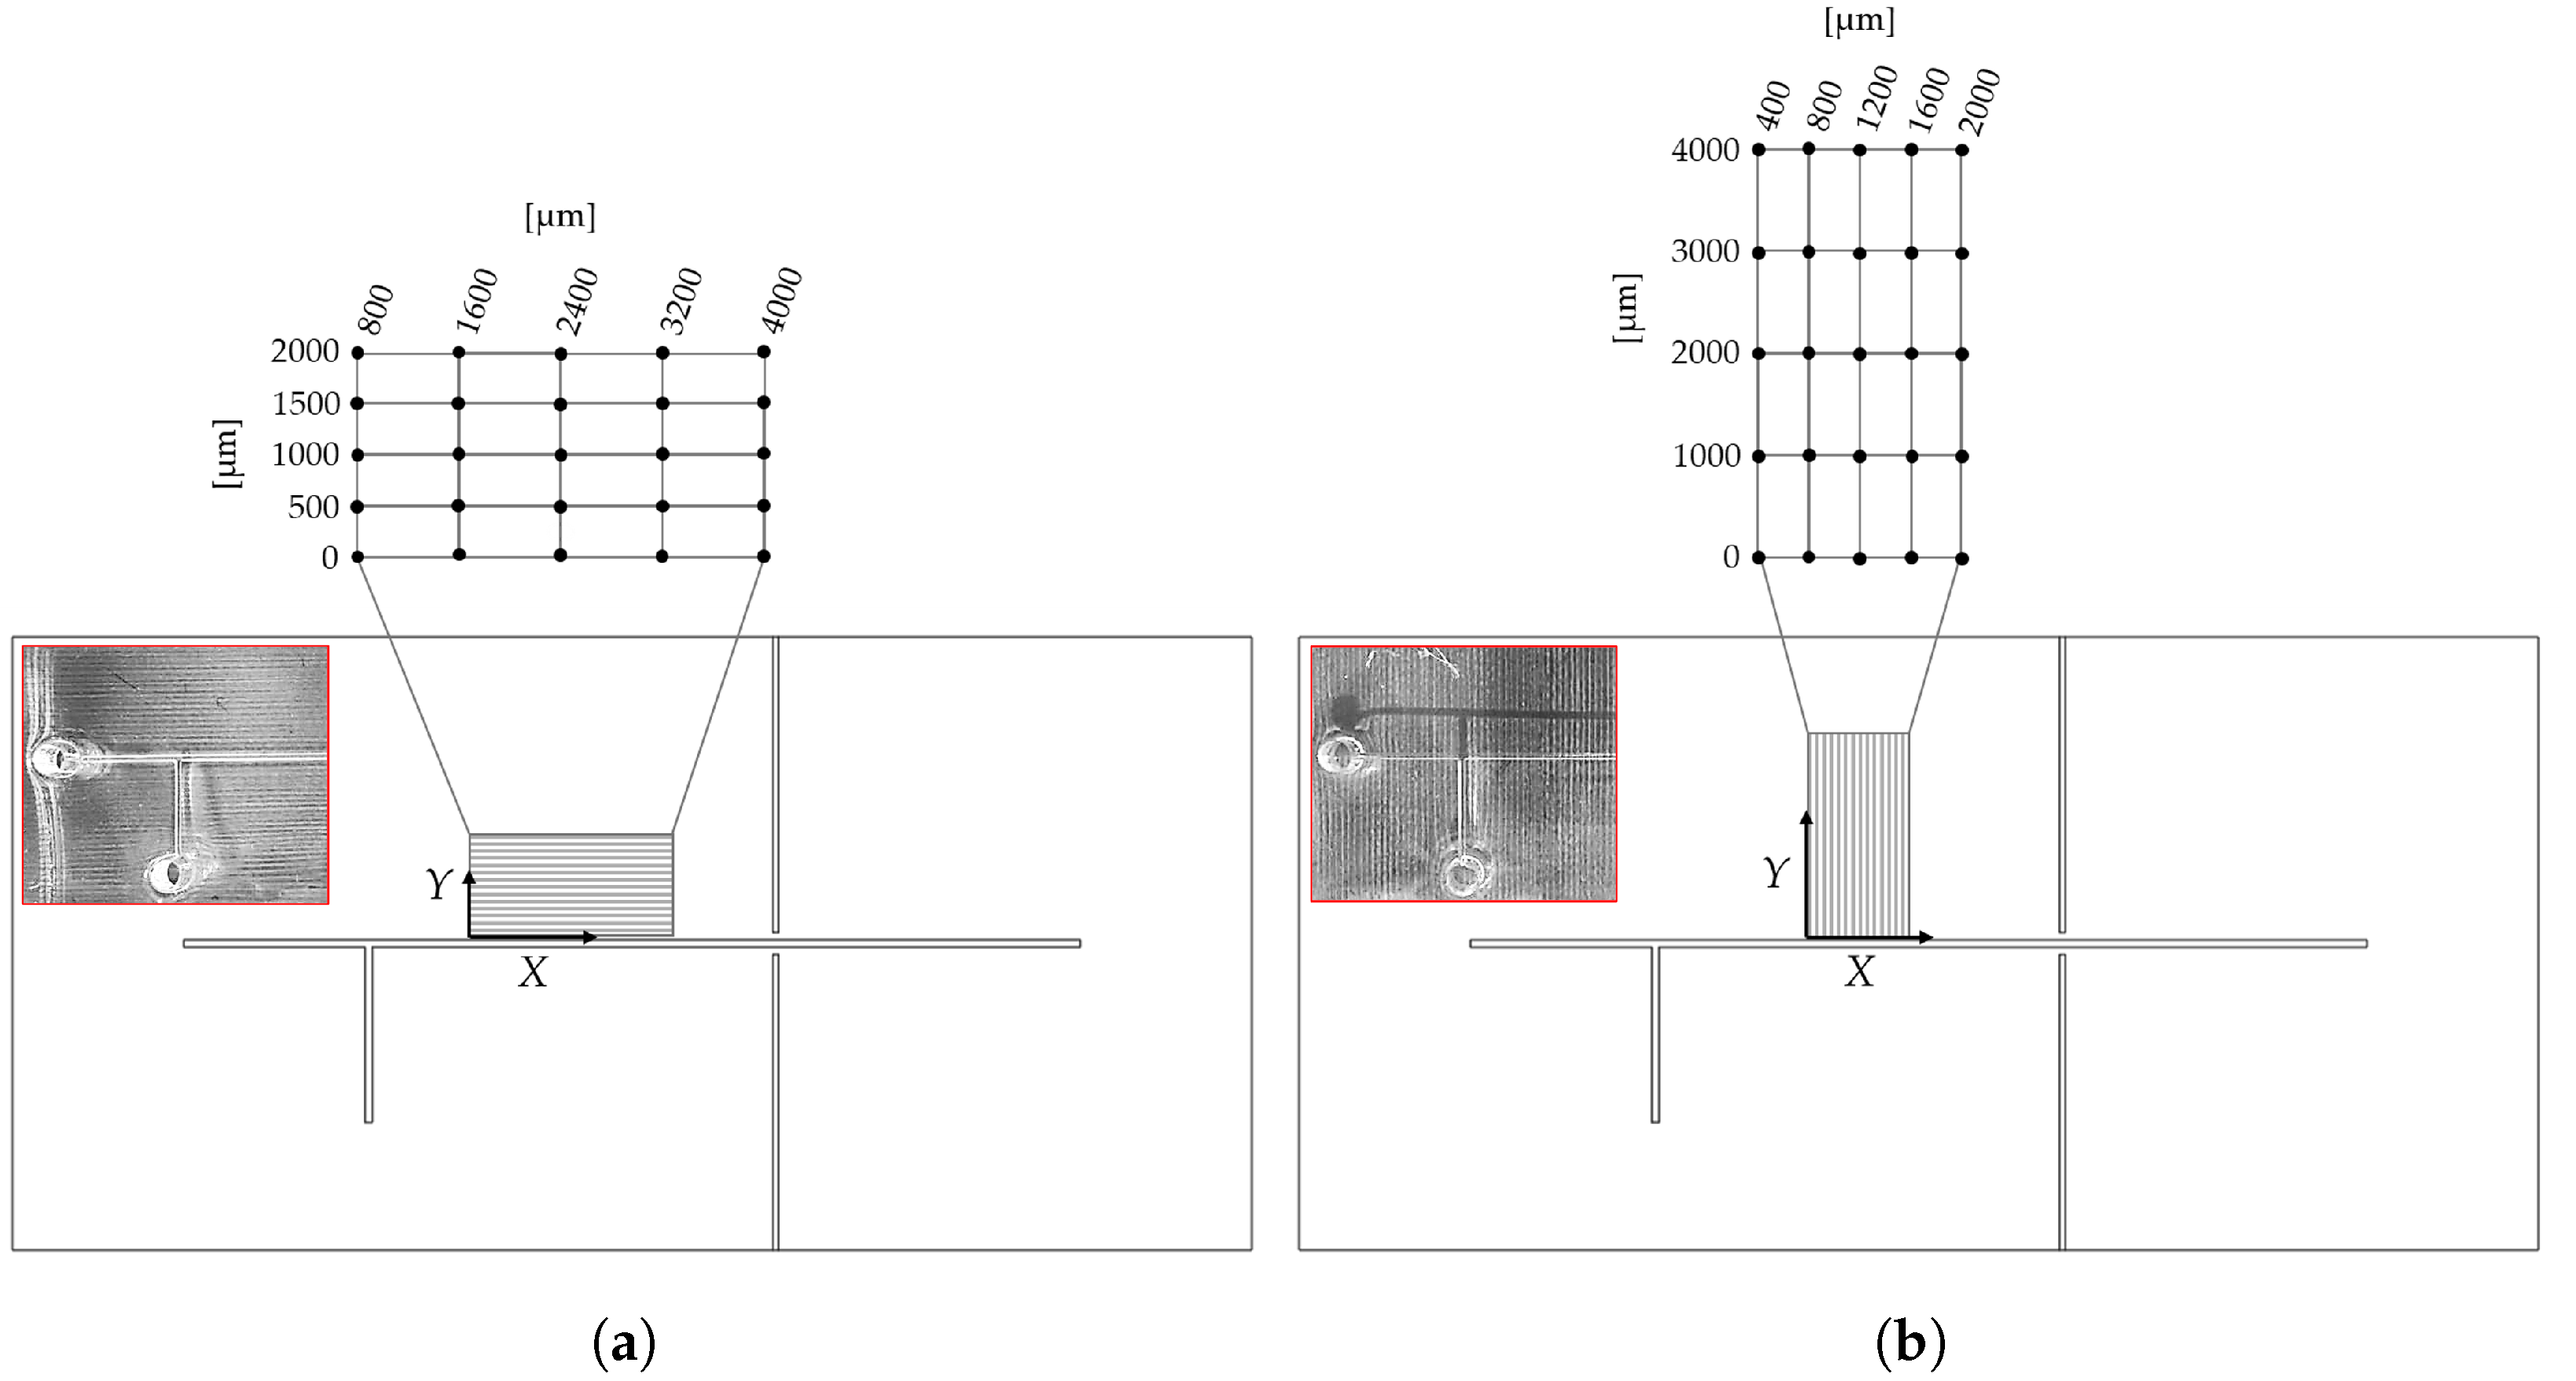
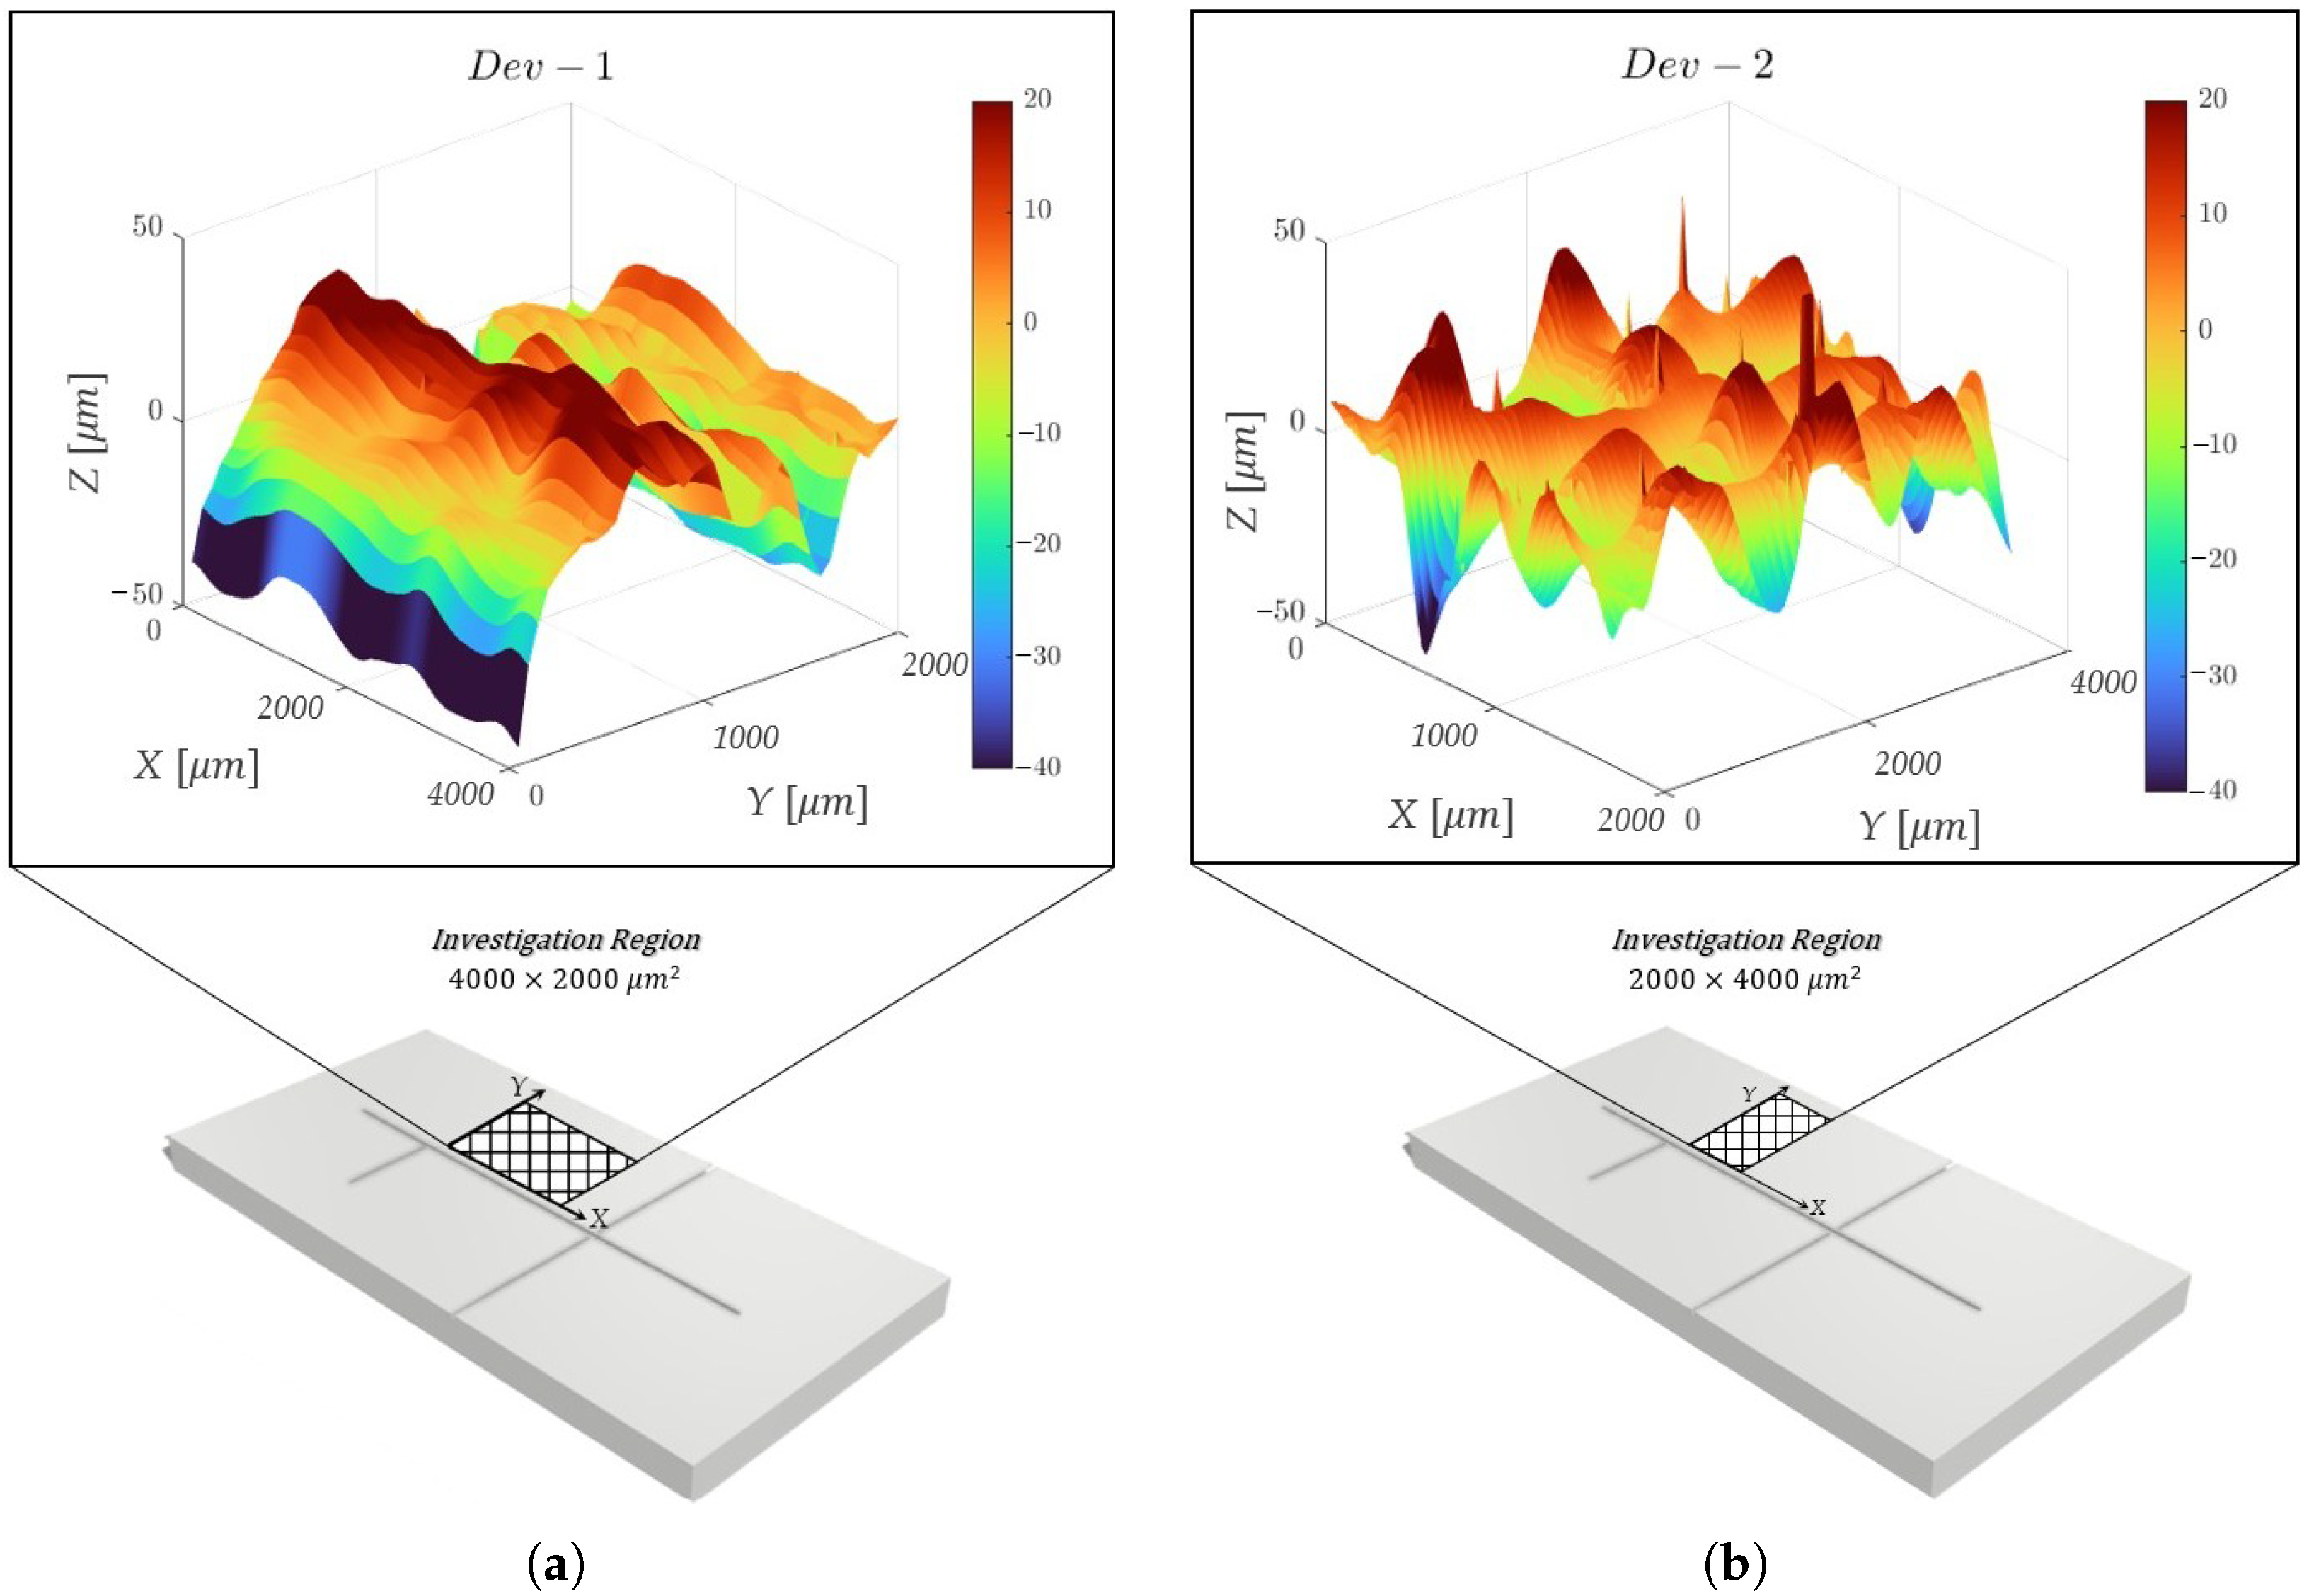
  • Step 2. Observation collection. For each 3D-printed mol, the primary profile was acquired by using a KLA Tencor®P-7 Stylus Profiler (Gambetti, Milan, Italy) at a scan speed of 200 µm/s, an X resolution of 4 µm, and a Y resolution of 50.5 µm. For each mold a surface of 2000 × 4000 µ m 2 , oriented as represented in Figure 4a,b for Dev-1 and Dev-2, respectively, was mapped.
  • Step 3. ANOVA study. For each 3D-printed mold, the surface consistency was examined as follows: a replicated general factorial design was studied by means of a third-order model (p-value < 0.0001), which was the most significant from the sequential model’s sum of squares (Type I) test, with the aim of finding a suitable approximation for the true functional relationship between the primary profile and the set of independent variables. In detail, the investigated factors (independent variables) for the experimental design are reported below:
    -
    X Coordinates (factor A)—numerical factor varied among five different levels ( a = 5 ) corresponding to { 800 ; 1600 ; 2400 ; 3200 ; 4000 } µm for Dev-1 and { 400 ; 800 ; 1200 ; 1600 ; 2000 } µm for Dev-2.
    -
    Y Coordinates (factor B)—numerical factor varied among five different levels ( b = 5 ) corresponding to { 0 ; 500 ; 1000 ; 1500 ; 2000 } µm for Dev-1 and { 0 ; 1000 ; 2000 ; 3000 ; 4000 } µm for Dev-2.
    The number of replications was fixed at n = 5 , for a total number of N = a × b × n = 125 experimental runs. The investigated response (dependent variable) for the experimental plan was the height (expressed in [µm]) related to the acquired primary profile. Once the observations for the latter response were collected, a further analysis of variance (ANOVA) was performed to examine the statistical significance of each investigated factor together with their potential interaction. The experimental plans are reported in Table 1 and Table 2 for Dev-1 and Dev-2, respectively. It was necessary to consider two different experimental plans for the two devices, since the used profilometer was characterized by two diverse resolutions along X and Y.

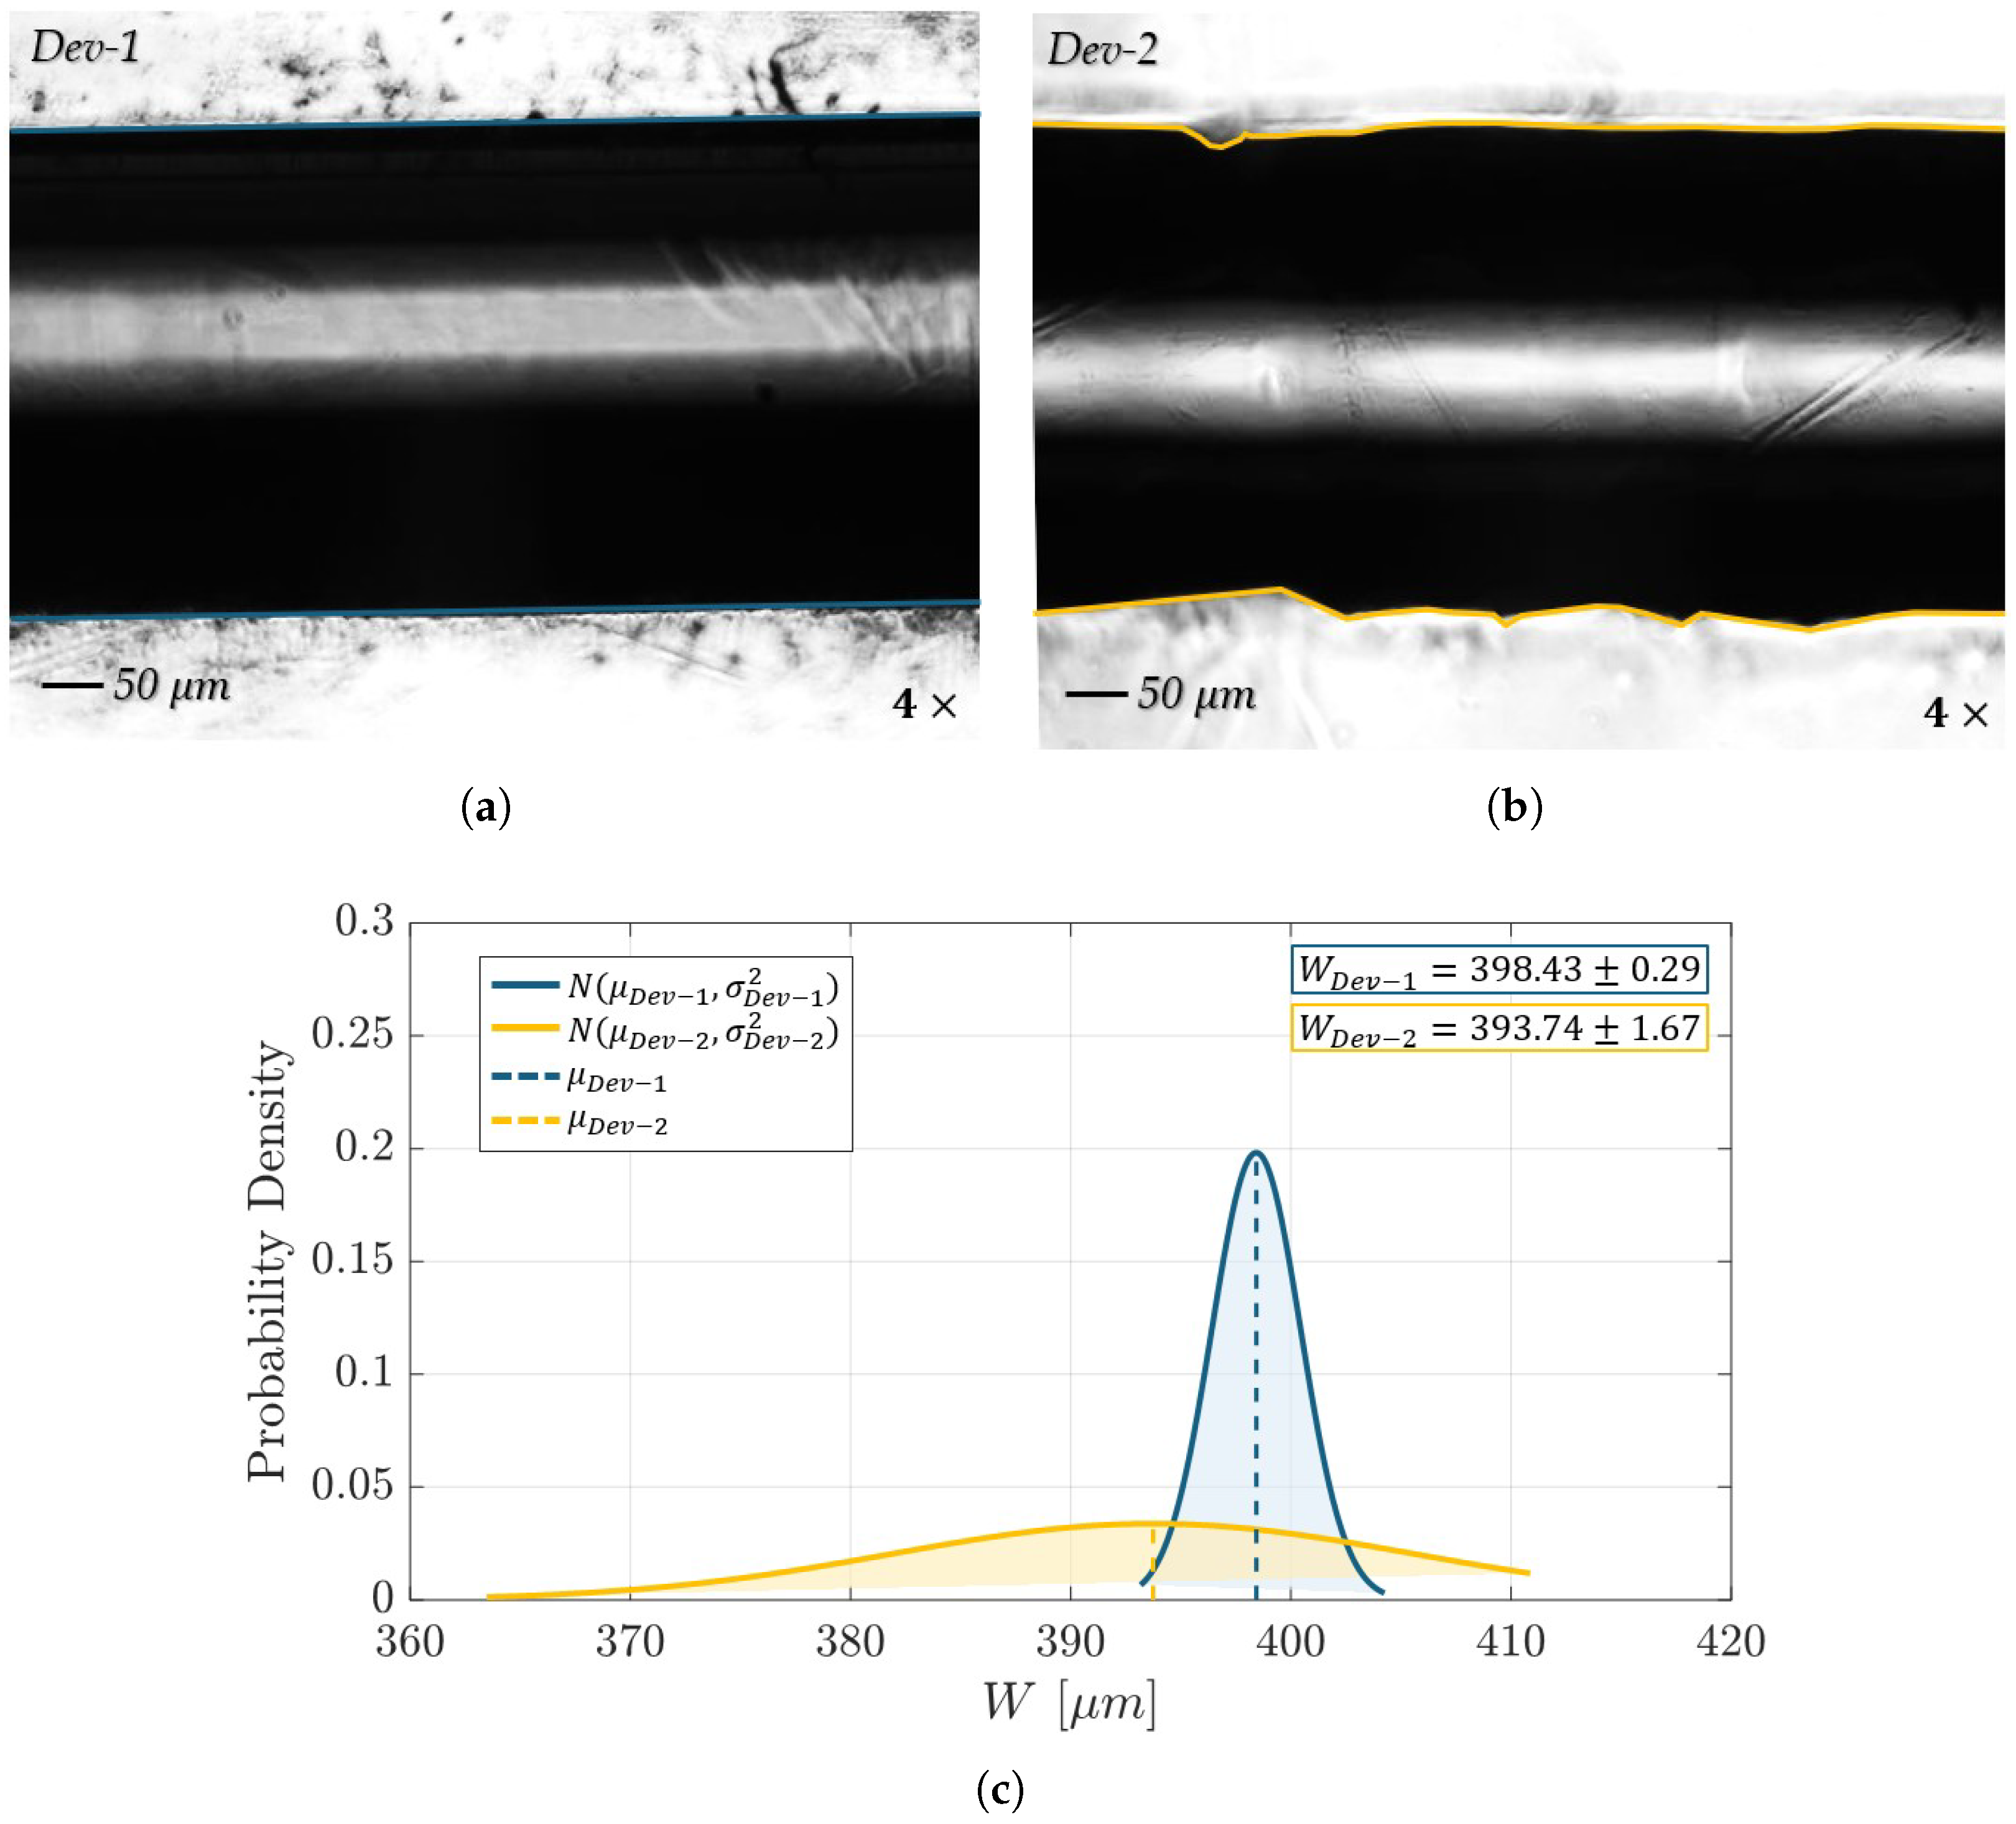
2.4. Morphological Analysis: Optical Microscopy

The optical micrographs of both the Dev-1 and Dev-2 microchannels were acquired using an Optika IM-300 optical Microscope (Optika, Ponteranica, Italy) in the bright-field observation mode, which was equipped with a WD pre-centered condenser (N.A. 0.30 , W.D. 72 mm) and a 4× magnification objective lens (PLN, Olympus, Tokyo, Japan). Furthemore, a CCD camera (340M Fast Frame, Thorlabs, Newton, NJ, USA) with a resolution of 640 pixels × 480 pixels (pixel size of 7.4 µm, square) was used to acquire the optical images by connecting the camera to the PC by means of a USB. The optical microscope setup is shown in Figure 5.

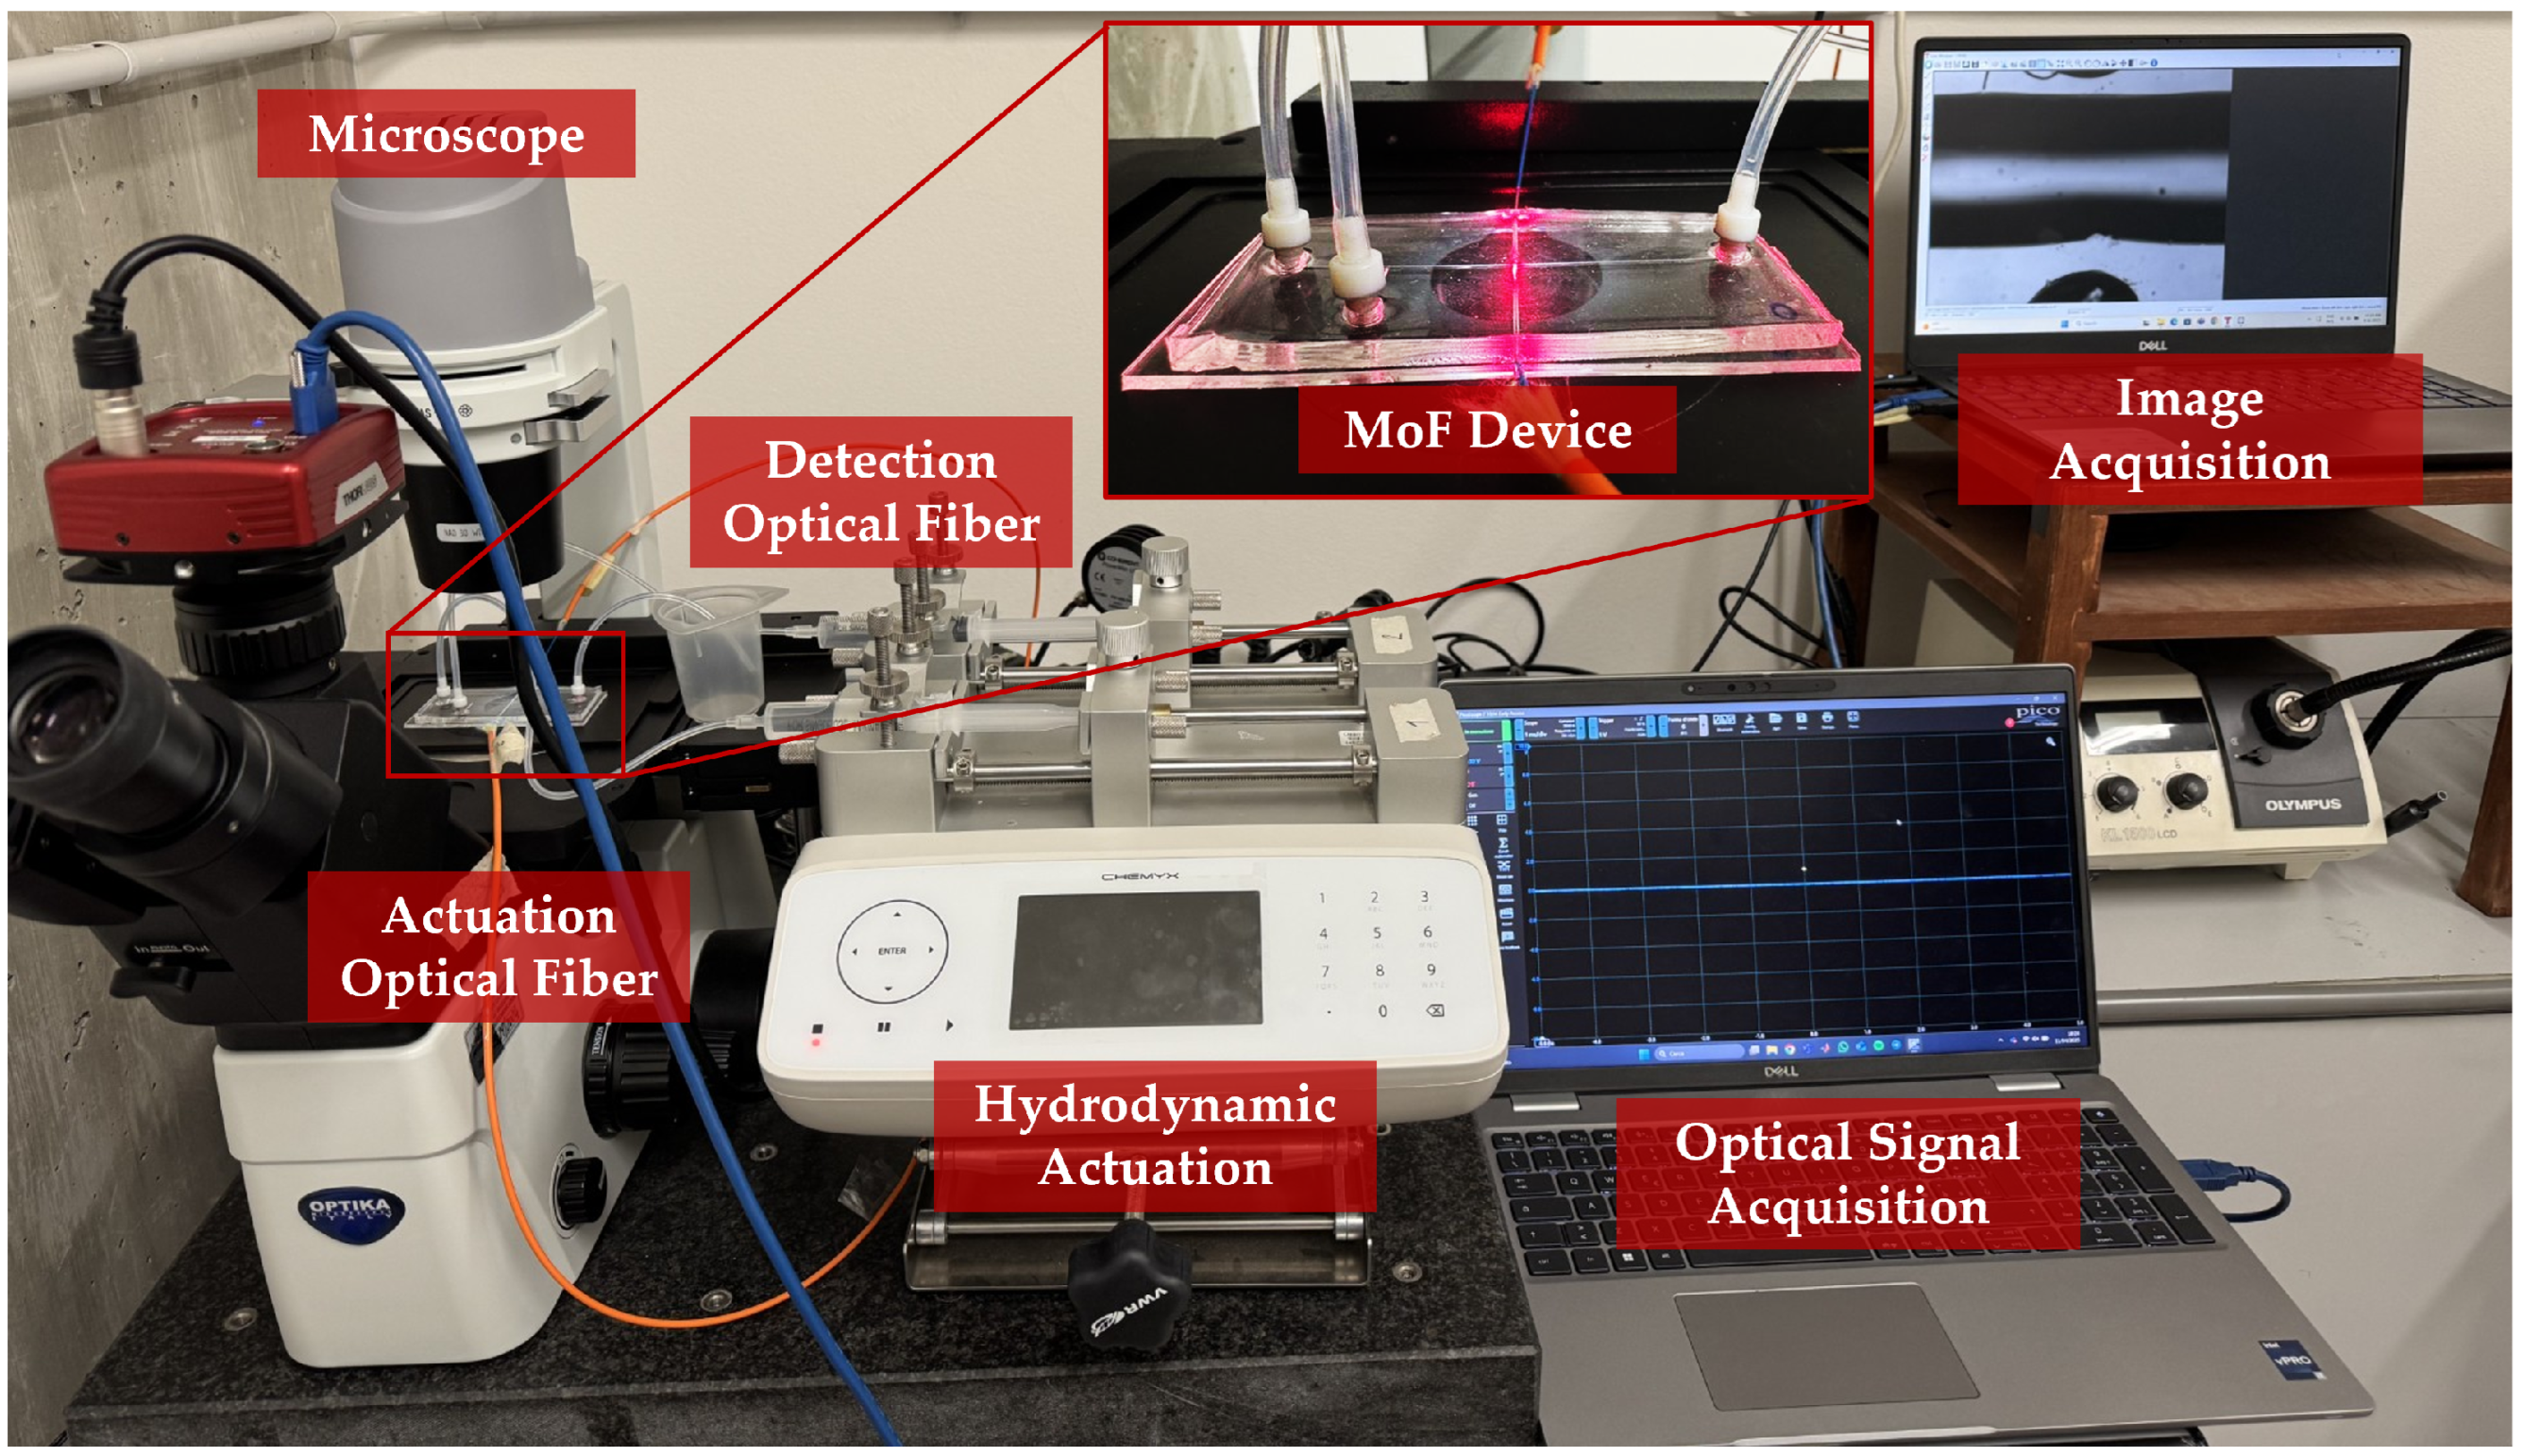
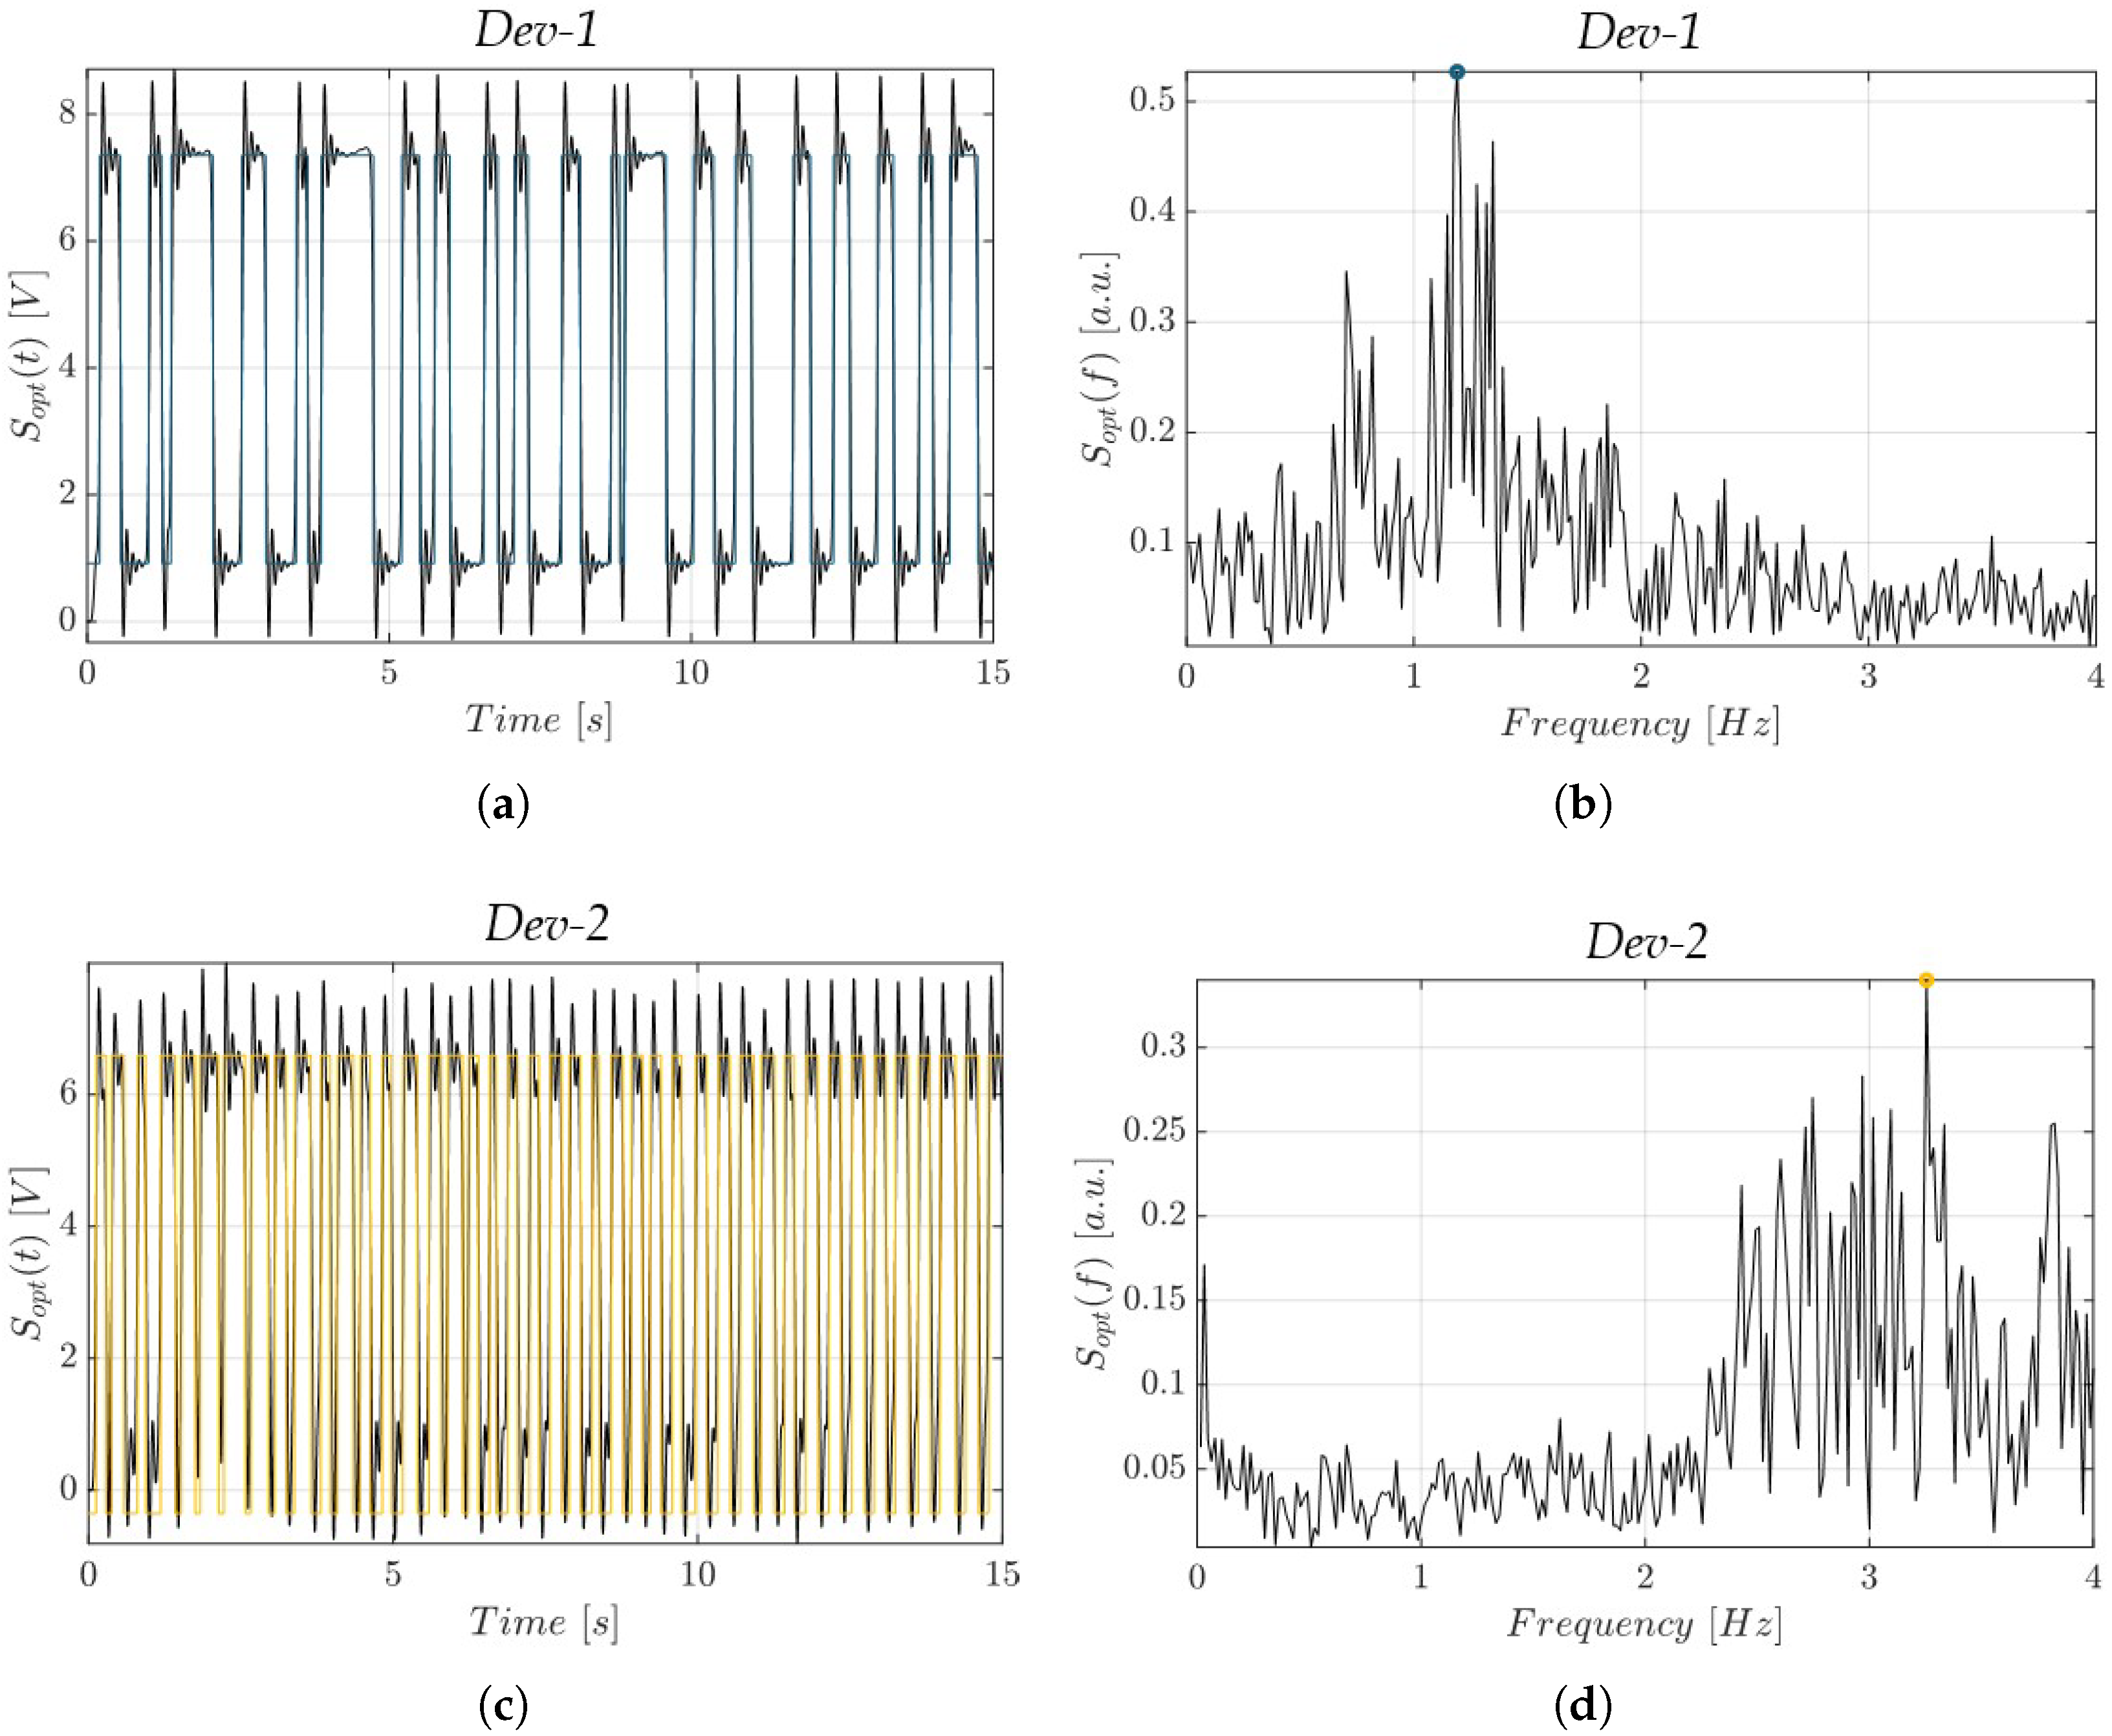
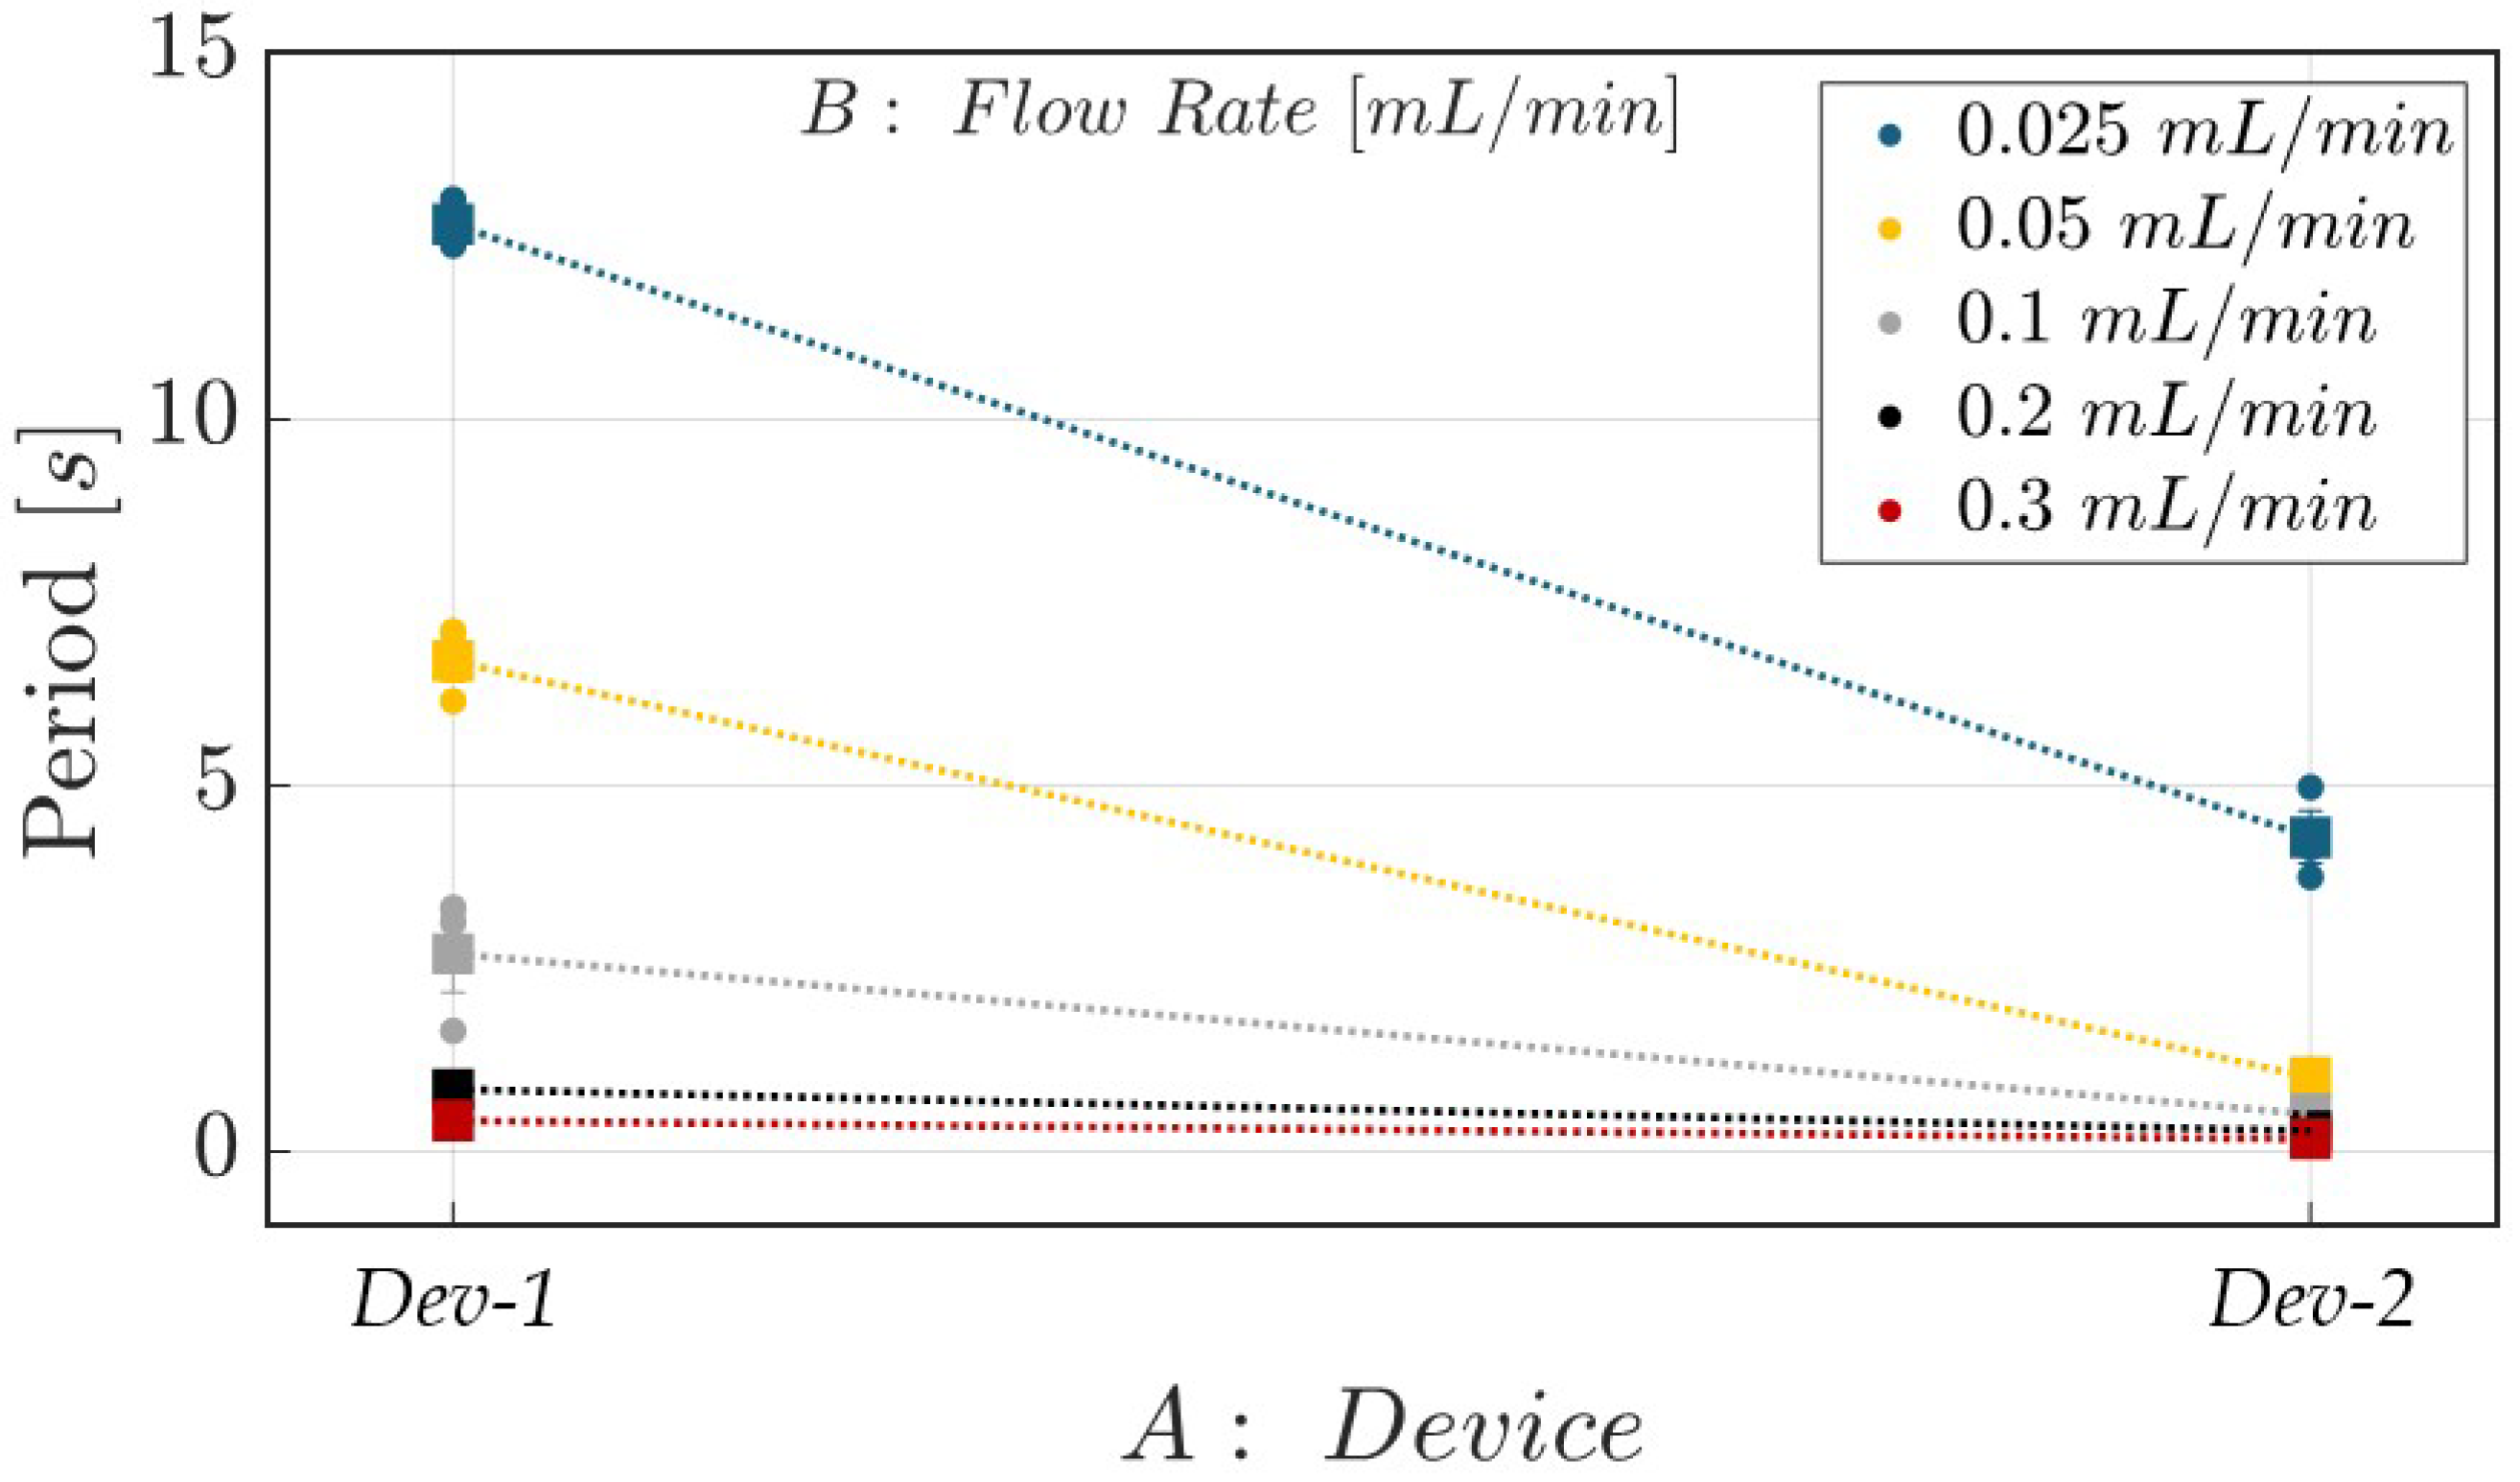
2.5. Impact of Build Orientation on Slug Flow’s Hydrodynamic Stability: Experimental Setup and Campaign

A real picture of the system employed to assess the impact of build orientation on the slug flow’s hydrodynamic stability is provided in Figure 5. It consisted of the components as follows: (i.) a hydrodynamic system for introducing fluid samples into the micro-optofluidic device; (ii.) an optical actuation system with a laser source coupled via an actuation optical fiber; (iii.) the MoF device; (iv.) an optical detection system using a photodiode connected to an output optical fiber; (v.) a computer equipped with dedicated software for acquiring the optical signals.
To generate the slug flow within the MoF device, deionized water and air were simultaneously injected through the two inlets of its T-junction geometry. This was achieved using two Fusion 4000 Independent Channels Syringe Pumps (Chemyx, Stafford, TX, USA), one loaded with deionized water and the other with air. These pumps enabled the precise control of the flow rate values and were connected directly to the device inlets. For the optical actuation, a NovaPro 660-125 laser system (RGB Lasersystems, Kelheim, Germany) was used, operating at a wavelength of 660 nm and a power of 1 mW. The laser light was delivered to the device via an actuation optical fiber with a 365 µm core diameter, inserted into the device’s actuation slot. Optical detection was performed using a 365 µm diameter output optical fiber connected to a PDA100A photodiode (Thorlabs, Newton, NJ, USA) with a gain setting of 40 dB, enabling the detection of light intensity variations. The photodiode output was recorded using a PicoScope 2204A USB oscilloscope (Pico Technology, Cambridgeshire, UK), operated at a sampling rate of 1.5 kHz for high-resolution signal acquisition.
The post-processing of the acquired optical signals was carried out in MATLAB (v.R2023b, MathWorks®), as described in detail elsewhere [37,38].
The experiments were conducted under ambient laboratory conditions. The laboratory temperature was maintained between 20 °C and 25 °C and monitored during the testing. Under these conditions, the percentage changes in water and air viscosity were minimal, i.e., about 11 % and 2.8 % , respectively, thus were not expected to significantly alter the slug flow behavior under the tested conditions, and any variation could be considered negligible for the purposes of this study. Viscosity parameters were assumed to be equal to 1.0016 mPa · s at 20 °C for water and 0.0181 mPa · s at 20 °C for air.
The investigated response for the experimental plan was the mean period (T) associated with complete slug flow passage. It was calculated starting from the detected square-wavelike optical signal S o p t ( t ) in the frequency domain. Thus, the frequency of the highest peak was extracted from the spectrum S o p t ( f ) to evaluate the fundamental component ( f ) , and the mean period ( T ) was calculated as the reciprocal of the latter parameter.
To investigate how the mold build orientation affected the surface consistency of the MoF device’s microchannels and, consequently, their hydrodynamic stability in the slug flow formation period, a replicated general factorial design was used. The investigated factors (independent variables) for the experimental design are reported below:
  • Device (factor A)—categorical factor varied among two levels ( a = 2 ), which were {Dev-1, Dev-2};
  • Flow rate (factor B)—quantitative factor varied among five levels ( b = 5 ), which were { 0.025 , 0.05 , 0.1 , 0.2 , 0.3 } mL/min.
The number of replications was set at n = 3 , for a total of N = a × b × n = 30 experimental tests. Moreover, it was taken into account that the experimental tests were not completely randomized. Thus, the experiments were divided into 3 different blocks, each block corresponding to a certain replication value (i.e., n = 1 , 2 , 3 ). The latter approach of considering blocks aimed to balance out the effects of the replications, hence eliminating its influence on the analysis. The experimental plan is reported in Table 3.

3. Results and Discussion

The 3D surface reconstructions of the primary profile [µm] mapped through profilometry for Dev-1 and Dev-2 are reported in Figure 6. Dev-1 presented an average surface roughness ( R a ( 1 ) ) equal to [7.28; 7.41] µm (expressed as the 95 % confidence interval), while it was equal to [6.60; 6.70] µm for Dev-2. In detail, R a ( 1 ) represents the arithmetic average of the absolute values of the roughness profile values, and it was evaluated as follows:
R a ( 1 ) = 1 n i = 1 n | y i | ( M e t h o d 1 )
where | y i | is the absolute value of each collected primary roughness profile value, and n is the total number of collected observations. By considering the absolute value of the arithmetic mean of all profile values (named as R a ( 2 ) ), it was evaluated as follows:
R a ( 2 ) = 1 n i = 1 n y i ( M e t h o d 2 )
which ranges from 0.65 up to 2.09 µm. In the end, the individually collected primary roughness profile observations ranged within the interval [0.1–19.9] µm (Method 3), having excluded the outliers from the collected dataset (visible in Figure 6). The obtained results are consistent with the findings previously reported for state-of-the-art methods (see Table 4) for 3D-printed parts (microchannels and benchmarks) by using different materials, 3D-printing techniques, and printing settings.
Figure 6 shows that Dev-1 presents a uniform microchannel edge profile (along the X-axis), while striated surface patterns are pronounced along the Y-axis (see Figure 6a). This was due to the mold orientation during the 3D-printing process, i.e., with the microchannel oriented along X Y , the printing head direction (as described in Section 2.3). Conversely, even the microchannel edge profile (along the X-axis) for Dev-2 shows striated surface patterns (see Figure 6b). Once again, the latter jagged morphology along the microchannel profile was due to the mold orientation during the 3D printing process, i.e., with the microchannel oriented across the printing head direction ( Y X ) (as described in Section 2.3). The findings discussed so far were also confirmed by the implemented procedure by examining the effects of mold build orientation on the surface consistency of the MoF device’s microchannel (presented in Section 2.3).
In detail, the ANOVA tables for the primary response profile are reported in Table 5 and Table 6 for Dev-1 and Dev-2, respectively. The three-dimensional response surfaces showing the expected primary profile [µm] as a function of the X and Y Coordinates for the surface of Dev-1 and Dev-2 are reported in Figure 7a and Figure 7b, respectively.
From the obtained results it was found that the Y Coordinates (factor B) was a influential factor (p-value < 0.0001 ) for Dev-1, which was a strong predictor of its primary surface profile. Furthermore, even B 3 (the cubic term for factor B) was highly significant (p-value < 0.0001 ), which suggested that the cubic relationship with the Y Coordinates played a crucial role in explaining the response variable. Conversely, the X Coordinates (factor A) was the influential factor (p-value = 0.0454 < 0.05) for Dev-2, thus being a strong predictor of its primary surface profile. Moreover, it must be noted that while the first order of factor B is not significant (p-value > 0.0001), the quadratic B 2 and cubic B 3 terms are highly significant (p-value < 0.0001 ), which are due to the S-shaped surface response (with inflection points), as also observed for the response surface curves with respect to factor B, as shown in Figure 7b. This also justifies the significance of the interaction of the A 2 B and A B 2 terms (p-value < 0.0001 ). It must be also highlighted that approximately R 2 = 76.23 % and R 2 = 55.85 % of the variability in the primary profile [µm] response (dependent variable) is explained by the model for Dev-1 and Dev-2, respectively, i.e., by the influential factors. Although the latter R 2 value for Dev-2 surface characterization represents a moderate proportion of explained variance, the model is statistically significant overall (p-value < 0.001) and successfully identifies the key factors and interactions that influence the surface profile. Furthermore, the primary objective of this modeling effort is not to achieve high predictive accuracy but rather to enhance the understanding of the physical behavior of the system. In the end, no anomalies were identified from checkingf the adequacy of models related to Dev-1 and Dev-2 using ANOVA.
Figure 8 illustrates a morphological comparison between the microfluidic devices (Dev-1 and Dev-2), highlighting the channel width and microchannels boundaries profiles. For Dev-1 (see Figure 8a), the tracked microchannel profile appears smoother and more uniform, whereas Dev-2 (see Figure 8b) exhibits noticeable irregularities along the microchannel walls. This difference is attributed to the orientation of the striated surface patterns with respect to the microchannel: In Dev-1, the striated patterns are predominantly aligned parallel to the microchannel direction, which preserves profile continuity. In contrast, Dev-2 shows striated patterns oriented more orthogonally to the channel, leading to a more jagged and less-uniform appearance. Further evidence of this can be seen in Figure 8c, showing a superimposition of probability density functions of 50 measurements of the microchannel width (W [µm]), with a normal distribution curve interpolated for the data of Dev-1 (blue curve) and Dev-2 (yellow curve). Dev-1 displays a tall and narrow Gaussian distribution with a mean width of 398.43 µm and a standard error of 0.29 µm, reflecting high dimensional uniformity. Dev-2, on the other hand, is characterized by a slightly lower mean width of 393.74 µm as well as a flat and broader distribution, with the standard error being equal to 1.67 µm, highlighting greater variability, likely induced by more disruptive, orthogonally oriented striated patterns.
The observed morphological differences between the devices had a direct impact on the hydrodynamic behavior of the slug flow within the microchannels, as investigated through optical signal acquisition. The optical signals in the time domain S o p t ( t ) , along with their corresponding frequency spectra S o p t ( f ) , are presented in Figure 9 and Figure 10, for Dev-1 and Dev-2, under an operative condition of P = 1 mW, with a flow rate F R = 0.05 mL/min and F R = 0.2 mL/min, respectively. For the sake of brevity, only these representative conditions are shown; the complete data from all tested scenarios are available upon request from the authors. Under both conditions, Dev-2 exhibited a greater number of complete air–water oscillations within the 15 s observation window compared to Dev-1 (see Figure 9a vs. Figure 9c and Figure 10a vs. Figure 10c). This was further supported by the fundamental frequency identified from the spectral peaks in S o p t ( f ) , which consistently indicated that Dev-2 operated at a higher slug flow frequency than Dev-1 under identical conditions.
These differences in slug flow behavior directly correlate with the previously identified morphological characteristics of the two devices. Indeed, Dev-1 exhibits smoother and more uniform channel profiles, with a narrow width distribution and striated patterns oriented parallel to the flow direction. In contrast, Dev-2 shows greater surface irregularity and a broader width distribution, along with a slightly smaller mean channel width. This reduced cross-sectional area increases flow velocity under constant volumetric flow rate conditions, promoting more frequent slug formation and breakup.
The ANOVA table for the T response is reported in Table 7. In this case, both factor A and factor B, together with their interaction, AB, are factors influencing (p-value < 0.0001 ) the investigated response. This result suggest that, in accordance with the morphological findings, in terms of the striated surface patterns with respect to the microchannel direction, the two fabricated molds with different orientations with respect to the printing head direction (along and across) show different hydrodynamic behavior. The latter is also affected, as expected, from the set flow rate value for the two fluids making up the slug flow. Similar results were also found in previous work, where tailored Z n O nanostructured coatings, as microchannel surface functionalization, allowed the modification of the microchannel morphology, fine tuning the fluid dynamics inside a microchannel [15].
In the end, no anomalies were found when checking model adequacy, and from R 2 = 0.9932 it can be inferred that almost the entire response variation was due to the independent factors variation.
The same conclusions can be drawn by considering the effects diagram for the investigated mean period T reported in Figure 11. The plot confirms that Dev-2 consistently exhibits shorter slug periods compared to Dev-1 across all tested flow rate values. An additional observation is that Dev-1 demonstrates greater sensitivity to variations in flow rate, as evidenced by the wider spread in the slug period values across the tested conditions. In contrast, Dev-2 shows a more compressed response span, with slug periods changing less distinctly between flow rate values. This improved discriminatory capability of Dev-1 is the result of its smoother and more-uniform microchannel geometry, which enables more consistent flow patterns and minimizes the stochastic effects introduced by surface irregularities. Consequently, changes in the flow rate more directly influence the hydrodynamic behavior of Dev-1, making it more responsive to minor variations in operational parameters. In contrast, the more irregular profile of Dev-2 introduces additional sources of disturbance and local turbulence. These effects hide the impact of incremental changes in the flow rate. Additionally, the slightly narrower average channel width in Dev-2 contributes to an increased flow velocity, promoting frequent slug formation. These findings collectively highlight the effect of microchannel morphology not only in determining slug flow frequency but also in tuning the system’s sensitivity to flow rate modulation. However, the latter strategy, by properly modulating the micrometric deviations of the surface morphology, can be employed at lower flow rate values (i.e., FR ≤ 0.2 mL/min), since Dev-1 and Dev-2 ensure similar hydrodynamic behavior when this threshold value is exceeded (see the black and red lines in Figure 11). This outcome is supported by earlier studies, which showed that more consistent hydrodynamic behavior, specifically regarding the frequency peak, was observed in two-phase flow systems when higher flow rate values were applied [52]. Additionally, it was demonstrated that such hydrodynamic processes exhibited greater periodicity under increased flow rate conditions, reaching up to 1 mL/min [53].
These findings support the general conclusion that smoother and more-uniform microchannel geometries enhance the sensitivity and stability of air–water slug flow, although this effect is strongly influenced by fluid properties, particularly viscosity and density. High-viscosity fluids stabilize slug formation and amplify the benefits of geometric consistency, while low-viscosity fluids lead to faster, less-stable slugs that remain sensitive to flow disturbances. Similarly, fluid density plays a key role: higher-density liquid phases increase the inertial resistance in irregular channels (i.e., Dev-2), resulting in more unpredictable slug elongation and flow variability. In contrast, low-density gas phases are more prone to velocity fluctuations and irregular slug breakup. As a result, flow stability and measurement precision deteriorate more significantly in geometrically inconsistent devices. These trends are consistent with prior studies [54,55,56], which emphasize the role of viscous and inertial forces, captured through dimensionless numbers such as C a , O h , and W e , in governing slug flow regimes. Overall, our results confirm that smoother microchannels (i.e., Dev-1) maintain more-regular and controllable flow behavior, particularly under varying flow rates.

4. Conclusions

In this work the effect of build orientation on the surface finish and hydrodynamic stability in microfluidic channels fabricated via inkjet 3D printing was investigated. For this purpose two molds (i.e., primaries) for MoF devices were 3D-printed in two orientations: (Dev-1) along X Y and (Dev-2) across Y X of the printhead direction. The primary surface profile along the microchannel’s edge was characterized using a profilometer. Additionally, to assess the effect of the striated surface patterns on hydrodynamic stability, the MoF devices were tested in terms of air–water slug flow by estimating the oscillation mean period (T) trend with respect to the imposed flow rate value and build orientation. The hydrodynamic behavior was monitored by means of optical signal acquisition through an extensive experimental campaign, enabling the high-frequency mapping of the slug flow periodicity across different flow rate values and build orientations.
The findings demonstrate that the build orientation significantly impacts the microchannel morphology. Specifically, Dev-1 exhibits a tall, narrow Gaussian profile for its channel width, measured at 398.43 ± 0.29 µm, indicating a more uniform structure. In contrast, Dev-2 shows a slightly reduced channel width of 393.74 ± 1.67 µm, with a broader and flatter distribution, suggesting higher variability caused by more disruptive, striated patterns oriented orthogonally. As a result, Dev-1 responds more sensitively to variations in the flow rate value due to its smoother and more consistent microchannel geometry. Conversely, the marginally narrower average width value in Dev-2 leads to an increased flow velocity but compromises its ability to distinguish between different flow rates. These results underscore how the microchannel structure plays a critical role in modulating the system’s responsiveness to flow rate changes and, thus, pave the way for examining the development of innovative solutions within the field of fAM (functional AM) to modify the surface finish of microchannels by ad hoc tailoring the texture on micro- and nanoscales. Additionally, although this study focused on straight channels and low-viscosity fluids, the observed effects of build orientation on surface morphology and flow behavior are likely relevant to more complex geometries (e.g., spiral channels) and high-viscosity or non-Newtonian fluids. Future work will explore these scenarios to assess how striated surface patterns influence flow dynamics under more demanding conditions.

Author Contributions

Conceptualization, E.C., L.S., G.C. and M.B.; methodology, E.C., L.S., G.C. and M.B.; software, E.C. and L.S.; validation, E.C., L.S., N.T., G.C. and M.B.; formal analysis, E.C. and L.S.; investigation, E.C., L.S., N.T., G.C. and M.B.; resources, N.T., G.C. and M.B.; data curation, E.C. and L.S.; writing—original draft preparation, E.C. and L.S.; writing—review and editing, N.T., G.C. and M.B.; visualization, E.C., L.S., G.C. and M.B.; supervision, G.C. and M.B.; project administration, G.C. and M.B.; funding acquisition, G.C. and M.B. All authors have read and agreed to the published version of the manuscript.

Funding

This document is the result of a research project funded by the European Union (NextGeneration EU) through the MUR-PNRR project SAMOTHRACE (CUP: E63C220009000022) and University of Catania under Grant Scheme PIACERI within the project “Evoluzione dei Materiali multifunzionali per dispositivi micro-optofluidici” (EVO-MAF-MoF).

Institutional Review Board Statement

Not applicable.

Data Availability Statement

The original contributions presented in this study are included in the article. Further inquiries can be directed to the corresponding authors.

Conflicts of Interest

The authors declare no conflictsof interest.

References

  1. Alshahrani, H.A. Review of 4D printing materials and reinforced composites: Behaviors, applications and challenges. J. Sci. Adv. Mater. Devices 2021, 6, 167–185. [Google Scholar] [CrossRef]
  2. Gibson, I.; Rosen, D.; Stucker, B.; Khorasani, M. Additive Manufacturing Technologies; Springer: New York, NY, USA, 2010. [Google Scholar]
  3. Jadhav, A.; Jadhav, V.S. A review on 3D printing: An additive manufacturing technology. Mater. Today Proc. 2022, 62, 2094–2099. [Google Scholar] [CrossRef]
  4. Zhou, L.; Miller, J.; Vezza, J.; Mayster, M.; Raffay, M.; Justice, Q.; Al Tamimi, Z.; Hansotte, G.; Sunkara, L.D.; Bernat, J. Additive manufacturing: A comprehensive review. Sensors 2024, 24, 2668. [Google Scholar] [CrossRef]
  5. ASTM International F2792-12a; Standard Terminology for Additive Manufacturing Technologies. ASTM International: West Conshohocken, PA, USA, 2012.
  6. Razavykia, A.; Brusa, E.; Delprete, C.; Yavari, R. An overview of additive manufacturing technologies—A review to technical synthesis in numerical study of selective laser melting. Materials 2020, 13, 3895. [Google Scholar] [CrossRef]
  7. Niemelä, M.; Shi, A.; Shirowzhan, S.; Sepasgozar, S.; Liu, C. 3D printing architectural freeform elements: Challenges and opportunities in manufacturing for industry 4.0. In Proceedings of the 36th International Symposium on Automation and Robotics in Construction (ISARC), Banff, AB, Canada, 21–24 May 2019; pp. 1298–1304. [Google Scholar]
  8. Su, J.W.; Gao, W.; Trinh, K.; Kenderes, S.M.; Pulatsu, E.T.; Zhang, C.; Whittington, A.; Lin, M.; Lin, J. 4D printing of polyurethane paint-based composites. Int. J. Smart Nano Mater. 2019, 10, 237–2448. [Google Scholar] [CrossRef]
  9. Gujba, A.K.; Medraj, M. Power ultrasonic additive manufacturing: Process parameters, microstructure, and mechanical properties. Adv. Mater. Sci. Eng. 2020, 2020, 1064870. [Google Scholar] [CrossRef]
  10. Ngo, T.D.; Kashani, A.; Imbalzano, G.; Nguyen, K.T.; Hui, D. Additive manufacturing (3D printing): A review of materials, methods, applications and challenges. Compos. Part B Eng. 2018, 143, 172–196. [Google Scholar] [CrossRef]
  11. Sieber, I.; Moser, D.; Gengenbach, U. Design-for-manufacture of high-resolution 3D printed rotation optics. In Proceedings of the Optical Fabrication and Testing, Washington, DC, USA, 10–12 June 2019; Optica Publishing Group: Washington, DC, USA, 2019; p. JW3A–2. [Google Scholar]
  12. Park, Y.G.; Yun, I.; Chung, W.G.; Park, W.; Lee, D.H.; Park, J.U. High-resolution 3D printing for electronics. Adv. Sci. 2022, 9, 2104623. [Google Scholar] [CrossRef]
  13. Silva, M.R.; Pereira, A.M.; Sampaio, Á.M.; Pontes, A.J. Assessment of the dimensional and geometric precision of micro-details produced by material jetting. Materials 2021, 14, 1989. [Google Scholar] [CrossRef]
  14. Cutuli, E.; Sanalitro, D.; Stella, G.; Saitta, L.; Bucolo, M. A 3D-Printed Micro-Optofluidic Chamber for Fluid Characterization and Microparticle Velocity Detection. Micromachines 2023, 14, 2115. [Google Scholar] [CrossRef]
  15. Stella, G.; Barcellona, M.; Saitta, L.; Tosto, C.; Cicala, G.; Gulino, A.; Bucolo, M.; Fragalà, M.E. 3D printing manufacturing of polydimethyl-siloxane/zinc oxide micro-optofluidic device for two-phase flows control. Polymers 2022, 14, 2113. [Google Scholar] [CrossRef] [PubMed]
  16. Stella, G.; Saitta, L.; Moscato, S.; Cicala, G.; Bucolo, M. 3D-Printed Micro-Optofluidic Slug Flow Detector. IEEE Sens. J. 2024, 24, 18813–18826. [Google Scholar] [CrossRef]
  17. Go, J.; Schiffres, S.N.; Stevens, A.G.; Hart, A.J. Rate limits of additive manufacturing by fused filament fabrication and guidelines for high-throughput system design. Addit. Manuf. 2017, 16, 1–11. [Google Scholar] [CrossRef]
  18. Chand, R.; Sharma, V.S.; Trehan, R.; Gupta, M.K.; Sarikaya, M. Investigating the dimensional accuracy and surface roughness for 3D printed parts using a multi-jet printer. J. Mater. Eng. Perform. 2023, 32, 1145–1159. [Google Scholar] [CrossRef]
  19. Shoji, A.; Tasaki, R.; Terashima, K. High-speed additive manufacturing process using variable motion trajectory. In Proceedings of the 2018 IEEE Conference on Control Technology and Applications (CCTA), Copenhagen, Denmark, 21–24 August 2018; IEEE: New York, NY, USA, 2018; pp. 483–488. [Google Scholar]
  20. Phan, T.; Masood, S. An analysis of textured features fabricated by FDM rapid prototyping process. Int. J. Theory Appl. 2010, 6, 13–22. [Google Scholar]
  21. Aslani, K.E.; Vakouftsi, F.; Kechagias, J.D.; Mastorakis, N.E. Surface roughness optimization of poly-jet 3D printing using Grey Taguchi method. In Proceedings of the 2019 International Conference on Control, Artificial Intelligence, Robotics & Optimization (ICCAIRO), Athens, Greece, 8–10 December 2019; IEEE: New York, NY, USA, 2019; pp. 213–218. [Google Scholar]
  22. Kumar, K.; Kumar, G.S. An experimental and theoretical investigation of surface roughness of poly-jet printed parts: This paper explains how local surface orientation affects surface roughness in a poly-jet process. Virtual Phys. Prototyp. 2015, 10, 23–34. [Google Scholar] [CrossRef]
  23. Kamble, P.; Mittal, Y.; Gote, G.; Patil, M.; Karunakaran, K. A mathematical surface roughness model for objects made by material jetting. Prog. Addit. Manuf. 2024, 9, 2213–2224. [Google Scholar] [CrossRef]
  24. Kechagias, J.D.; Maropoulos, S. An investigation of sloped surface roughness of direct poly-jet 3D printing. In Proceedings of the International Conference on Industrial Engineering—INDE, Novocherkassk, Russia, 22–23 October 2015; pp. 150–153. [Google Scholar]
  25. Cazón, A.; Morer, P.; Matey, L. PolyJet technology for product prototyping: Tensile strength and surface roughness properties. Proc. Inst. Mech. Eng. Part J. Eng. Manuf. 2014, 228, 1664–1675. [Google Scholar] [CrossRef]
  26. Vidakis, N.; Petousis, M.; Vaxevanidis, N.; Kechagias, J. Surface roughness investigation of poly-jet 3D printing. Mathematics 2020, 8, 1758. [Google Scholar] [CrossRef]
  27. Xiao, J.; Pan, F.; Xia, H.; Zou, S.; Zhang, H.; George, O.A.; Zhou, F.; Huang, Y. Computational study of single droplet deposition on randomly rough surfaces: Surface morphological effect on droplet impact dynamics. Ind. Eng. Chem. Res. 2018, 57, 7664–7675. [Google Scholar] [CrossRef]
  28. Saitta, L.; Celano, G.; Tosto, C.; Arcadio, F.; Zeni, L.; Sergi, C.; Cennamo, N.; Cicala, G. The effect of surface roughness on the performance of 3D printed surface plasmon resonance sensors for refractive index measurements. Int. J. Adv. Manuf. Technol. 2024, 132, 5503–5519. [Google Scholar] [CrossRef]
  29. Gal-Or, E.; Gershoni, Y.; Scotti, G.; Nilsson, S.M.; Saarinen, J.; Jokinen, V.; Strachan, C.J.; af Gennäs, G.B.; Yli-Kauhaluoma, J.; Kotiaho, T. Chemical analysis using 3D printed glass microfluidics. Anal. Methods 2019, 11, 1802–1810. [Google Scholar] [CrossRef]
  30. Cutuli, E.; Stella, G.; Guarino, F.; Bucolo, M. Automatic label-free image-based system for cell viability monitoring on-a-chip. Biomed. Signal Process. Control. 2025, 106, 107768. [Google Scholar] [CrossRef]
  31. Ayuso, J.M.; Virumbrales-Muñoz, M.; Lang, J.M.; Beebe, D.J. A role for microfluidic systems in precision medicine. Nat. Commun. 2022, 13, 3086. [Google Scholar] [CrossRef] [PubMed]
  32. Yang, S.M.; Lv, S.; Zhang, W.; Cui, Y. Microfluidic point-of-care (POC) devices in early diagnosis: A review of opportunities and challenges. Sensors 2022, 22, 1620. [Google Scholar] [CrossRef]
  33. Bordbar, A.; Taassob, A.; Zarnaghsh, A.; Kamali, R. Slug flow in microchannels: Numerical simulation and applications. J. Ind. Eng. Chem. 2018, 62, 26–39. [Google Scholar] [CrossRef]
  34. Lei, L.; Zhao, Y.; Chen, W.; Li, H.; Wang, X.; Zhang, J. Experimental studies of droplet formation process and length for liquid–liquid two-phase flows in a microchannel. Energies 2021, 14, 1341. [Google Scholar] [CrossRef]
  35. Maurice, A.; Theisen, J.; Gabriel, J.C.P. Microfluidic lab-on-chip advances for liquid–liquid extraction process studies. Curr. Opin. Colloid Interface Sci. 2020, 46, 20–35. [Google Scholar] [CrossRef]
  36. Liu, Y.; Zhao, Q.; Yue, J.; Yao, C.; Chen, G. Effect of mixing on mass transfer characterization in continuous slugs and dispersed droplets in biphasic slug flow microreactors. Chem. Eng. J. 2021, 406, 126885. [Google Scholar] [CrossRef]
  37. Saitta, L.; Celano, G.; Cicala, G.; Fragalà, M.E.; Stella, G.; Barcellona, M.; Tosto, C.; Bucolo, M. Projection micro-stereolithography versus master–slave approach to manufacture a micro-optofluidic device for slug flow detection. Int. J. Adv. Manuf. Technol. 2022, 120, 4443–4460. [Google Scholar] [CrossRef]
  38. Saitta, L.; Cutuli, E.; Celano, G.; Tosto, C.; Sanalitro, D.; Guarino, F.; Cicala, G.; Bucolo, M. Projection micro-stereolithography to manufacture a biocompatible micro-optofluidic device for cell concentration monitoring. Polymers 2023, 15, 4461. [Google Scholar] [CrossRef] [PubMed]
  39. Saitta, L.; Cutuli, E.; Celano, G.; Tosto, G.C.; Guarino, F.; Cicala, G.; Bucolo, M. Monolithic 3D Printed Micro-Optofluidic Device for Two-Phase Flow Monitoring and Bioapplications. In Proceedings of the 2024 IEEE International Conference And Exposition On Electric And Power Engineering (EPEi), Iaşi, Romania, 17–19 October 2024; IEEE: New York, NY, USA, 2024; pp. 642–647. [Google Scholar]
  40. Moscato, S.; Cutuli, E.; Camarda, M.; Bucolo, M. Experimental and Numerical Study of Slug-Flow Velocity Inside Microchannels Through In Situ Optical Monitoring. Micromachines 2025, 16, 586. [Google Scholar] [CrossRef] [PubMed]
  41. Li, S.; Xiang, X.; Wang, Z.; Zhu, C.; Ma, Y.; Fu, T. Uniformity and stability of droplet formation at T-junctions in symmetrical microchannels. Chem. Eng. J. 2024, 481, 148718. [Google Scholar] [CrossRef]
  42. Khan, W.; Chandra, A.; Kishor, K.; Sachan, S.; Alam, M.S. Slug formation mechanism for air–water system in T-junction microchannel: A numerical investigation. Chem. Pap. 2018, 72, 2921–2932. [Google Scholar] [CrossRef]
  43. Walczak, R.; Adamski, K. Inkjet 3D printing of microfluidic structures—on the selection of the printer towards printing your own microfluidic chips. J. Micromech. Microeng. 2015, 25, 085013. [Google Scholar] [CrossRef]
  44. Yan, C.; Jiang, P.; Jia, X.; Wang, X. 3D printing of bioinspired textured surfaces with superamphiphobicity. Nanoscale 2020, 12, 2924–2938. [Google Scholar] [CrossRef]
  45. Sikora, M.; Bohdal, T.; Tandecka, K.; Kacalak, W.; Mathia, T.G. The Effect of Channel Surface Roughness on Two–Phase Flow Patterns: A Review. Energies 2024, 17, 5483. [Google Scholar] [CrossRef]
  46. Chai, L.K.; Yeoh, C.V.; Ooi, E.H.; Foo, J.J. Lattice Boltzmann-based microchannel concentration mixing with surface roughness-mediated flow dynamics. Phys. Fluids 2025, 37. [Google Scholar] [CrossRef]
  47. Rabiei, N.; Hidrovo, C.H. Hydrodynamic characteristics of textured microchannel flow. J. Fluids Eng. 2023, 145, 051301. [Google Scholar] [CrossRef]
  48. Khoshkhoo, A.; Carrano, A.L.; Blersch, D.M. Effect of surface slope and build orientation on surface finish and dimensional accuracy in material jetting processes. Procedia Manuf. 2018, 26, 720–730. [Google Scholar] [CrossRef]
  49. Zhang, K.; Wang, H.; Yao, K.; He, G.; Zhou, Z.; Sun, D. Surface roughness improvement of 3D printed microchannel. J. Micromech. Microeng. 2020, 30, 065003. [Google Scholar] [CrossRef]
  50. Lin, T.Y.; Do, T.; Kwon, P.; Lillehoj, P.B. 3D printed metal molds for hot embossing plastic microfluidic devices. Lab Chip 2017, 17, 241–247. [Google Scholar] [CrossRef] [PubMed]
  51. Parthiban, P.; Vijayan, S.; Doyle, P.S.; Hashimoto, M. Evaluation of 3D-printed molds for fabrication of non-planar microchannels. Biomicrofluidics 2021, 15. [Google Scholar] [CrossRef] [PubMed]
  52. Cairone, F.; Gagliano, S.; Bucolo, M. Experimental study on the slug flow in a serpentine microchannel. Exp. Therm. Fluid Sci. 2016, 76, 34–44. [Google Scholar] [CrossRef]
  53. Schembri, F.; Sapuppo, F.; Bucolo, M. Experimental classification of nonlinear dynamics in microfluidic bubbles’ flow. Nonlinear Dyn. 2012, 67, 2807–2819. [Google Scholar] [CrossRef]
  54. Ma, H.; Zhao, Q.; Yao, C.; Zhao, Y.; Chen, G. Effect of fluid viscosities on the liquid-liquid slug flow and pressure drop in a rectangular microreactor. Chem. Eng. Sci. 2021, 241, 116697. [Google Scholar] [CrossRef]
  55. Molla, S.; Eskin, D.; Mostowfi, F. Pressure drop of slug flow in microchannels with increasing void fraction: Experiment and modeling. Lab Chip 2011, 11, 1968–1978. [Google Scholar] [CrossRef]
  56. Desir, P.; Chen, T.Y.; Bracconi, M.; Saha, B.; Maestri, M.; Vlachos, D.G. Experiments and computations of microfluidic liquid–liquid flow patterns. React. Chem. Eng. 2020, 5, 39–50. [Google Scholar] [CrossRef]
Figure 1. Axonometric view of the 3D-printed mold (on the left). The inset (on the right) shows a magnification of the microchannel and the fiber’s slot. Sizes are expressed in [mm].
Polymers 17 01864 g001
Figure 2. Final assembled PDMS MoF device.
Polymers 17 01864 g002
Figure 3. Schematic of the microchannel (mold) orientation with respect to the printhead travel direction: (a) parallel and (b) orthogonal to the direction of printhead travel.
Polymers 17 01864 g003
Figure 4. X and Y Coordinates selected for the observations collection in Step 3 for (a) Dev-1 and (b) Dev-2. In the red inset, a picture of the final PDMS device highlights the effect of the printhead’s travel direction.
Polymers 17 01864 g004
Figure 5. Real picture of the experimental setup, including the fluidic connections, optical alignment, and support structure used during the experimental plan.
Polymers 17 01864 g005
Figure 6. Surface profile acquired with a profilometer in the investigated region: (a) Dev-1 and (b) Dev-2.
Polymers 17 01864 g006
Figure 7. A three-dimensional response surface showing the expected primary profile [µm] as a function of the X and Y Coordinates for the surfaces of (a) Dev-1 and (b) Dev-2.
Polymers 17 01864 g007
Figure 8. Grayscale frame of the microfluidic channels overlaid with the extracted microchannel profile (magnification: 4 × ): (a) Dev-1 and (b) Dev-2. (c) Superimposition of the distribution of 50 measurements of the microchannel widths ( W [μm]), with a normal distribution curve interpolated for the data for Dev-1 (blue curve) and Dev-2 (yellow curve).
Polymers 17 01864 g008
Figure 9. Acquired optical signals in the time domain ( S o p t ( t ) ) and in the frequency domain ( S o p t ( f ) ) at P = 1 mW and F R = 0.05 mL/min: (a,b) Dev-1 (light blue) and (c,d) Dev-2 (yellow).
Polymers 17 01864 g009
Figure 10. Acquired optical signals in the time domain ( S o p t ( t ) ) and in the frequency domain ( S o p t ( f ) ) at P = 1 mW and F R = 0.2 mL/min: (a,b) Dev-1 (light blue) and (c,d) Dev-2 (yellow).
Polymers 17 01864 g010
Figure 11. Effects diagram of the investigated mean period (T) associated with complete air–water slug flow passage for both Dev-1 and Dev-2 at various FR values.
Polymers 17 01864 g011
Table 1. Experimental plan for primary profile acquired for Dev-1: factors and levels.
FactorSymbolTypeUnitLevelsLevel
I
Level
II
Level
III
Level
IV
Level
V
X CoordinatesANumerical[µm] a = 5 8001600240032004000
Y CoordinatesBNumerical[µm] b = 5 0500100015002000
Table 2. Experimental plan for primary profile acquired for Dev-2: factors and levels.
FactorSymbolTypeUnitLevelsLevel
I
Level
II
Level
III
Level
IV
Level
V
X CoordinatesANumerical[µm] a = 5 400800120016002000
Y CoordinatesBNumerical[µm] b = 5 01000200030004000
Table 3. Experimental plan for slug flow formation period: factors and levels.
FactorSymbolTypeUnitLevelsLevel
I
Level
II
Level
III
Level
IV
Level
V
DeviceACategorical[mL/min] a = 2 Dev-1Dev-2[-][-][-]
Flow RateBCategorical[-] b = 5 0.025 0.050 0.1 0.2 0.3
Table 4. Comparison of roughness measurements of parts 3D-printed by means of different 3D-printing techniques and materials. BJP: binder jetting process. FDM: fused deposition modeling. SLS: selective laser sintering. PJ: PolyJet. SL: stereolithography.
Printing
Method
3D PrinterMaterialRoughness
[µm]
Measurement
Method
Reference
InkjetProjet3510 HDVisijet M3 Crystal6.81–34.63(1)[49]
BJPX1-Lab 3D printerStainless Steel (SS) 4203.65–6.61(1)[50]
FDMQiDi Tech 1Polylactic acid (PLA)16.7 (2.6)(2)[51]
SLSEOS FormigaPolyamide (PA)3.3 (0.3)(2)[51]
PJObjet30 PrimeVeroClear2.3 (0.4)(2)[51]
SLStructo OrthoFormProprietary1.4 (0.4)(2)[51]
PJObjet260 Connex1VeroClear0.9–1.2(2)[28]
PJEden250VeroClear0.5–2(2)[24]
PJEden350VeroClear2.8–17.6(3)[22]
PJObjet260 Connex1VeroWhitePlus6.7–7.3(1)This work
PJObjet260 Connex1VeroWhitePlus0.7–2.1(2)This work
PJObjet260 Connex1VeroWhitePlus0.2–19.9(3)This work
Table 5. Dev-1 surface characterization: ANOVA table for the primary response profile [µm].
SourceSum of
Squares
dfMean
Square
F-Valuep-Value
Model24,197.0192688.5638.85<0.0001significant
A X Coordinates113.781113.781.640.2025
B Y Coordinates6933.4316933.43100.18<0.0001significant
A B 26.78126.780.390.5352
A 2 17.75117.750.260.6136
B 2 135.121135.121.950.1652
A 2 B 81.73181.731.180.2796
A B 2 42.89142.890.620.4328
A 3 54.76154.760.790.3757
B 3 17,050.10117,050.10246.36<0.0001significant
Residual7543.8210969.21
                         Lack of Fit2171.3915144.762.530.0034significant
                         Pure Error5372.449457.15
             Cor Total31,740.84118
Std. Dev.8.32 R 2 0.7623
Mean−0.22
Table 6. Dev-2 surface characterization: ANOVA table for the primary response profile [µm].
SourceSum of
Squares
dfMean
Square
F-Valuep-Value
Model11,166.1291240.6815.46<0.0001significant
A X Coordinates328.691328.694.100.0454significant
B Y Coordinates25.80125.800.320.5718
A B 9.4919.490.120.7315
A 2 265.741265.743.310.0715
B 2 3086.8313086.8338.47<0.0001
A 2 B 1349.0611349.0616.81<0.0001
A B 2 4598.2814598.2857.31<0.0001
A 3 40.55140.550.510.4786
B 3 449.781449.785.610.0196
Residual8825.9111080.24
                         Lack of Fit7635.3414545.3843.98<0.0001significant
                         Pure Error1190.579612.40
             Cor Total19,992.57119
Std. Dev.8.96 R 2 0.5585
Mean1.18
Table 7. Dev-1 and Dev-2 characterization: ANOVA table for response T.
SourceSum of
Squares
dfMean
Square
F-Valuep-Value
Block0.1920.093
Model437.19948.58290.35<0.0001significant
A Device87.47187.47522.79<0.0001significant
B-Flow Rate275.59468.90411.80<0.0001significant
AB74.13418.53110.77<0.0001significant
Residual3.01180.17
Cor Total440.3929
Std. Dev0.41 R 2 0.9932
Mean2.96
Disclaimer/Publisher’s Note: The statements, opinions and data contained in all publications are solely those of the individual author(s) and contributor(s) and not of MDPI and/or the editor(s). MDPI and/or the editor(s) disclaim responsibility for any injury to people or property resulting from any ideas, methods, instructions or products referred to in the content.

