

Investigating the Impact of Seasonal Input Stream Fluctuations on Post-Consumer High-Density Polyethylene Composition and Processing


Abstract
1. Introduction
2. Materials and Methods
2.1. Determination of the Material Composition and Rheology
2.2. Processing Through Extrusion and Injection Moulding
2.3. Offline Product Quality Analysis
3. Results and Discussion
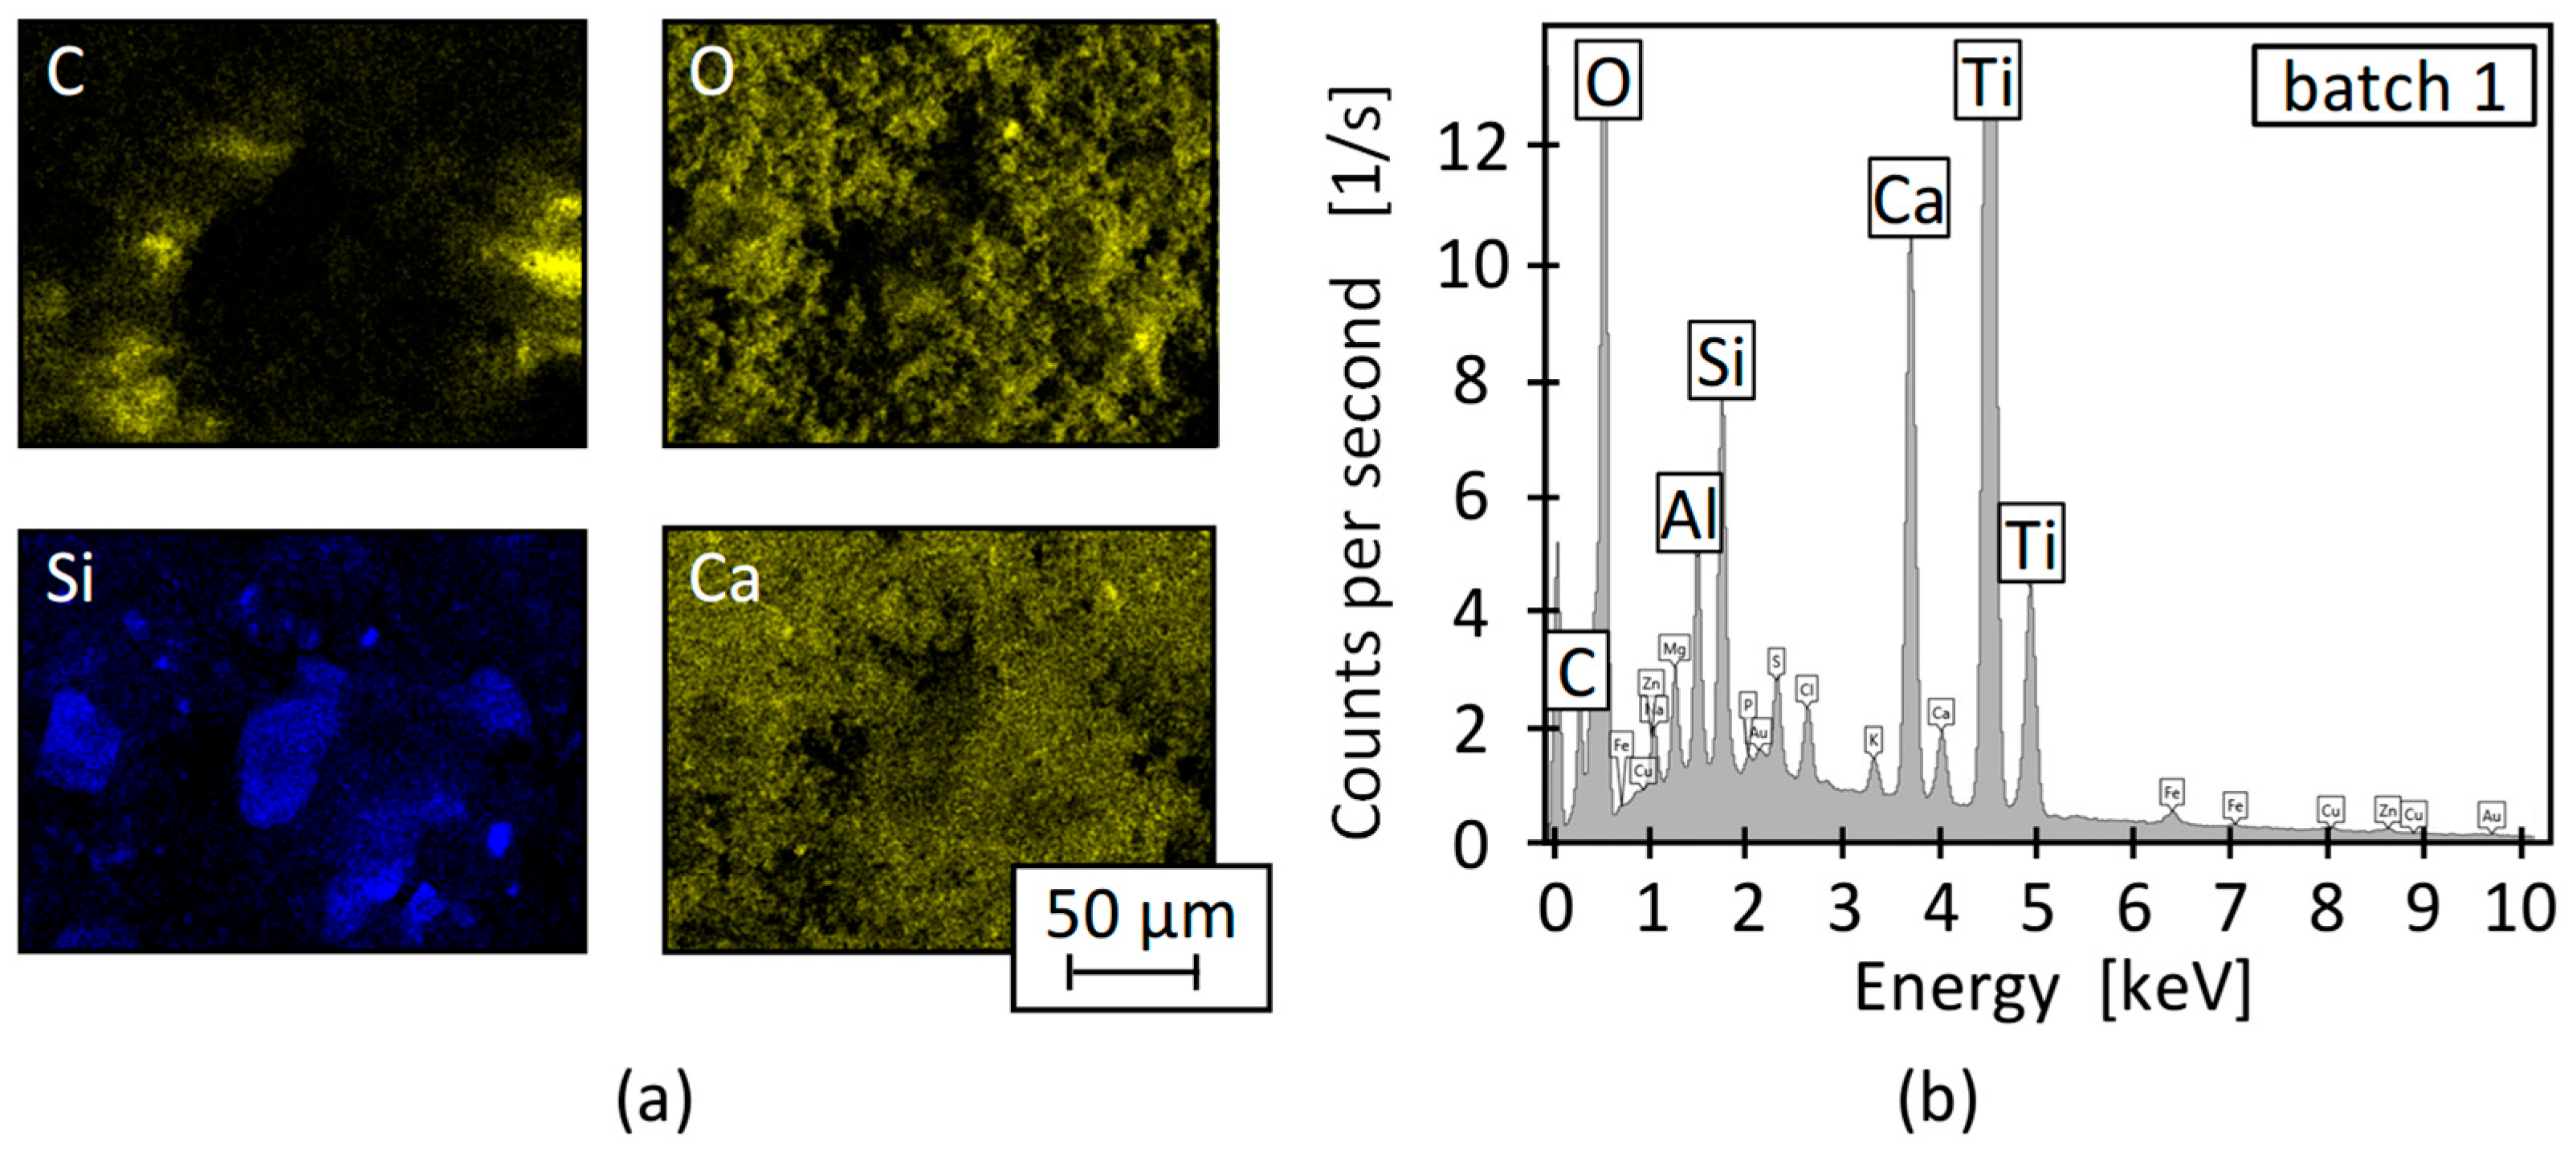
3.1. Material Analysis
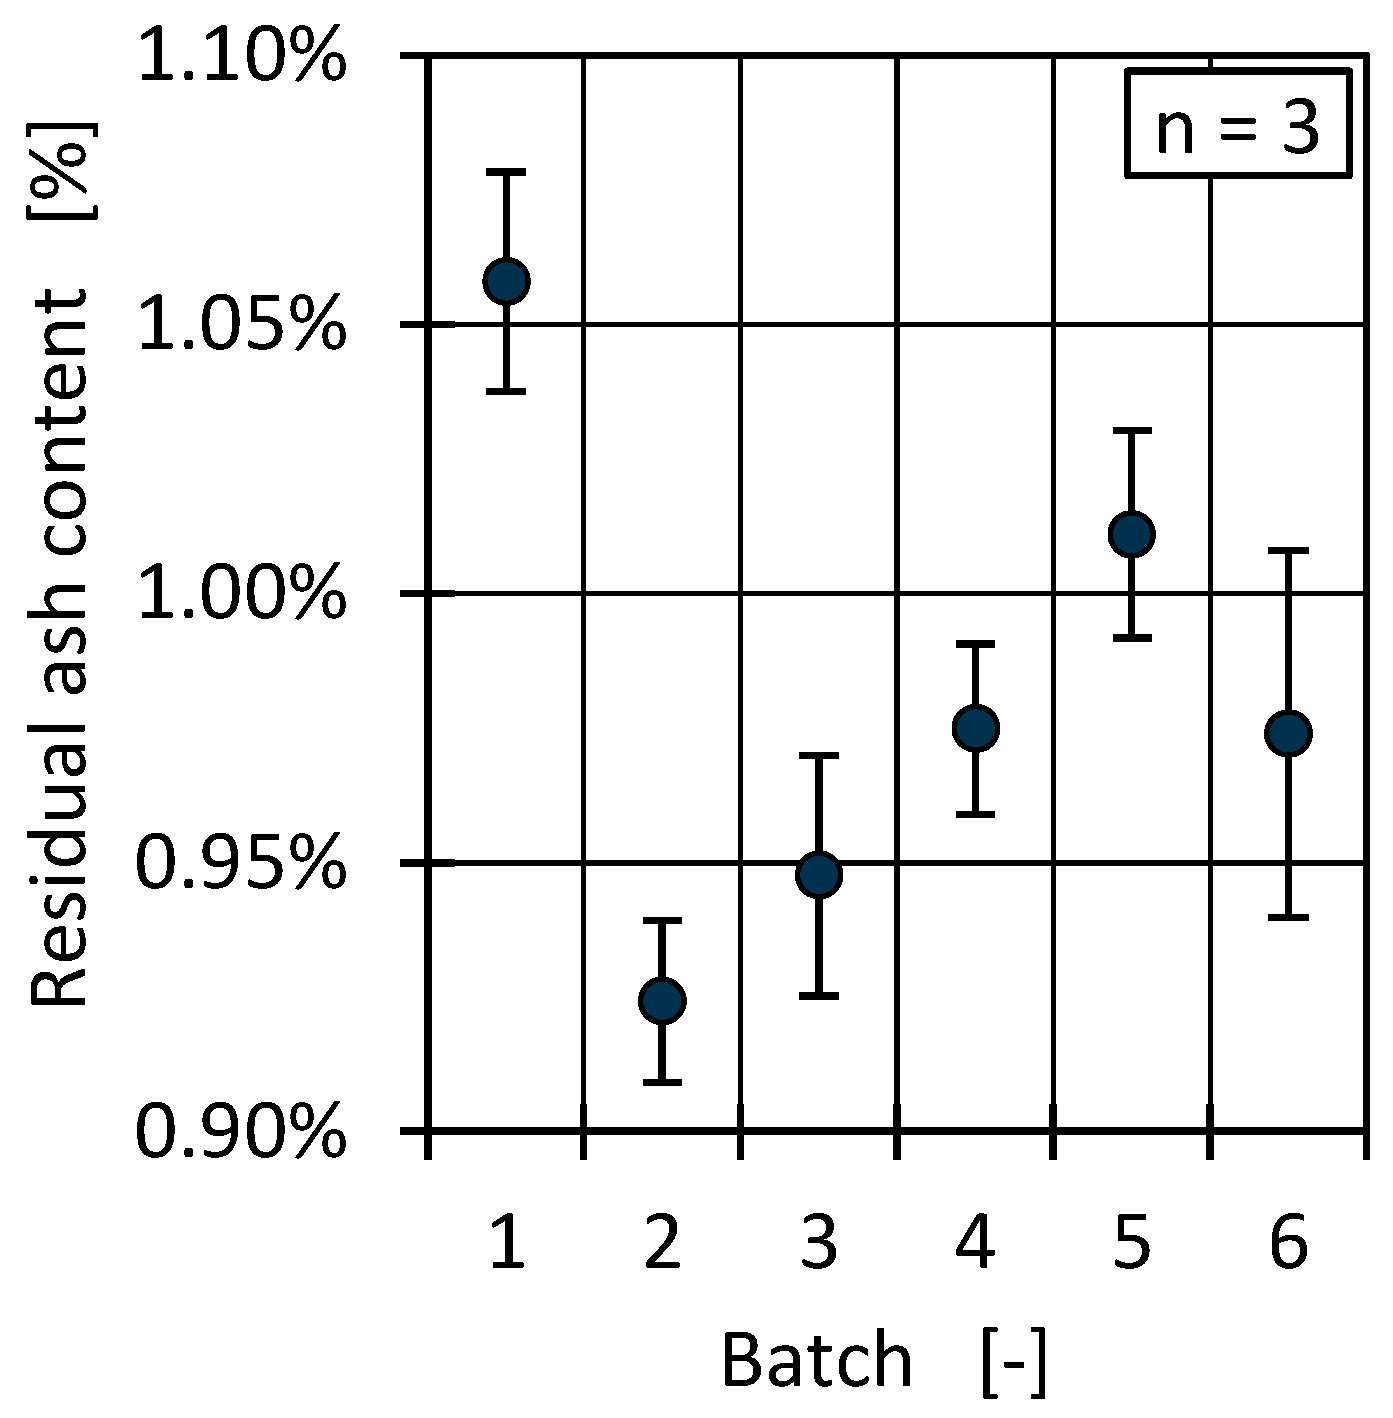
3.1.1. Residual Ash Content
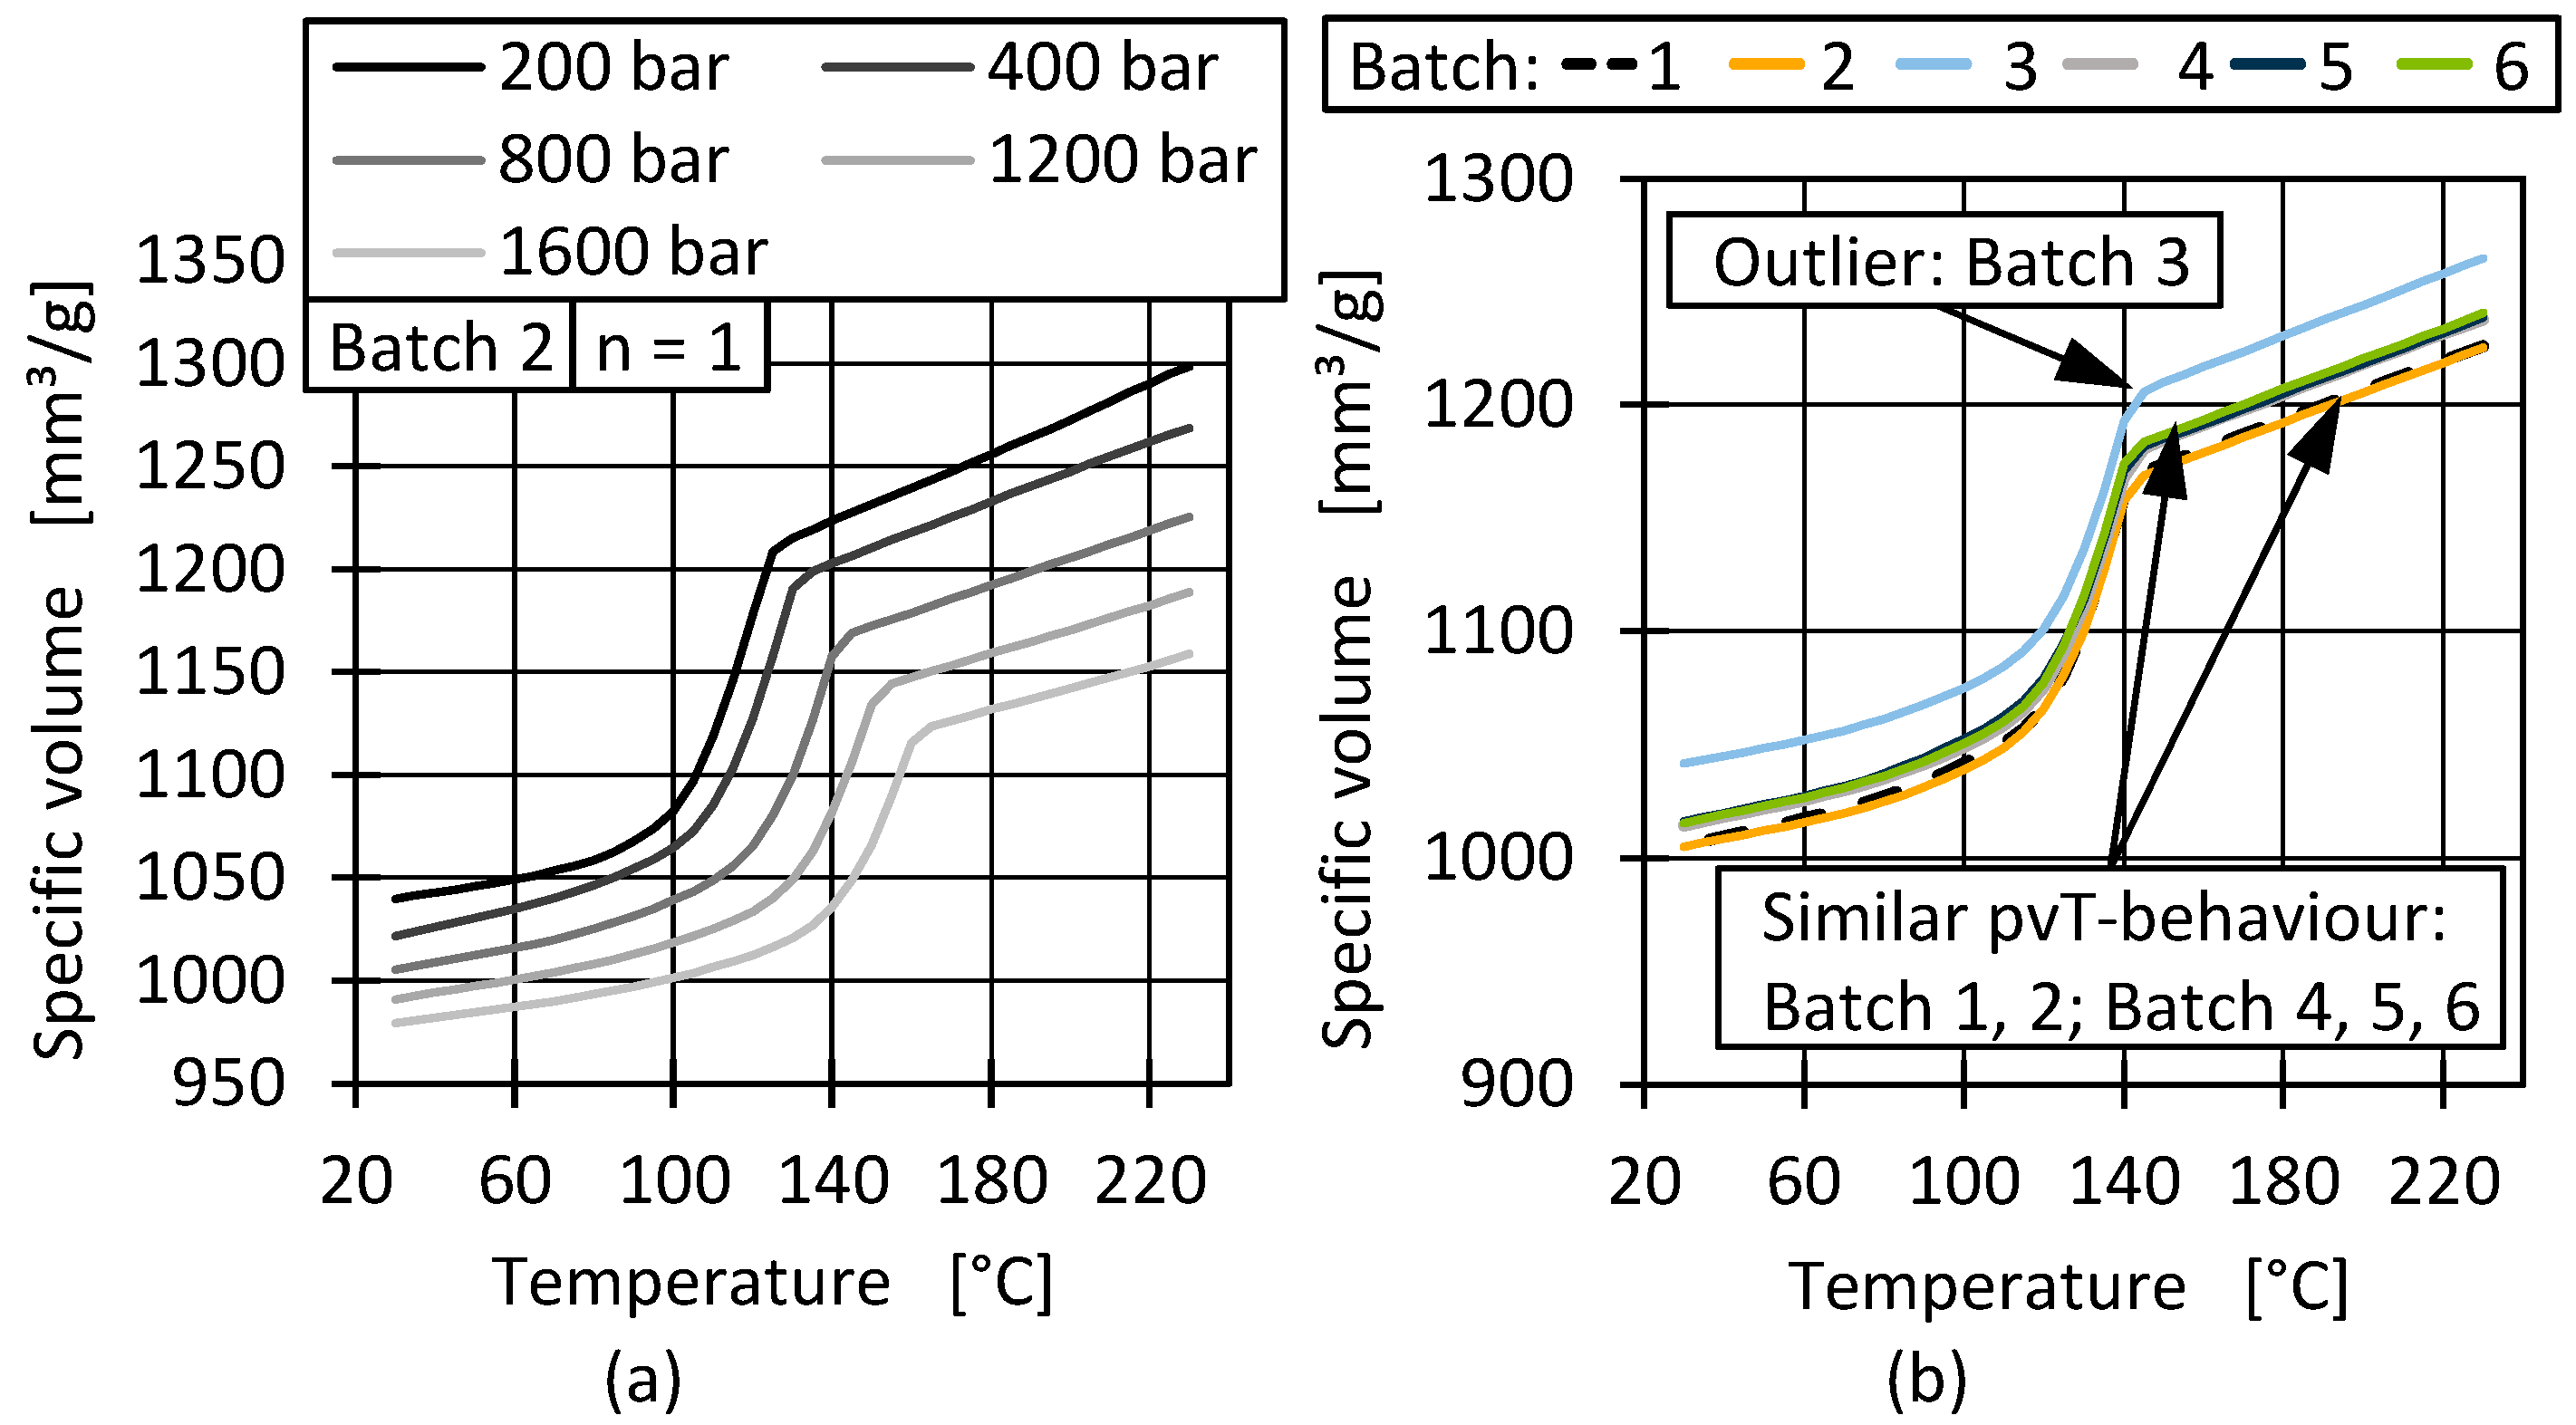
3.1.2. Pressure- and Temperature-Dependent Specific Volume (pvT)
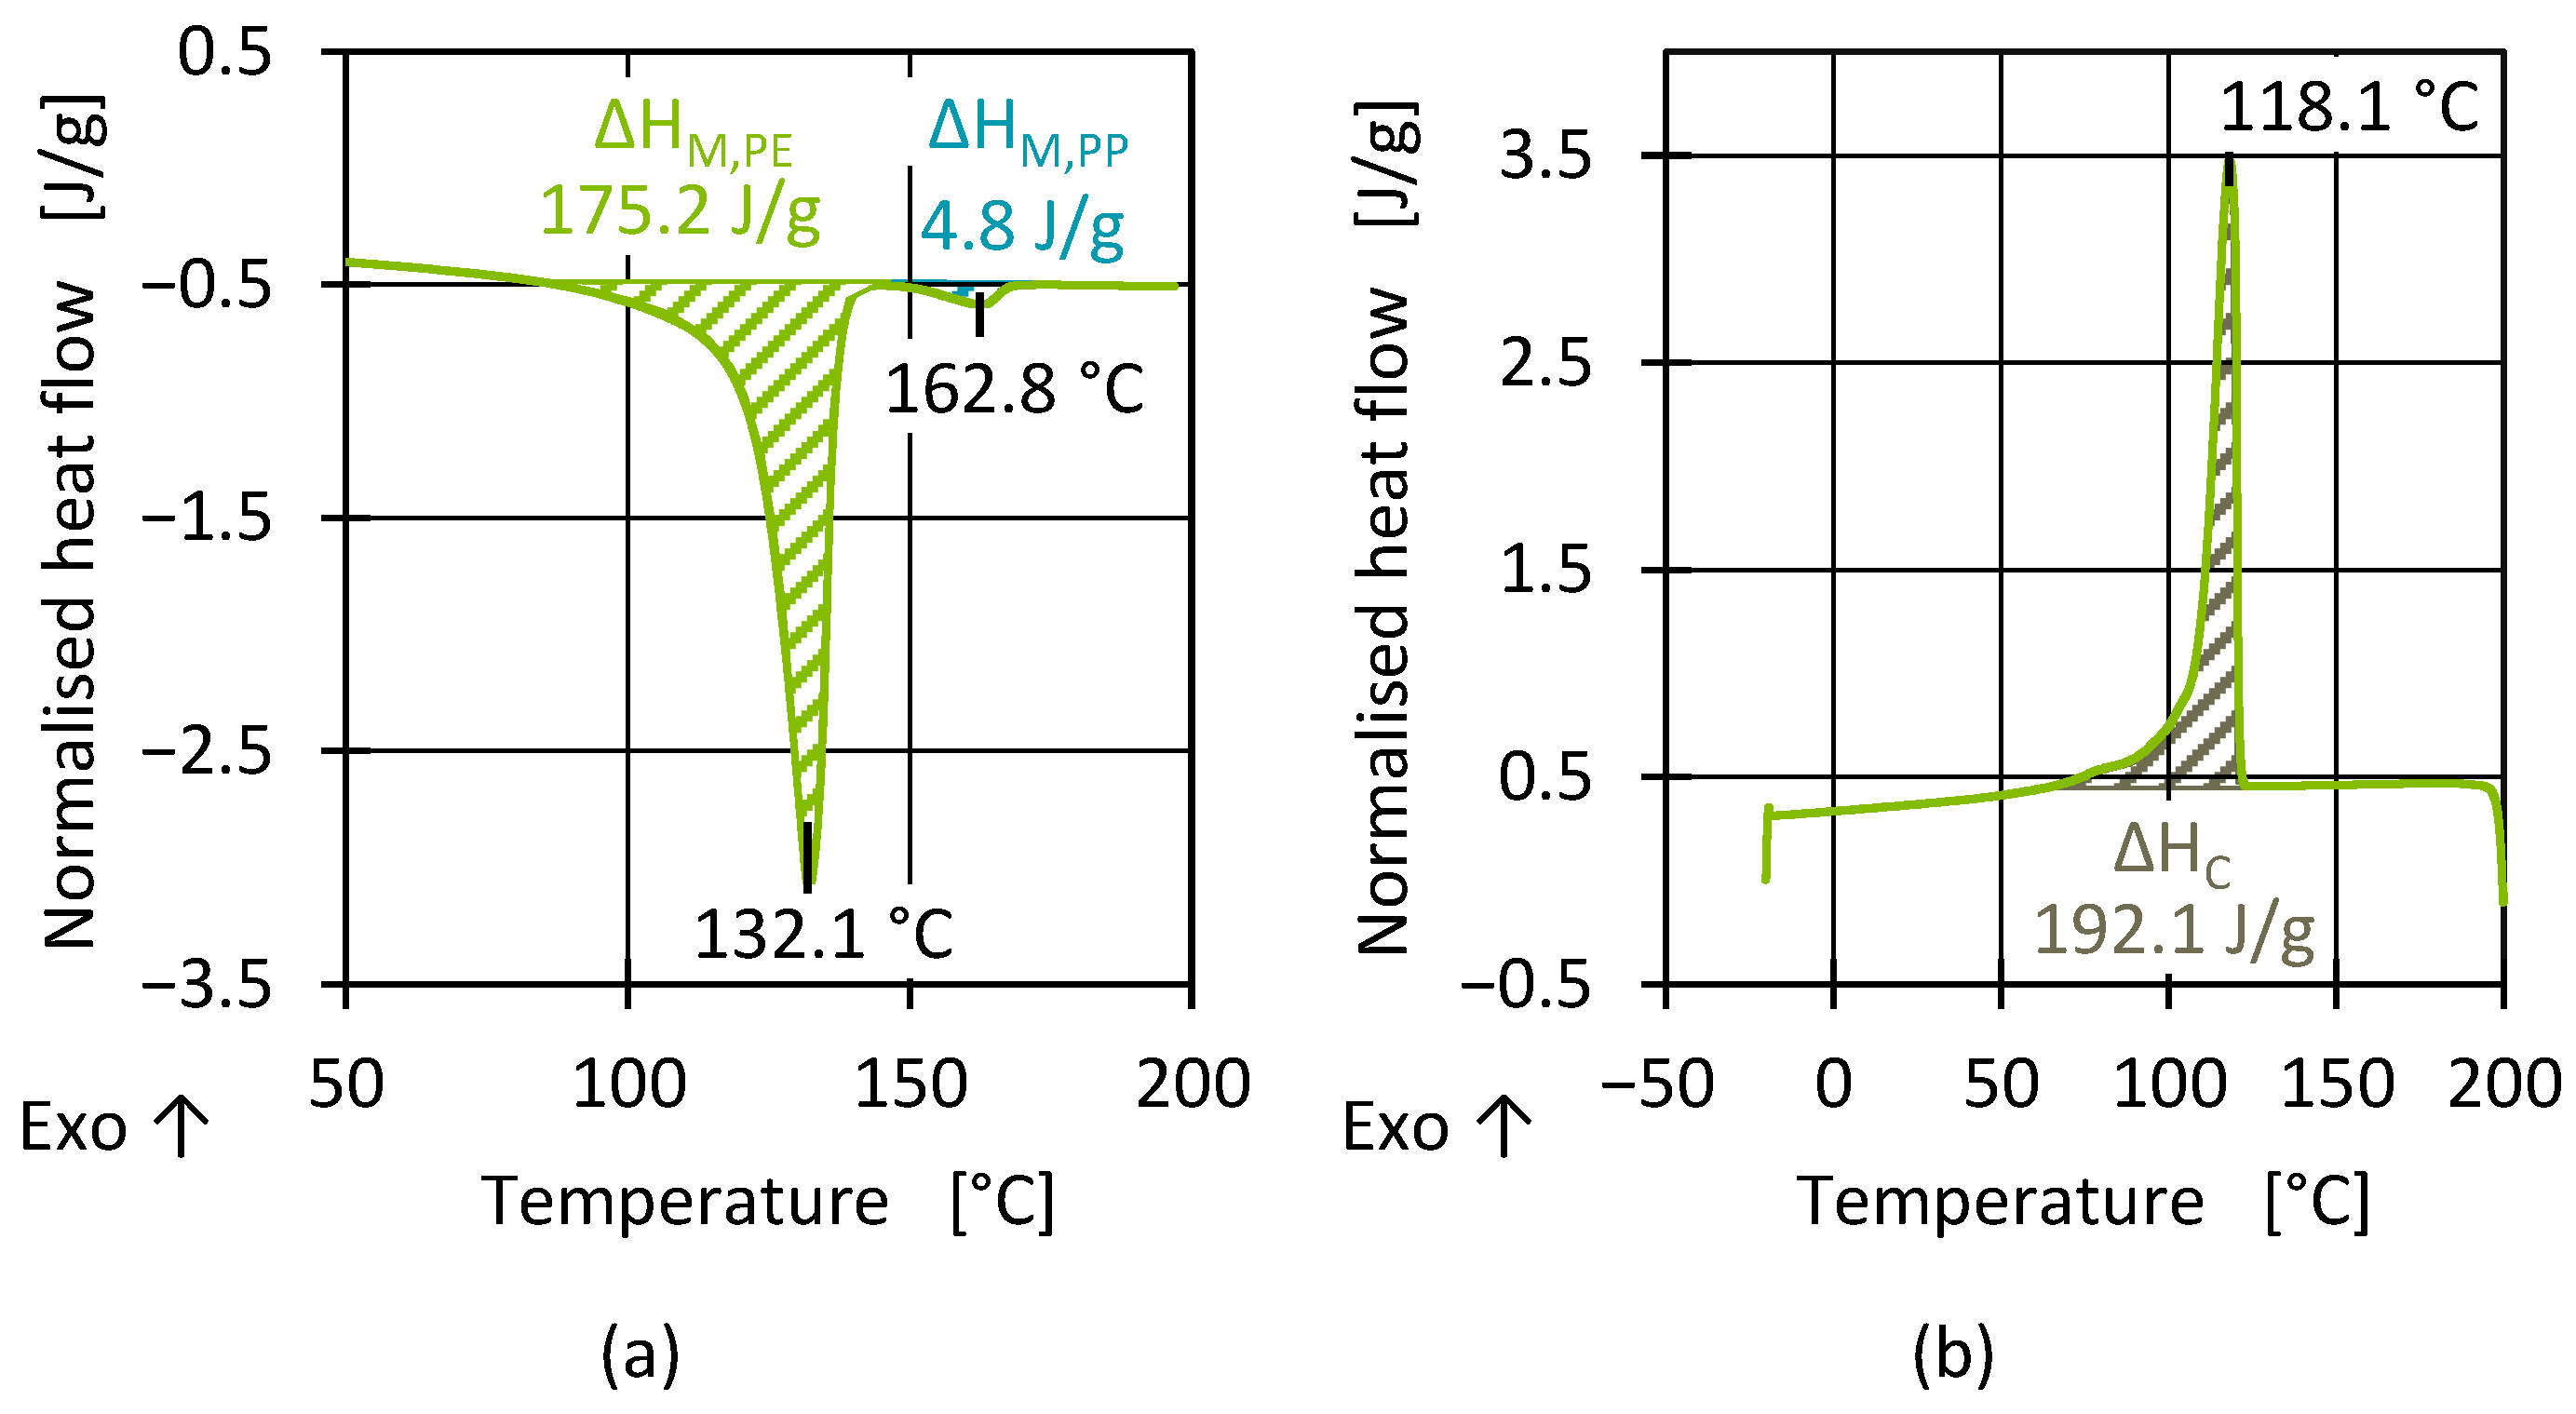
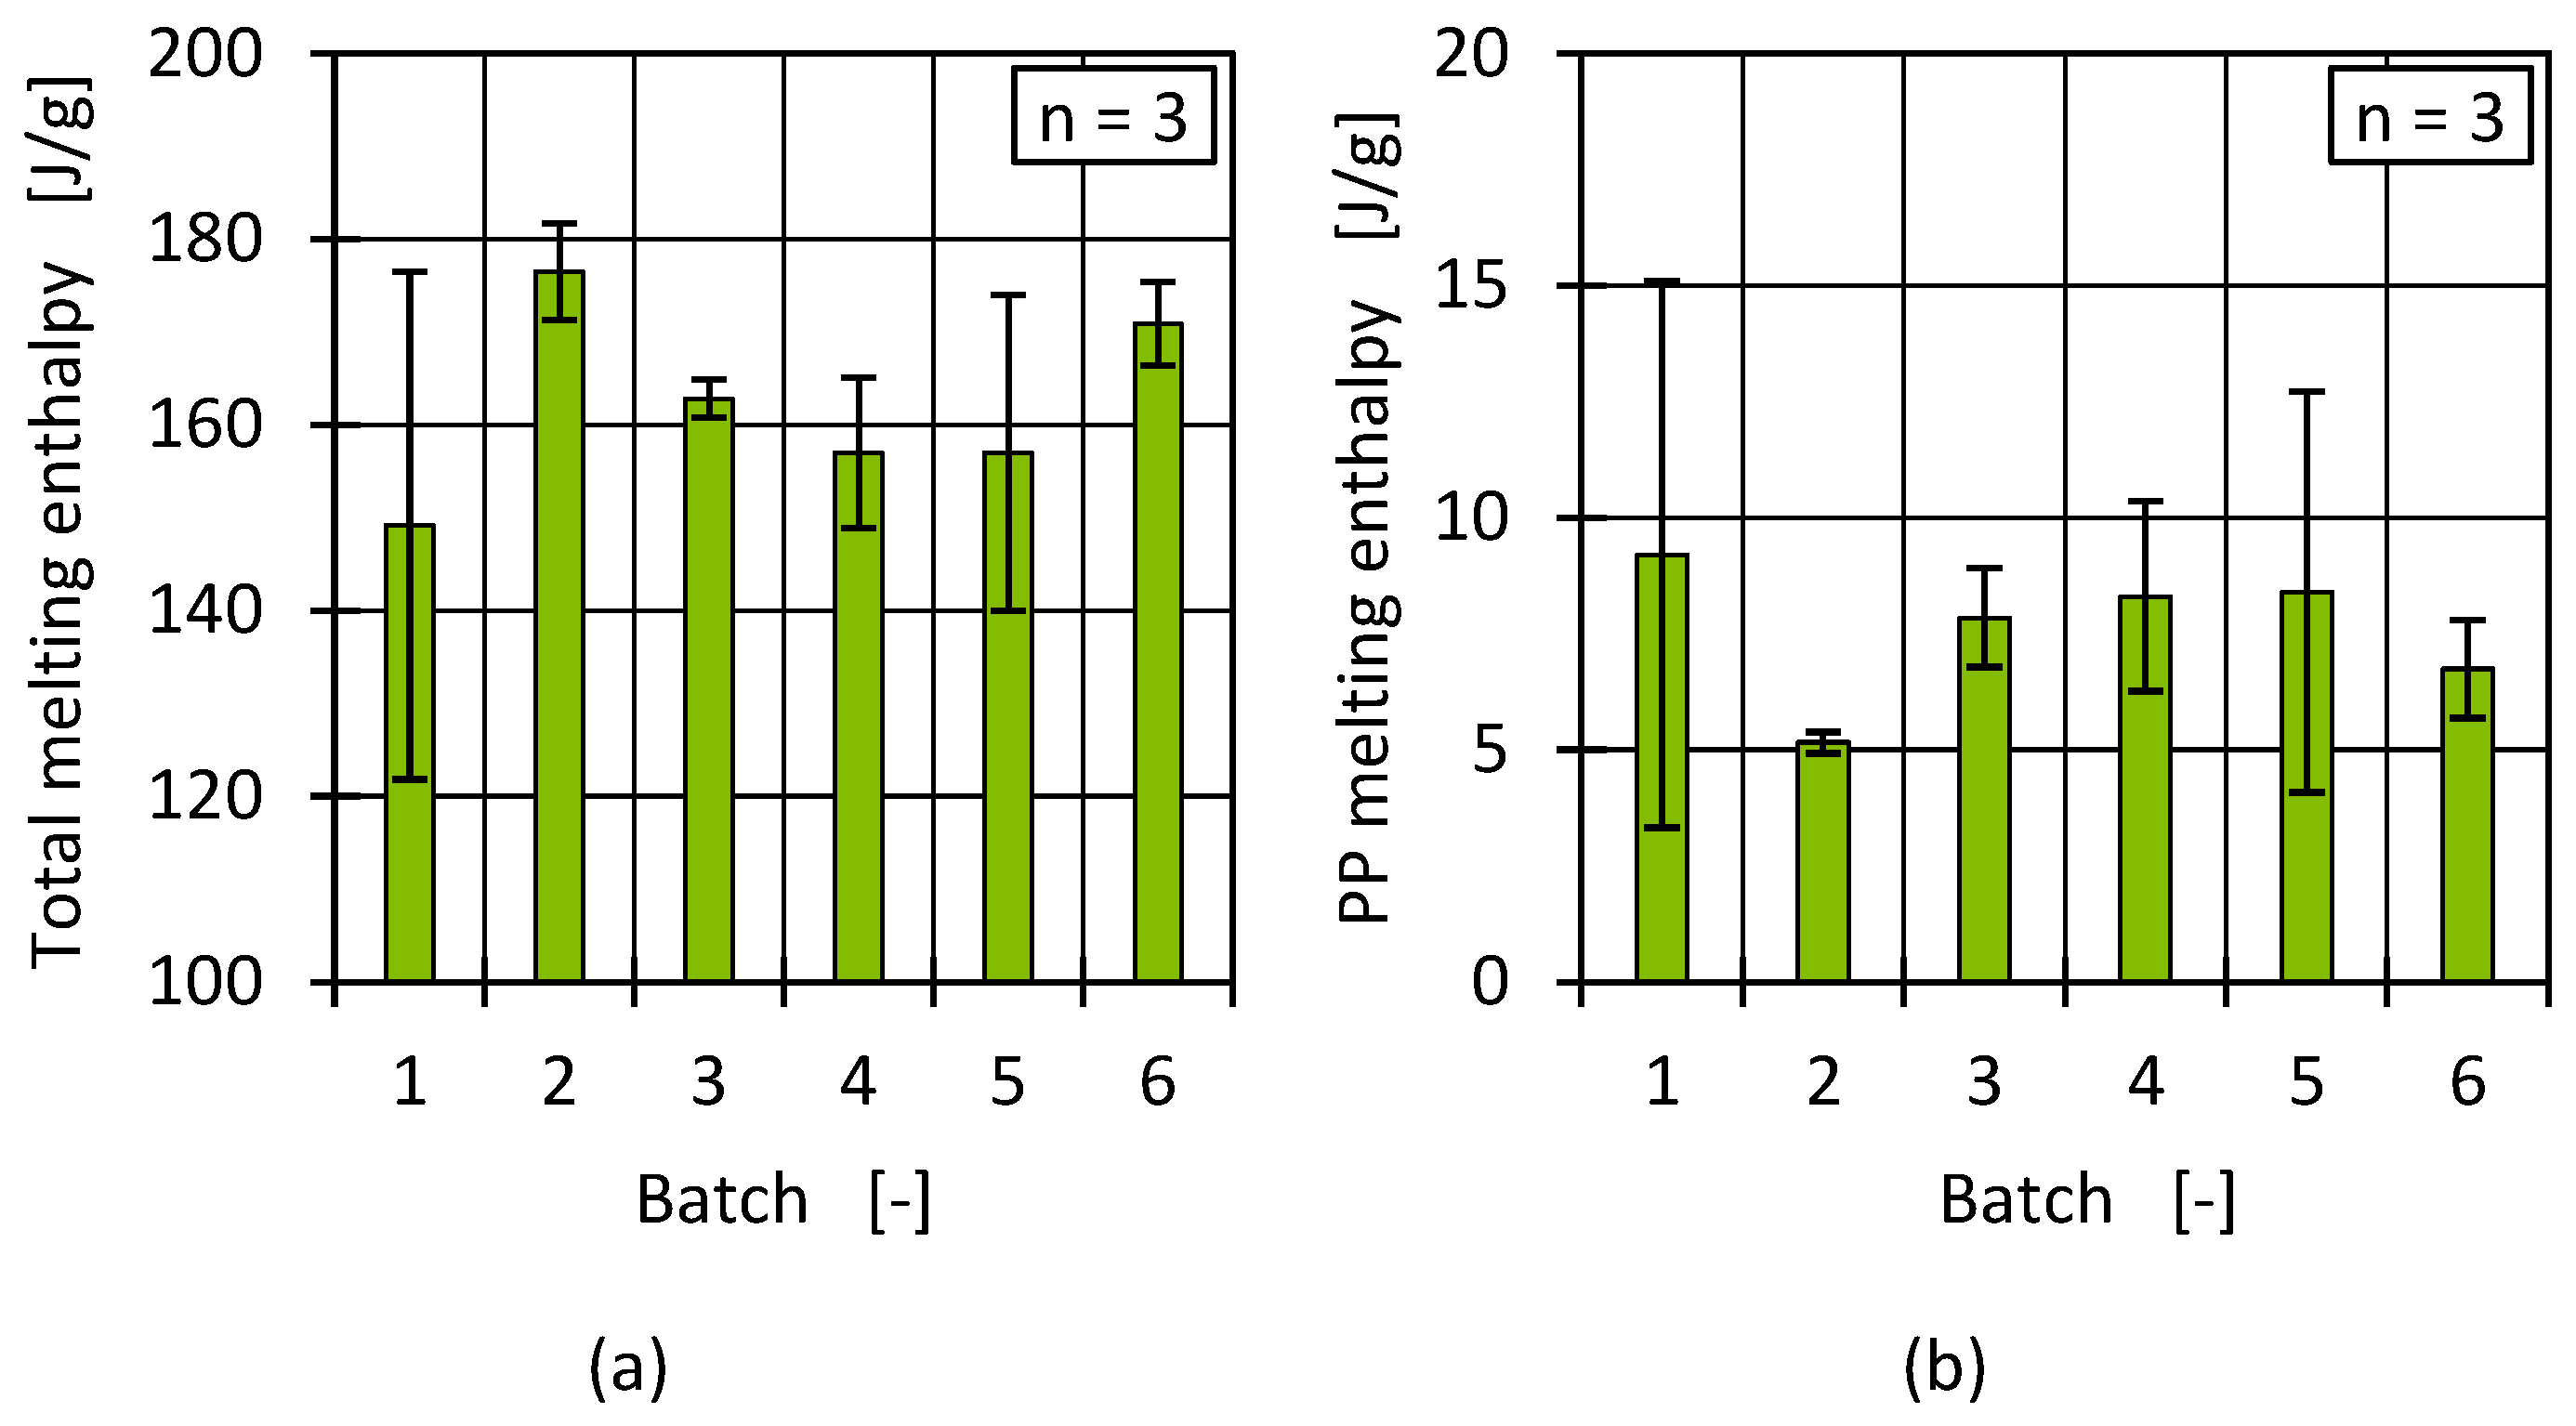
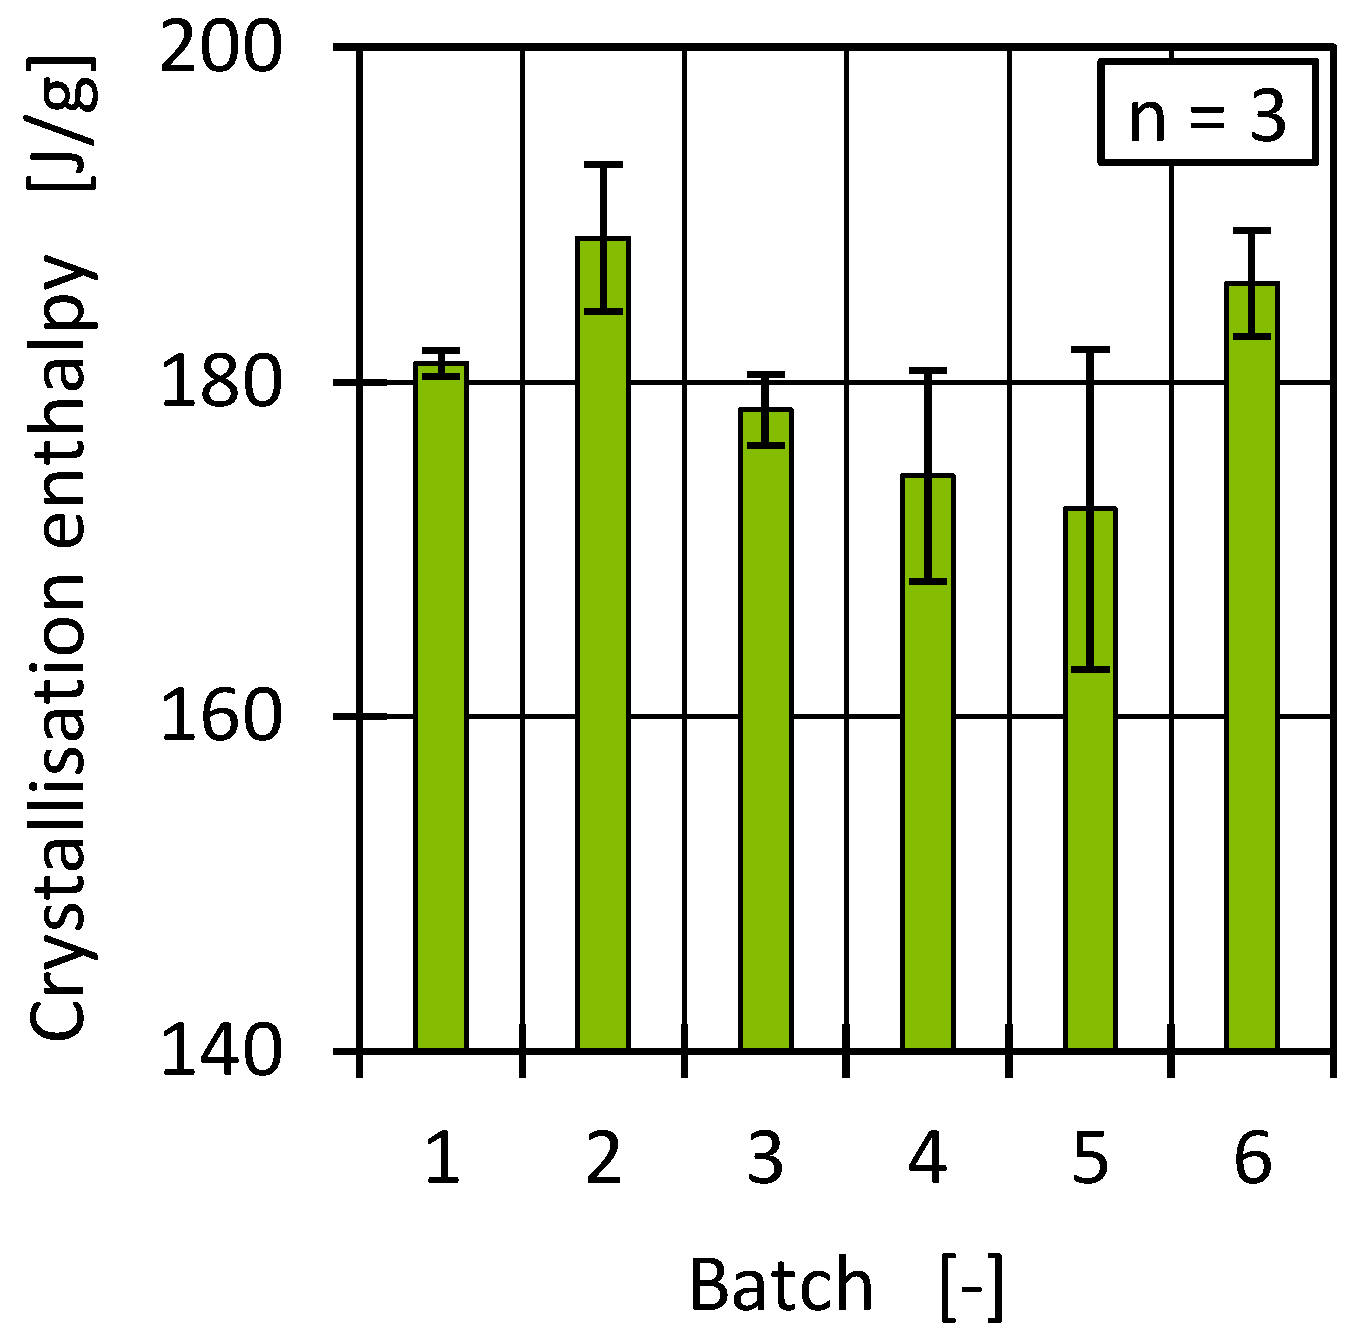
3.1.3. Crystallisation and Composition Regarding Foreign Polymers (DSC)
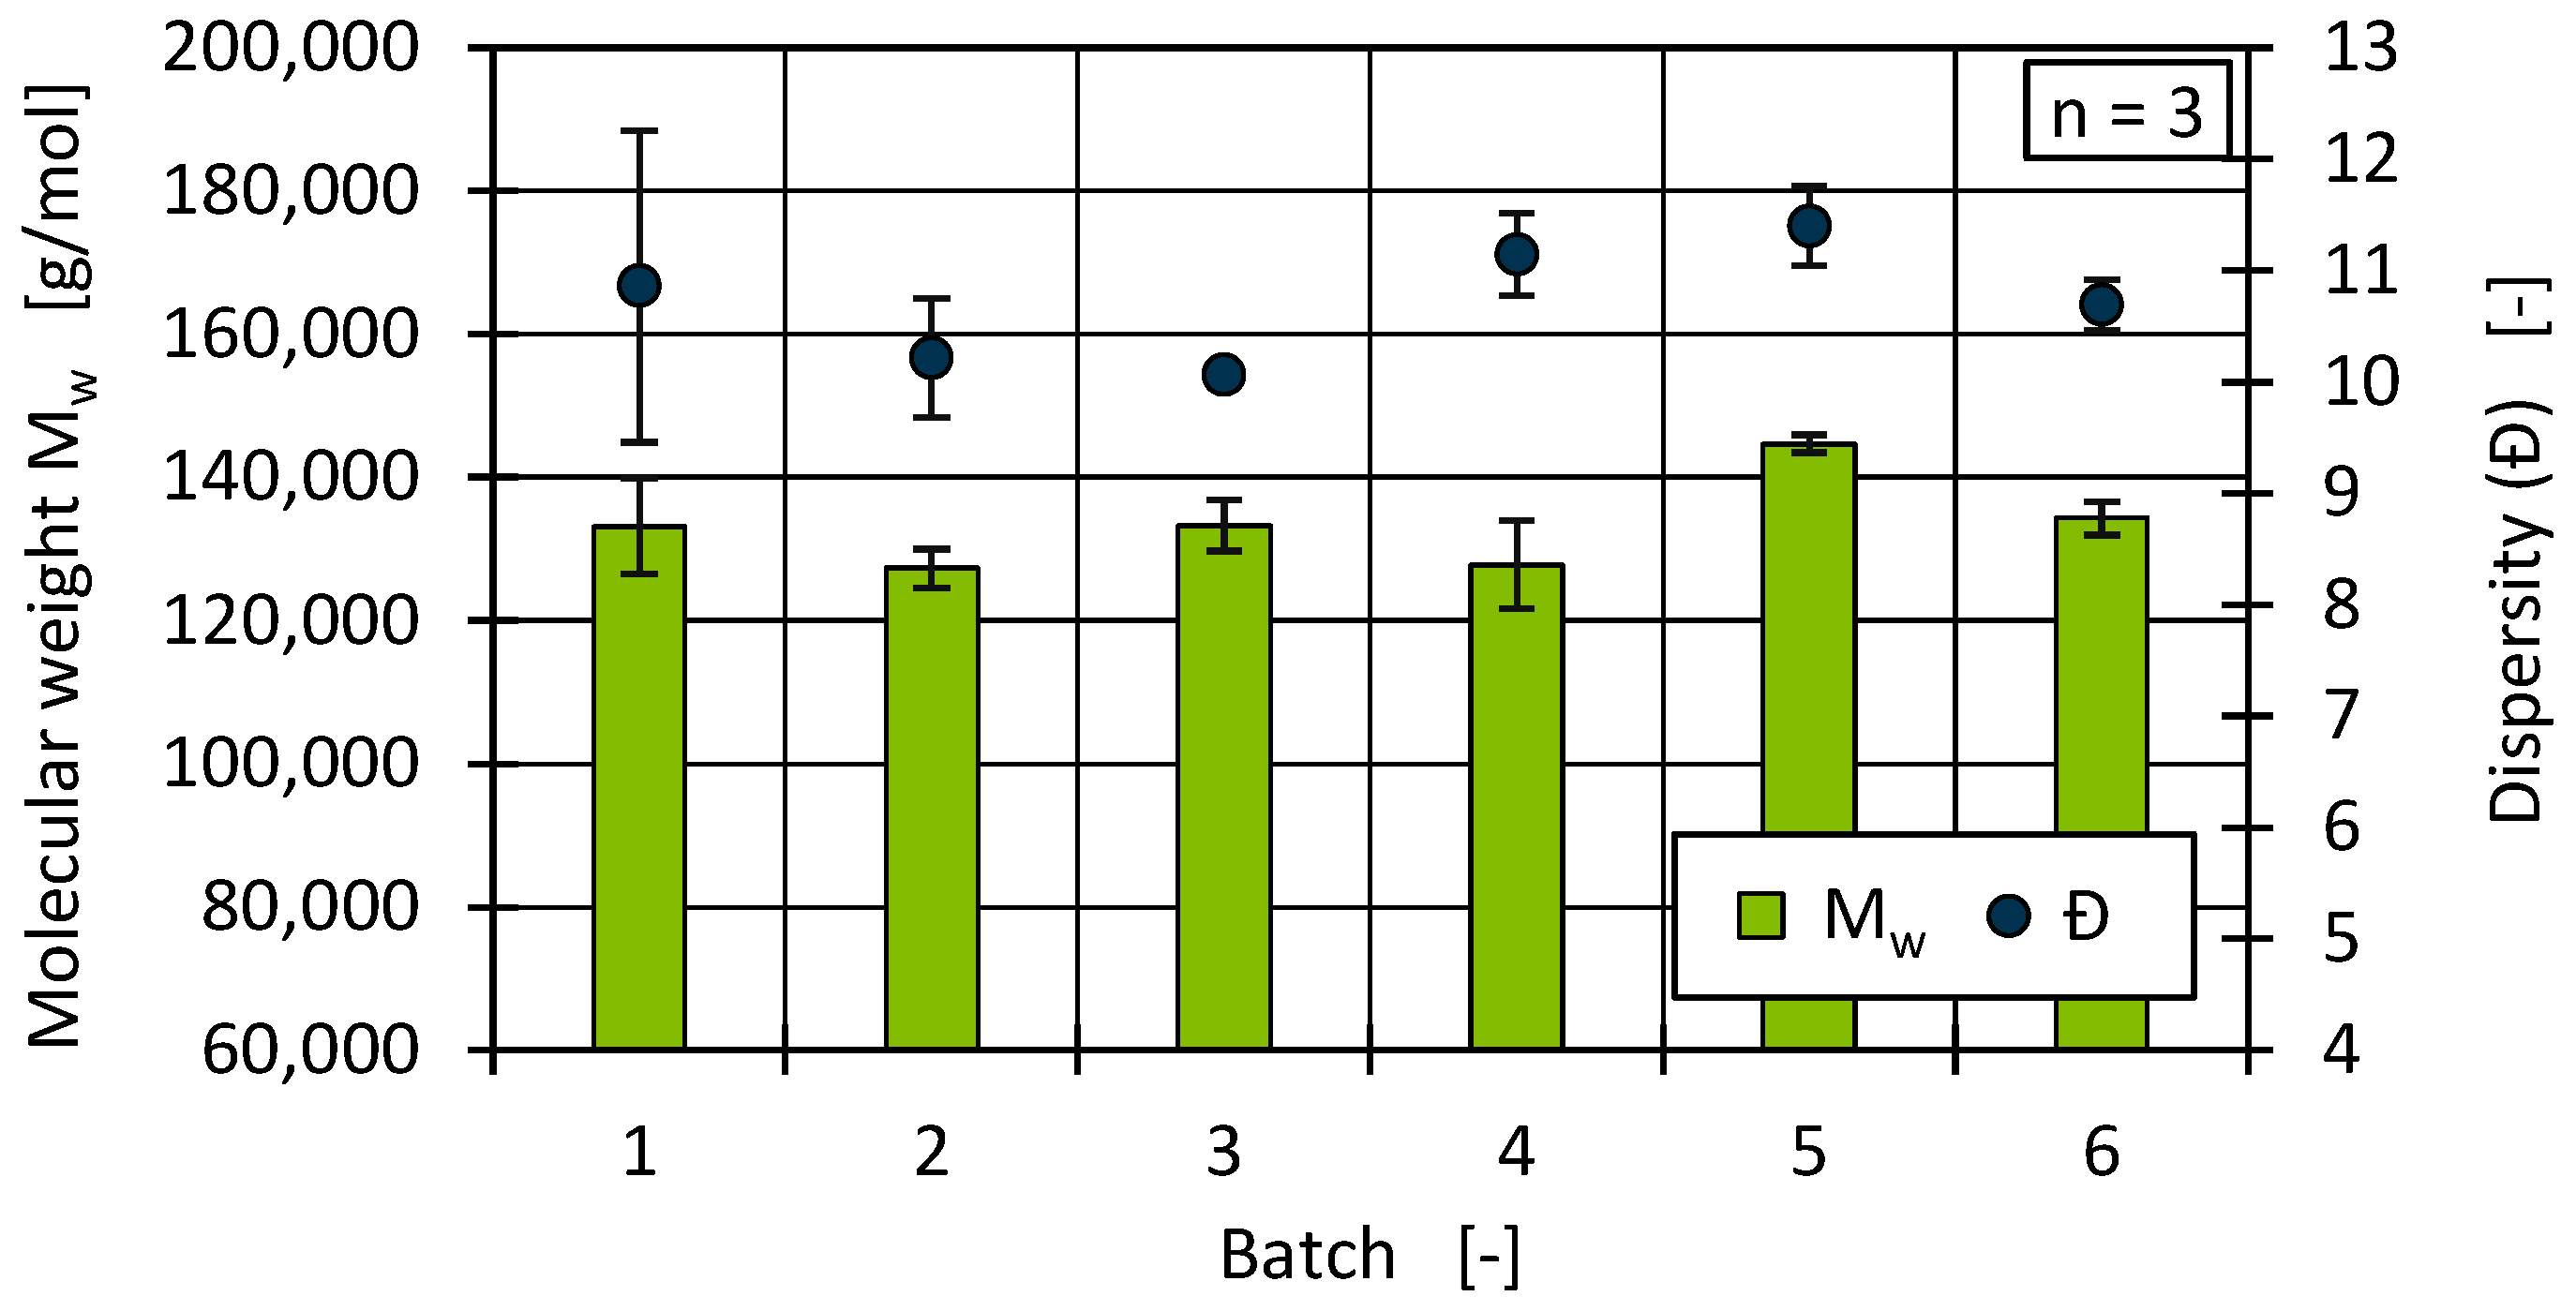
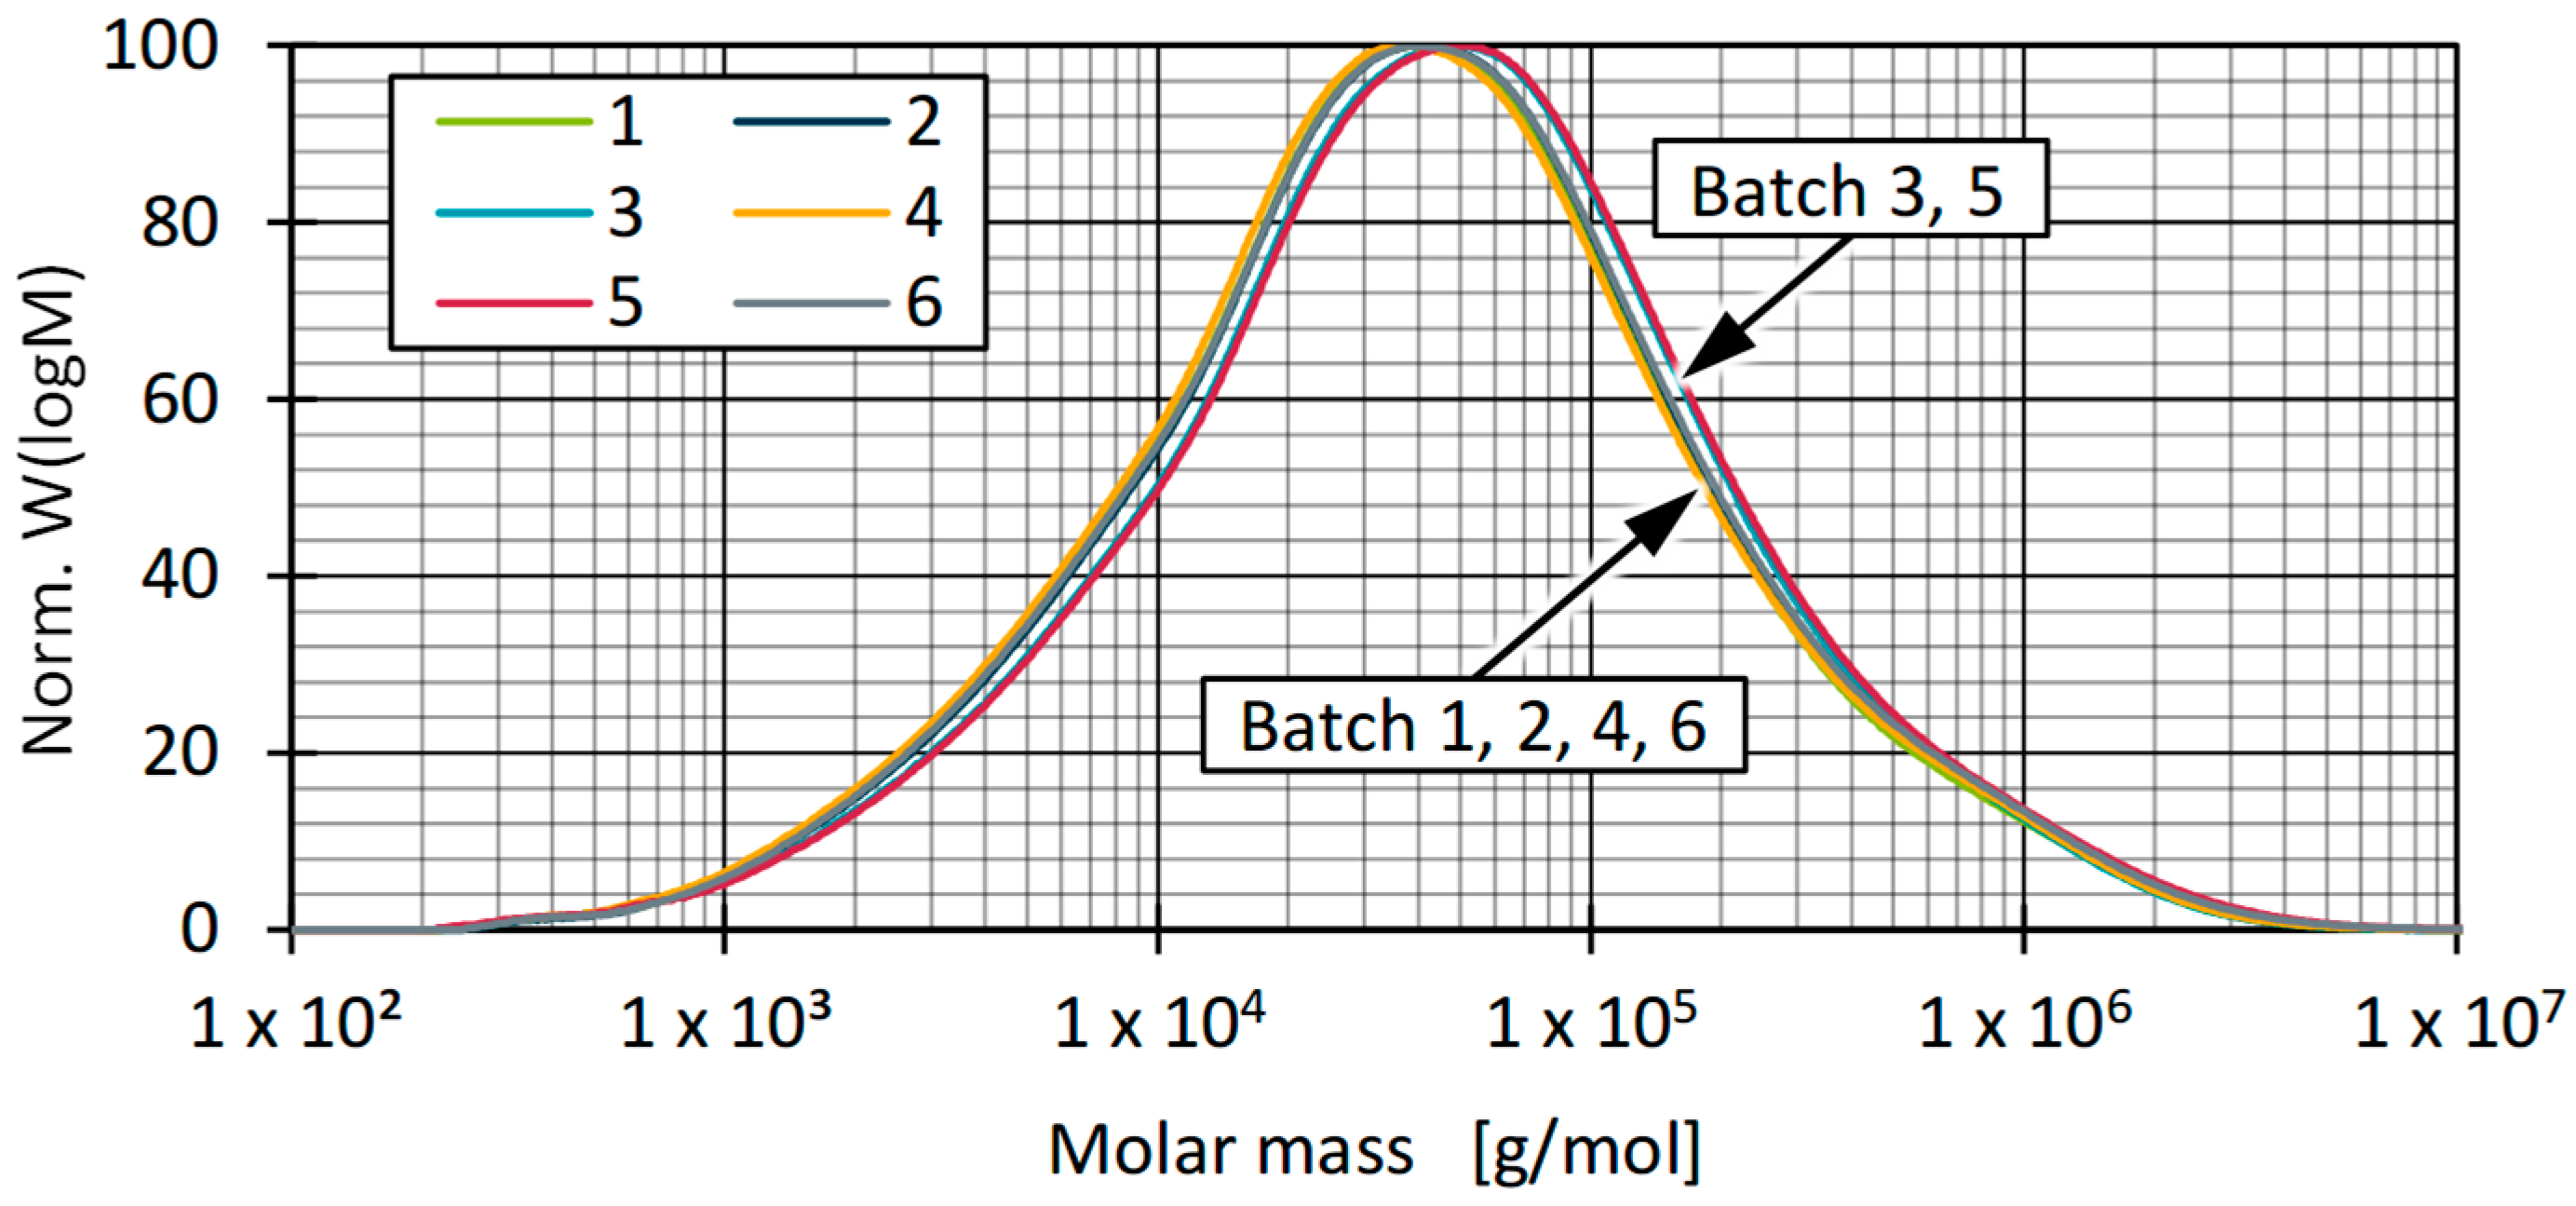
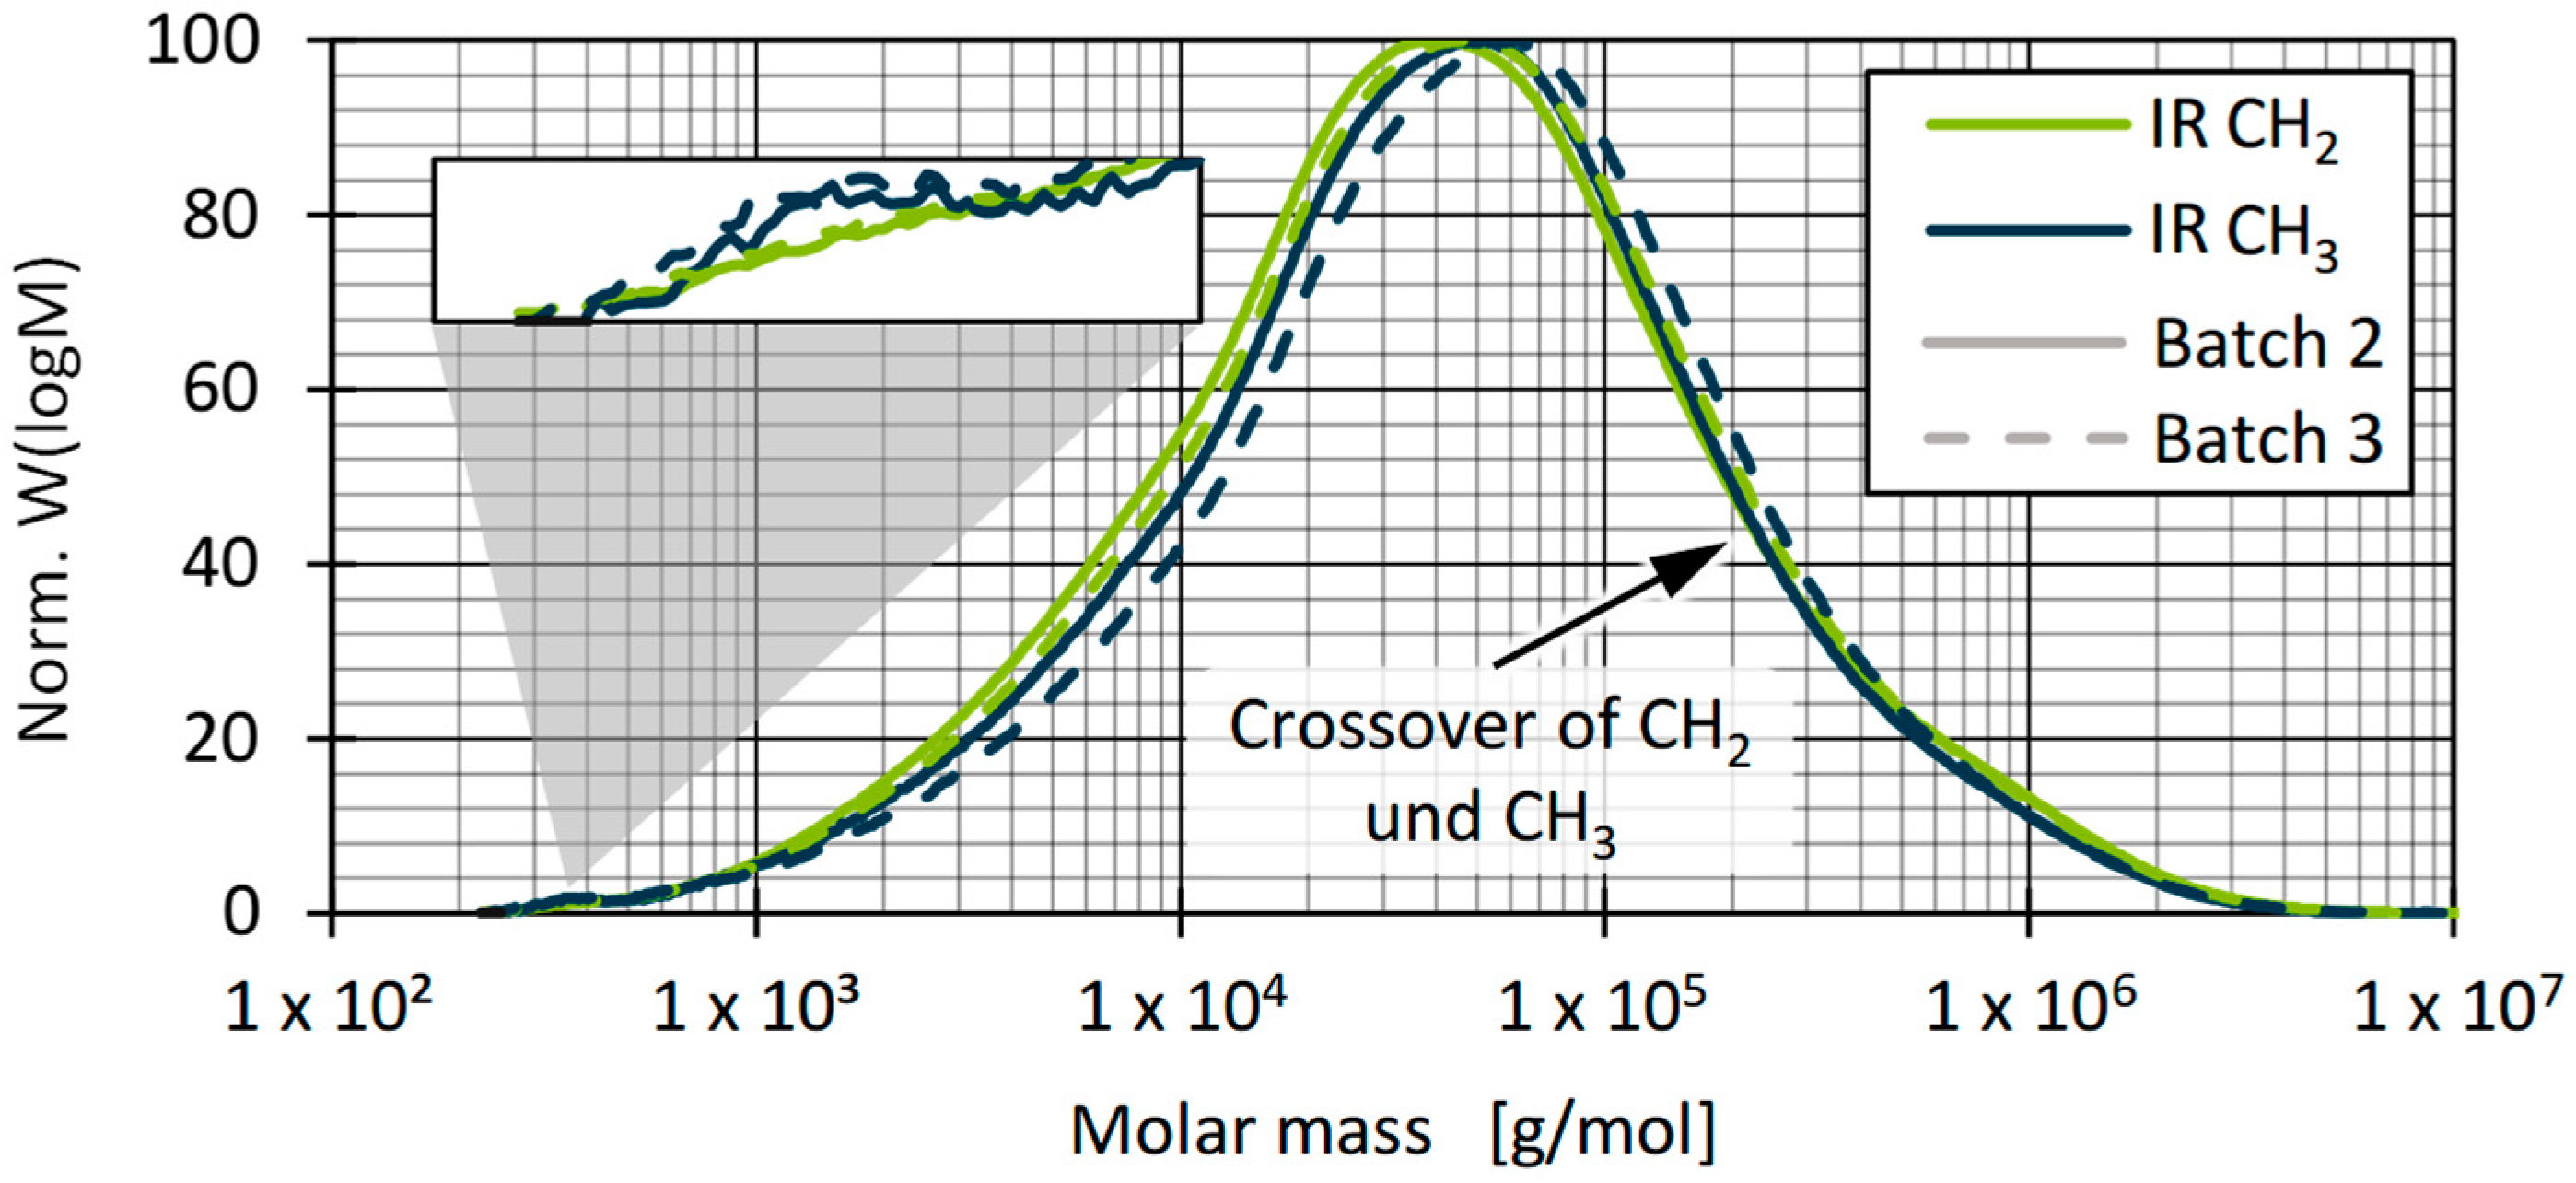
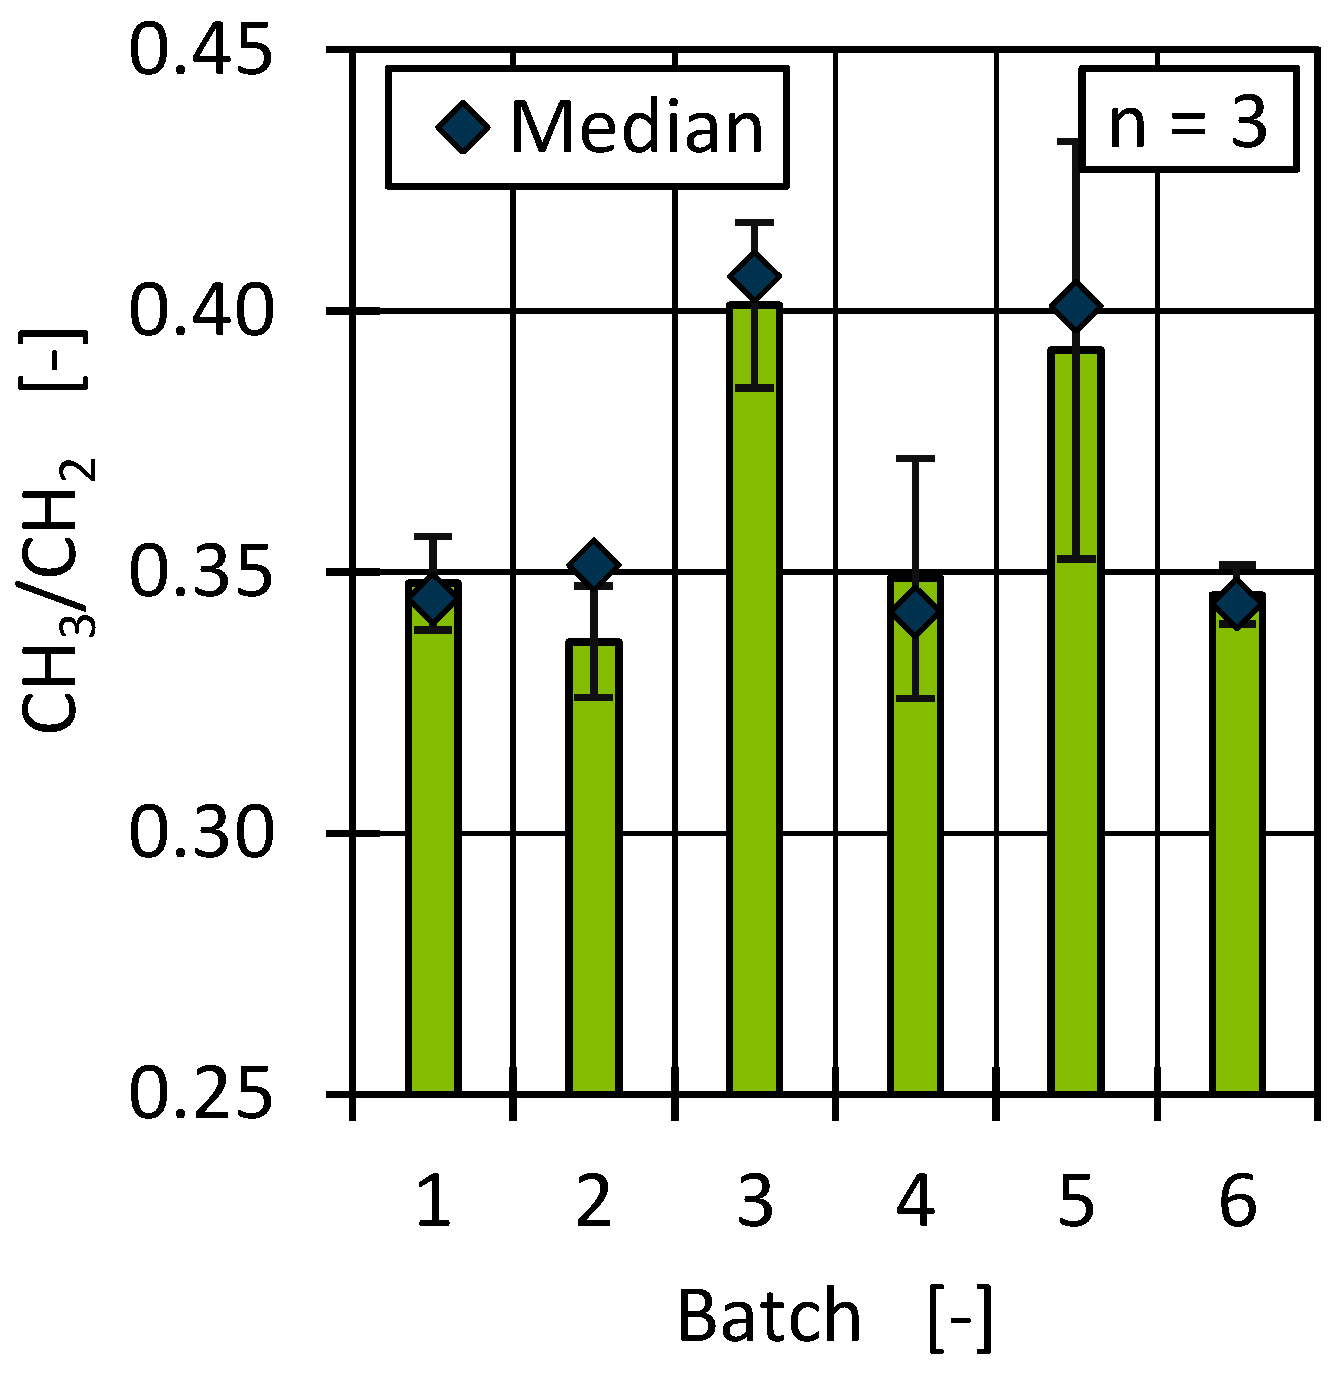
3.1.4. Molecular Structure (HT-GPC)
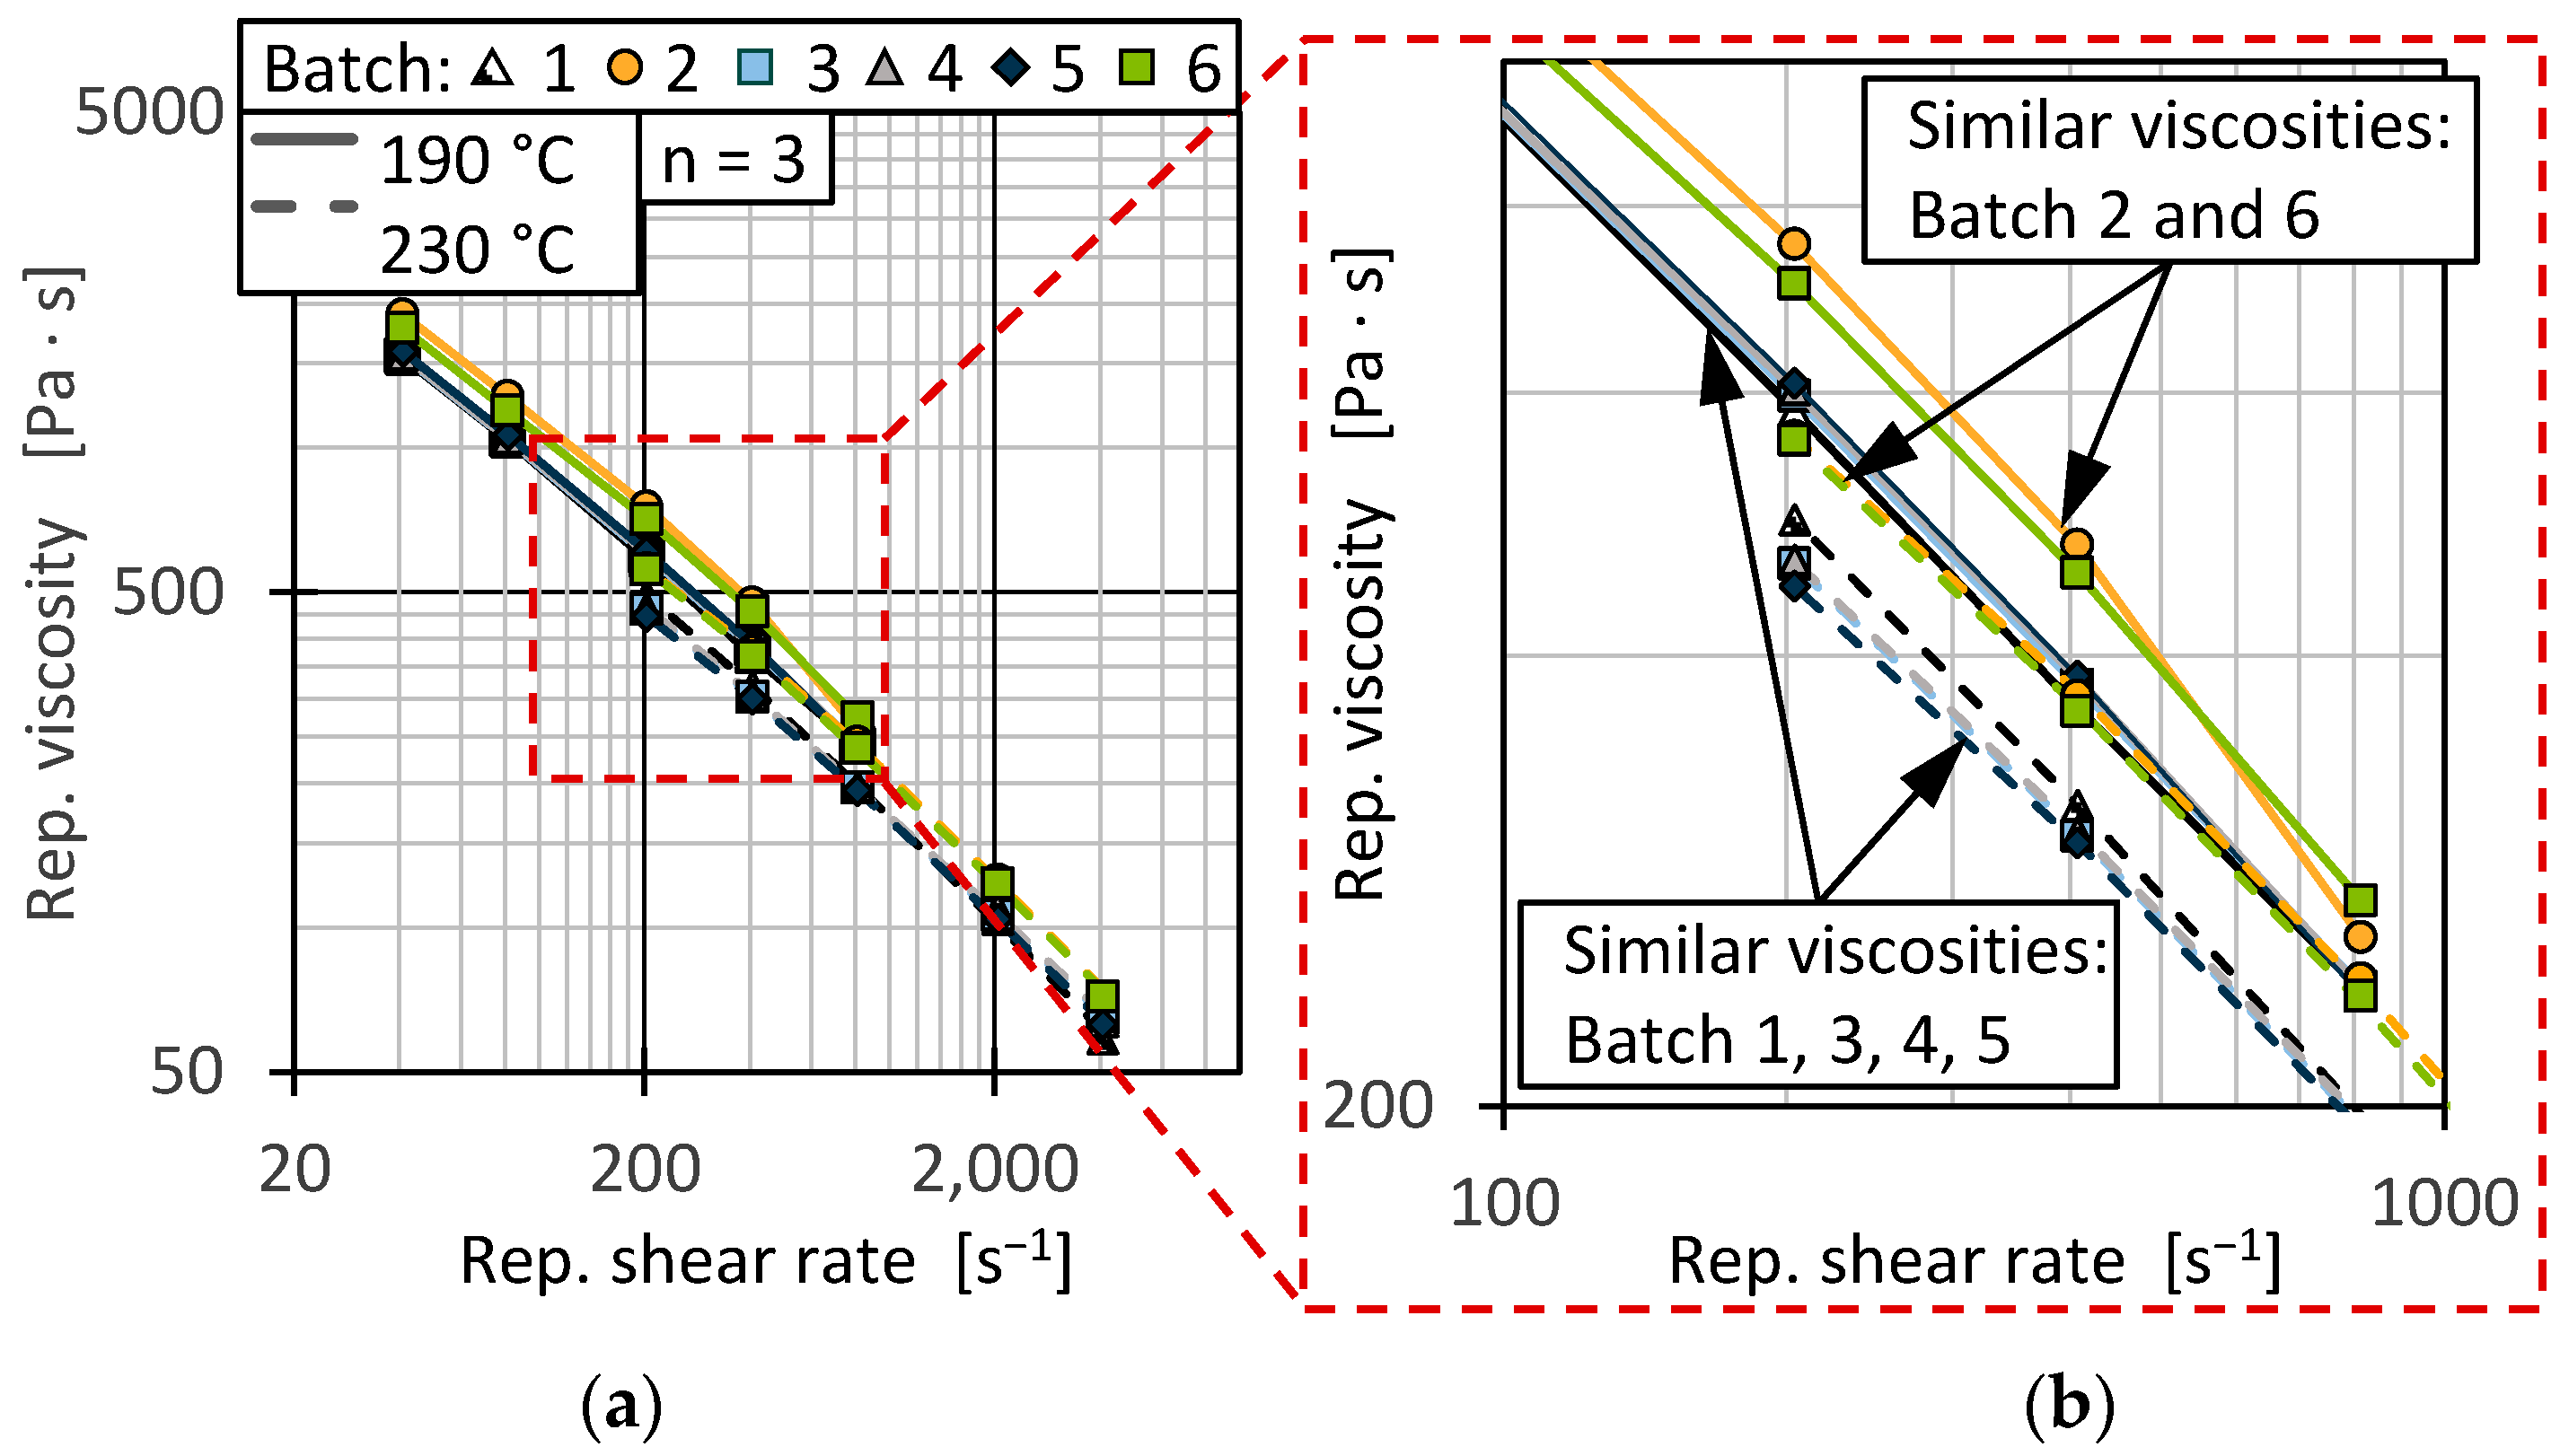
3.1.5. Melt Flow Rate (MFR) and Representative Viscosity (HCR)
3.2. Influence of Batch Fluctuations on the Process Stability and Film Morphology During Blown- and Cast-Film Extrusion
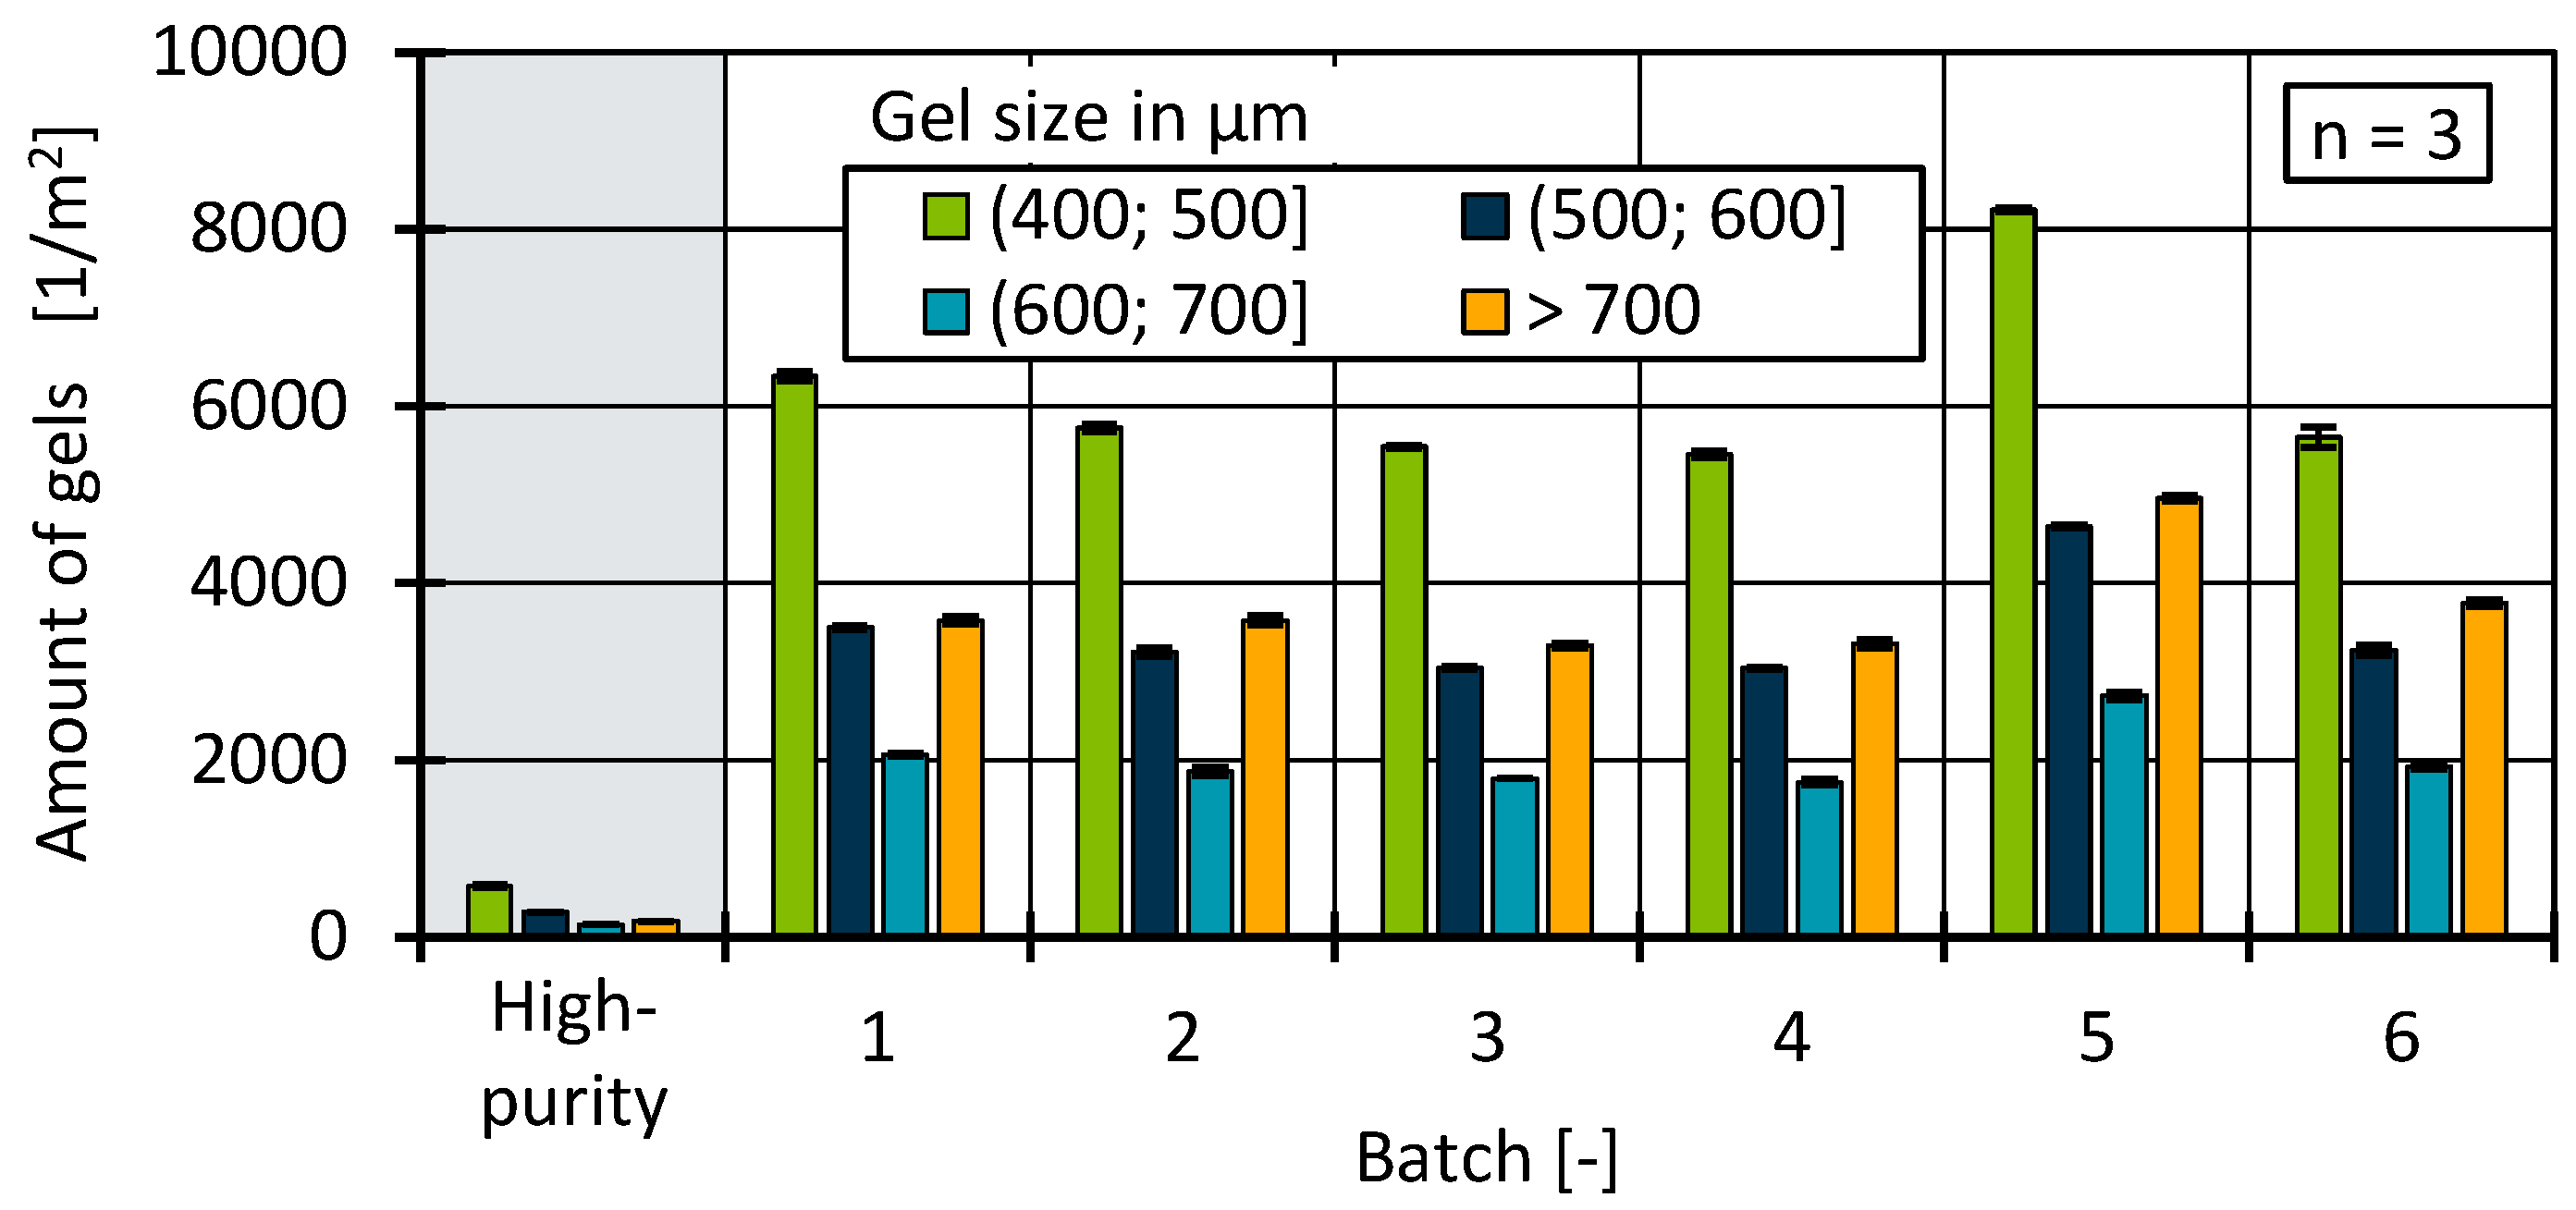
Amount of Gels
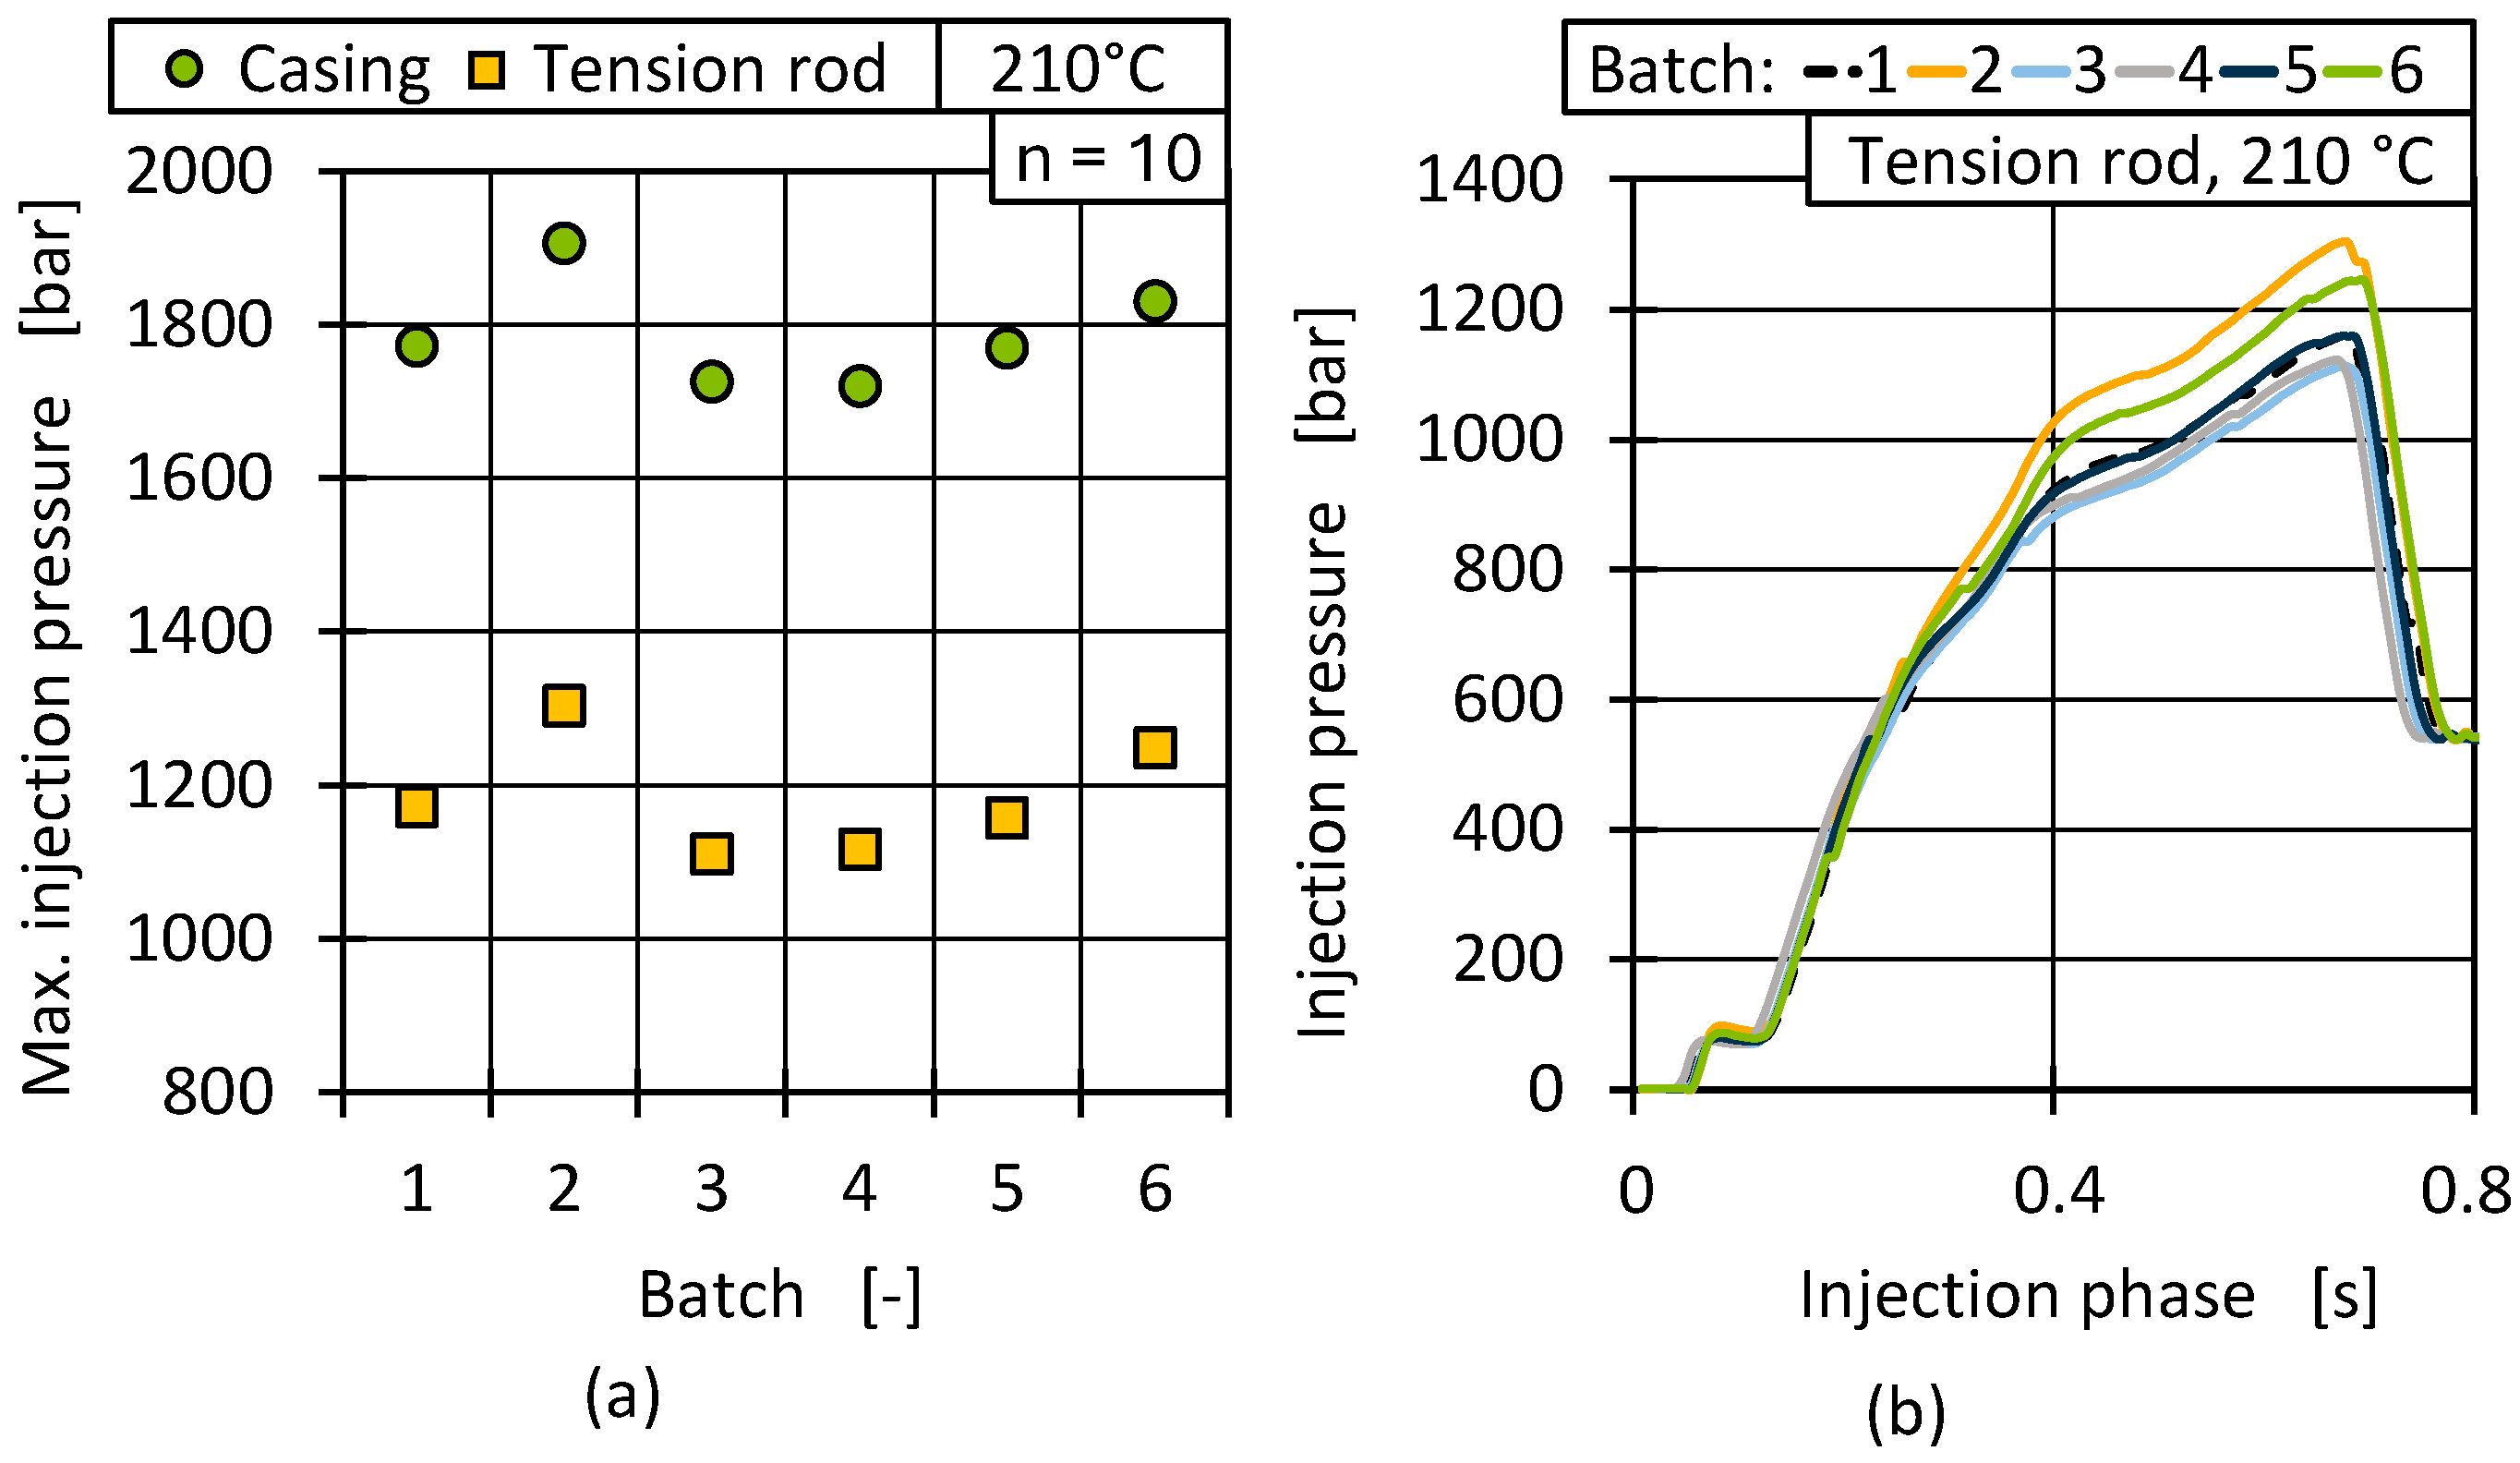
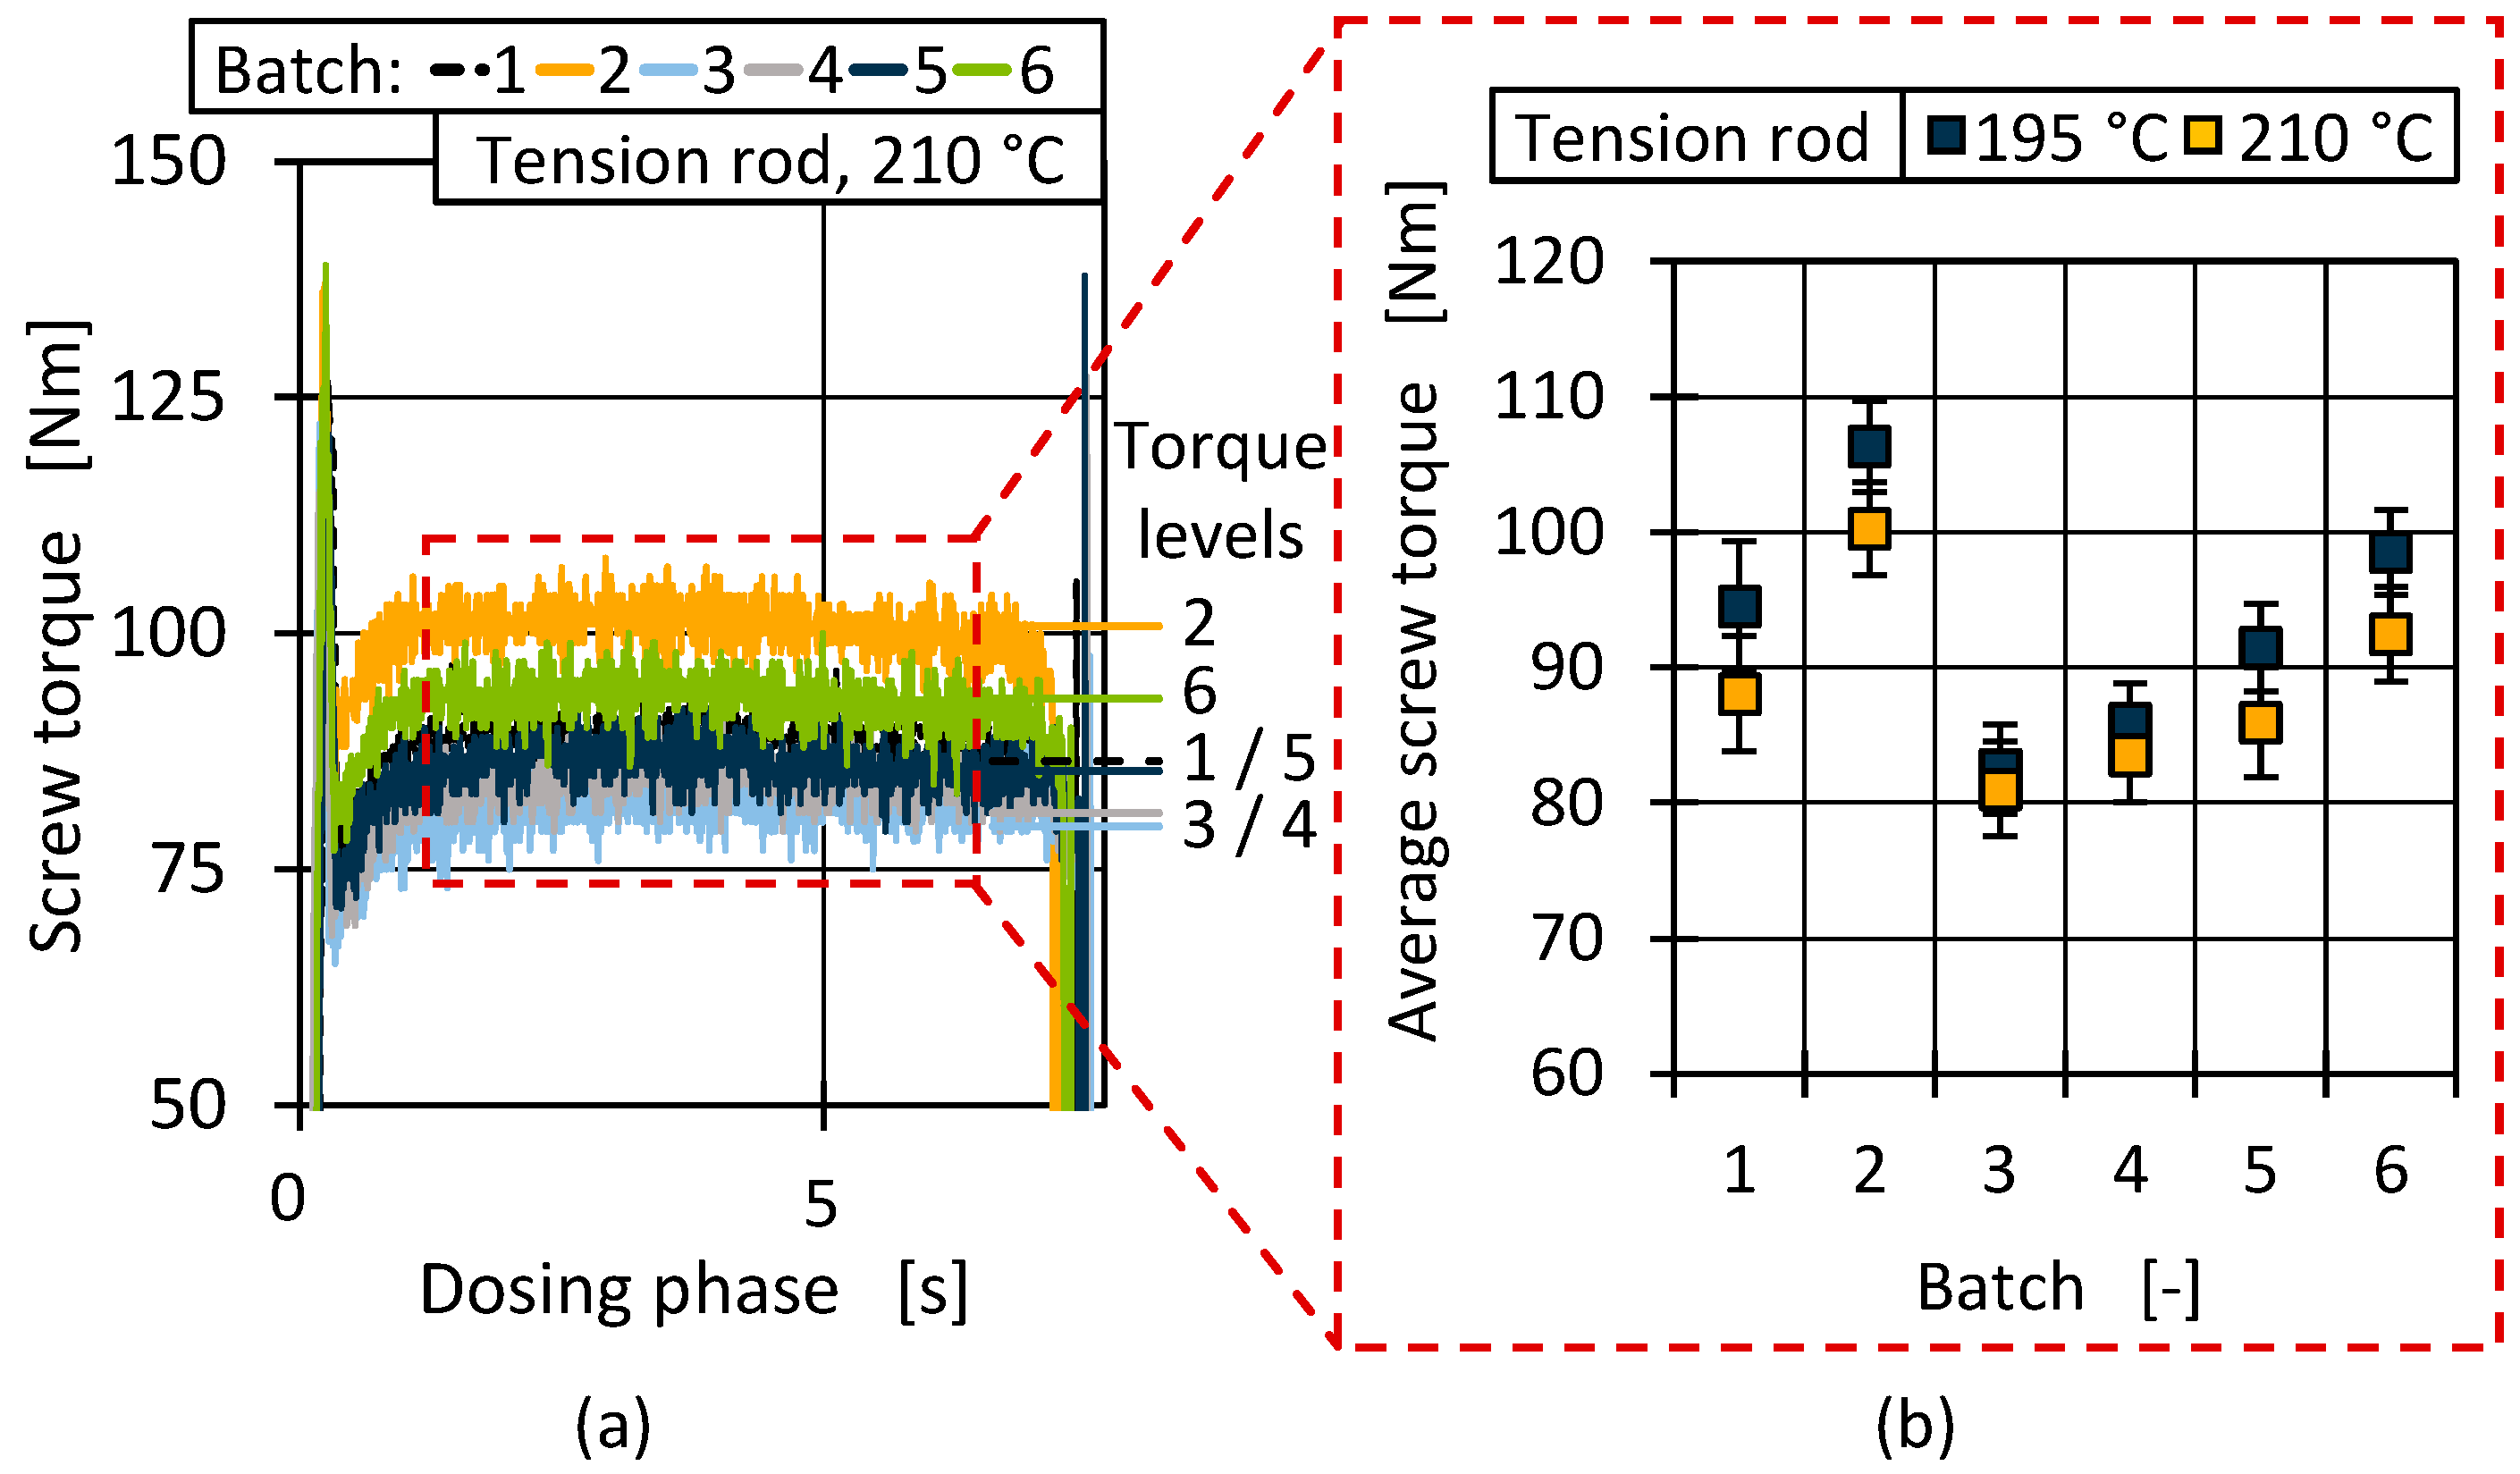
3.3. Influence of Batch Fluctuations on the Process Stability and Part Quality During Injection Moulding
3.3.1. Influence of Batch Fluctuations on Geometric and Mechanical Part Quality Stability
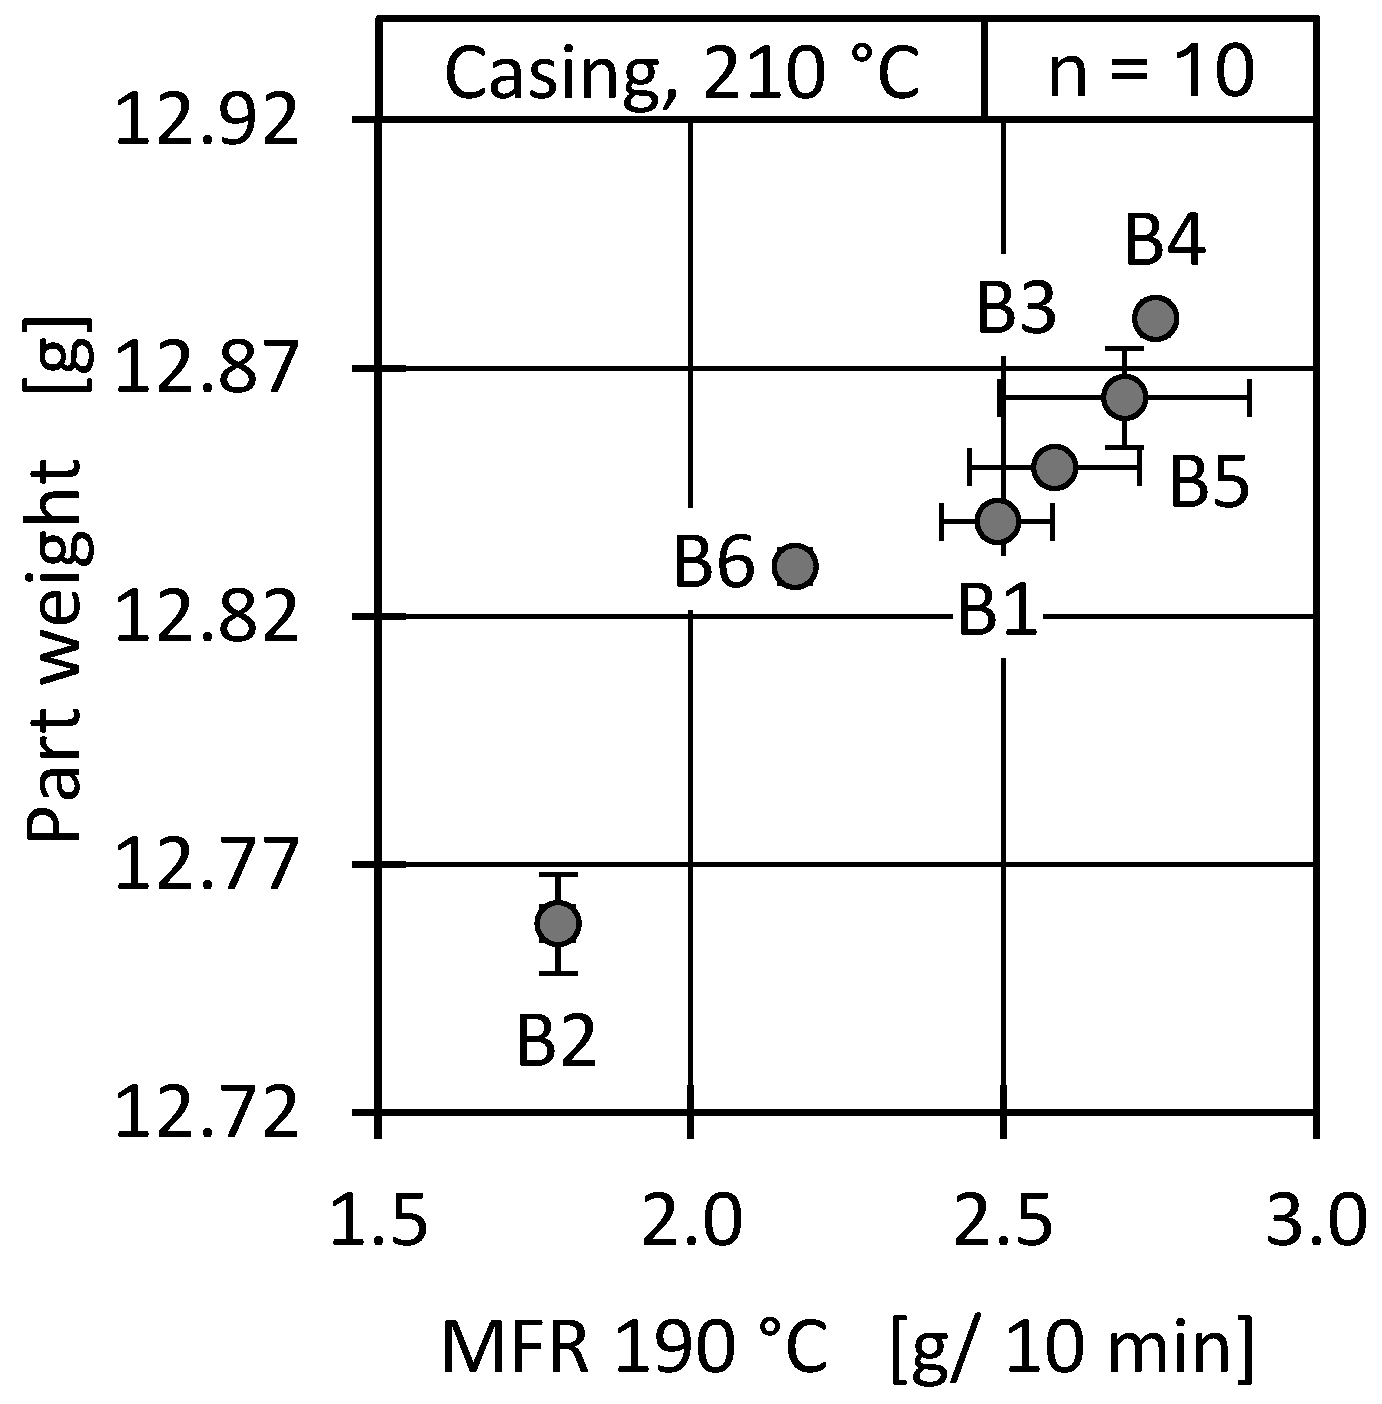
Part Weight
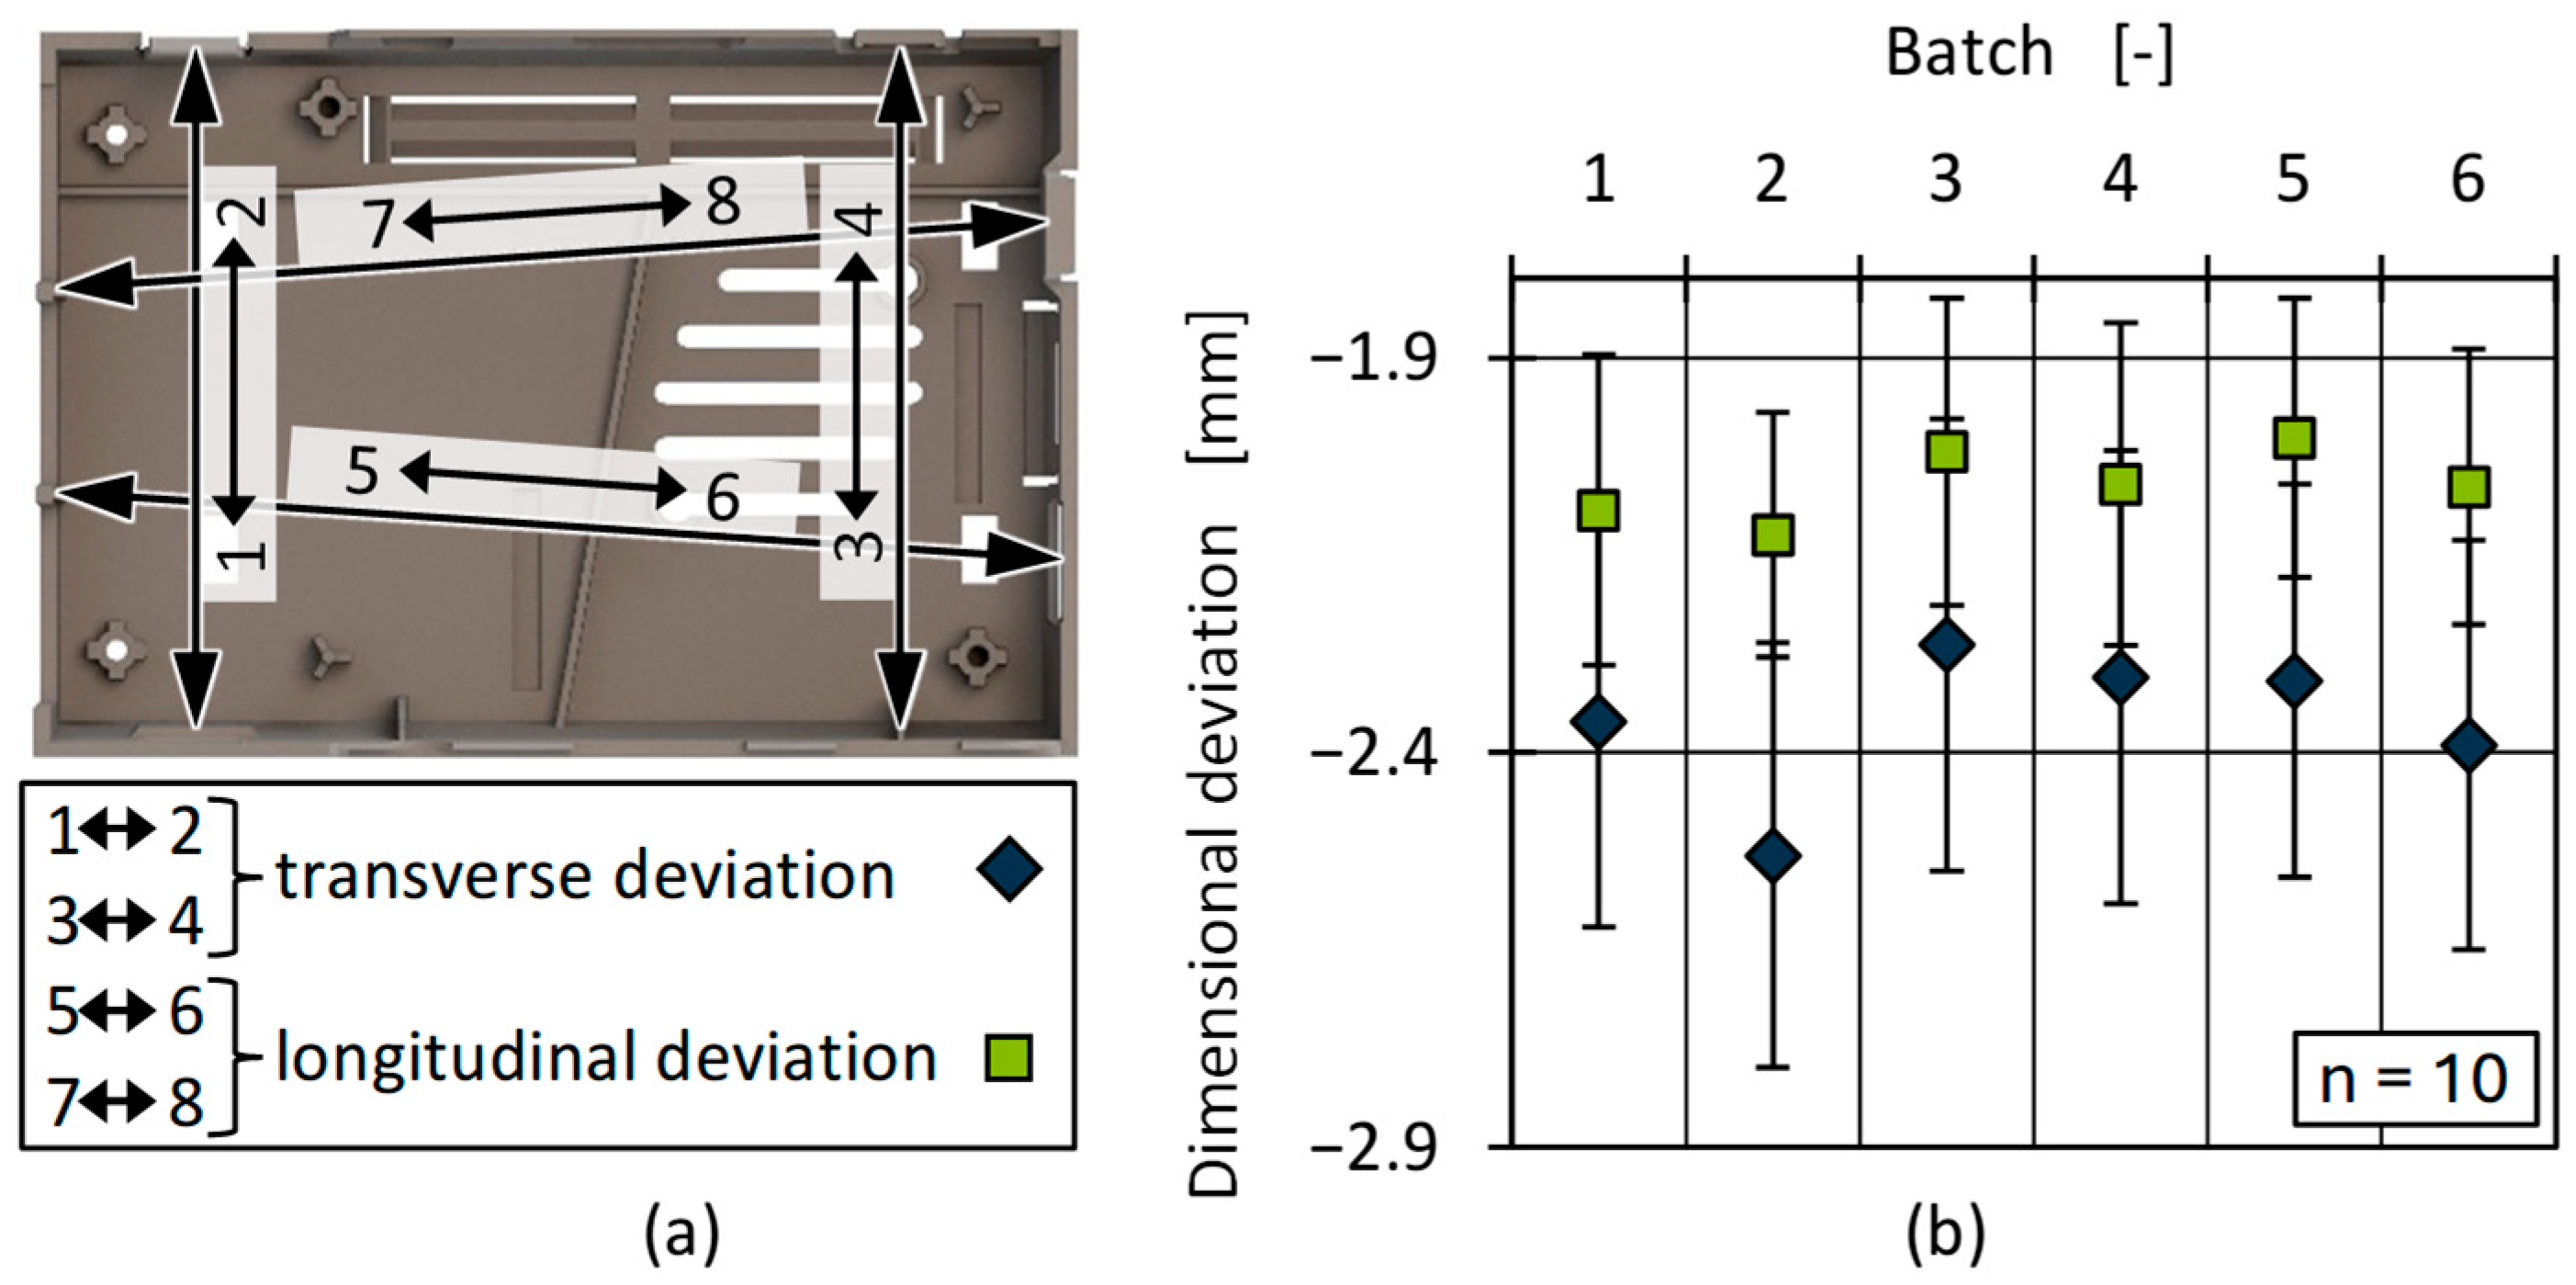
Dimensional Accuracy
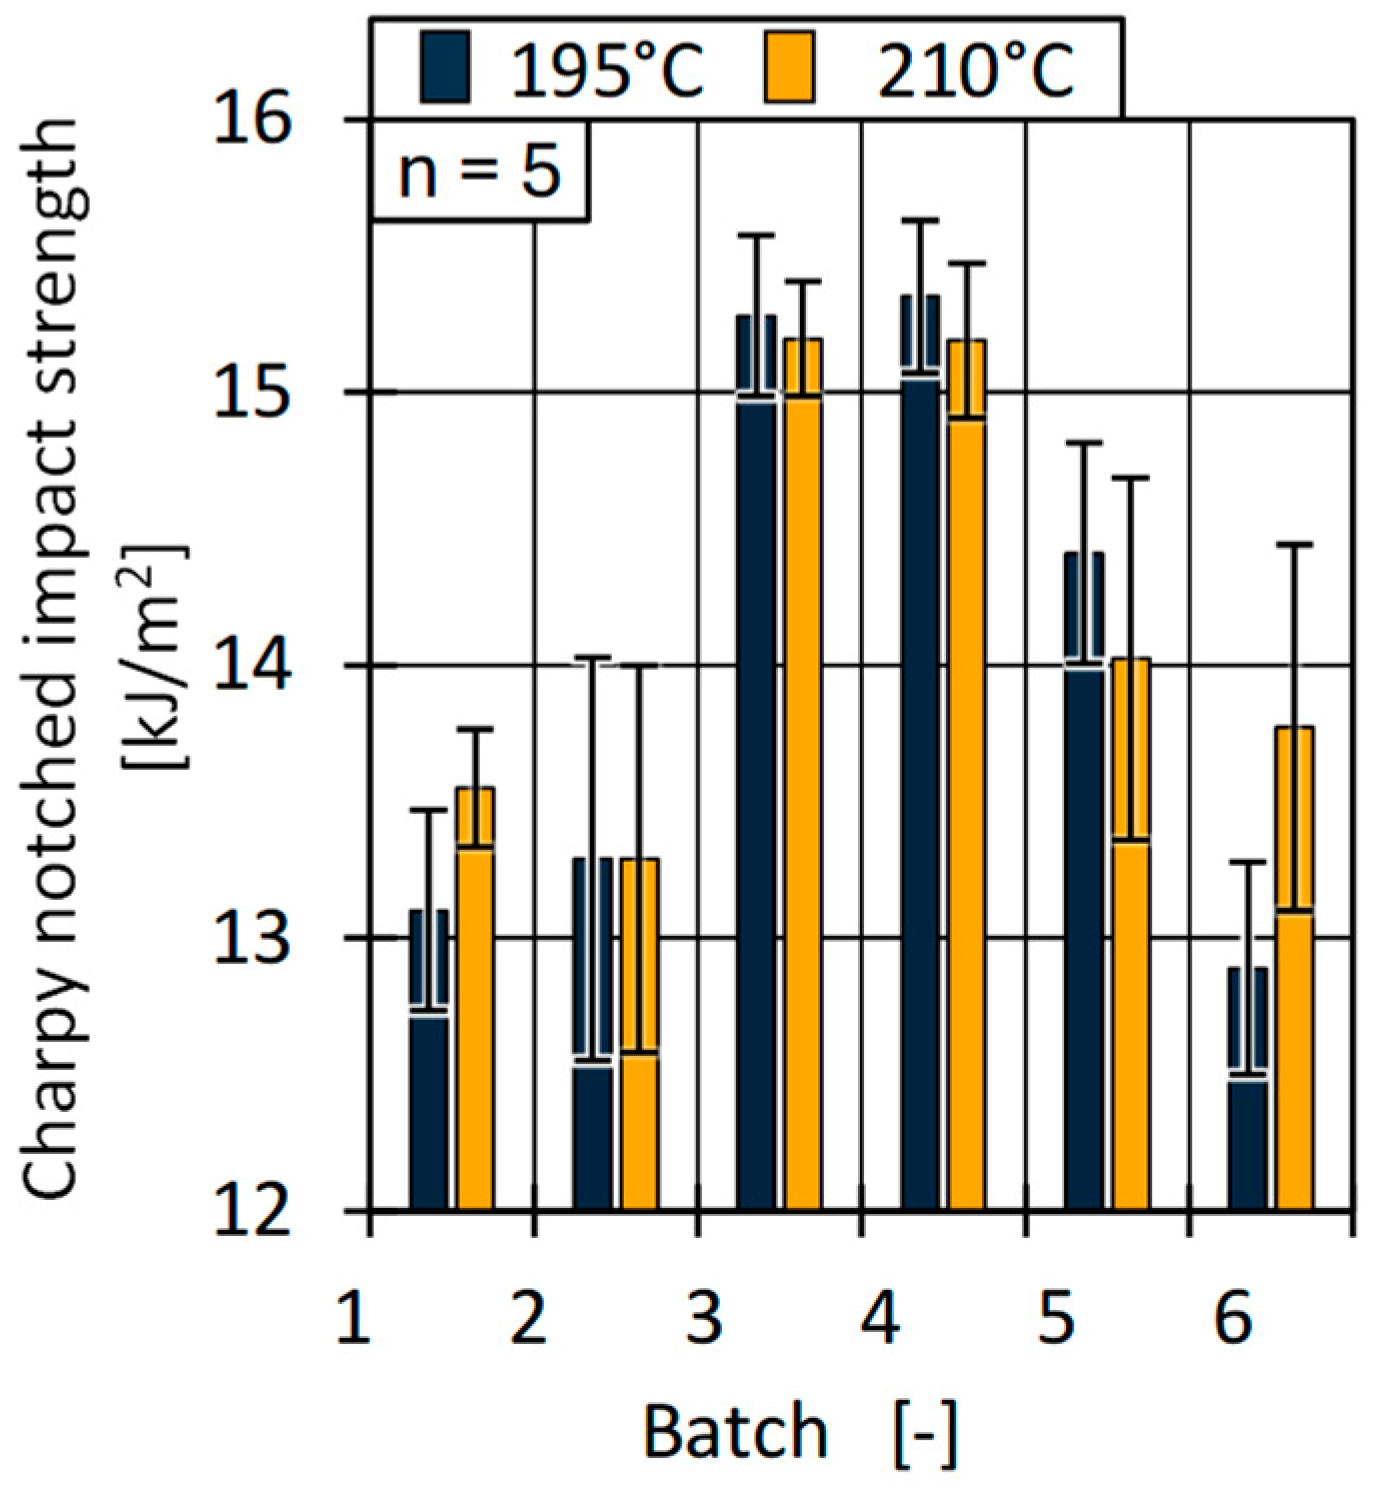
Mechanical Properties
3.4. Determination of the Composition–Property Correlations
4. Conclusions and Outlook
Author Contributions
Funding
Institutional Review Board Statement
Data Availability Statement
Acknowledgments
Conflicts of Interest
Abbreviations
| BHT | Butylated hydroxytoluene |
| Đ | Dispersity |
| DSC | Differential scanning calorimetry |
| EVA | Ethylene vinyl acetate |
| FT-IR | Fourier-transform infrared spectroscopy |
| HCR | High-pressure capillary rheometry |
| HDPE | High-density polyethylene |
| HT-GPC | High-temperature gel permeation chromatography |
| LCB | Long-chain branching |
| MFR | Melt flow rate |
| MW | Molecular weight |
| OPC UA | Open Platform Communication Unified Architecture |
| PA | Polyamide |
| PCR | Post-consumer recycled |
| PEG | Polyethylene glycol |
| PET | Polyethylene terephthalate |
| PP | Polypropylene |
| pvT | Pressure- and temperature-dependent specific volume |
| SCB | Short-chain branching |
| TC | Crystallisation temperature |
| TM | Melting temperature |
| ΔHC | Crystallisation enthalpy |
| ΔHM | Melting enthalpy |
References
- European Union. Regulation (EU) 2025/40 of the European Parliament and of the Council on packaging and packaging waste, amending Regulation (EU) 2019/1020 and Directive (EU) 2019/904, and repealing Directive 94/62/EC. Off. J. Eur. Union 2025. [Google Scholar]
- Hopewell, J.; Dvorak, R.; Kosior, E. Plastics recycling: Challenges and opportunities. Philos. Trans. R. Soc. 2009, 364, 2115–2126. [Google Scholar] [CrossRef]
- Ragaert, K.; Delva, L.; Van Geem, K. Mechanical and chemical recycling of solid plastic waste. Waste Manag. 2017, 69, 24–58. [Google Scholar] [CrossRef]
- Twesigye-omwe, M.N.; Ukundimana, Z.; Rotimi, D.; Gupta, S. Effects of seasonal variations of the physio-chemical properties of municipal solid waste on effective materials and resources recovery. Sci. Rep. 2025, 15, 4548. [Google Scholar] [CrossRef]
- Edjabou, M.E.; Boldrin, A.; Astrup, T.F. Compositional analysis of seasonal variation in Danish residual household waste. Resour. Conserv. Recycl. 2018, 130, 70–79. [Google Scholar] [CrossRef]
- Farmer, T. That’s Rubbish—Brits to enjoy an average of five barbecues this summer—But most of it won’t be recycled. The U.S. Sun, 1 August 2024. [Google Scholar]
- Ellson, A. Halloween causes more plastic waste in UK than any other event—American-style approach to decorations is leading to a ‘throwaway culture’, study finds, as most shoppers admit to binning them after a single use. The Times, 24 October 2024. [Google Scholar]
- Andrady, A.L. Plastics and Environmental Sustainability; John Wiley & Sons, Inc.: Hoboken, NJ, USA, 2015. [Google Scholar]
- Gall, M.; Freudenthaler, P.J.; Fischer, J.; Lang, R.W. Characterization of Composition and Structure–Property Relationships of Commercial Post-Consumer Polyethylene and Polypropylene Recyclates. Polymers 2021, 13, 1574. [Google Scholar] [CrossRef]
- Hu, B.; Serranti, S.; Fraunholcz, N.; Di Maio, F.; Bonifazi, G. Recycling-oriented characterization of polyolefin packaging waste. Waste Manag. 2013, 33, 574–584. [Google Scholar] [CrossRef]
- Roosen, M.; Mys, N.; Kusenberg, M.; Billen, P.; Dumoulin, A.; Dewulf, J.; Van Geem, K.M.; Ragaert, K.; De Meester, S. Detailed Analysis of the Composition of Selected Plastic Packaging Waste Products and Its Implications for Mechanical and Thermochemical Recycling. Environ. Sci. Technol. J. 2020, 54, 13282–13293. [Google Scholar] [CrossRef]
- Garcia, J.; Robertson, M.L. The future of plastics recycling. Science 2017, 358, 870–872. [Google Scholar] [CrossRef]
- Ragaert, K.; Hubo, S.; Leite, L.; Martins, C. Evaluation of post-industrial and post-consumer polyolefin-based polymer waste streams for injection moulding. In Proceedings of the 6th Polymer and Moulds Innovation Conference, Guimaraes, Portugal, 10–12 September 2014. [Google Scholar]
- Wagner, P.; Demirel, N.E.; Hopmann, C. Segregation of immiscible polymers during injection molding and the consequences for PCR processing. In Proceedings of the ANTEC® 2025, Philadelphia, PA, USA, 3–6 March 2025. [Google Scholar]
- Geyer, R.; Jambeck, J.R.; Law, K.L. Production, use, and fate of all plastics ever made. Sci. Adv. 2017, 3, e1700782. [Google Scholar] [CrossRef]
- Patel, R.M.; Butler, T.I.; Walton, K.L.; Knight, G.W. Investigation of processing-structure-properties relationships in polyethylene blown films. Polym. Eng. Sci. 1994, 34, 1506–1514. [Google Scholar] [CrossRef]
- Steffl, T. Rheological and Film Blowing Properties of Various Low Density Polyethylenes and Their Blends; Friedrich-Alexander-Universität Erlangen-Nürnberg: Erlangen, Germany, 2004. [Google Scholar]
- Welle, F. Post-consumer contamination in high-density polyethylene (HDPE) milk bottles and the design of a bottle-to-bottle recycling process. Food Addit. Contam. 2005, 22, 999–1011. [Google Scholar] [CrossRef]
- Javierre, C.; Clavería, I.; Ponz, L.; Aísa, J.; Fernández, A. Influence of the recycled material percentage on the rheological behaviour of HDPE for injection moulding process. Waste Manag. 2007, 27, 656–663. [Google Scholar] [CrossRef]
- Haley, C.H.; Lodge, T.P. A framework for predicting the viscosity of miscible polymer blends. J. Reheol. 2004, 48, 463–486. [Google Scholar] [CrossRef]
- Verberckmoes, A.; Fernandez, E.; Martins, C.; Reyes, P.; Cardon, L.; D’Hooge, D.R.; Edeleva, M. Morphological analysis of mechanically recycled blends of high density polyethylene and polypropylene with strong difference in melt flow index. Polymer 2024, 300, 00323861. [Google Scholar] [CrossRef]
- Hahladakis, J.N.; Iacovidou, E. An overview of the challenges and trade-offs in closing the loop of post-consumer plastic waste (PCPW): Focus on recycling. J. Hazard. Mater. 2019, 380, 120887. [Google Scholar] [CrossRef]
- Hubo, S.; Delva, l.; van Damme, N.; Ragaert, K. Blending of recycled mixed polyolefins with recycled polypropylene: Effect on physical and mechanical properties. In Proceedings of the Regional Conference 2015—Polymer Processing Society PPS-AIP Conf. Proc. 1779, Graz, Austria, 21–25 September 2015. [Google Scholar]
- Zhang, J.; Hirschberg, V.; Rodrigue, D. Blending Recycled High-Density Polyethylene HDPE (rHDPE) with Virgin (vHDPE) as an Effective Approach to Improve the Mechanical Properties. Recycling 2022, 8, 2. [Google Scholar] [CrossRef]
- Noyan, E.C.B.; Boldizar, A. A comparison between laboratory-scale and large-scale high-intensity washing of flexible polyethylene packaging waste. Polym. Eng. Sci. 2024, 64, 1877–1886. [Google Scholar] [CrossRef]
- Tsenoglou, C.; Kartalis, C.N.; Papaspyrides, C.D.; Pfaendner, R. Modeling the Role of Stabilizing Additives During Melt Recycling of High-Density Polyethylene. J. Appl. Polym. Sci. 2000, 80, 2207–2217. [Google Scholar] [CrossRef]
- Darweesh, M.H.; Stoll, B.; El-Taweel, S.H. Compatibilization of polypropylene/high-density polyethylene blends using poly (propylene-co-ethylene). J. Appl. Polym. Sci. 2023, 140, e53687. [Google Scholar] [CrossRef]
- Karaagac, E.; Jones, M.P.; Koch, T.; Archodoulaki, V.M. Polypropylene Contamination in Post-Consumer Polyolefin Waste: Characterisation, Consequences and Compatibilisation. Polymers 2021, 13, 2618. [Google Scholar] [CrossRef] [PubMed]
- Kazemi, Y.; Kakroodi, A.R.; Rodrigue, D. Compatibilization Efficiency in Post-Consumer Recycled Polyethylene/Polypropylene Blends: Effect of Contamination. Polym. Eng. Sci. 2015, 55, 2368–2376. [Google Scholar] [CrossRef]
- Hornberg, K.; Hopmann, C.; Vukovic, M.; Stemmler, S.; Abel, D. Compensation of batch fluctuations of post-consumer recyclate in injection molding by phase-unifying process control. In Proceedings of the ANTEC 2023, Denver, CO, USA, 27–30 March 2023. [Google Scholar]
- ARBURG GmbH + Co., KG. Recyclate Package—Injection Moulding Technology for the Circular Economy: Seize the Opportunity and Save Resources; ARBURG GmbH + Co. KG: Loßburg, Germany, 2023. [Google Scholar]
- ENGEL AUSTRIA GmbH. High recycling quality directly from plastic flakes. ENGEL, 22 June 2022. [Google Scholar]
- Kanai, T.; Campbell, G.A. Film Processing Advances; Hanser Publishers: Munich, Germany; Cincinnati, OH, USA, 2014. [Google Scholar]
- Tolinski, M. Additives for Polyolefins—Getting the Most Out of Polypropylene, Polyethylene and TPO, 2nd ed.; Elsevier Inc.: Amsterdam, The Netherlands, 2015. [Google Scholar]
- Mileva, D.; Tranchida, D.; Gahleitner, M. Designing polymer crystallinity: An industrial perspective. Polym. Cryst. 2018, 1, e10009. [Google Scholar] [CrossRef]
- Berg, E.; Leuchtenberger, L.; Dahlmann, R. Investigation of gel formation and degradation of representative PO recyclates. In Proceedings of the ANTEC, St. Louis, MO, USA, 4–7 March 2024. [Google Scholar]
- Camacho, W.; Karlsson, S. Assessment of thermal and thermo-oxidative stability of multi-extruded recycled PP, HDPE and a blend thereof. Polym. Degrad. Stab. 2002, 78, 385–391. [Google Scholar] [CrossRef]
- Vilaplana, F.; Karlsson, S. Quality Concepts for the Improved Use of Recycled Polymeric Materials: A Review. Macromol. Mater. Eng. 2008, 293, 274–297. [Google Scholar] [CrossRef]
- Stiftung Zentrale Stelle Verpackungsregister. Mindeststandard für die Bemessung der Recyclingfähigkeit von Systembeteiligungspflichtigen Verpackungen gemäß § 21 Abs. 3 VerpackG; Stiftung Zentrale Stelle Verpackungsregister: Osnabrück, Germany, 2019. [Google Scholar]
- Der Grüne Punkt. Rohstofffraktionsspezifikation 329 Polyethylen; Der Grüne Punkt: Köln, Germany, 2023. [Google Scholar]
- Dahlmann, R.; Haberstroh, E.; Menges, G. Menges Werkstoffkunde Kunststoffe, 7, vollständig überarbeitete Auflage ed.; Hanser Verlag: Munich, Germany, 2021. [Google Scholar]
- Long, Y.; Shanks, R.A.; Stachurski, Z.H. Kinetics of Polymer Crystallisation. Prog. Polym. Sci. 1995, 20, 651–701. [Google Scholar] [CrossRef]
- Martuscelli, E.; Pracella, M.; Avella, M.; Greco, R.; Ragosta, R. Properties of Polyethylene-Polypropylene Blends: Crystallization Behavior. Makromolecular Chem. 1980, 181, 957–967. [Google Scholar] [CrossRef]
- Wagner, J.R., Jr. (Ed.) Multilayer Flexible Packaging, 2nd ed.; William Andrew Publishing (Elsevier): Norwich, NY, USA, 2016. [Google Scholar]
- Moneke, M. Kunststoffwerkstoffe; Carl Hanser Verlag: Munich, Germany, 2022. [Google Scholar]
- Ray, S.S.; Geberekrstos, A.; Muzata, T.S.; Orasugh, J.T. Process-Induced Phase Separation in Polymer Blends: Materials, Characterization, Properties, and Applications; Carl Hanser Verlag GmbH Co KG: Munich, Germany, 2023. [Google Scholar]
- Bashirgonbadi, A.; Ureel, Y.; Delva, L.; Fiorio, R.; Van Geem, K.M.; Ragaert, K. Accurate determination of polyethylene (PE) and polypropylene (PP) content in polyolefin blends using machine learning-assisted differential scanning calorimetry (DSC) analysis. Polym. Test. 2024, 131, 108353. [Google Scholar] [CrossRef]
- Bonten, C. Kunststofftechnik: Einführung und Grundlagen; Carl Hanser Verlag GmbH Co KG: Munich, Germany, 2020. [Google Scholar]
- Wortberg, J. Qualitätssicherung in der Kunststoffverarbeitung; Hanser Publishing: Munich, Germany; Vienna, Austria, 1996. [Google Scholar]
- Ehrenstein, G.W. Polymer Werkstoffe: Struktur—Eigenschaften—Anwendung, 3. Auflage ed.; Carl Hanser Verlag: Munich, Germany, 2011. [Google Scholar]
- Ehrenstein, G.W.; Riedel, G.; Trawiel, P. Thermal Analysis of Plastics—Theory and Practice; Carl Hanser Verlag: Munich, Germany, 2004. [Google Scholar]
- Elias, H.-G. Makromoleküle; Wiley-VCH: Hoboken, NJ, USA, 1999. [Google Scholar]
- DIN EN ISO 1133-1; Plastics-Determination of the Melt Mass-Flow Rate (MFR) and Melt Volume-Flow Rate (MVR) of Thermoplastics. ISO: Geneva, Switzerland, 2022.
- Berg, E.; Wagner, P.; Grünert, G.; Mayer, J.; Leuchtenberger, L.; Niemietz, P.; Bergs, T.; Dahlmann, R. Sustainable Plastic Packaging from Sorted Municipal Waste and Its Life Cycle Assessment Using Digital Product Passports. In Circularity Days 2024; Dröder, K., Vietor, T., Eds.; Springer: Berlin/Heidelberg, Germany, 2025. [Google Scholar]
- Folienoberflächen-Analysator. Available online: https://www.ocsgmbh.com/produkte/folienoberflaechenanalysatoren-fsa100v2-fsa200v2/ (accessed on 19 June 2025).
- DIN EN ISO 527-2; Plastics—Determination of Tensile Properties—Part 2: Test Conditions for Moulding and Extrusion Plastics. ISO: Geneva, Switzerland, 2012.
- DIN EN ISO 179-1; Plastics—Determination of Charpy Impact Properties—Part 1: Non-Instrumented Impact Test. ISO: Geneva, Switzerland, 2023.
- Noyan, E.C.B. Material Recycling of Post-Consumer Flexible Polyethylene Packaging Waste. Bachelor’s Thesis, Department of Industrial and Materials Science, Chalmers University Of Technology, Gothenburg, Sweden, 2022. [Google Scholar]
- Cecon, V.S.; Pham, T.; Curtzwiler, G.; Vorst, K. Assessment of Different Application Grades of Post-Consumer Recycled (PCR) Polyolefins from Material Recovery Facilities (MRFs) in the United States. ACS Appl. Polym. Mater. 2024, 6, 12914–13496. [Google Scholar] [CrossRef]
- Annicchiarico, D.; Alcock, J.D. Review of Factors that Affect Shrinkage of Molded Part in Injection Molding. Mater. Manuf. Process. 2014, 29, 662–682. [Google Scholar] [CrossRef]
- Chang, R.Y.; Tsaur, B.D. Experimental and theoretical studies of shrinkage, warpage, and sink marks of crystalline polymer injection molded parts. Polym. Eng. Sci. 1995, 35, 1197–1259. [Google Scholar] [CrossRef]
- Lucyshyn, T. Messung von pvT-Daten bei Prozessnahen Abkühlraten und Deren Einfluss auf die Simulation von Schwindung und Verzug mit Moldflow Plastics Insight. Ph.D Thesis, Montan University, Loeben, Austria, 2009. [Google Scholar]
- Juan, R.; Paredes, B.; García-Muñoz, R.A.; Domínguez, C. Quantification of PP contamination in recycled PE by TREF analysis for improved the quality and circularity of plastics. Polym. Test. 2021, 100, 107273. [Google Scholar] [CrossRef]
- Cozzarini, L.; Marsich, L.; Ferluga, A. Qualitative and quantitative contaminants assessment in recycled pellets from post-consumer plastic waste by means of spectroscopic and thermal characterization. Polym. Eng. Sci. 2023, 63, 1126–1132. [Google Scholar] [CrossRef]
- Kisiel, M.; Mossety-Leszczak, B.; Frańczak, A.; Szczęch, D. Quantitative analysis of the polymeric blends. Prog. Rubber Plast. Recycl. Technol. 2019, 35, 75–89. [Google Scholar] [CrossRef]
- Luijsterburg, B.; Goossens, H. Assessment of plastic packaging waste: Material origin, methods, properties. Resour. Conserv. Recycl. 2014, 85, 88–97. [Google Scholar] [CrossRef]
- Larsen, Å.G.; Olafsen, K.; Alcock, B. Determining the PE fraction in recycled PP. Polym. Test. 2021, 96, 107058. [Google Scholar] [CrossRef]
- Aumnate, C.; Rudolph, N.; Sarmadi, M. Recycling of Polypropylene/Polyethylene Blends: Effect of Chain Structure on the Crystallization Behaviors. Polymers 2019, 11, 1456. [Google Scholar] [CrossRef]
- Jose, S.; Aprem, A.S.; Francis, B.; Chandy, M.C.; Werner, P.; Alstaedt, V.; Thomas, S. Phase morphology, crystallisation behaviour and mechanical properties of isotactic polypropylene/high density polyethylene blends. Eur. Polym. J. 2004, 40, 2105–2115. [Google Scholar] [CrossRef]
- Mathot, V.B.F.; Pijpers, M.F.J. Heat capacity, enthalpy and crystallinity for a linear polyethylene obtained by DSC. J. Therm. Anal. 1983, 28, 349–358. [Google Scholar] [CrossRef]
- Khan, S.; Zaman, A.U.; Junaid, M.; Shehbaz, T.; Khan, M.A.; Khan, F.N.; Karim, M.R.A. Effect of Mass and Temperature Rate on the Thermal Properties of High-Density Polyethylene Using Differential Scanning Calorimetry. In Proceedings of the 1st International Conference on Modern Technologies in Mechanical & Material Engineering, Topi, Pakistan, 6 May 2023. [Google Scholar]
- Eyerer, P.; Elsner, P.; Hirth, T. Polymer Engineering—Technologien und Praxis; Springer: Berlin/Heidelberg, Germany, 2008. [Google Scholar]
- Domininghaus, H. Kunststoffe: Eigenschaften und Anwendungen; Springer: Berlin/Heidelberg, Germany; New York, NY, USA, 2013. [Google Scholar]
- Ortín, A.; Montesinos, J.; López, E.; Del Hierro, P.; Monrabal, B.; Torres-Lapasió, J.R.; García-Álvarez-Coque, M.C. Characterization of Chemical Composition along the Molar Mass Distribution in Polyolefin Copolymers by GPC Using a Modern Filter- B ased IR Detector. Macromol. Symp. 2013, 330, 63–80. [Google Scholar] [CrossRef]
- Yau, W.W.; Ortín, A.; del Hierro, P. Chemical Composition Analysis of Polyolefins by Multiple Detection GPC-IR5; Polymer Char—LCGC North America: Valencia, Spain, 2011. [Google Scholar]
- Stieglitz, M. Unpublished, internal analysis conducted in the research project KIOptiPak funded by the German Federal Ministry of Education and Research (BMBF), grant number 033KI101. Institute for Plastics Processing at RWTH Aachen, 27 March 2025. [Google Scholar]
- Ahn, S.; White, J.L. Influence of Low Molecular Weight Additives on Die Extrusion Rheometer Flow of Thermoplastic Melts. Int. Polym. Process. 2003, 18, 243–251. [Google Scholar] [CrossRef]
- Moss, S.; Zweifel, H. Degradation and stabilization of high density polyethylene during multiple extrusions. Polym. Degrad. Stab. 1989, 25, 217–245. [Google Scholar] [CrossRef]
- Kulkarni, S. Polymer Rheology. In Robust Process Development and Scientific Moldung—Theory and Practice; Kulkarni, S., Ed.; Carl Hanser Verlag: Munich, Germany, 2024; pp. 47–67. [Google Scholar]
- Valer, J.R.L. Plastics Injection Molding—Scientific Molding, Recommendations, and Best Practices; Carl Hanser Verlag: Munich, Germany, 2020. [Google Scholar]
- Parameswaranpillai, J.; Rangappa, S.M.; Rajkumar, A.G.; Siengchin, S. Recent Developments in Plastic Recycling; Springer Nature: Singapore, 2021. [Google Scholar]
- Osswald, T.; Rudolph, N. Polymer Rheology; Carl Hanser Verlag: Munich, Germany, 2015. [Google Scholar]
- Traxler, I.; Kaineder, H.; Fischer, J. Simultaneous Modification of Properties Relevant to the Processing and Application of Virgin and Post-Consumer Polypropylene. Polymers 2023, 15, 1717. [Google Scholar] [CrossRef] [PubMed]
- Huang, P.-W.; Peng, H.S. Number of Times Recycled and Its Effect on the Recyclability, Fluidity and Tensile Properties of Polypropylene Injection Molded Parts. Sustainability 2021, 13, 11085. [Google Scholar] [CrossRef]
- Camacho, W.; Karlsson, S. NIR, DSC, and FTIR as Quantative Methods for Compositional Analysis of Blends of Polymers Obtained from Recycled Mixed Plastic Waste. Polym. Eng. Sci. 2001, 41, 1626–1635. [Google Scholar] [CrossRef]
- Maier, R.-D.; Schiller, M. Handbuch Kunststoff Additive; Carl Hanser Verlag GmbH & Co. KG: Munich, Germany, 2016. [Google Scholar]
- Rosenbaum, E.E.; Hatzikiriakos, S.G.; Stewart, C.W. Flow Implications in the Processing of Tetrafluoroethylene/Hexafluoropropylene Copolymers. Int. Polym. Process. 1995, 10, 204–212. [Google Scholar] [CrossRef]
- Dubrocq-Baritaud, C.; Darque-Ceretti, E.; Vergnes, B. Fluoropolymer processing aids in linear-low density polyethylene extrusion: How to improve their efficiency? J. Non-Newton. Fluid Mech. 2014, 208–209, 45–52. [Google Scholar] [CrossRef]
- Bistac, S.; Brogly, M.; Bindel, D. Crystallinity of Amphiphilic PE-b-PEG Copolymers. Polymers 2022, 14, 3639. [Google Scholar] [CrossRef]
- Phuangthong, P.; Li, W.; Shen, J.; Nofar, M.; Worajittiphon, P.; Srithep, Y. The Effect of Polyethylene Glycol on the Non-Isothermal Crystallization of Poly(L-lactide) and Poly(D-lactide) Blends. Polymers 2024, 16, 2129. [Google Scholar] [CrossRef]
- Steen, H.; Hissmann, O. Folieninspektion: Standardsuche bei Stippen. Kunststoffe 2010, 100, 192–195. [Google Scholar]
- Drake, W.O.; Pauquet, J.R.; Todesco, R.V.; Zweifel, H. Processing stabilization of polyolefins. Angew. Makromol. Chem. 1990, 176, 215–230. [Google Scholar] [CrossRef]
- Zahavich, A.T.P.; Latto, B.; Takacs, E.; Vlachopoulos, J. The effect of multiple extrusion passes during recycling of high density polyethylene. Adv. Polym. Technol. 1997, 16, 11–24. [Google Scholar] [CrossRef]
- Oblak, P.; Gonzalez-Gutierrez, J.; Zupančič, B.; Aulova, A.; Emri, I. Processability and mechanical properties of extensively recycled high density polyethylene. Polym. Degrad. Stab. 2015, 114, 133–145. [Google Scholar] [CrossRef]
- Akhras, M.H.; Langwieser, J.; Czaker, S.; Felgel-Farnholz, A.; Fischer, J. Cascadic degradation of selected polyolefin grades in a simulated closed-loop recycling process. Clean Technol. Environ. Policy 2024, 26, 3507–3526. [Google Scholar] [CrossRef]
- Wagner, P.; Kleinsorge, J.; Hopmann, C. Influence of the Recyclate Content on the Process Stability and Part Quality of Injection Moulded Post-Consumer Polyolefins. Adv. Polym. Technol. 2025, 2025, 7570978. [Google Scholar] [CrossRef]
- Fischer, J.M. Handbook of Molded Part Shrinkage and Warpage; Elsevier: Amsterdam, The Netherlands, 2013. [Google Scholar]
- Yang, Y.; Chen, X.; Lu, N.; Gao, F. Injection Molding Process Control, Monitoring, and Optimization; Hanser: Munich, Germany, 2016. [Google Scholar]
- Akoglu, H. User’s guide to correlation coefficients. Turk. J. Emerg. Med. 2018, 18, 91–93. [Google Scholar] [CrossRef] [PubMed]
- Mukaka, M.M. Statistics corner: A guide to appropriate use of Correlation coefficient in medical research. Malawi Med. J. 2012, 24, 69–71. [Google Scholar] [PubMed]
- Obilor, E.I.; Amadi, E.C. Test for Significance of Pearson’s Correlation Coefficient (r). Int. J. Innov. Math. Stat. Energy Policies 2018, 6, 11–23. [Google Scholar]


| Geometry | |||
|---|---|---|---|
| Setting | Tension Rod | Casing | |
| Nozzle temperature [°C] | 195 | 210 | 210 |
| Mould temperature [°C] | 40 | ||
| Injection volume rate [cm3/s] | 50 | ||
| Injection time [s] | 0.75 | 0.58 | |
| Holding pressure [bar] | 550 | 800 | |
| Holding pressure time [s] | 10 | 4 | |
| Screw rotation speed [mm/s] | 200 | ||
| Back pressure [bar] | 100 | ||
| Batch | TM,PE [°C] | TM,PP [°C] | TC [°C] |
|---|---|---|---|
| 1 | 132.2 ± 0.6 | 162.9 ± 0.7 | 116.9 ± 0.4 |
| 2 | 132.1 ± 0.0 | 162.9 ± 0.1 | 117.9 ± 0.3 |
| 3 | 132.3 ± 0.4 | 162.4 ± 0.3 | 117.7 ± 0.2 |
| 4 | 132.6 ± 0.7 | 162.4 ± 0.6 | 117.7 ± 0.5 |
| 5 | 131.8 ± 0.2 | 162.5 ± 0.7 | 117.6 ± 0.4 |
| 6 | 131.8 ± 0.1 | 162.7 ± 0.2 | 118.2 ± 0.3 |
| pt | pc | tt | mc | dc | MFR | Et | σM | σI | Ash | pvT | HM, t | HM, PP | HC, t | CH | MW | Gels | |
|---|---|---|---|---|---|---|---|---|---|---|---|---|---|---|---|---|---|
| pt | |||||||||||||||||
| pc | 0.99 | ||||||||||||||||
| tt | 0.82 | 0.84 | |||||||||||||||
| mc | −0.93 | −0.97 | −0.79 | ||||||||||||||
| dc | −0.95 | −0.96 | −0.68 | 0.96 | |||||||||||||
| MFR | −0.96 | −0.95 | −0.81 | 0.85 | 0.91 | ||||||||||||
| Et | −0.22 | −0.24 | −0.33 | 0.11 | 0.04 | 0.38 | |||||||||||
| σM | 0.42 | 0.43 | 0.38 | −0.53 | −0.60 | −0.25 | 0.74 | ||||||||||
| σI | −0.83 | −0.83 | −0.44 | 0.80 | 0.79 | 0.85 | 0.28 | −0.15 | |||||||||
| Ash | −0.34 | −0.38 | −0.73 | 0.39 | 0.35 | 0.22 | −0.01 | −0.47 | −0.20 | ||||||||
| pvT | −0.59 | −0.58 | −0.33 | 0.56 | 0.70 | 0.69 | 0.06 | −0.24 | 0.76 | −0.32 | |||||||
| HM, t | 0.75 | 0.75 | 0.90 | −0.70 | −0.67 | −0.65 | −0.20 | 0.43 | −0.29 | −0.85 | 0.01 | ||||||
| HM, PP | −0.82 | −0.84 | −0.95 | 0.81 | 0.79 | 0.73 | 0.15 | −0.53 | 0.39 | 0.82 | 0.17 | −0.98 | |||||
| HC, t | 0.86 | 0.84 | 0.61 | −0.82 | −0.83 | −0.72 | 0.22 | 0.70 | −0.64 | −0.39 | −0.34 | 0.71 | −0.75 | ||||
| CH | −0.64 | −0.58 | −0.45 | 0.51 | 0.73 | 0.66 | −0.29 | −0.61 | 0.53 | 0.03 | 0.77 | −0.28 | 0.39 | −0.64 | |||
| MW | −0.24 | −0.22 | −0.32 | 0.28 | 0.42 | 0.12 | −0.76 | −0.93 | −0.09 | 0.47 | 0.18 | −0.34 | 0.41 | −0.51 | 0.65 | ||
| Gels | −0.05 | −0.01 | −0.11 | 0.04 | 0.15 | −0.11 | −0.81 | −0.81 | −0.30 | 0.47 | −0.19 | −0.31 | 0.29 | −0.47 | 0.42 | 0.90 | −0.05 |
Disclaimer/Publisher’s Note: The statements, opinions and data contained in all publications are solely those of the individual author(s) and contributor(s) and not of MDPI and/or the editor(s). MDPI and/or the editor(s) disclaim responsibility for any injury to people or property resulting from any ideas, methods, instructions or products referred to in the content. |
© 2025 by the authors. Licensee MDPI, Basel, Switzerland. This article is an open access article distributed under the terms and conditions of the Creative Commons Attribution (CC BY) license (https://creativecommons.org/licenses/by/4.0/).
Share and Cite
Fischer, P.; Berg, E.; Hopmann, C.; Dahlmann, R. Investigating the Impact of Seasonal Input Stream Fluctuations on Post-Consumer High-Density Polyethylene Composition and Processing. Polymers 2025, 17, 1828. https://doi.org/10.3390/polym17131828
Fischer P, Berg E, Hopmann C, Dahlmann R. Investigating the Impact of Seasonal Input Stream Fluctuations on Post-Consumer High-Density Polyethylene Composition and Processing. Polymers. 2025; 17(13):1828. https://doi.org/10.3390/polym17131828
Chicago/Turabian StyleFischer, Pia, Elena Berg, Christian Hopmann, and Rainer Dahlmann. 2025. "Investigating the Impact of Seasonal Input Stream Fluctuations on Post-Consumer High-Density Polyethylene Composition and Processing" Polymers 17, no. 13: 1828. https://doi.org/10.3390/polym17131828
APA StyleFischer, P., Berg, E., Hopmann, C., & Dahlmann, R. (2025). Investigating the Impact of Seasonal Input Stream Fluctuations on Post-Consumer High-Density Polyethylene Composition and Processing. Polymers, 17(13), 1828. https://doi.org/10.3390/polym17131828