


High-Temperature Tensile Performance of Fused Filament Fabricated Discontinuous Carbon Fiber-Reinforced Polyamide


Abstract
1. Introduction
2. Materials and Methods
2.1. Material Characteristics and Manufacturing Parameters
2.2. High-Temperature Testing Procedure
3. Results and Discussion
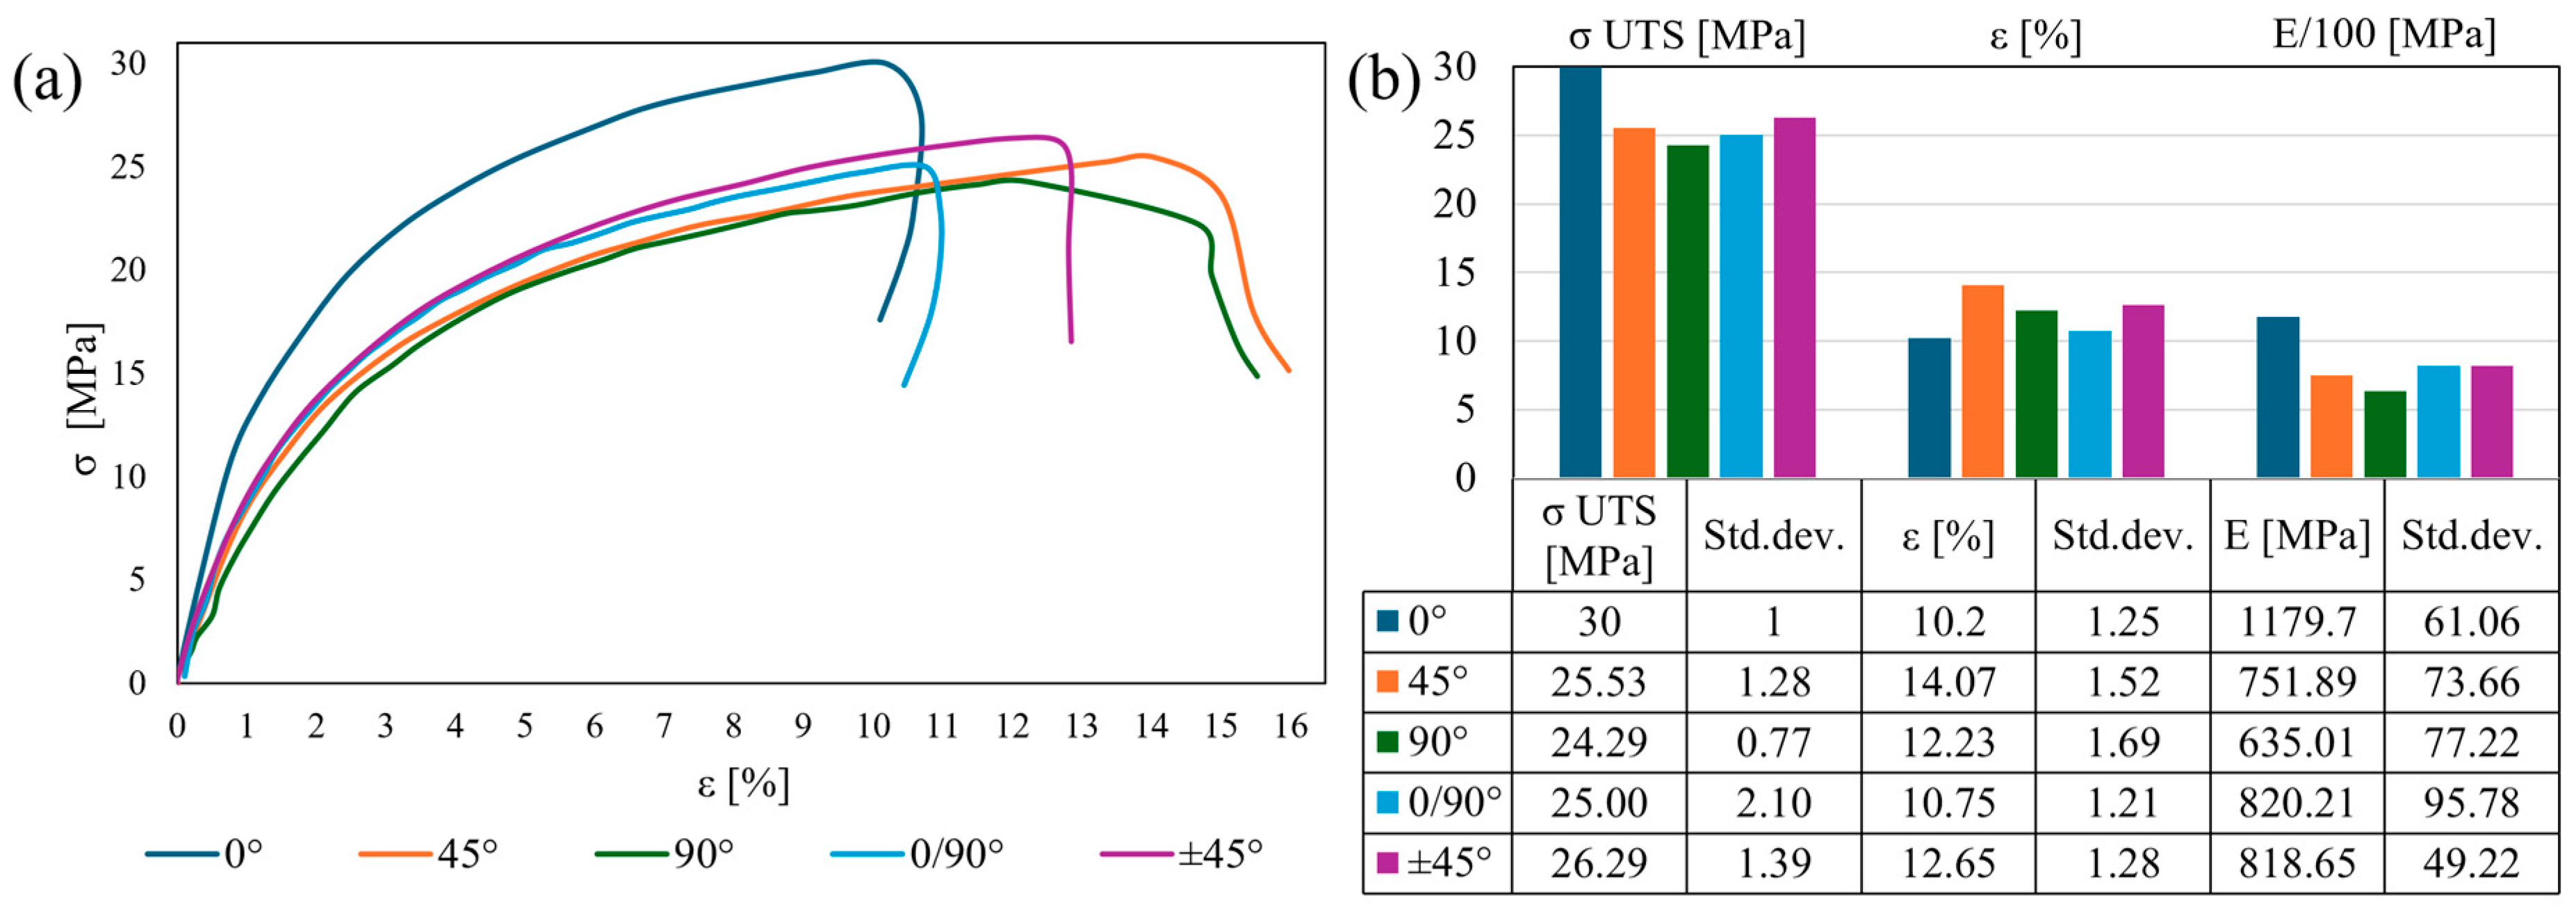
3.1. Influence of Infill Orientation on the Tensile Performance
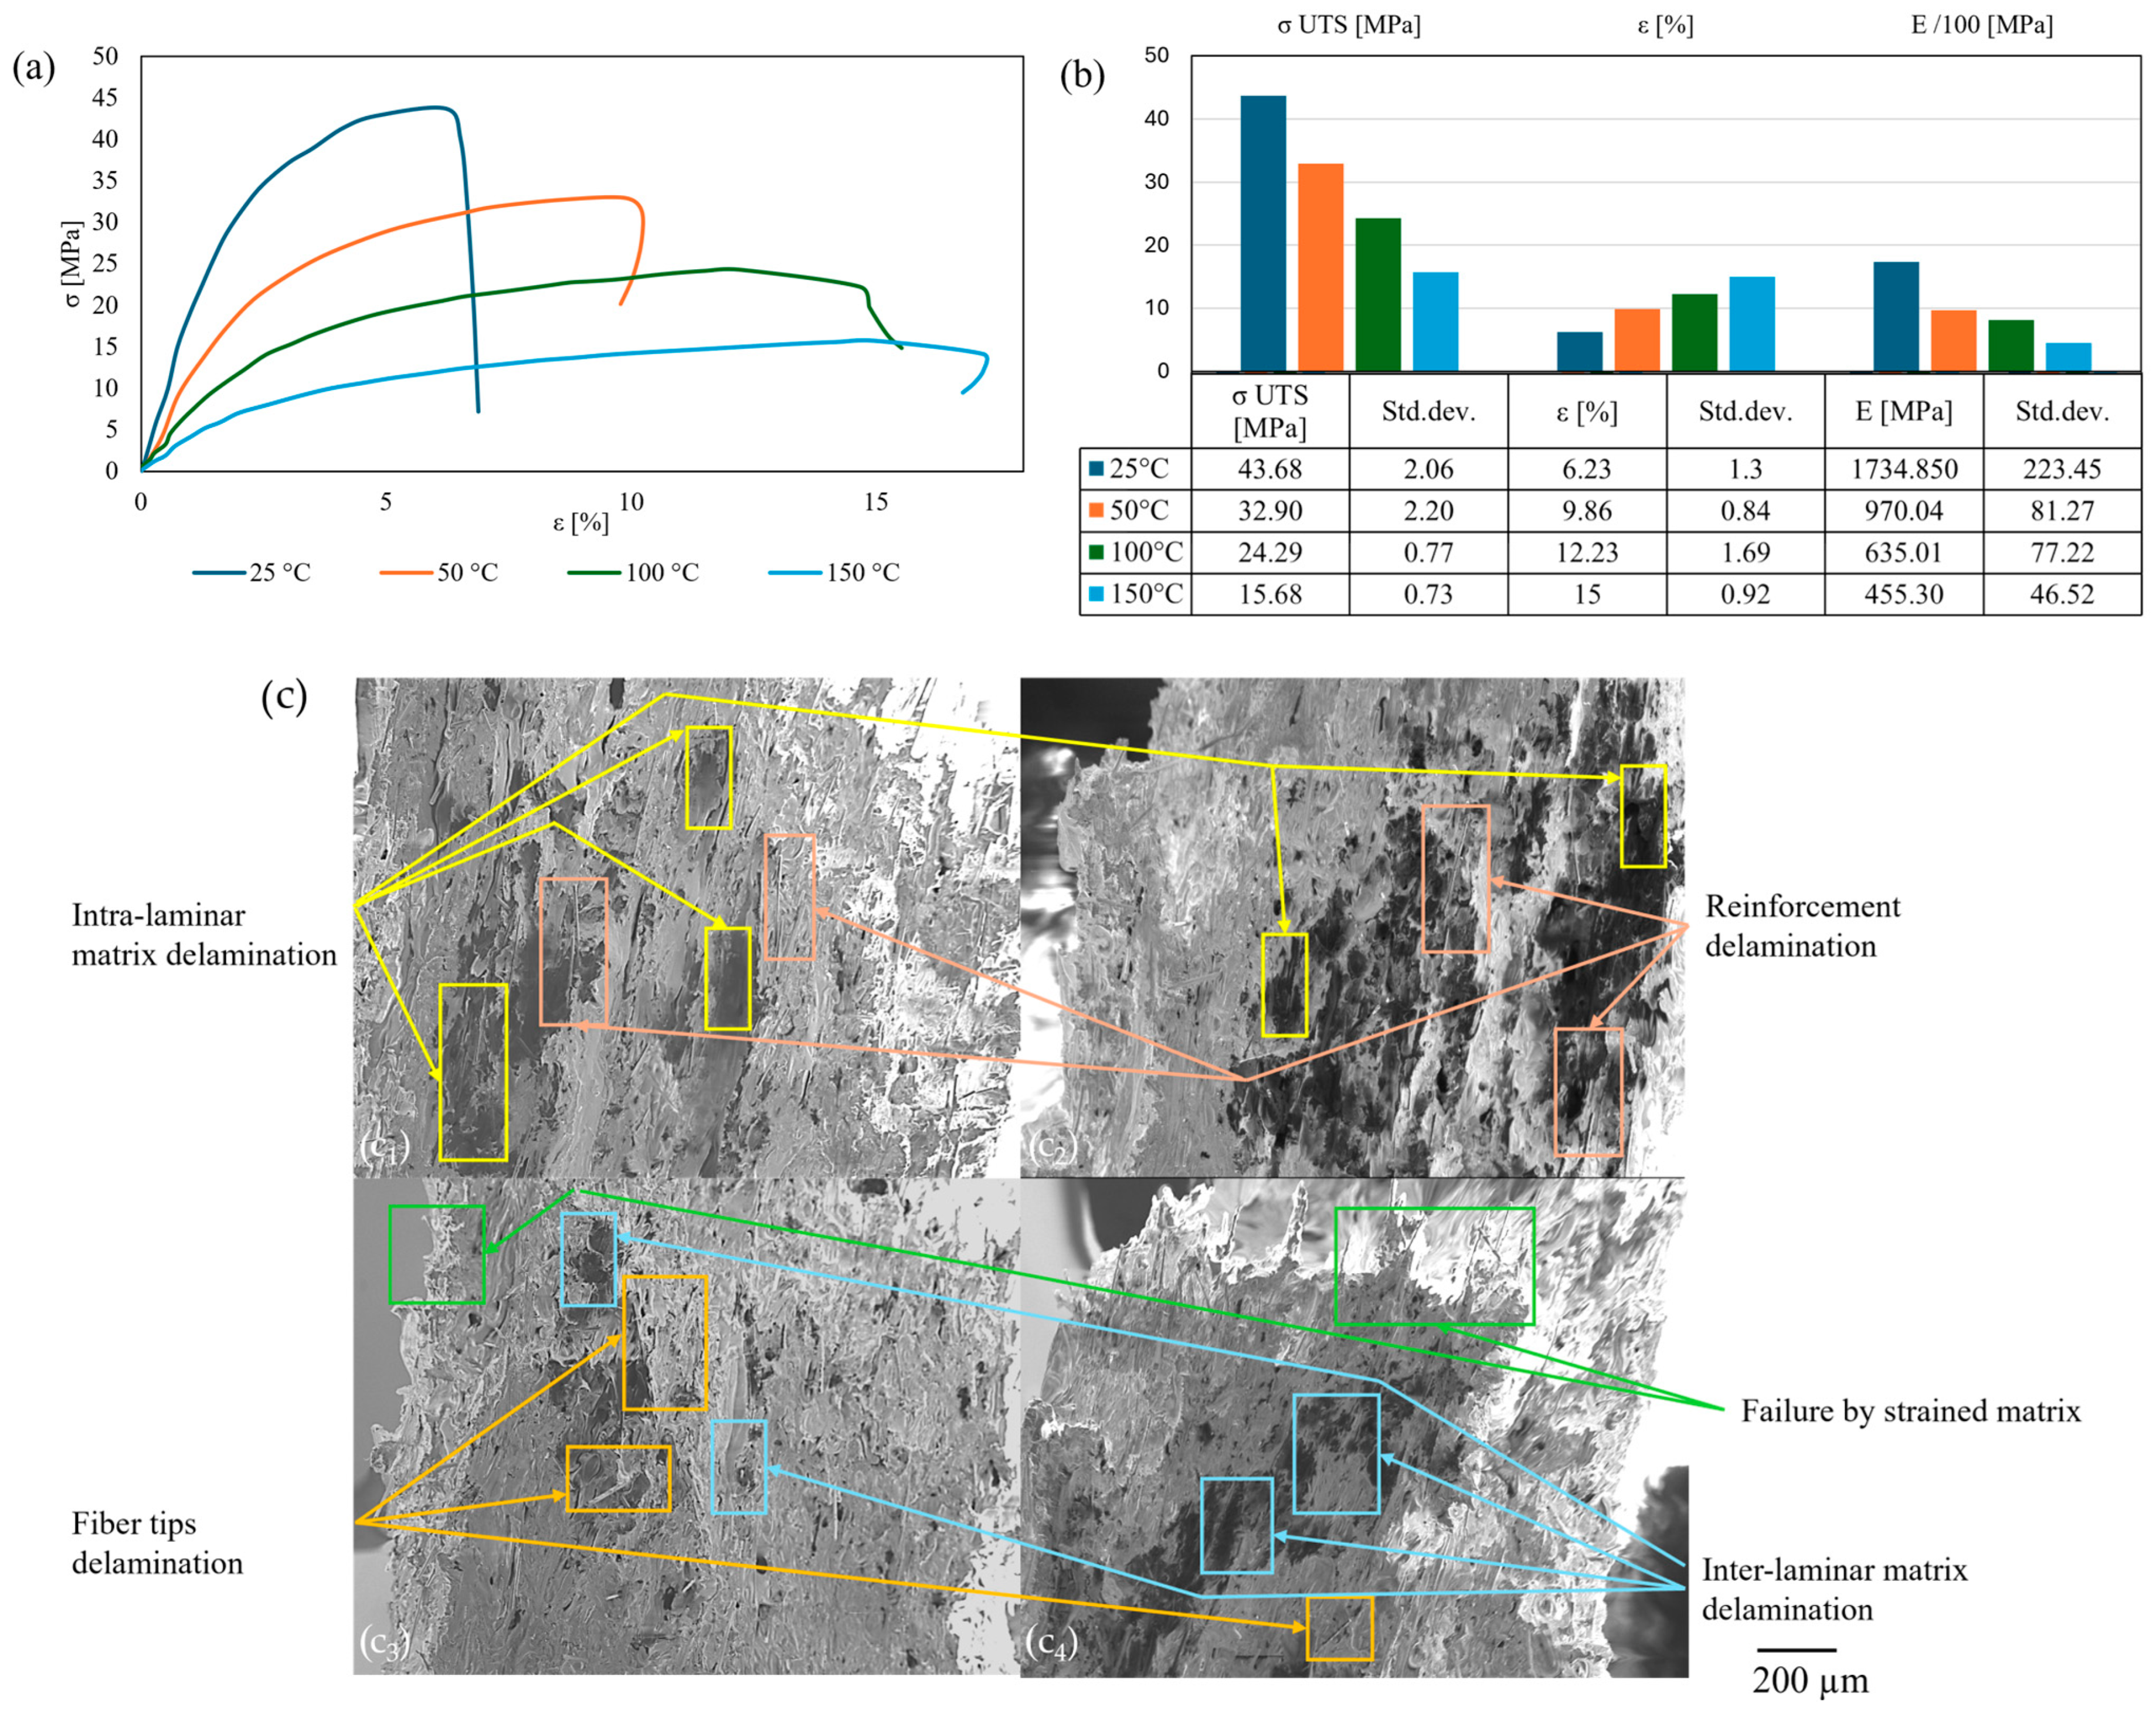
3.2. Influence of Temperature on the Tensile Behavior for Constant Infill Orientation
4. Conclusions
Author Contributions
Funding
Institutional Review Board Statement
Data Availability Statement
Acknowledgments
Conflicts of Interest
References
- Gibson, I.; Rosen, D.; Stucker, B.; Khorasani, M. Introduction and Basic Principles. In Additive Manufacturing Technologies; Springer: Cham, Switzerland, 2021; pp. 1–19. [Google Scholar] [CrossRef]
- Adeniran, O.; Cong, W.; Aremu, A. Material Design Factors in the Additive Manufacturing of Carbon Fiber Reinforced Plastic Composites: A state-of-the-Art Review. In Advances in Industrial and Manufacturing Engineering; Elsevier: Amsterdam, The Netherlands, 2022; Volume 5. [Google Scholar] [CrossRef]
- Siemiński, P. Introduction to Fused Deposition Modeling; Elsevier: Amsterdam, The Netherlands, 2021; pp. 217–275. [Google Scholar] [CrossRef]
- Zach, T.F.; Dudescu, M.C. The Three-Dimensional Printing of Composites: A Review of the Finite Element/Finite Volume Modelling of the Process. J. Compos. Sci. 2024, 8, 146. [Google Scholar] [CrossRef]
- Memarzadeh, A.; Safaei, B.; Tabak, A.; Sahmani, S.; Kizilors, C. Advancements in additive manufacturing of polymer matrix composites: A systematic review of techniques and properties. Mater. Today Commun. 2023, 36, 106449. [Google Scholar] [CrossRef]
- Markets and Markets. 3D Printing Plastics Market by Type, Form, Application, End-Use Industry and Region—Global Forecast to 2028. 2025. Available online: https://www.marketsandmarkets.com/Market-Reports/3d-printing-plastic-market-21707470.html (accessed on 25 April 2025).
- Dey, A.; Eagle, I.N.R.; Yodo, N. A review on filament materials for fused filament fabrication. J. Manuf. Mater. Process. 2021, 5, 69. [Google Scholar] [CrossRef]
- Zanjanijam, A.R.; Major, I.; Lyons, J.G.; Lafont, U.; Devine, D.M. Fused filament fabrication of peek: A review of process-structure-property relationships. Polymers 2020, 12, 1665. [Google Scholar] [CrossRef]
- Fico, D.; Rizzo, D.; Casciaro, R.; Corcione, C.E. A Review of Polymer-Based Materials for Fused Filament Fabrication (FFF): Focus on Sustainability and Recycled Materials. Polymers 2022, 14, 465. [Google Scholar] [CrossRef] [PubMed]
- Wong, J.; Altassan, A.; Rosen, D.W. Additive manufacturing of fiber-reinforced polymer composites: A technical review and status of design methodologies. Compos. B Eng. 2023, 255, 110603. [Google Scholar] [CrossRef]
- Al Rashid, A.; Koç, M. Fused filament fabrication process: A review of numerical simulation techniques. Polymers 2021, 13, 3534. [Google Scholar] [CrossRef]
- Bunsell, A.; Joannès, S.; Thionnet, A. Fundamentals of Fibre Reinforced Composite Materials, 2nd ed.; CRC Press: Boca Raton, FL, USA, 2021; Volume 2. [Google Scholar]
- Bai, Y.; Tian, J.; Li, C.; Wang, J.; Xian, G. Experimental and numerical analysis of a new thermoplastic pultrusion technology of CF/PA6 rod using prepreg tapes. Polym Compos. 2025; early view. [Google Scholar] [CrossRef]
- Pratama, J.; Cahyono, S.I.; Suyitno, S.; Muflikhun, M.A.; Salim, U.A.; Mahardika, M.; Arifvianto, B. A review on reinforcement methods for polymeric materials processed using fused filament fabrication (Fff). Polymers 2021, 13, 4022. [Google Scholar] [CrossRef]
- Mills, N.; Jenkins, M.; Kukureka, S. Chapter 3—Amorphous Polymers and the Glass Transition. In Plastics, 4th ed.; Mills, N., Jenkins, M., Kukureka, S., Eds.; Butterworth-Heinemann: Oxford, UK, 2020; pp. 33–48. [Google Scholar] [CrossRef]
- Mirkhalaf, M.; Vadizadeh, R. Micro-mechanical modeling of semi-crystalline polymers: A review. Int. J. Solids Struct. 2024, 290, 112691. [Google Scholar] [CrossRef]
- Cowie, J.M.G.; Arrighi, V. Structure–Property Relations. In Polymers Chemistry and Physics of Modern Materials; Ward, I., Ed.; Taylor & Francis: Boca Raton, FL, USA, 2009; pp. 409–455. [Google Scholar] [CrossRef]
- Cao, M.; Cui, T.; Yue, Y.; Li, C.; Guo, X.; Jia, X.; Wang, B. Preparation and Characterization for the Thermal Stability and Mechanical Property of PLA and PLA/CF Samples Built by FFF Approach. Materials 2023, 16, 5023. [Google Scholar] [CrossRef]
- Shanmugam, V.; Vigneshwaran, S.; Karthik, B.; Gokul, K.; Rhoda Afriyie, M.; Saroj Kumar, S.; Oisik, D. The thermal properties of FDM printed polymeric materials: A review. Polym. Degrad. Stab. 2024, 228, 110902. [Google Scholar] [CrossRef]
- Francis, J.N.; Banerjee, I.; Chugh, A.; Singh, J. Additive manufacturing of polyetheretherketone and its composites: A review. Polym. Compos. 2022, 43, 5802–5819. [Google Scholar] [CrossRef]
- Told, R.; Kardos, K.; Paari-Molnar, E.; Szabo, G.; Ujfalusi, Z.; Sahai, N.; Szabo, P.; Maroti, P. Comparative Analysis of Mechanical and Thermal Characteristics of 3D-Printed Polyamide using Material Extrusion and Powder Bed Fusion Process with Industrial and Desktop Printers. Macromol. Mater. Eng. 2024, 310, 2400293. [Google Scholar] [CrossRef]
- Vidakis, N.; Petousis, M.; Kechagias, J.D. Parameter effects and process modelling of Polyamide 12 3D-printed parts strength and toughness. Mater. Manuf. Process. 2022, 37, 1358–1369. [Google Scholar] [CrossRef]
- Rodzeń, K.; McIlhagger, A.; Strachota, B.; Strachota, A.; Meenan, B.J.; Boyd, A. Controlling Crystallization: A Key Factor during 3D Printing with the Advanced Semicrystalline Polymeric Materials PEEK, PEKK 6002, and PEKK 7002. Macromol. Mater. Eng. 2023, 308, 2200668. [Google Scholar] [CrossRef]
- Bambu Filament PET-CF Technical Data Sheet. Available online: https://eu.store.bambulab.com/products/pet-cf (accessed on 20 March 2025).
- Aliberti, F.; Oliviero, M.; Longo, R.; Guadagno, L.; Sorrentino, A. Effect of Crystallinity on the Printability of Poly(ethylene Terephthalate)/Poly(butylene Terephthalate) Blends. Polymers 2025, 17, 156. [Google Scholar] [CrossRef]
- Bambulab. Technical Data Sheet—PAHT-CF. Available online: https://eu.store.bambulab.com/en-nl/products/paht-cf (accessed on 15 January 2025).
- Grasso, M.; Azzouz, L.; Ruiz-Hincapie, P.; Zarrelli, M.; Ren, G. Effect of temperature on the mechanical properties of 3D-printed PLA tensile specimens. Rapid Prototyp. J. 2018, 24, 1337–1346. [Google Scholar] [CrossRef]
- Yavas, D. High-temperature fracture behavior of carbon fiber reinforced PEEK composites fabricated via fused filament fabrication. Compos. B Eng. 2023, 266, 110987. [Google Scholar] [CrossRef]
- Zhang, Z.; Yavas, D.; Liu, Q.; Wu, D. Effect of build orientation and raster pattern on the fracture behavior of carbon fiber reinforced polymer composites fabricated by additive manufacturing. Addit. Manuf. 2021, 47, 102204. [Google Scholar] [CrossRef]
- Racz, L.; Dudescu, M.C. Numerical evaluation of the infill pattern upon mechanical proprieties of 3D printed materials. Procedia Struct. Integr. 2024, 56, 3–10. [Google Scholar] [CrossRef]
- Königshofer, M.; Stoiber, M.; Unger, E.; Grasl, C.; Moscato, F. Mechanical and Dimensional Investigation of Additive Manufactured Multimaterial Parts. Front. Phys. 2021, 9, 635736. [Google Scholar] [CrossRef]
- Bambulab. Bambu Lab X1 Carbon. Available online: https://bambulab.com/en-eu/x1 (accessed on 15 January 2025).
- ISO 37-2024; Rubber, vulcanized or thermoplastic—Determination of tensile stress-strain properties. British Standards Institution: London, UK, 2024.
- ISO 527-4:2023; Plastics. Determination of Tensile Properties. Part 4, Test Conditions for Isotropic and Orthotropic Fibre-Reinforced Plastic Composites. British Standards Institution: London, UK, 2023.
- Islam, M.N.; Baxevanakis, K.P.; Silberschmidt, V.V. Viscoelastic characterisation of additively manufactured composites with nylon matrix: Effects of type and orientation of fibres. Compos. B Eng. 2023, 263, 110815. [Google Scholar] [CrossRef]
- Katalagarianakis, A.; Polyzos, E.; Van Hemelrijck, D.; Pyl, L. Mode I, mode II and mixed mode I-II delamination of carbon fibre-reinforced polyamide composites 3D-printed by material extrusion. Compos. Part A Appl. Sci. Manuf. 2023, 173, 107655. [Google Scholar] [CrossRef]


| No. | Property | Symbol | Value | Deviation | Unit |
|---|---|---|---|---|---|
| 1. | Tensile Strength (planar) | σUTSXY | 92 | ±7 | MPa |
| 2. | Failure Strain (planar) | εxy | 8.4 | ±1.8 | % |
| 3. | Young’s Modulus (planar) | Exy | 3860 | ±230 | MPa |
| 4. | Tensile Strength (Z-axis) | σUTSZ | 47 | ±5 | MPa |
| 5. | Failure Strain (Z-axis) | εz | 4.1 | ±1.2 | % |
| 6. | Young’s Modulus (Z-axis) | Ez | 2180 | ±130 | MPa |
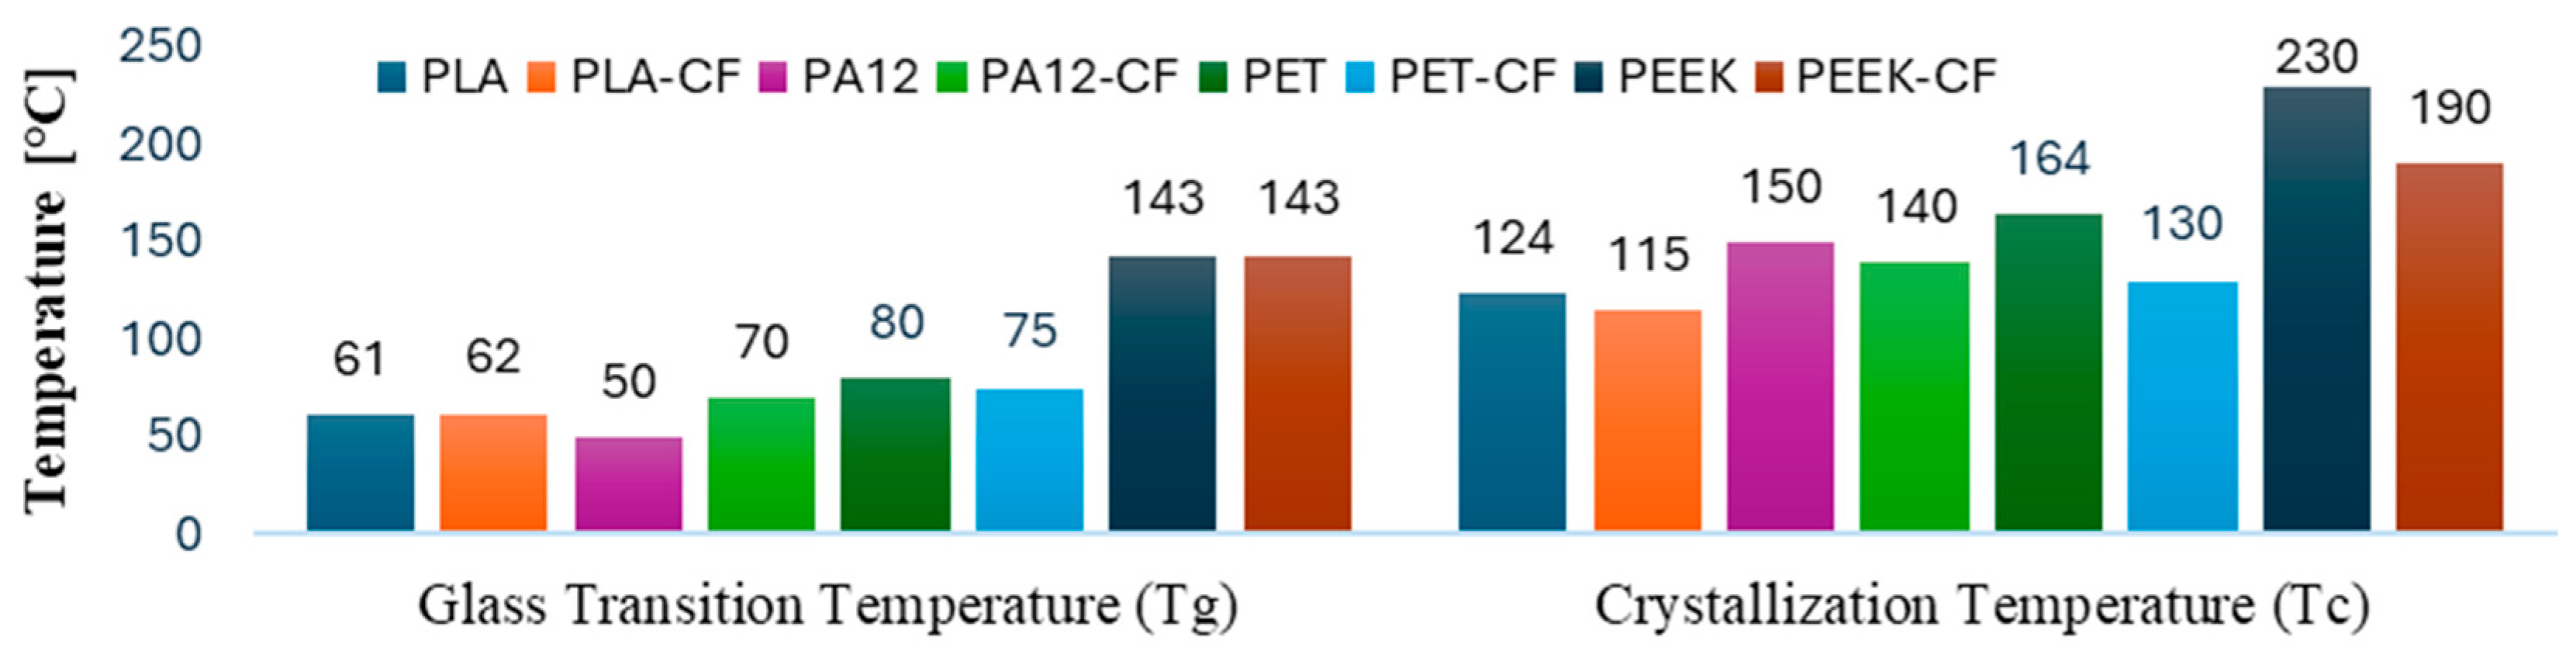
| 7. | Glass Transition Temperature | Tg | 70 | - | °C |
| 8. | Crystallization Temperature | Tc | 140 | - | °C |
| No. | Parameter | Value | Unit |
|---|---|---|---|
| 1. | Nozzle Diameter | 0.4 | mm |
| 2. | Layer Thickness | 0.2 | mm |
| 3. | Top/Bottom Layer Thickness | 0.16 | mm |
| 4. | Relative Infill Rate | 100 | % |
| 5. | Printing Speed | 250 | mm/s |
| 6. | Infill Orientation | 0°; 45°; 90°; 0/90°; ±45° | ° |
| 7. | Extrusion Temperature | 290 | °C |
| 8. | Building Plate Temperature | 100 | °C |
| 9. | Enclosed Printing Environment Temperature | 45 | °C |
Disclaimer/Publisher’s Note: The statements, opinions and data contained in all publications are solely those of the individual author(s) and contributor(s) and not of MDPI and/or the editor(s). MDPI and/or the editor(s) disclaim responsibility for any injury to people or property resulting from any ideas, methods, instructions or products referred to in the content. |
© 2025 by the authors. Licensee MDPI, Basel, Switzerland. This article is an open access article distributed under the terms and conditions of the Creative Commons Attribution (CC BY) license (https://creativecommons.org/licenses/by/4.0/).
Share and Cite
Zach, T.F.; Dudescu, M.C.; Bere, P. High-Temperature Tensile Performance of Fused Filament Fabricated Discontinuous Carbon Fiber-Reinforced Polyamide. Polymers 2025, 17, 1732. https://doi.org/10.3390/polym17131732
Zach TF, Dudescu MC, Bere P. High-Temperature Tensile Performance of Fused Filament Fabricated Discontinuous Carbon Fiber-Reinforced Polyamide. Polymers. 2025; 17(13):1732. https://doi.org/10.3390/polym17131732
Chicago/Turabian StyleZach, Theodor Florian, Mircea Cristian Dudescu, and Paul Bere. 2025. "High-Temperature Tensile Performance of Fused Filament Fabricated Discontinuous Carbon Fiber-Reinforced Polyamide" Polymers 17, no. 13: 1732. https://doi.org/10.3390/polym17131732
APA StyleZach, T. F., Dudescu, M. C., & Bere, P. (2025). High-Temperature Tensile Performance of Fused Filament Fabricated Discontinuous Carbon Fiber-Reinforced Polyamide. Polymers, 17(13), 1732. https://doi.org/10.3390/polym17131732