1. Introduction
With the advancement of 3D printing technology, the field has gradually transitioned from small-scale fabrication to the production of large and complex structures [
1]. Within this evolving landscape, fused deposition modeling (FDM) has emerged as one of the most extensively employed additive manufacturing techniques for large-scale structural production, primarily owing to its simplicity and cost-effectiveness [
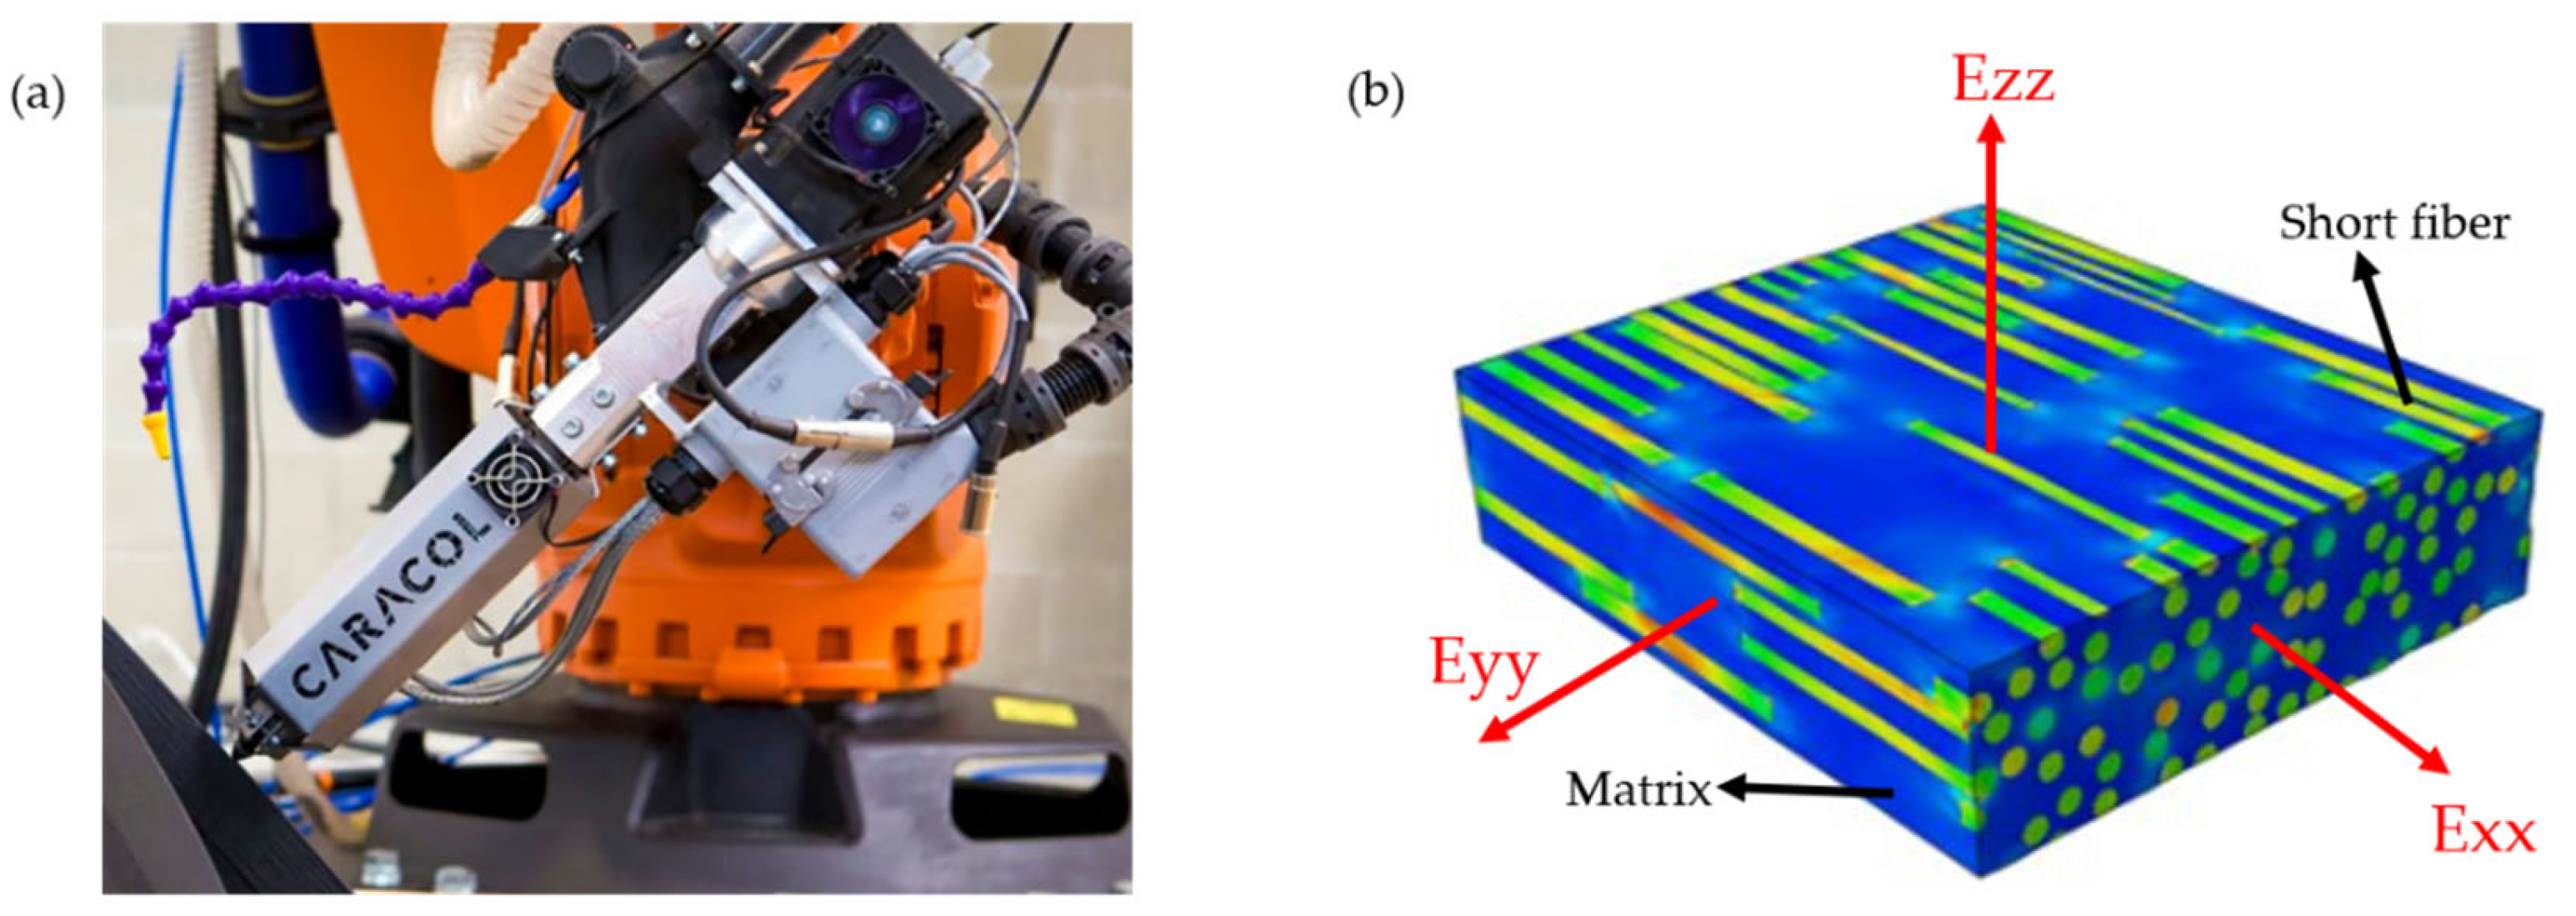
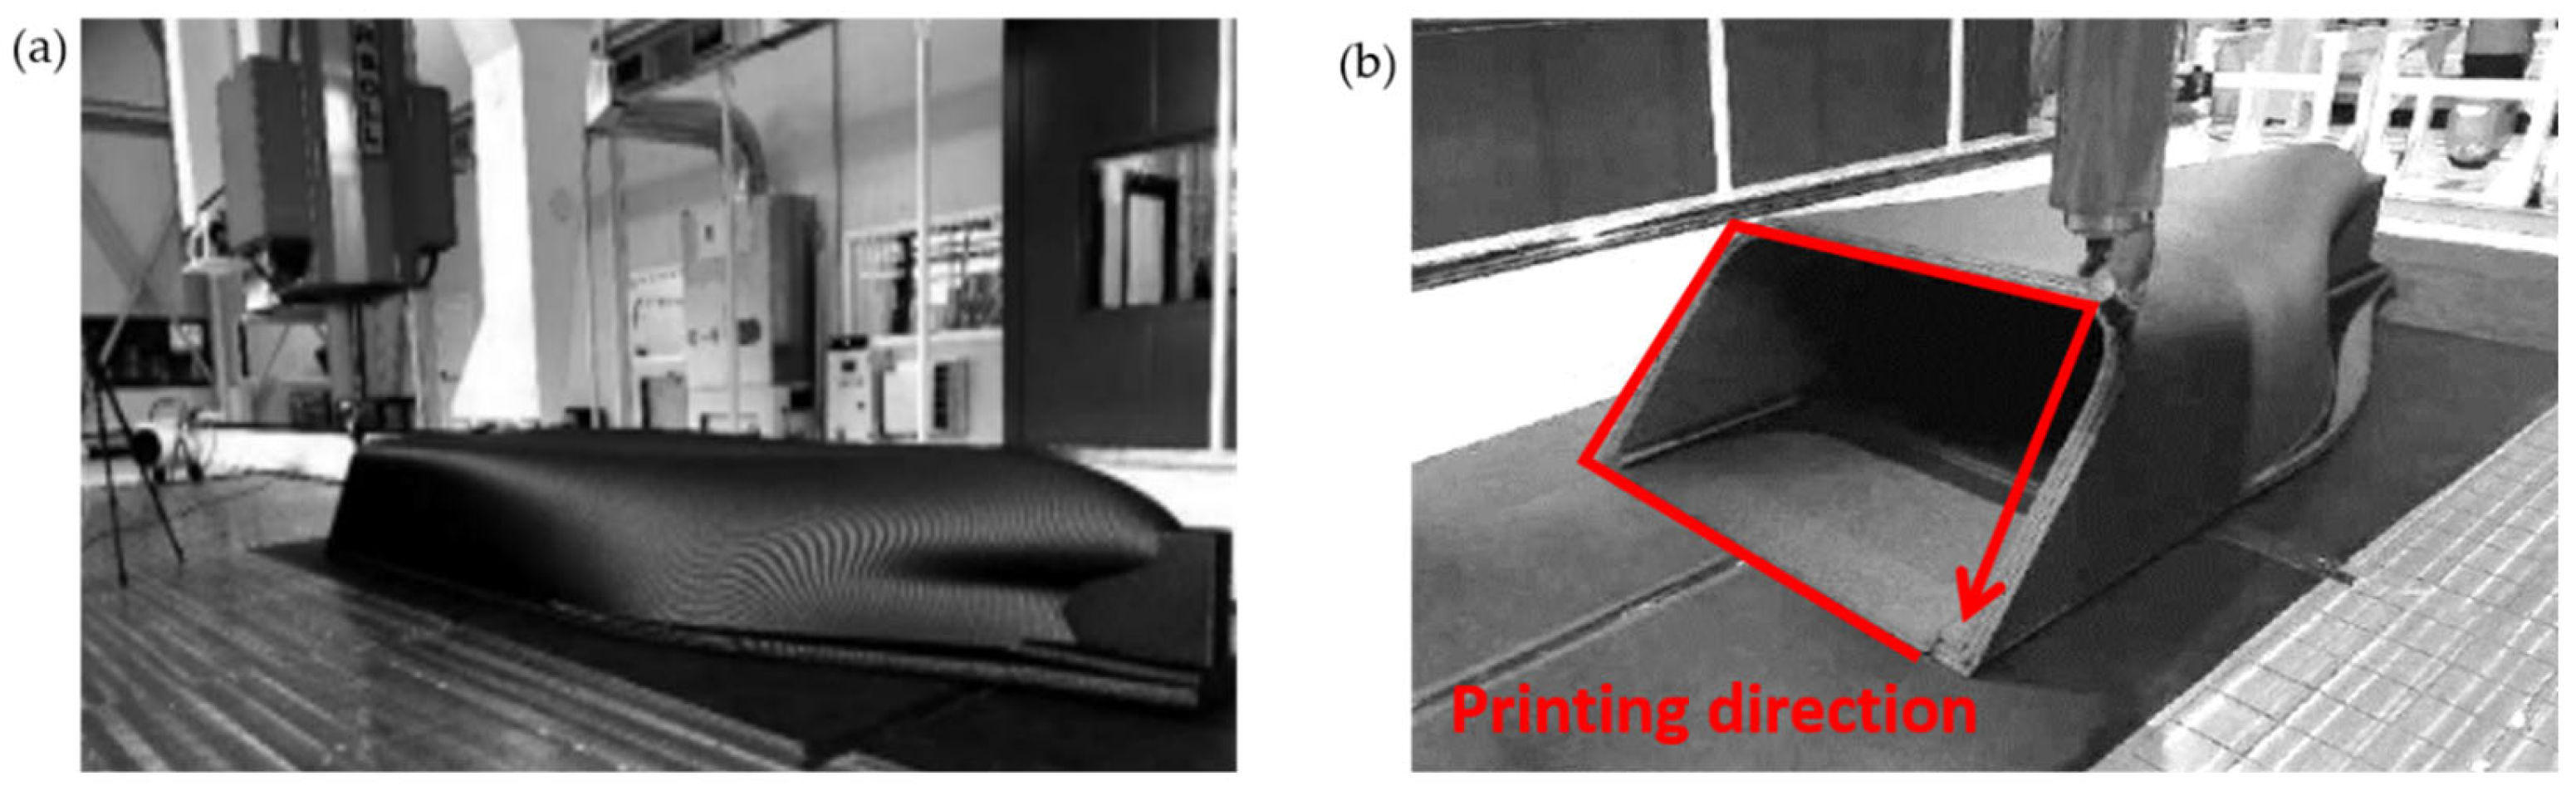
2]. The printing process is fully automatic using a robotic system and an extruder with feeding of short-fiber-reinforced pellets, as illustrated in
Figure 1a.
Recently, short-fiber-reinforced thermoplastic composites have emerged as a central research focus in material extrusion additive manufacturing. Short-fiber-reinforced thermoplastic composites for material-extrusion additive manufacturing typically employ E-glass, carbon, aramid, basalt, or natural lignocellulosic fibers, such as flax and hemp [
3,
4,
5,
6,
7,
8,
9]. Glass fibers remain the most widely used owing to their low cost and balanced tensile strength (≈1.5 GPa); however, their relatively high density (~2.55 g cm
−3) limits weight savings in lightweight structures [
3,
4]. Basalt fibers offer slightly higher modulus and superior thermal stability but have a density comparable to that of glass and a less established supply chain [
5,
6]. Aramid fibers (e.g., Kevlar
®) provide excellent impact resistance and high specific strength but suffer from moisture uptake and a lower compressive modulus, which complicate printing and structural design [
7,
8]. Natural fibers are attractive for sustainability; however, their low thermal resistance (<200 °C) and variability hinder their integration with engineering thermoplastics processed at >250 °C [
9]. In contrast, carbon fibers combine the highest specific modulus (≈130 GPa g
−1 cm
3) and tensile strength (>3 GPa) with a low density (~1.8 g cm
−3), outstanding thermal stability, and intrinsic electrical conductivity that promotes inter-filament fusion during laser- or Joule-assisted printing [
10,
11]. For these reasons, and because chopped carbon fiber feedstock is now commercially available for fused deposition modeling, carbon fiber was selected as the reinforcement in the present study.
Many researchers have shown that adding short carbon fibers markedly improves the stiffness and strength compared with neat polymers. For example, Ivey et al. [
12] reported a 150% increase in the tensile modulus of short carbon fiber/nylon composites and an approximately 140% increase in the elastic modulus of carbon fiber/PLA composites after annealing. Similarly, Gupta and Fidan [
13] demonstrated that increasing the fiber volume fraction in short carbon fiber/PP filaments substantially improved Young’s modulus along the printing direction, albeit with only slight gains in the transverse direction, highlighting the pronounced anisotropy of these materials. Despite these improvements, critical challenges such as fiber breakage, void formation, and associated strength persist [
3,
14,
15]. Thus, although short-fiber-reinforced thermoplastic composites offer considerable promise for structural applications, their anisotropic mechanical behavior and microstructural heterogeneities complicate accurate performance prediction and design. Consequently, this study aims to develop and experimentally validate a projection-based finite-element workflow that links recorded tool paths to element-wise fiber orientations, enabling an accurate simulation of large FDM polymer-composite structures.
The anisotropic mechanical behavior of short-fiber-reinforced thermoplastic composites fundamentally stems from the type, morphology, distribution, and orientation of embedded short fibers. As illustrated in
Figure 1b, unlike traditional single-component homogeneous materials, short-fiber-reinforced thermoplastic composites exhibit a complex hierarchical microstructure that induces pronounced anisotropy across the macro-, meso-, and microscales. In particular, the molten matrix flow during material extrusion induces fiber alignment predominantly along the printing path, resulting in enhanced stiffness and strength in the longitudinal direction, while comparatively inferior properties develop transversely. This directional dependency is often modeled using a transverse isotropic framework.
Given the critical influence of fiber alignment on mechanical performance, the accurate characterization of direction-dependent properties is essential for the reliable design and simulation of large-scale 3D-printed structures. However, despite extensive research efforts investigating the effects of infill angle, raster orientation, and processing parameters, the current experimental databases remain insufficient to provide a complete set of anisotropic material constants required for finite element modeling [
16,
17,
18,
19,
20]. To address this limitation, the present study proposes a systematic material testing protocol capable of capturing the full suite of anisotropic properties of short-fiber-reinforced thermoplastic composites, thereby bridging the crucial gap between experimental characterization and computational simulation.
Robotic inclined-surface printing has emerged as an effective manufacturing strategy for fabricating large-scale, free-form components. Shajay Bhooshan et al. [
21] developed the Print-Path Design toolchain, which combines functional-surface representation with six-axis synchronized interpolation to enable support-free deposition on planes inclined at 35–45 degrees; using this method, they fabricated 53 concrete arch blocks for a footbridge with a 16 m span. Nadal Serrano [
22] integrated a 25 kg/h pellet extruder with a KUKA KR-120 robot and established a design-to-manufacture workflow that enables rapid iteration of 3 m-scale polymer prototypes. Georgiou et al. [
23] combined variable formwork with a six-axis robot to print cement-based material on inclined “I-, S-, U-, and W-shaped” surfaces, demonstrating both the feasibility and the practical limits of an adaptive formwork–robot synergy for prefabricating complex curved structures. Luu et al. [
24] built an FDM 3D printing system around a six-DOF industrial robot and achieved support-free continuous deposition on surfaces inclined up to 80°, further demonstrating that multi-axis path planning and coordinated robot–extruder control is critical for high-angle printing. Hai-ming Zhao [
25] developed the Inclined Layer Printing (ILP) technique, in which the build platform—rather than the robot arm—is tilted. This strategy enables support-free fabrication of features with up to 60° overhangs and reduces support material consumption by approximately 87%. Collectively, these studies highlight the critical role of multi-axis path planning and coordinated robot–extruder control in achieving complex, large-scale additive manufacturing.
As the scale and complexity of 3D-printed structures continue to grow, the limitations of conventional planar 3D printing with fixed angles of 0° or 90° have been increasingly exposed. When large-scale components with pronounced overhangs or intricate geometries are fabricated, conventional planar printing methods inevitably require extensive support structures, significantly increasing material consumption, prolonging printing duration, and complicating post-processing operations. In contrast, robotic inclined-surface printing significantly mitigates these issues by enabling support-free deposition, thereby reducing material waste, shortening production cycles, and improving design flexibility. These advantages have led to their growing adoption in industries such as shipbuilding and mold manufacturing, where lightweight, corrosion-resistant polymer composites are preferred for their structural and economic benefits [
1,
26,
27,
28,
29,
30,
31,
32,
33,
34,
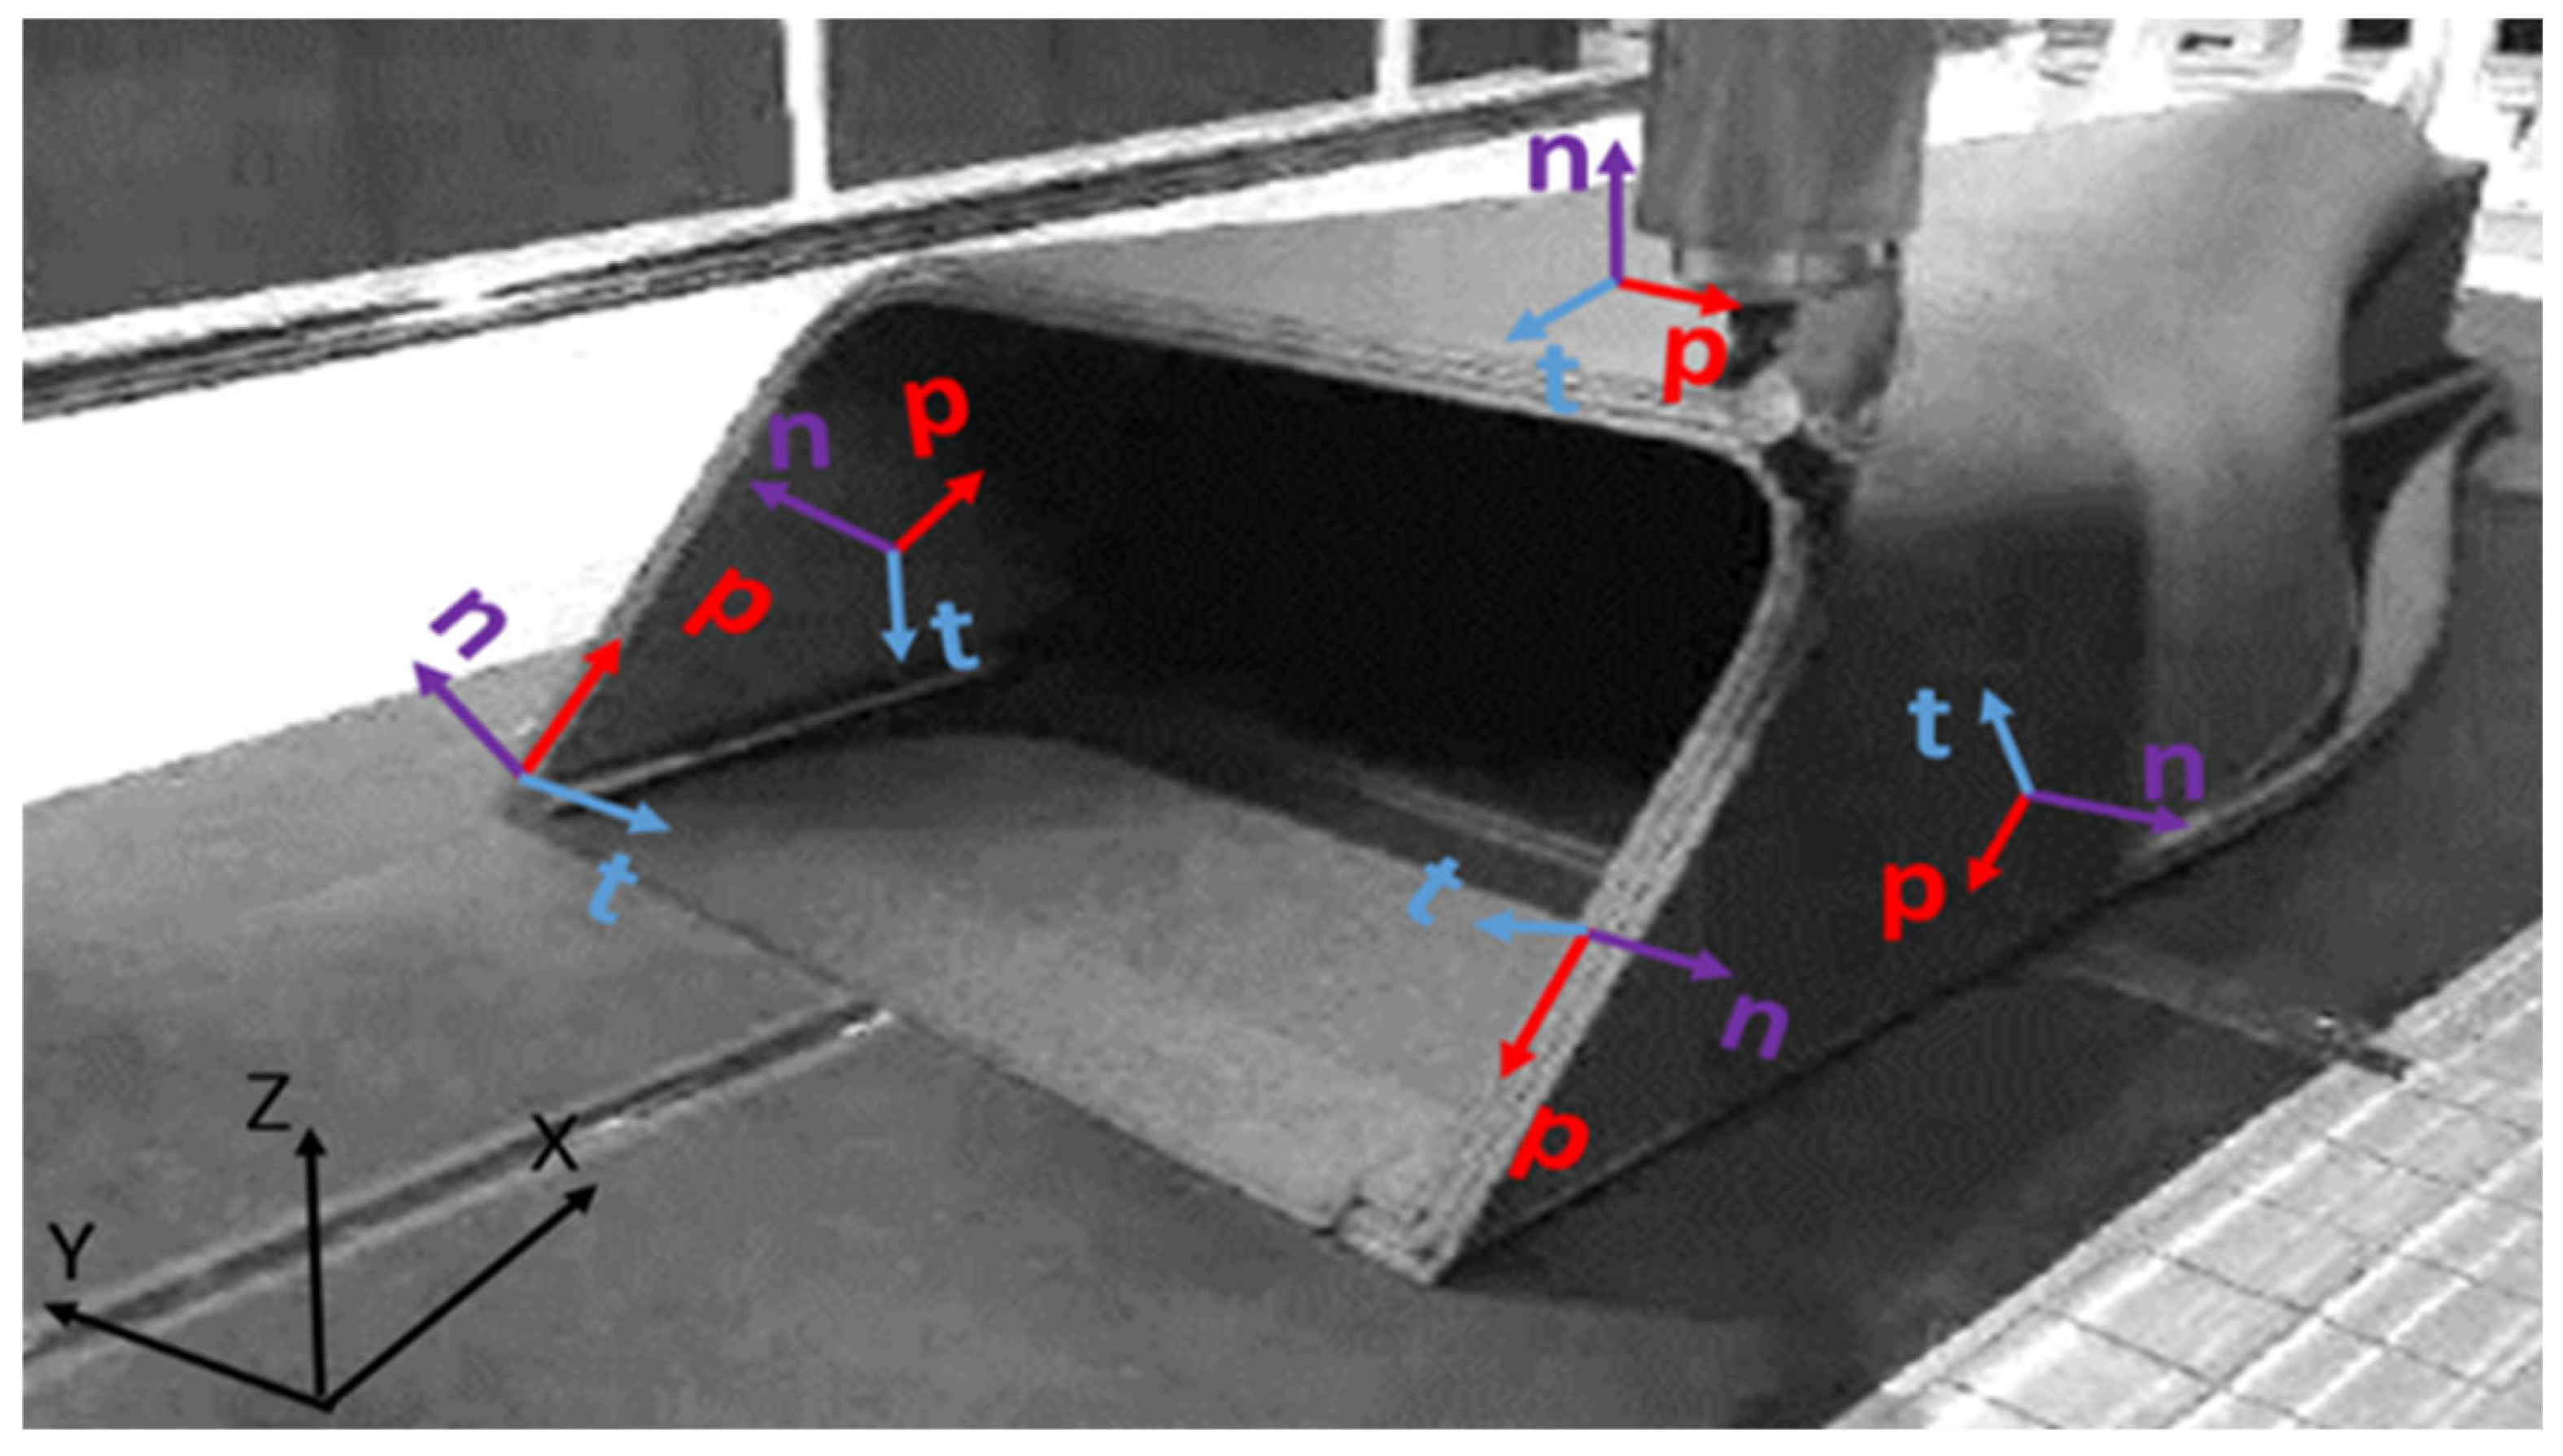
35]. Nevertheless, the layer-by-layer deposition characteristic inherent to robotic inclined-surface printing introduces pronounced anisotropy within the printed structures, posing new challenges for the prediction of mechanical performance. As illustrated in
Figure 2, variations in the printing direction P give rise to distinct material orientations on different faces of the structure; the printing direction P and thickness direction T on each printed surface are rotated about the normal direction N. Consequently, each face of the same component exhibits unique mechanical properties, thereby imposing higher demands on subsequent mechanical analysis and structural optimization. Although simulation methods for 3D-printed structures have been extensively investigated in previous studies [
36,
37,
38,
39,
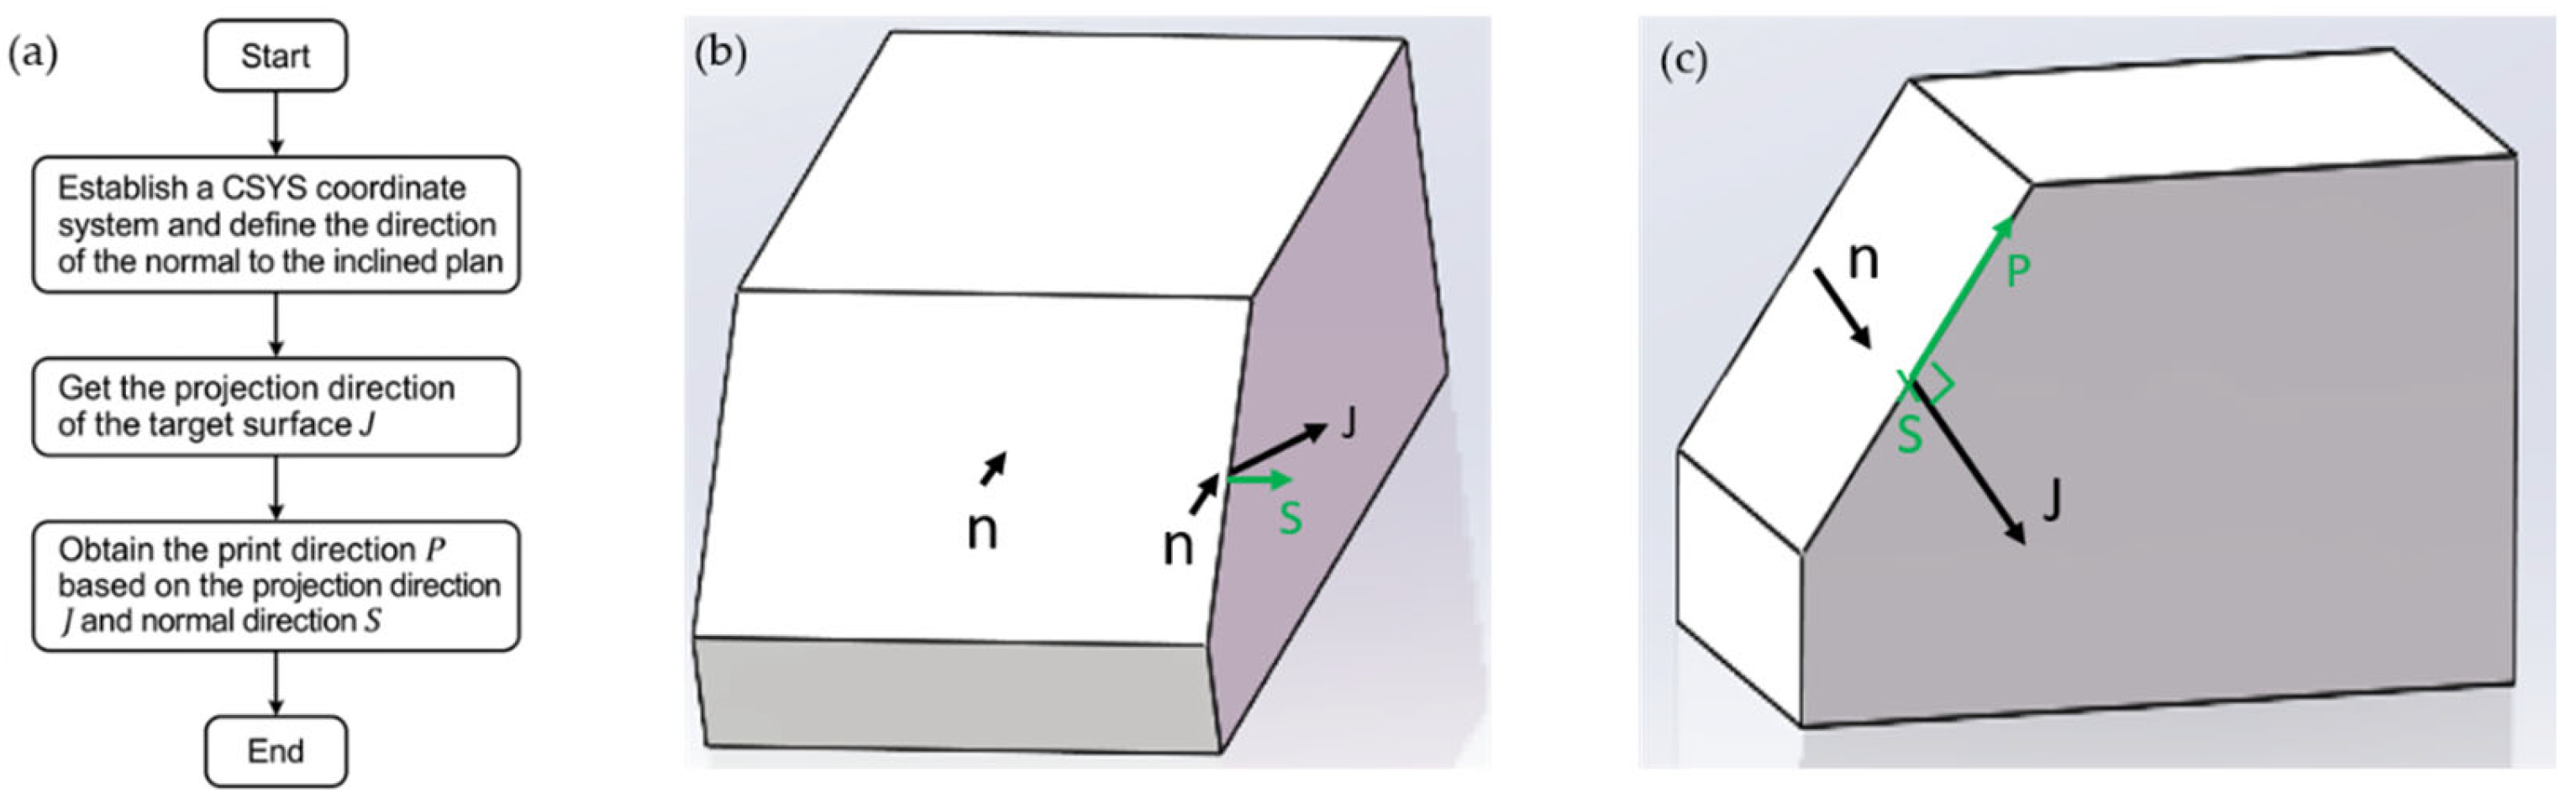
40], in which various numerical techniques and computational models to predict their mechanical behavior were developed, these methods predominantly focus on global mechanical properties or interlayer bonding strength and fail to comprehensively capture the influence of the printing path on the ultimate structural performance, representing a notable gap in the field of 3D-printing mechanical simulations. Accordingly, this study proposes a projection-based approach to accurately capture the anisotropic behavior of large-scale polymer composite structures fabricated using FDM. By mapping local fiber orientations based on the actual printing path, this method allows for the precise incorporation of directional material properties into finite element simulations.
To address the challenges associated with anisotropy in FDM-printed polymer composites, this study introduces a projection-based method for accurately analyzing the mechanical behavior of large-scale printed structures. This method defines local fiber orientations directly from the actual printing path, enabling a more precise representation of the anisotropic properties in finite element simulations. To support the projection method, we established a systematic material characterization workflow in which direction-dependent mechanical properties were characterized through tensile tests in three orientations (UDL, UDT, and UD10), with the latter capturing the shear response of the material. Implemented in ABAQUS, the proposed methodology was applied to simulate a 3D-printed ship mockup, and the numerical predictions of ship deflection agreed with full-scale measurements within 5%, demonstrating the method’s accuracy and engineering applicability.
The remainder of this paper is organized as follows:
Section 2 describes the material preparation and directional characterization.
Section 3 presents the projection algorithm and numerical validation. In
Section 4, the method is applied to a twenty-meter ship mockup.
Section 5 compares the simulated and experimental deflections, and
Section 6 concludes with the limitations and future work.
Figure 1.
FDM fabrication process and anisotropy of 3D-printed materials: (
a) Robot Extruder [
41]; (
b) Anisotropy of 3D-Printed materials.
Figure 1.
FDM fabrication process and anisotropy of 3D-printed materials: (
a) Robot Extruder [
41]; (
b) Anisotropy of 3D-Printed materials.
Figure 2.
Local material coordinate systems in 3D-printed structures.
Figure 2.
Local material coordinate systems in 3D-printed structures.
2. Characterization of Printed Materials
2.1. Material Preparation
In this work, an ABS/CF20 polymer composite material manufactured by Airtech International Inc. (Huntington Beach, CA, USA) was utilized as the matrix. During the manufacturing process, a high-capacity extruder capable of depositing the material at approximately 150 lb h−1 was utilized, coupled with a nozzle diameter of 10 mm; each layer featured a width of approximately 18.75 mm and a thickness of 3 mm, with the printing orientation set at 45°. To produce the composite panels required for experimentation, FDM was employed using uniform processing parameters (including printing temperature, nozzle diameter, extrusion speed, and layer thickness), thereby forming sufficiently large plates. In the RoboDK v5.7.4 (RoboDK Inc., Montreal, QC, Canada), a 45° printing strategy was adopted by setting the substrate orientation to a 45° angle relative to the build platform reference. This approach provided robust experimental data to support the subsequent simulation analyses of a 45°-printed ship.
2.2. Specimen Preparation
To ensure accurate specimen fabrication, dimensional precision, and surface quality, a CNC precision machining device was initially used to cut the composite panels, with the cutting paths and dimensions strictly following the ASTM D638 guidelines [
42] to produce standard-compliant dog-bone-shaped tensile specimens. As illustrated in
Figure 3, based on the fiber orientation relative to the tensile loading direction, three types of specimens were designed and fabricated: UDL (0°, fibers parallel to the tensile axis), UDT (90°, fibers perpendicular to the tensile axis), and UD10 (10 deg-off, fibers oriented at a 10° angle to the tensile axis). The selection of fiber orientation angles in our study was based on both standard practices in composite testing and the need to capture distinct mechanical responses relevant to FDM-printed structures. UDL and UDT represent extreme loading conditions along the principal fiber direction and orthogonal to it, whereas UD10, which is situated between these two extremes, is a practical and effective means of characterizing the interlaminar shear properties of UD composite laminates by inducing shear through extension-shear coupling, and provides data representative of real-world mixed loading conditions [
43]. The 10° off-axis test introduces coupled axial and shear deformation. Under the small-angle assumption, the shear strain is the dominant contributor to the axial response. This allows the in-plane shear modulus to be approximated using inverse laminate theory or micromechanics-based models. This approach is widely accepted and has been used in ASTM D3518 and D7078 standards, as well as referenced in the composite design literature (e.g., Daniel and Ishai, 2006) [
44,
45,
46].
During the CNC cutting process, a constant spindle speed, controlled feed rate, and adequate cooling/lubrication were employed to minimize the thermal and mechanical impacts on the interlinear regions, thus preventing any noticeable heat damage or delamination on the specimen surfaces. Finally, the geometry, tolerance, and surface roughness of each specimen were rigorously maintained in strict accordance with the ASTM D638 requirements to ensure the reliability and reproducibility of all test data.
2.3. Mechanical Test
To systematically investigate the mechanical response of composite materials with different fiber orientations, a universal testing machine (manufactured by Jinan XLC Testing Machine Co., Ltd., Jinan, China) was employed to conduct uniaxial tensile tests on various specimens under ambient conditions. After each specimen was clamped, a preload of 5–10 N was applied to remove the seating slack, and the crosshead speed was fixed at 1 mm min−1. The load–displacement data were recorded continuously, and the strain was captured using gauges and a high-precision extensometer at 1 Hz. The key mechanical parameters, including the tensile strength, tensile modulus, and elongation at break, were derived from stress–strain curves. To evaluate the stability and repeatability of the test data for each specimen type (UDL, UDT, and UD10), at least three replicate tests were conducted for every group, and the mean values and standard deviations were calculated for further statistical analysis.
2.4. Data Analysis and Discussion
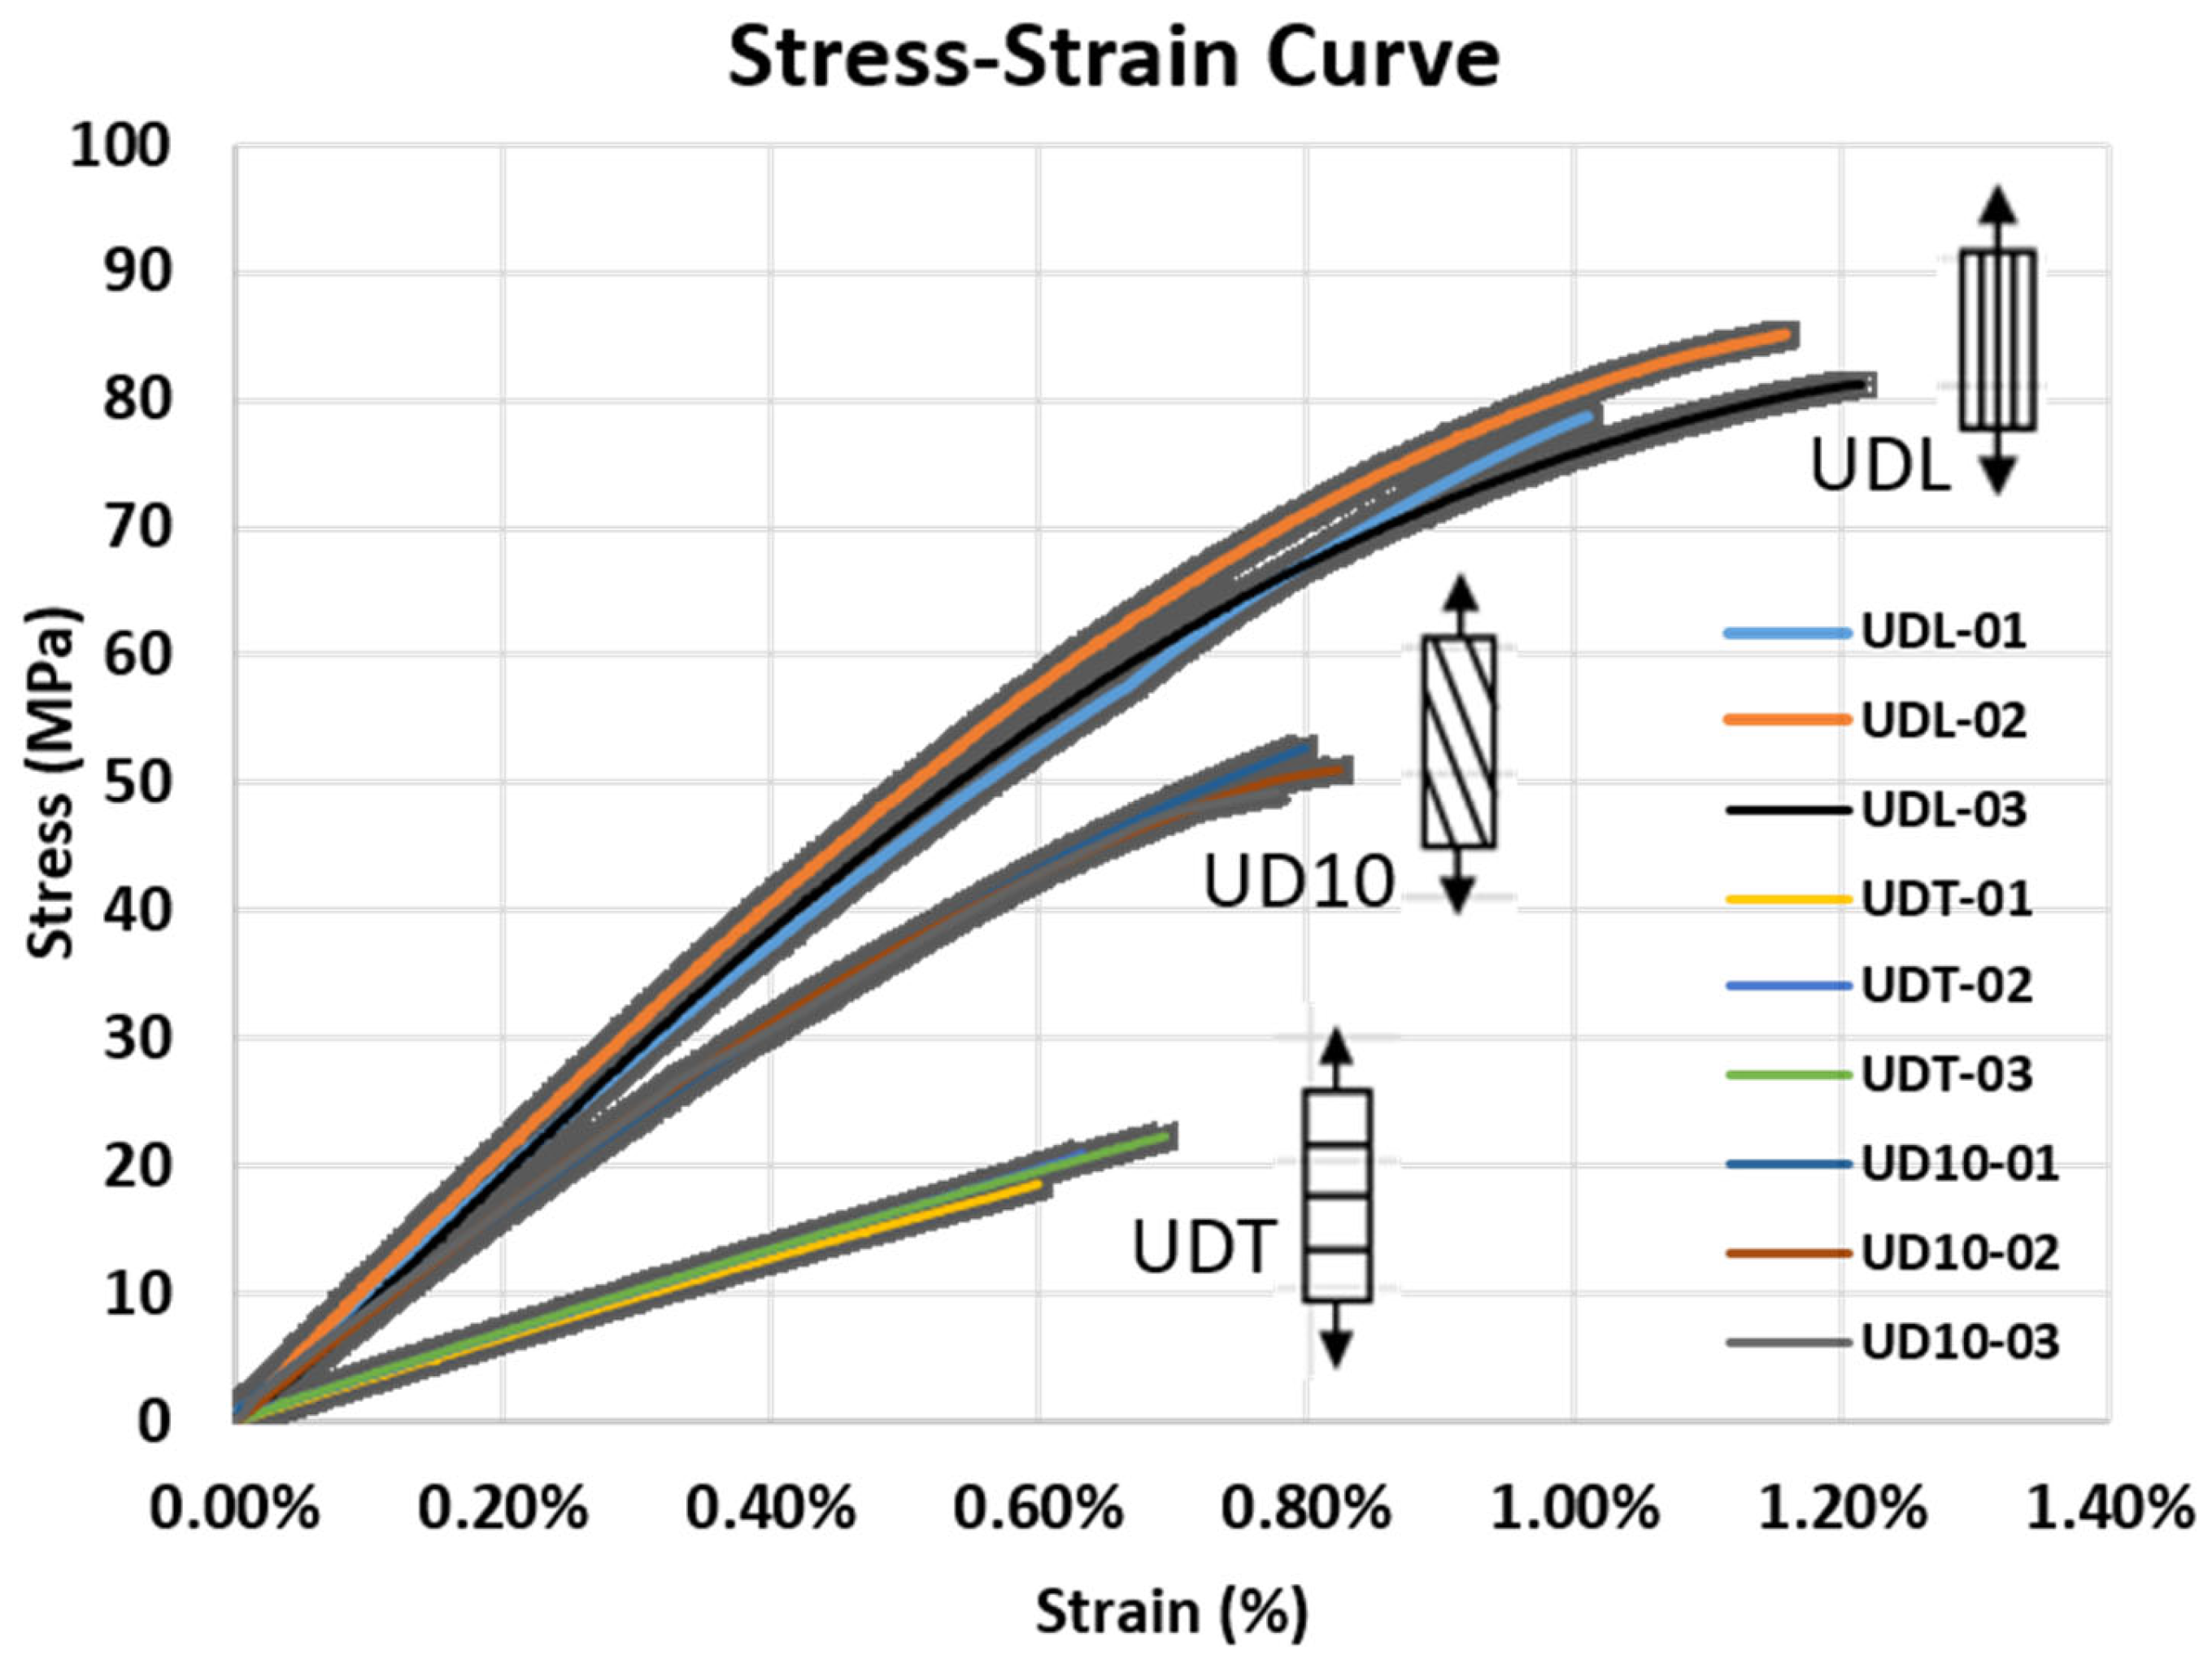
Based on the summary table and stress–strain curve, the ABS/CF20 composite fabricated in this study clearly has the highest strength and stiffness along the fiber direction (UDL), whereas its properties are the weakest when loaded perpendicular to the fibers (UDT). The UD10 specimens fell between these two extremes. This disparity primarily arises from the pronounced anisotropy caused by the orientation of the short carbon fibers within the polymer matrix: when the load is aligned with the fiber distribution (UDL), the high-strength and high-modulus carbon fibers can be fully utilized to increase the load-carrying capacity; conversely, when the load is perpendicular to the fibers (UDT), the fibers cannot effectively support the tensile load, resulting in a significant reduction in the overall mechanical performance. Because the UD10 orientation is only 10° from the principal fiber direction, fiber reinforcement is more effectively used than in the UDT case, thus exhibiting strength and stiffness higher than those for UDT but lower than those for UDL.
From
Table 1, the elastic moduli (E
x = 9.80 GPa, E
y = 3.23 GPa) and strengths (X = 81.1 MPa, Y = 20.2 MPa, S = 10.9 MPa) further quantify the degree of anisotropy: the elastic modulus in the principal fiber direction is approximately three times greater than that in the perpendicular direction, whereas the strength is nearly four times greater. Moreover, the shear modulus (G
xy = 1.17 GPa) and Poisson’s ratio (ν
xy = 0.32) were consistent with values typical of short carbon fiber-reinforced polymers, indicating a relatively uniform fiber dispersion and bonding within the matrix. Notably, the standard deviations for these parameters are low, reflecting the robust reproducibility and stability of the fabrication and test procedures. Similarly, the stress–strain curves in
Figure 4 corroborate the influence of fiber orientation on the deformation behavior of the material: UDL specimens exhibit a higher initial stiffness slope and fail at a higher stress level, whereas UDT specimens reach fail at lower stress since the fibers cannot effectively carry a longitudinal tensile load. The UD10 specimens lie between these two extremes, demonstrating a progressive decline in strength and stiffness with increasing fiber misalignment, yet still retaining a degree of reinforcement. This gradual variation in the mechanical properties is especially significant for actual structural design, in which multiaxial or bending loads cause fibers at various angles to collectively bear the load.
Due to the nature of fused deposition modeling (FDM), variability in the mechanical testing results is expected and should be interpreted considering process-induced uncertainties. Several sources may have contributed to this variability. These include local fluctuations in the filament feed rate, nozzle temperature inconsistencies, variations in layer bonding quality, and minor deviations in the raster path owing to machine resolution or slicing artifacts. In particular, off-axis specimens (e.g., UD10) are more susceptible to such inconsistencies because shear-dominated deformation is more sensitive to weak interlayer adhesion and local-print heterogeneities. To mitigate these effects, all specimens were fabricated using tightly controlled printing settings, and the tensile data were averaged across at least three repetitions per orientation.
Overall, the experimental results clearly illustrate that fiber orientation plays a critical role in determining the final mechanical performance of short fiber-reinforced composites. By integrating the data from the UDL, UDT, and UD10 specimens, researchers can obtain a more comprehensive set of material parameters, enabling simulation analyses to more accurately capture the anisotropic characteristics and high-strength advantages offered by fiber reinforcement, which can be better leveraged in both optimization and real-world applications.
4. Application to Mock-Up Ship
In this study, large-scale additive manufacturing (3D printing) technology was employed to comprehensively digitally design and produce a ship hull model measuring approximately 20 m in length. A vessel comprises several principal structural components, including the hull, deck, midsection, bottom, and aft sections.
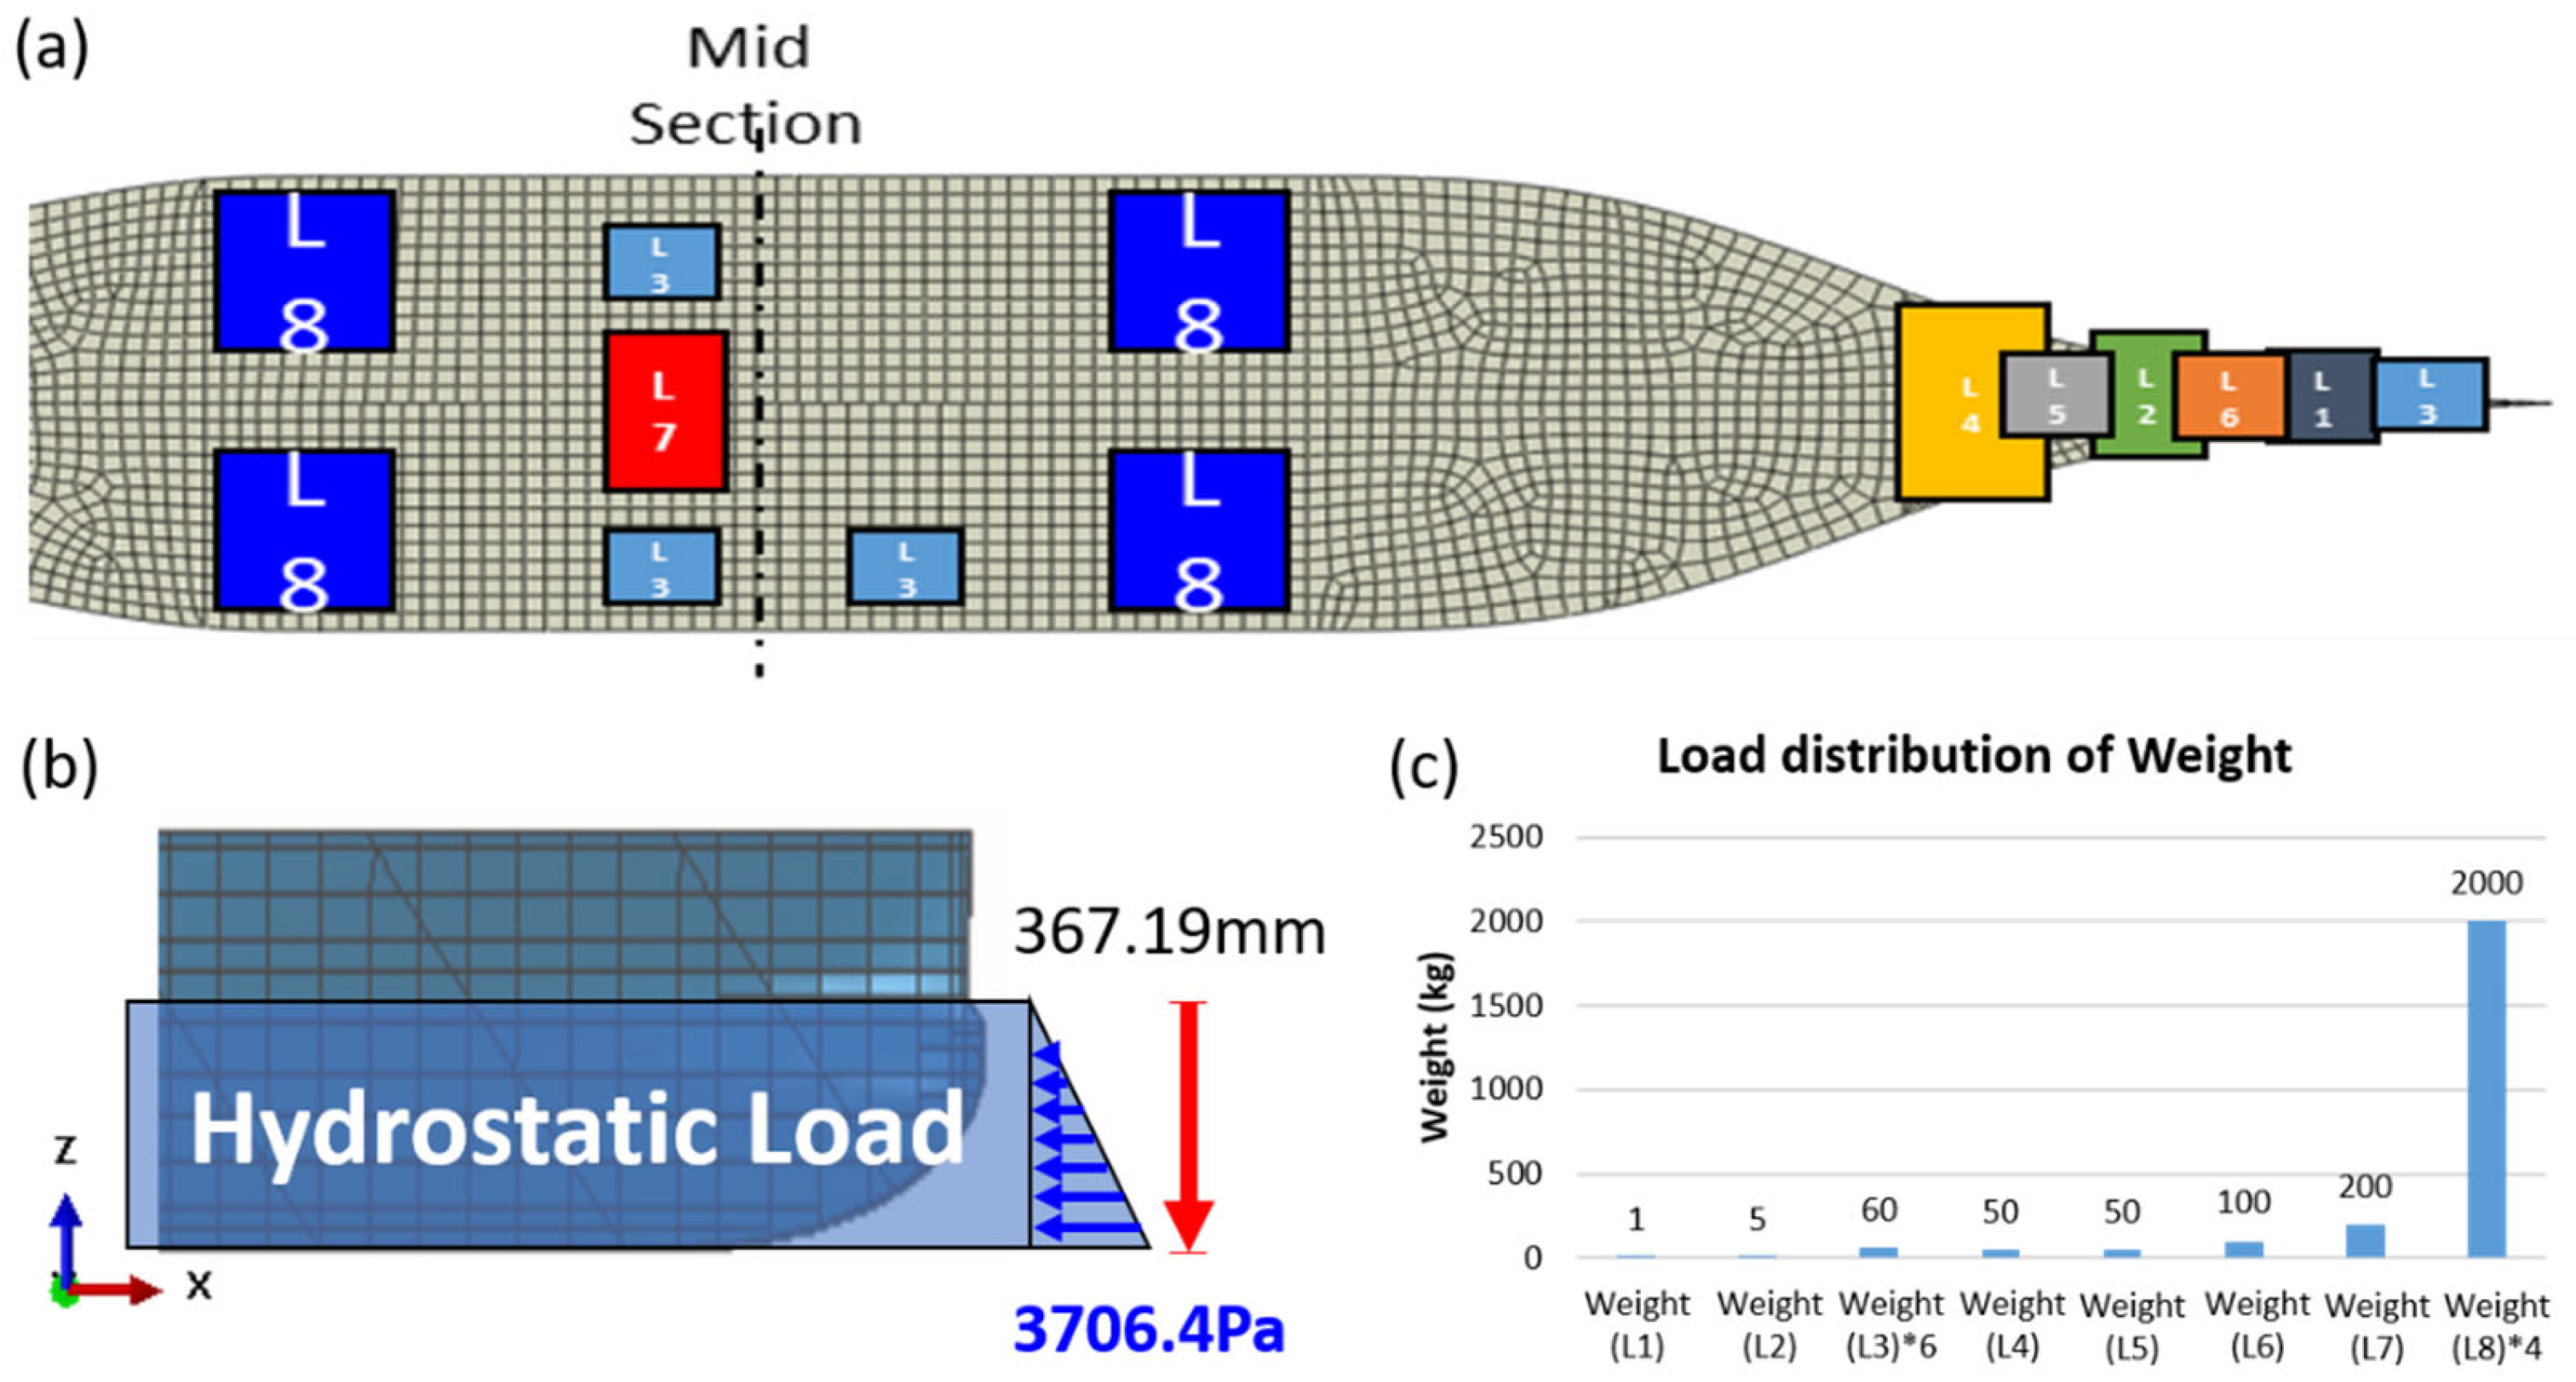
Before the manufacturing process, a numerical simulation was conducted on the ship structures using the finite-element software Abaqus. In the finite element simulation of the 3D-printed ship structure, appropriate boundary and loading conditions were defined to replicate a realistic service environment. The load distribution applied is illustrated in
Figure 8. Concentrated and distributed weights were assigned to different regions of the ship model (L1–L8) to reflect the actual mass distribution observed during the experimental setup. Additionally, hydrostatic pressure was simulated as a vertical load of 3706.4 Pa at a depth of 367.19 mm to mimic the buoyancy during floating. This configuration replicates the combined effects of gravity, ballasts, and hydrostatic support under real conditions. The left end of the structure was constrained in the vertical (UY) and out-of-plane (UZ) directions (UY = UZ = 0), while the right end was fully fixed, restricting the displacements in all three directions (UX = UY = UZ = 0). The applied loads consisted of gravity (9.86 m s
−2 acting downward), a maximum hydrostatic pressure of 0.037 MPa applied to the bottom surface, and eight concentrated loads distributed along the deck to simulate the operational conditions. Material properties were assigned based on the experimentally characterized mechanical behavior of the printed short-fiber-reinforced thermoplastic composites, as summarized in
Table 1, to accurately capture their anisotropic mechanical behavior. Additionally, to correctly represent the fiber orientation within the simulation, a projection method was employed to map the local fiber directions based on the actual printing paths.
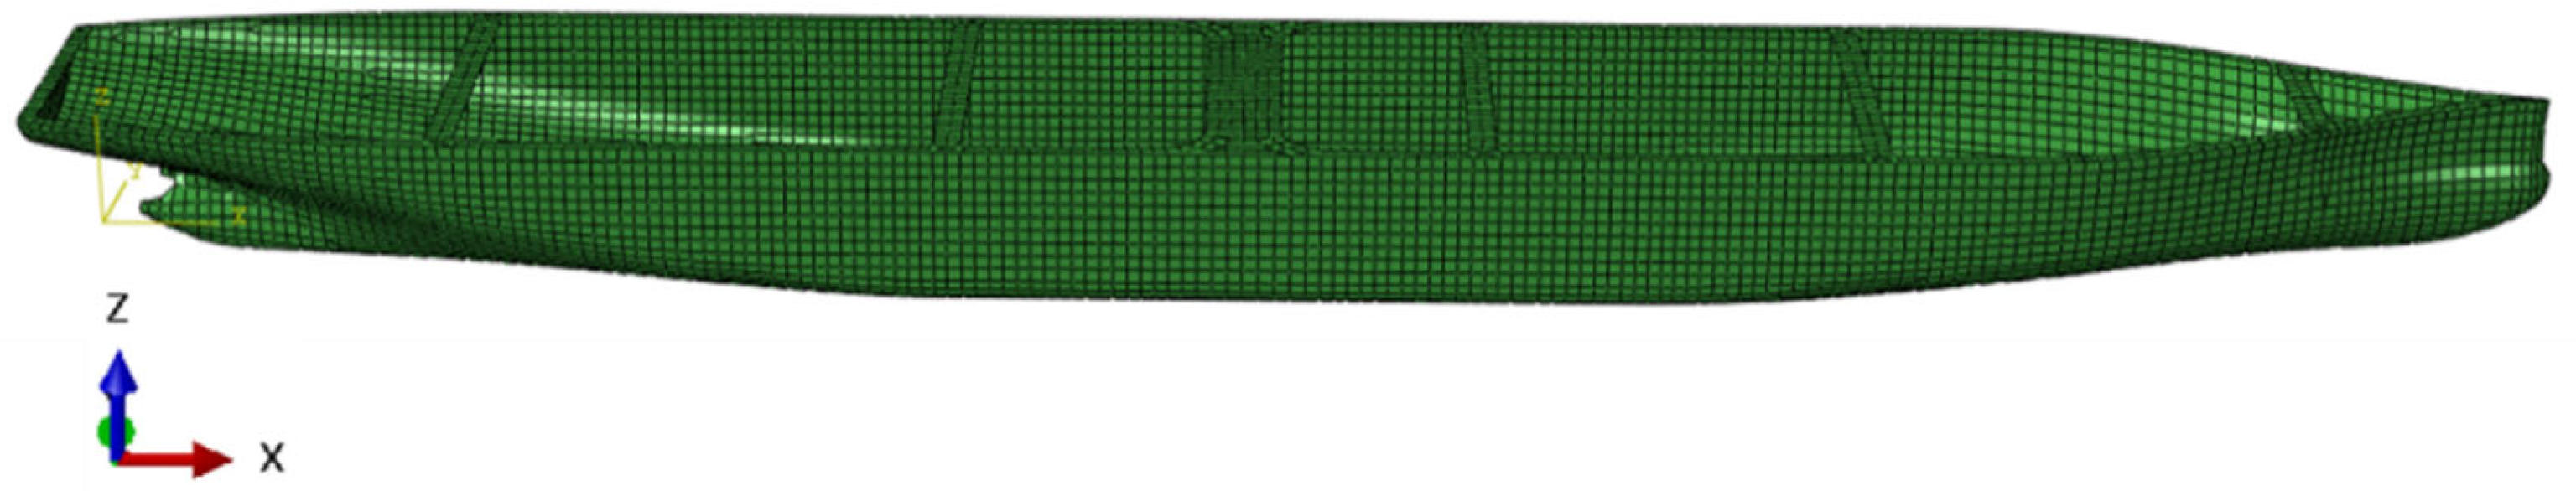
First, we compared the simulation results using isotropic and anisotropic material properties to evaluate how different simulation approaches affect the structural response. As shown in
Figure 9, the entire hull structure was meshed with 10,044 shell elements. Among them, 9989 were 4-node linear quadrilateral elements (S4R), and 146 were 3-node linear triangular elements (S3R). This mesh configuration provided a good balance between capturing the geometric features and maintaining computational efficiency. To accurately represent the anisotropic material behavior resulting from the printing process, a local coordinate system (CSYS) was defined for each surface region of the model. The actual printing direction was used to determine the material orientation of each element by projecting it onto the inclined surface. These directions were implemented in Abaqus using element-wise orientation assignments. A visual summary of the boundary conditions, printing strategy, and coordinate system alignment is shown in
Figure 10.
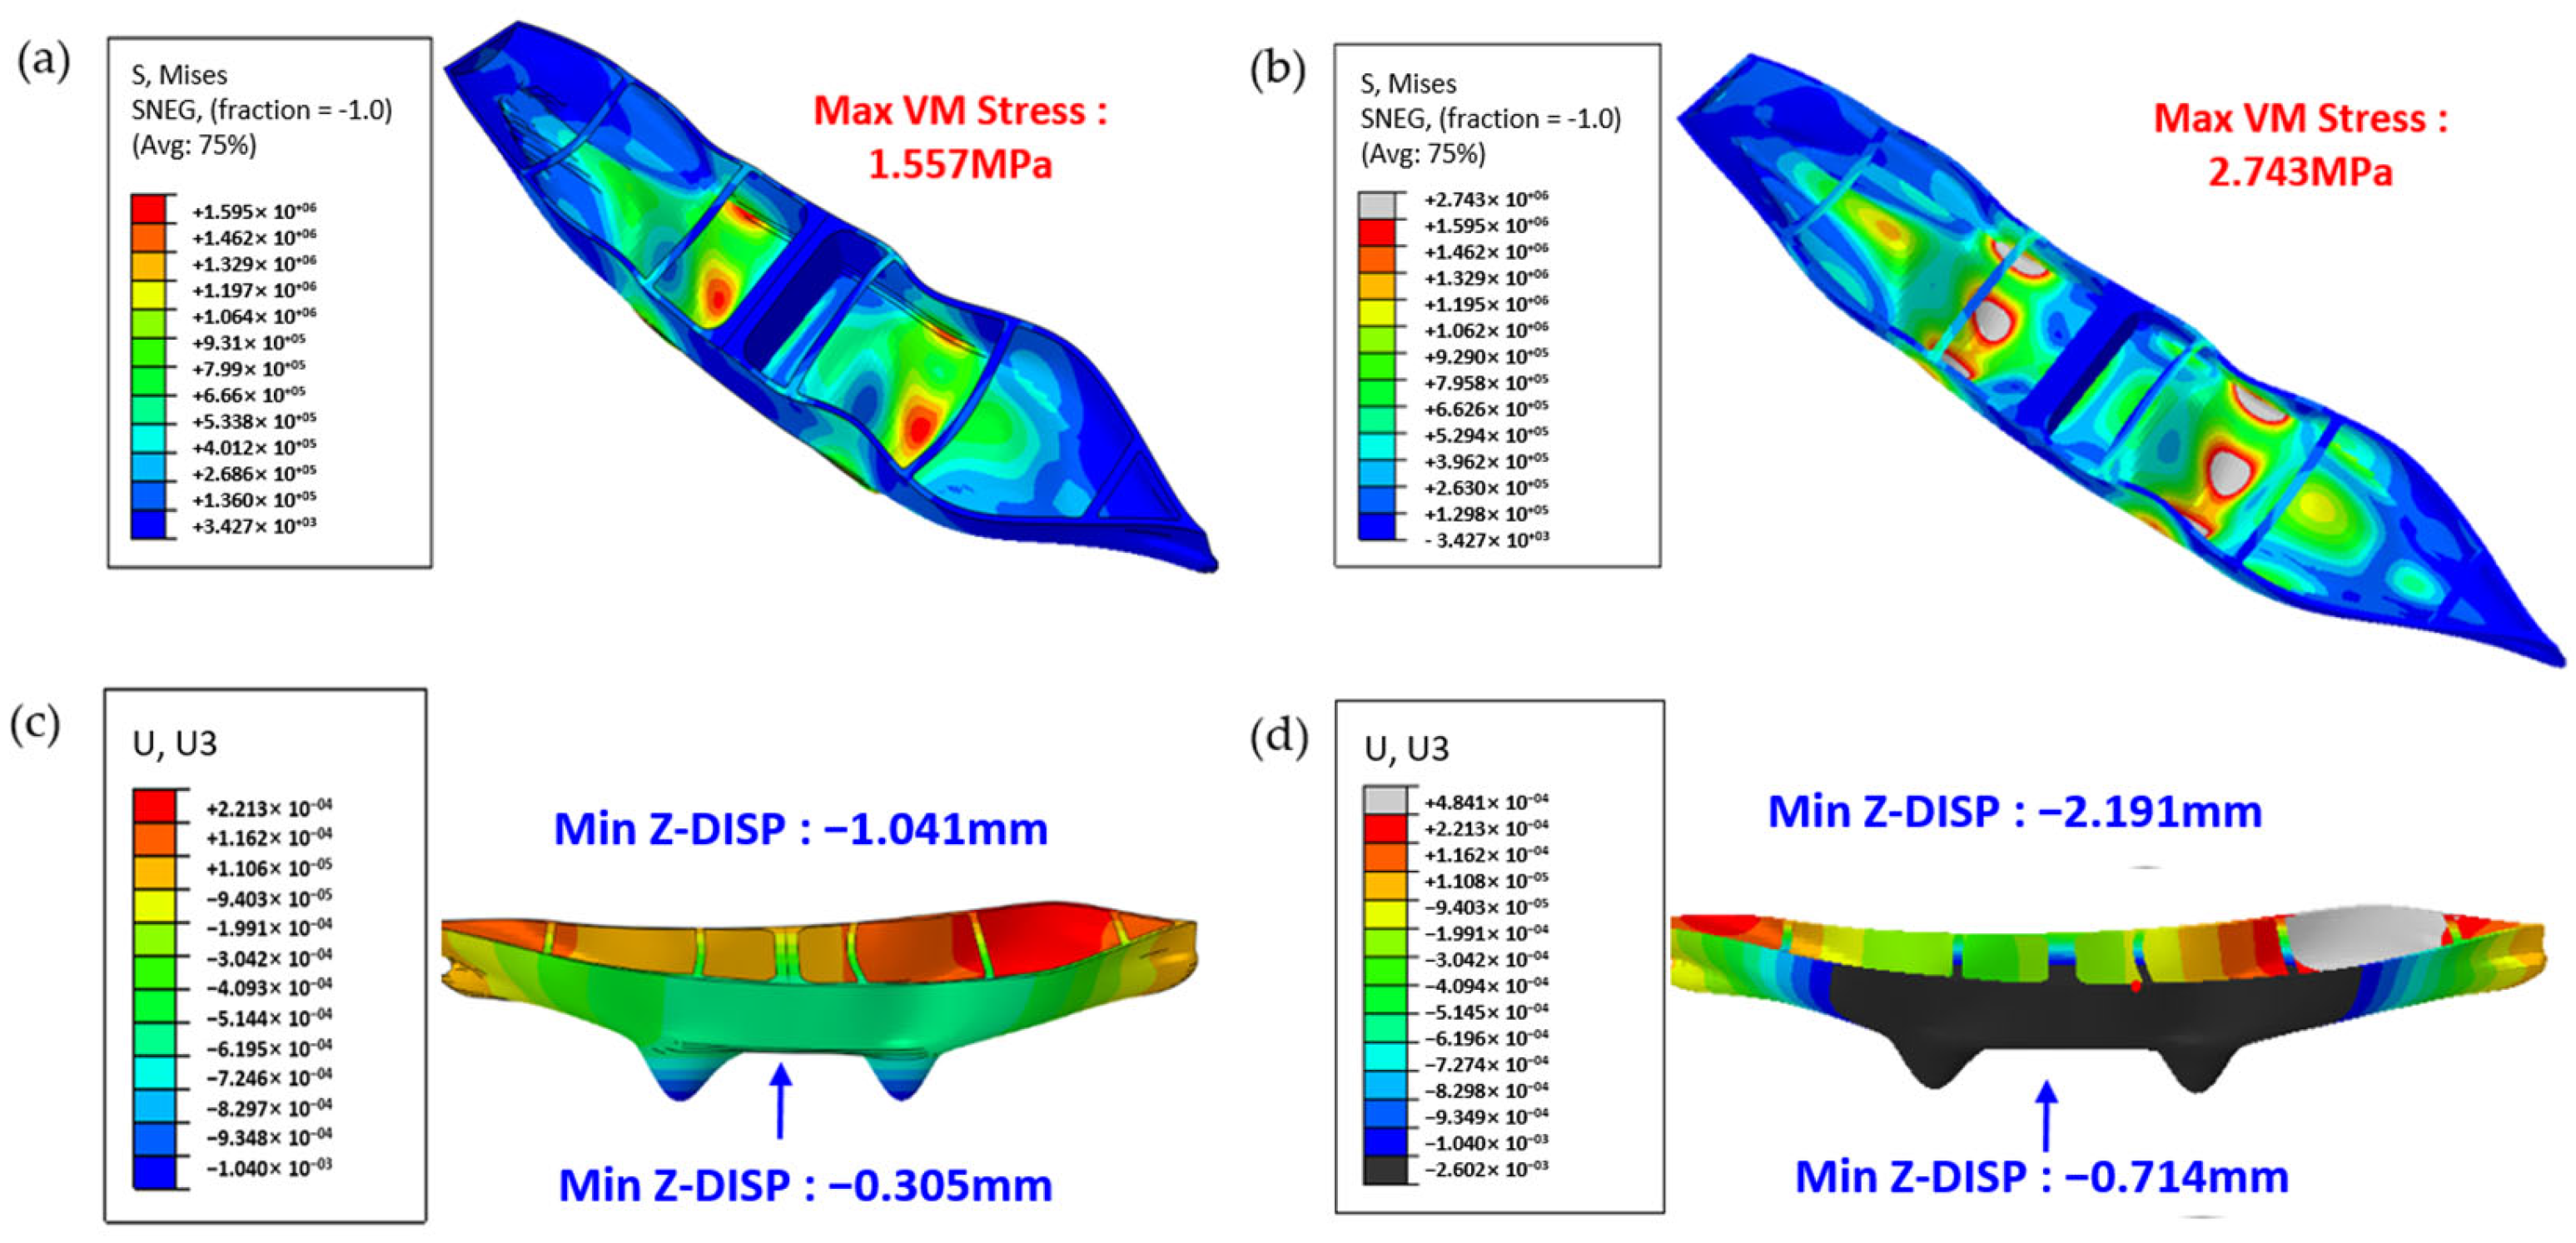
As illustrated in
Figure 11, simplifying the material as isotropic yields a maximum von Mises stress of only 1.56 MPa, whereas adopting an anisotropic model increases this value to 2.46 MPa. In terms of the Z-axis displacement, the isotropic model exhibits a minimum displacement of approximately −1.04 mm and a midpoint displacement of approximately −0.305 mm, whereas the anisotropic model yields a minimum displacement of −2.19 mm and a mid-point displacement of −0.714 mm. These findings underscore that neglecting the intrinsic anisotropy of composite materials can result in a significant underestimation of key mechanical indicators, particularly normal stresses and interlayer deformations. Only by thoroughly accounting for interlayer bonding, fiber orientation, and other anisotropic factors at the simulation stage can the mechanical behavior of a structure under real operating conditions be accurately captured, thereby providing a reliable foundation for subsequent ship structure design and safety assessments. This further indicates the considerable potential of the projection method for practical engineering simulation applications.
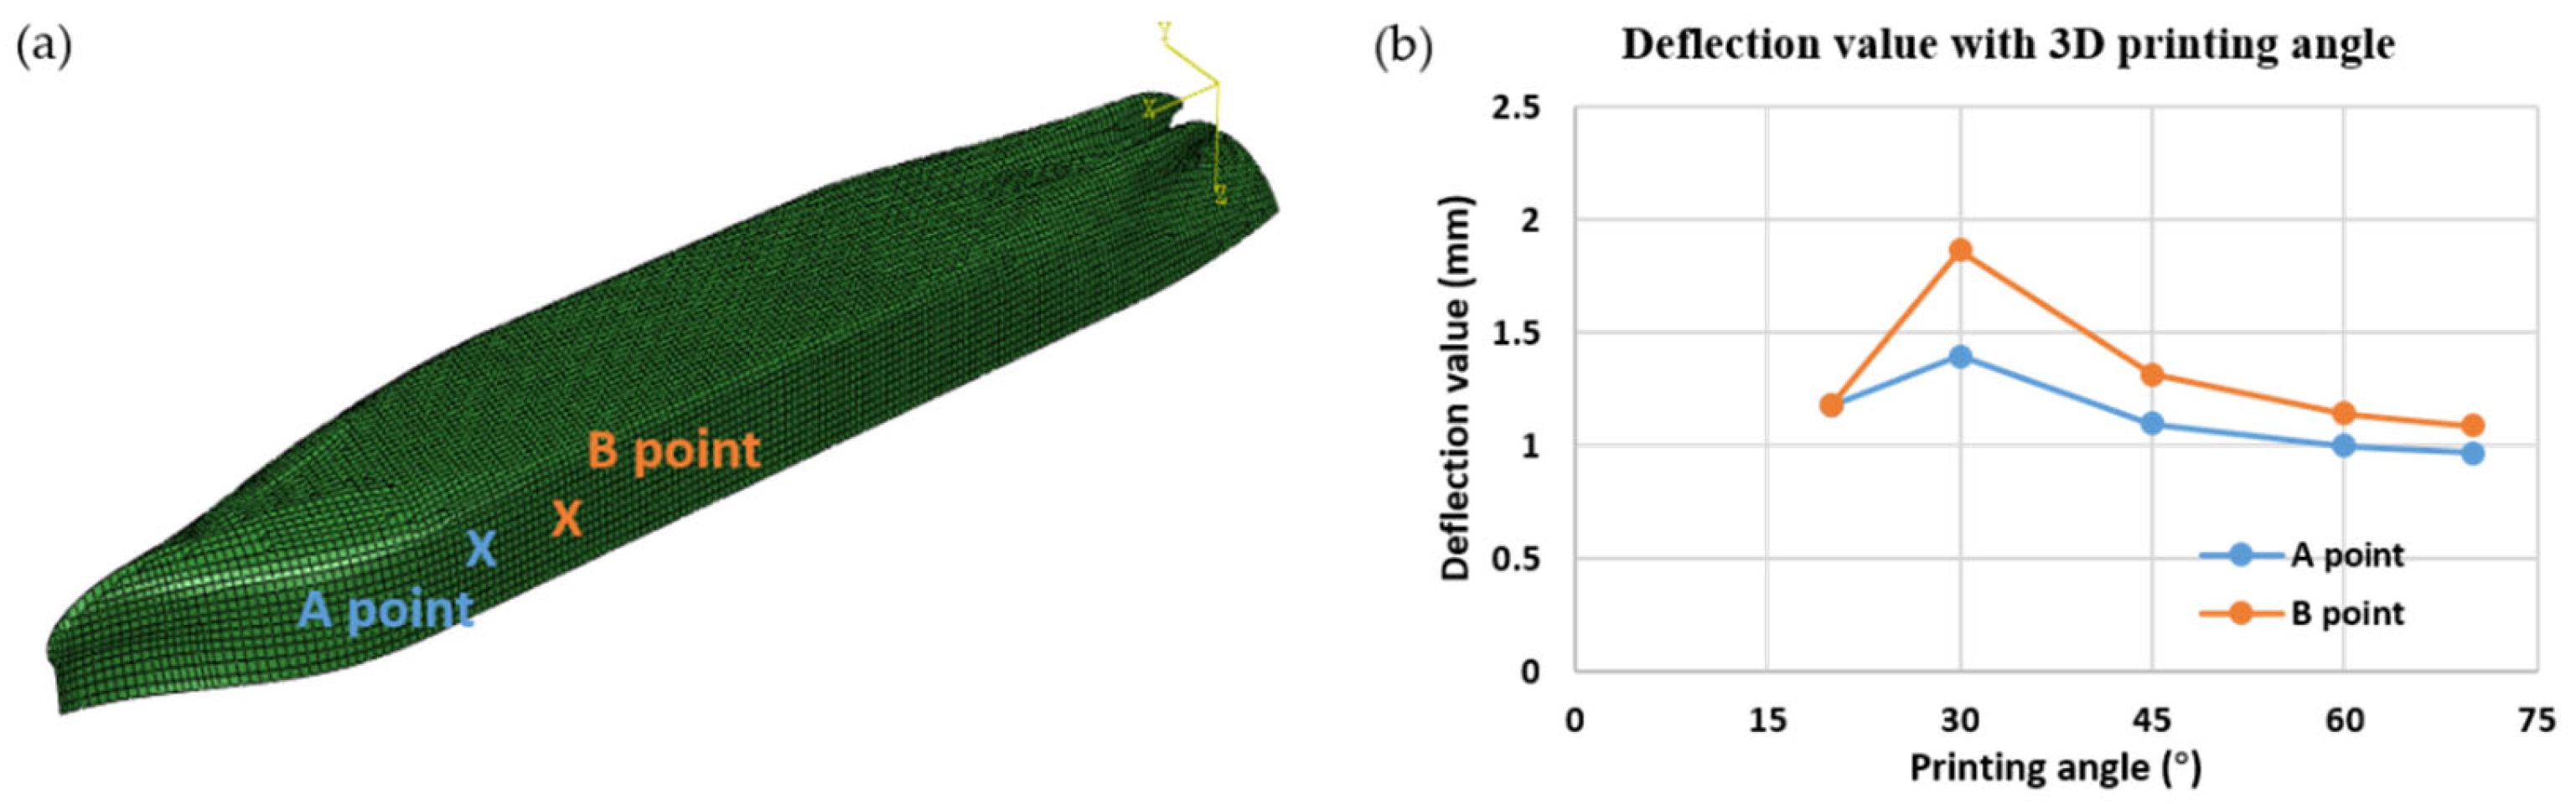
In the numerical analyses designed to examine the influence of printing orientation on hull deflection, we considered angles of 0°, 20°, 30°, 40°, 50°, 60°, and 70°. As shown in
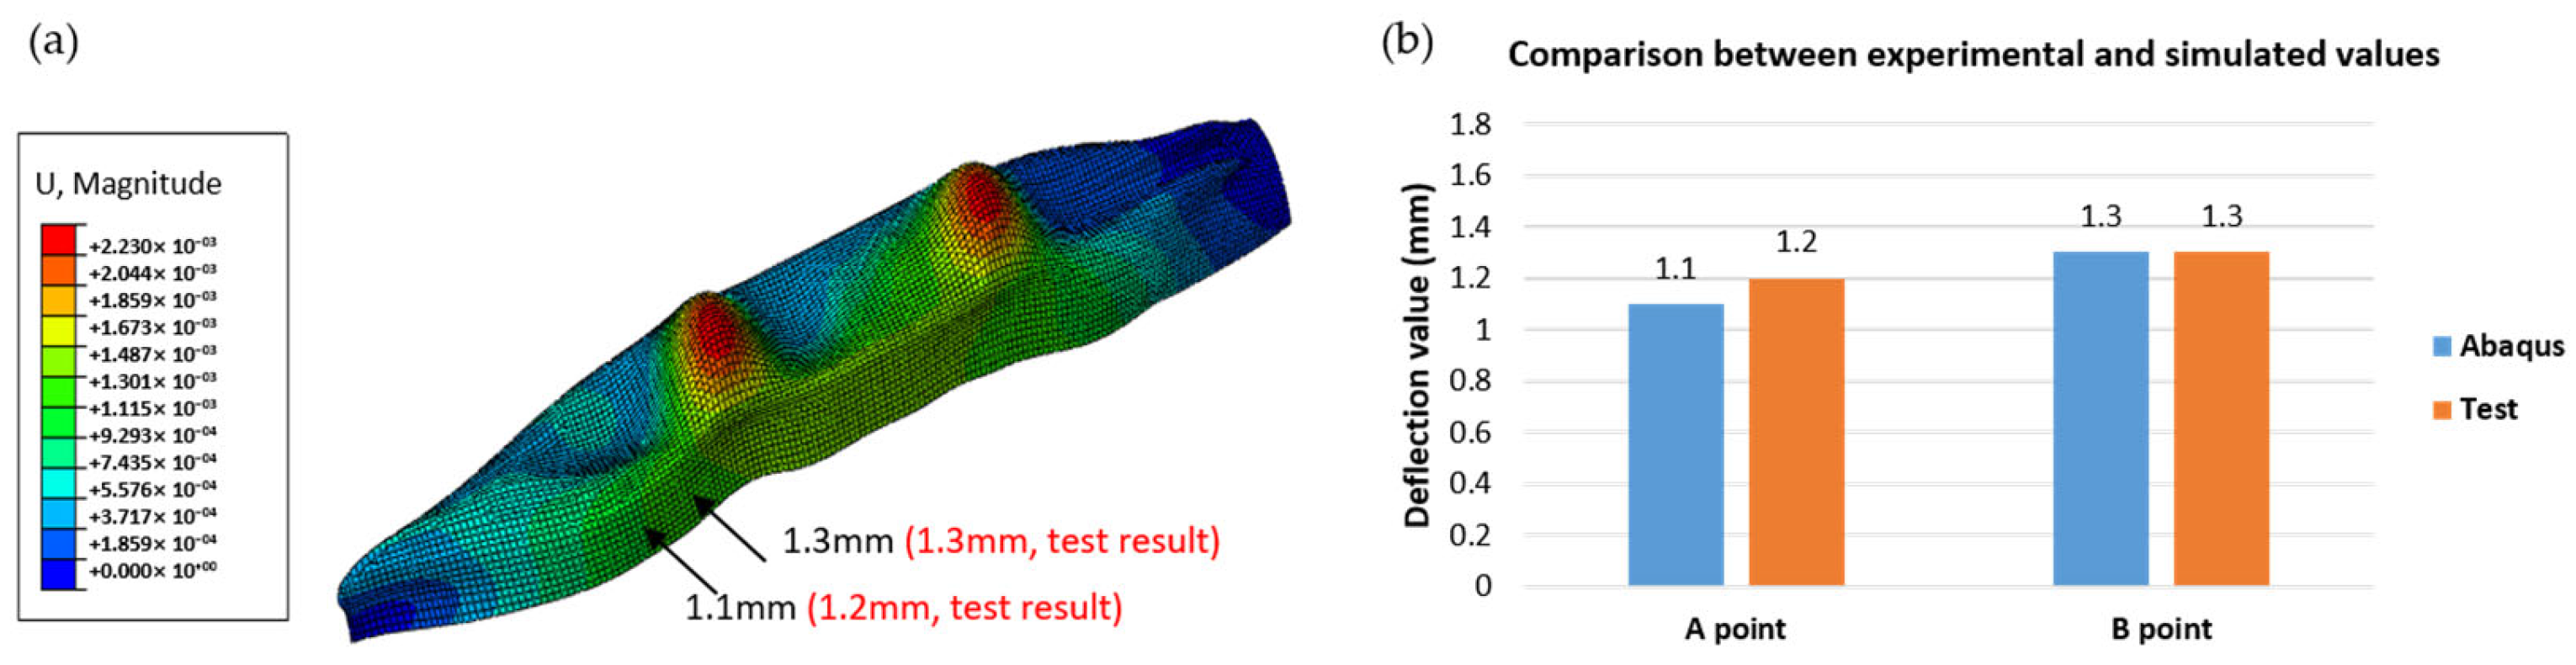
Figure 12, the results reveal a marked variation in the deflection values at points A and B in response to changes in the printing angle, indicating that the material deposition direction and interlayer bonding characteristics substantially affect the hull stiffness and overall stability. In the experimental phase of this study, a large-scale 3D-printed ship fabricated with a 45° printing angle will be floated in a water tank and subjected to a prescribed internal ballast load; the resulting deflections at monitoring points A and B will be recorded and rigorously benchmarked against the corresponding finite-element predictions.
In this study, a ship fabricated at a 45° printing angle was selected as the subject of investigation. This angle was chosen as a representative case that introduces a balanced combination of tensile and shear stress components in the printed structure. In composite material testing, a 45° fiber orientation is widely used to activate off-axis deformation modes and evaluate anisotropic behavior, particularly shear-dominated responses. Therefore, a 45° angle provides a mechanically meaningful scenario for validating the proposed method under nontrivial stress conditions. In addition, the 45° inclination allows continuous material deposition without requiring support structures and is compatible with the robotic printing configuration. While other angles, such as 30° or 60°, are also feasible, the 45° case offers a good compromise between mechanical sensitivity and manufacturing practicality, making it a suitable choice for validation. As shown in
Figure 13, the ship was fabricated using deposition-based additive manufacturing, printing it upside down on a 45° inclined surface. During the manufacturing process, a high-capacity extruder capable of depositing material at approximately 150 lb h
−1 was utilized, coupled with a nozzle diameter of 10 mm; each layer featured a width of approximately 18.8 mm and a thickness of 3 mm, with a printing orientation set at 45°. Upon completion of the printing phase, subsequent post-processing steps, such as surface polishing, coating, and targeted reinforcement, were performed to ensure overall structural integrity and enhanced mechanical properties. Compared with conventional shipbuilding techniques, this large-scale additive manufacturing approach reduces not only the production time but also the reliance on mold fabrication and labor-intensive processes, thereby laying a solid foundation for fabricating larger and more complex marine structures.


