
Tribological Evaluation of Polyether Ether Ketone (PEEK) Nanocomposite Coatings Reinforced with Ceria—Effect of Composition, Load, Speed, Counterface, and UV Exposure


Abstract
1. Introduction
2. Experimental Procedures
2.1. Materials
2.2. Preparation of Nanocomposite Powders
2.3. Substrate Surface Preparation
2.4. Coating Procedure
3. Coatings Characterizations
3.1. Crystallographic Evaluation
3.2. Hardness Evaluation of the Coating
3.3. Evaluation of the Coating Thickness and Dispersion of Ceria in the PEEK Matrix
3.4. Thermogravimetric Analysis
3.5. Ultraviolet (UV) Radiation Tests
3.6. Fourier Transform Infrared (FTIR) Spectroscopy
3.7. Tribological Characterization
3.8. Evaluation of Wear Morphology
4. Results and Discussion
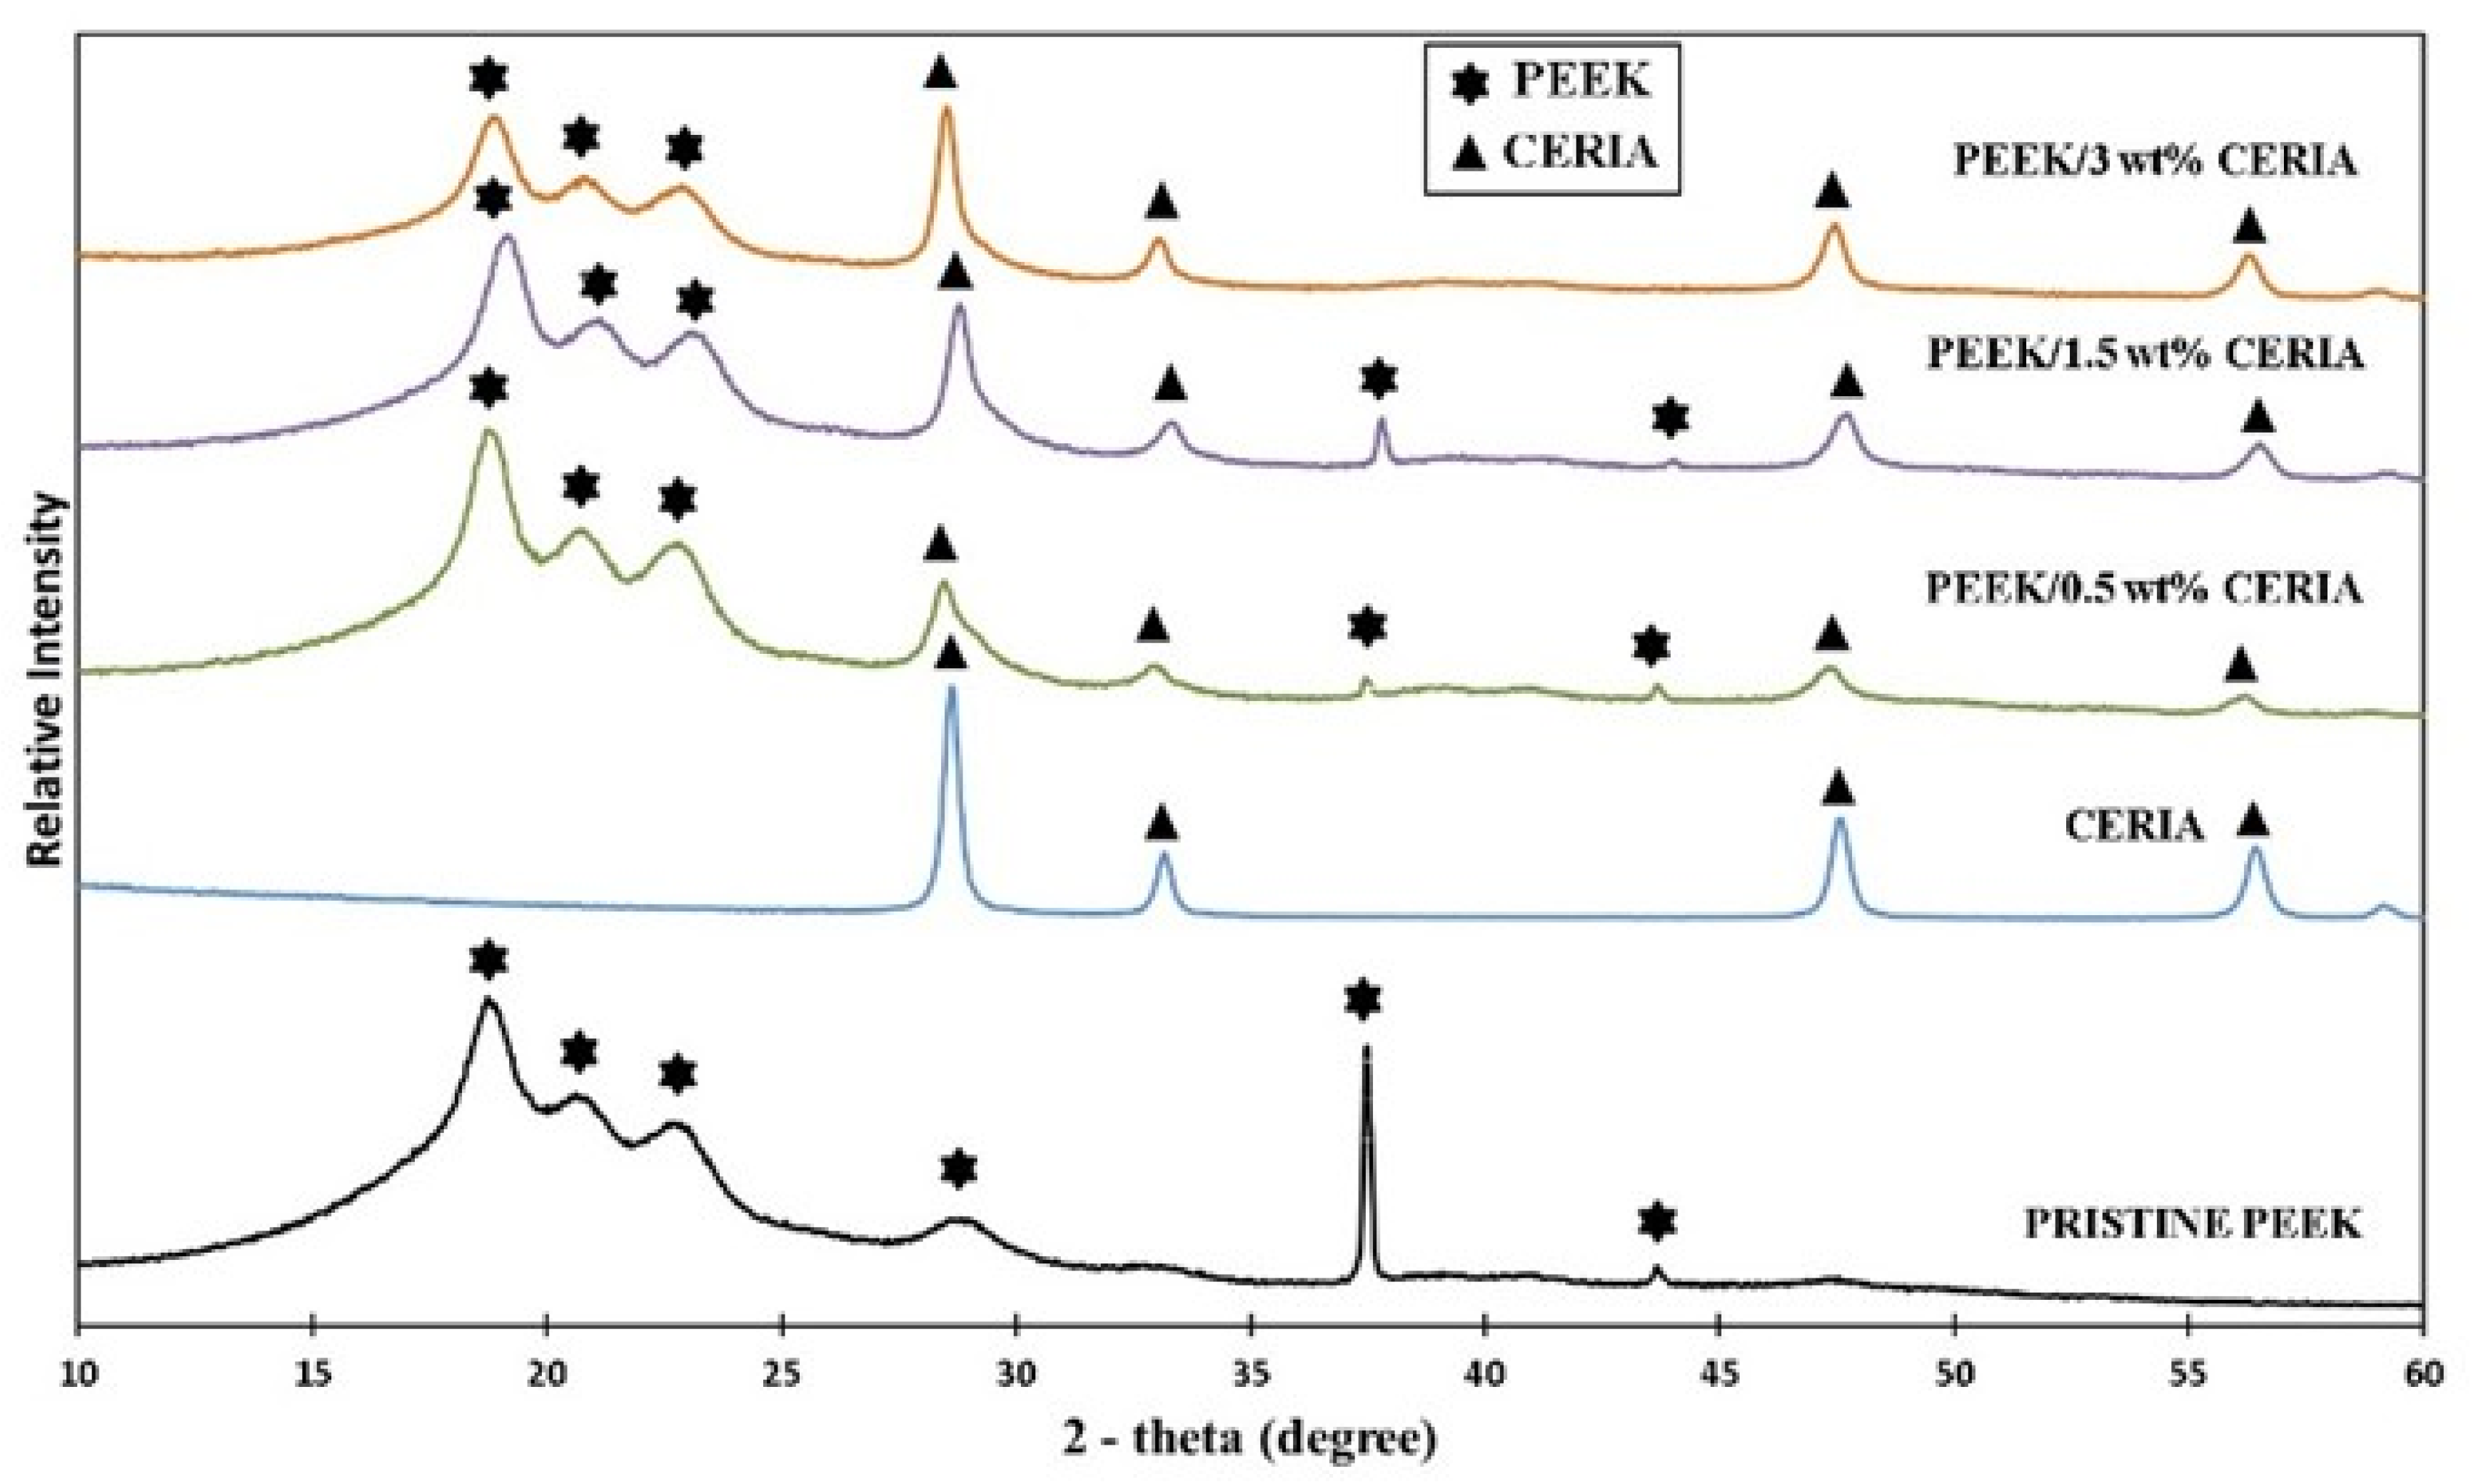
4.1. XRD Analysis of the Composite Powders
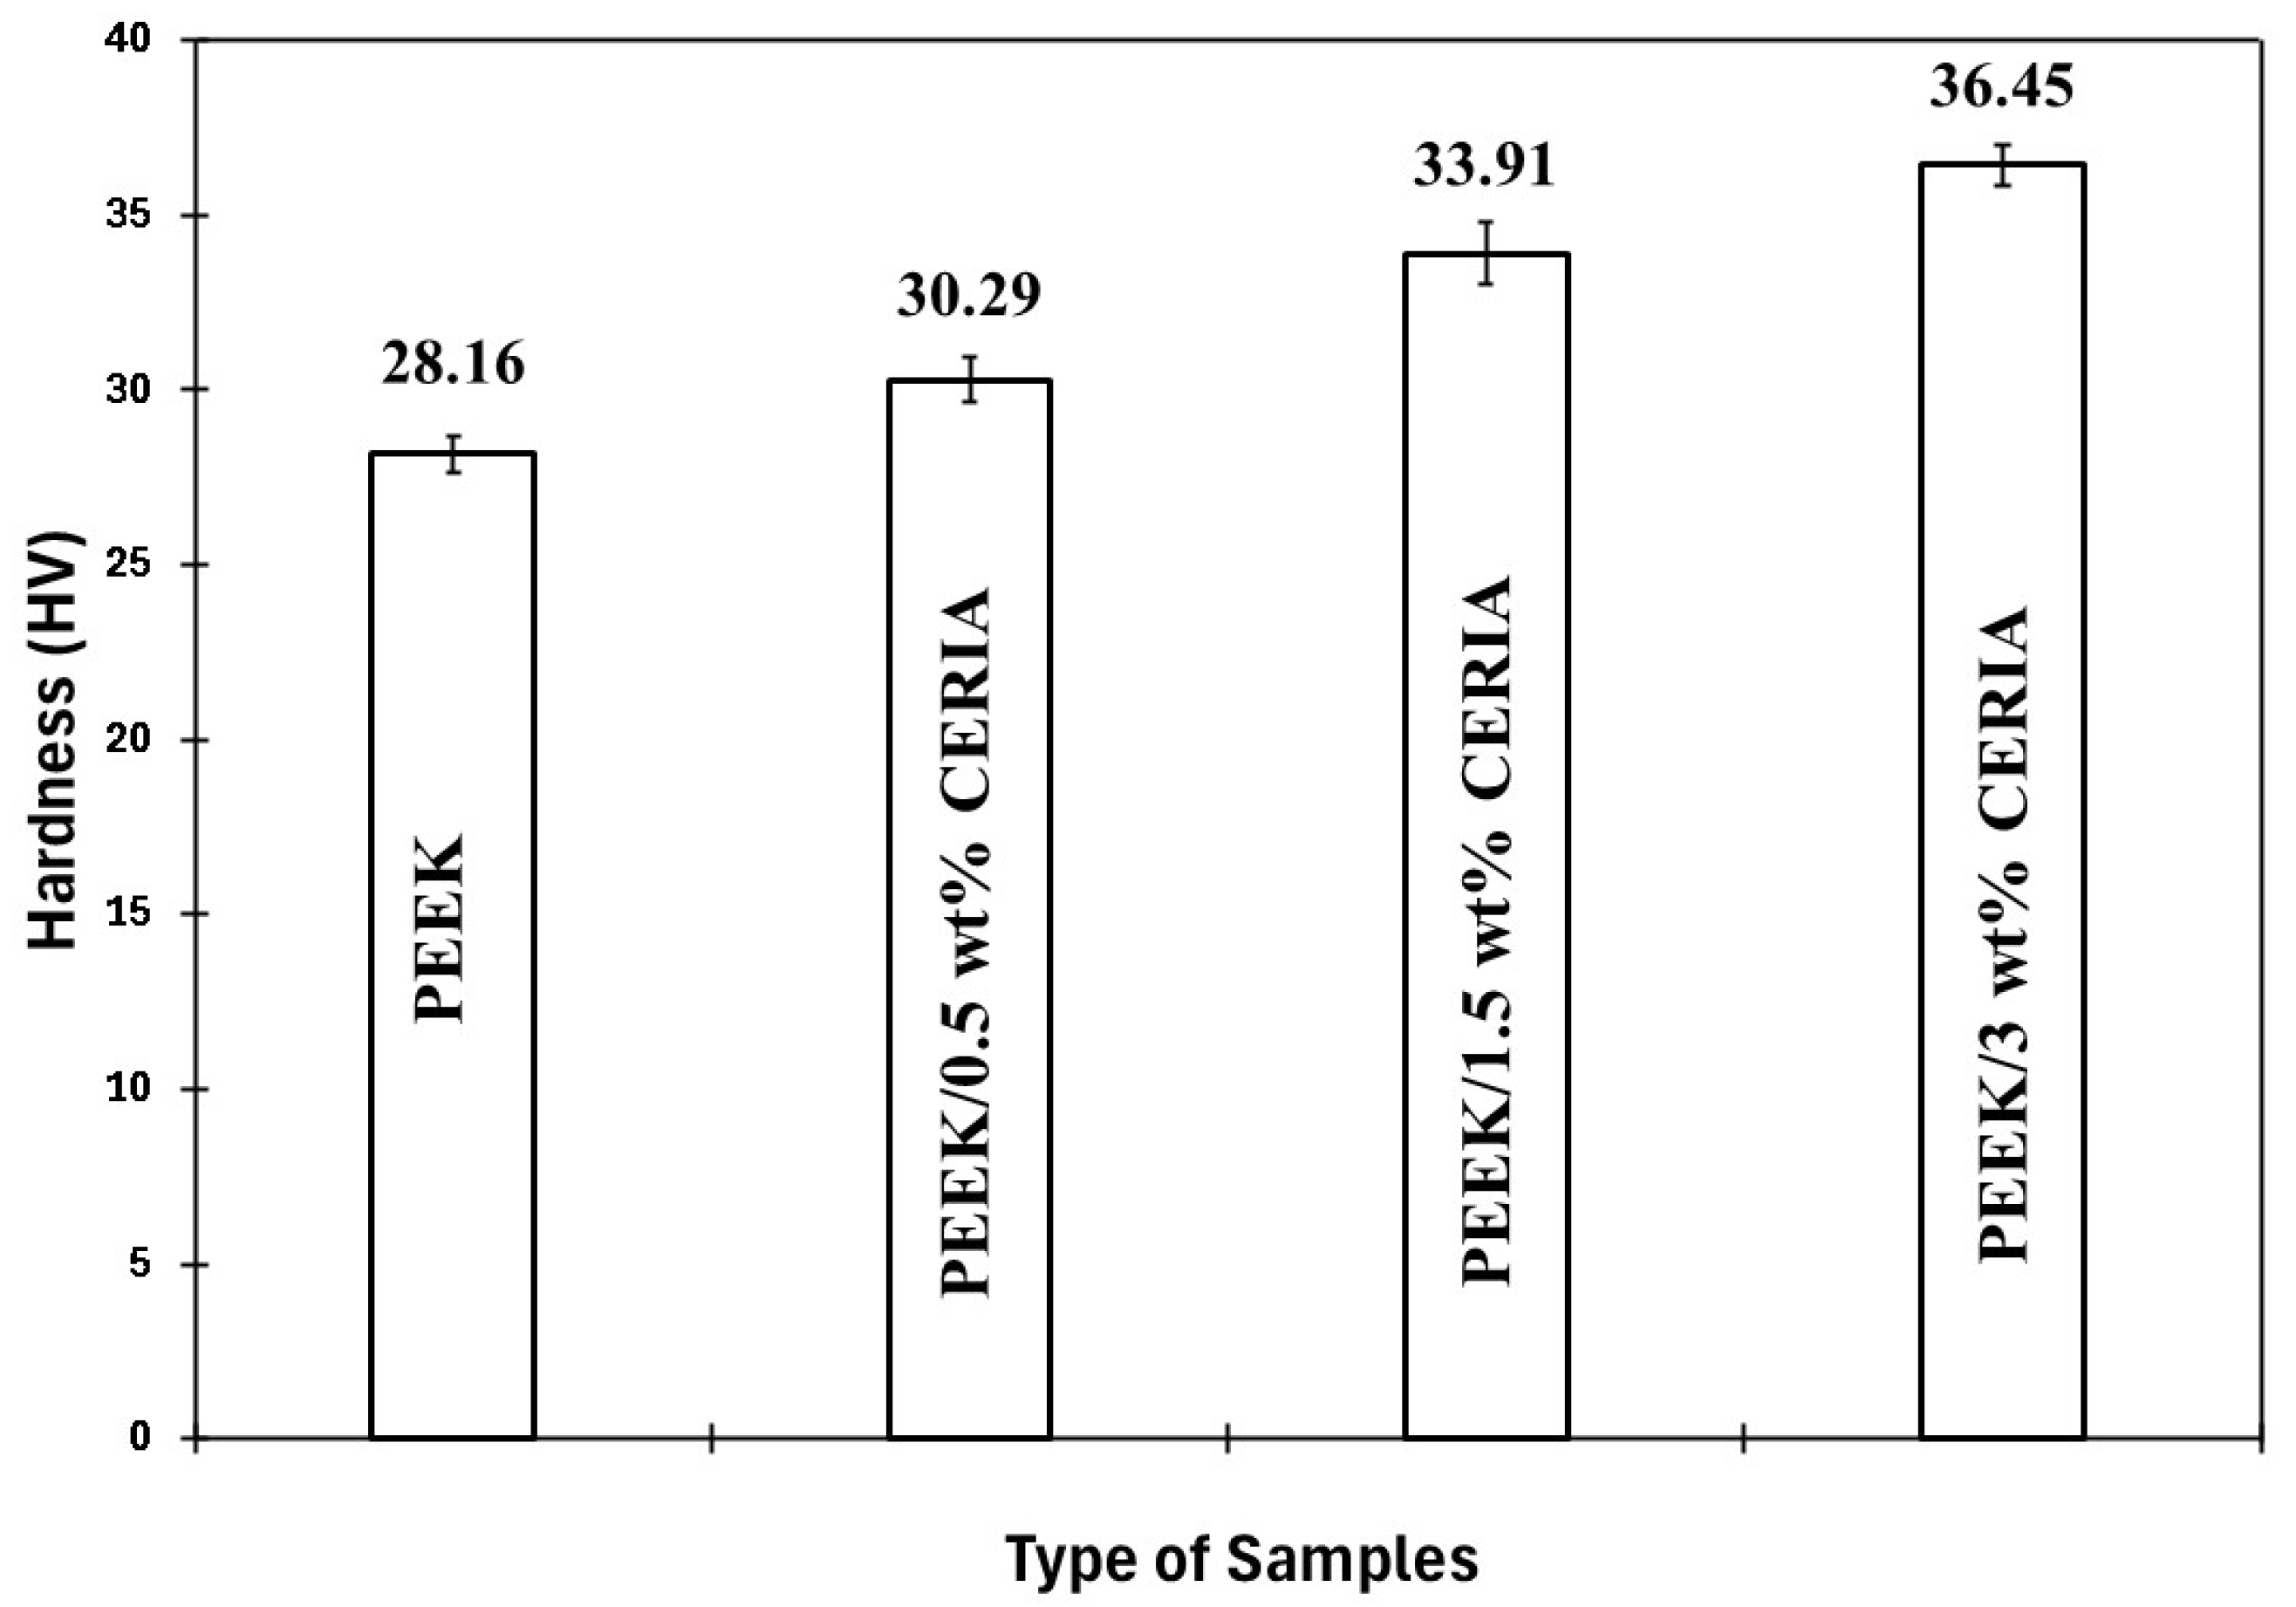
4.2. Analysis of Microhardness
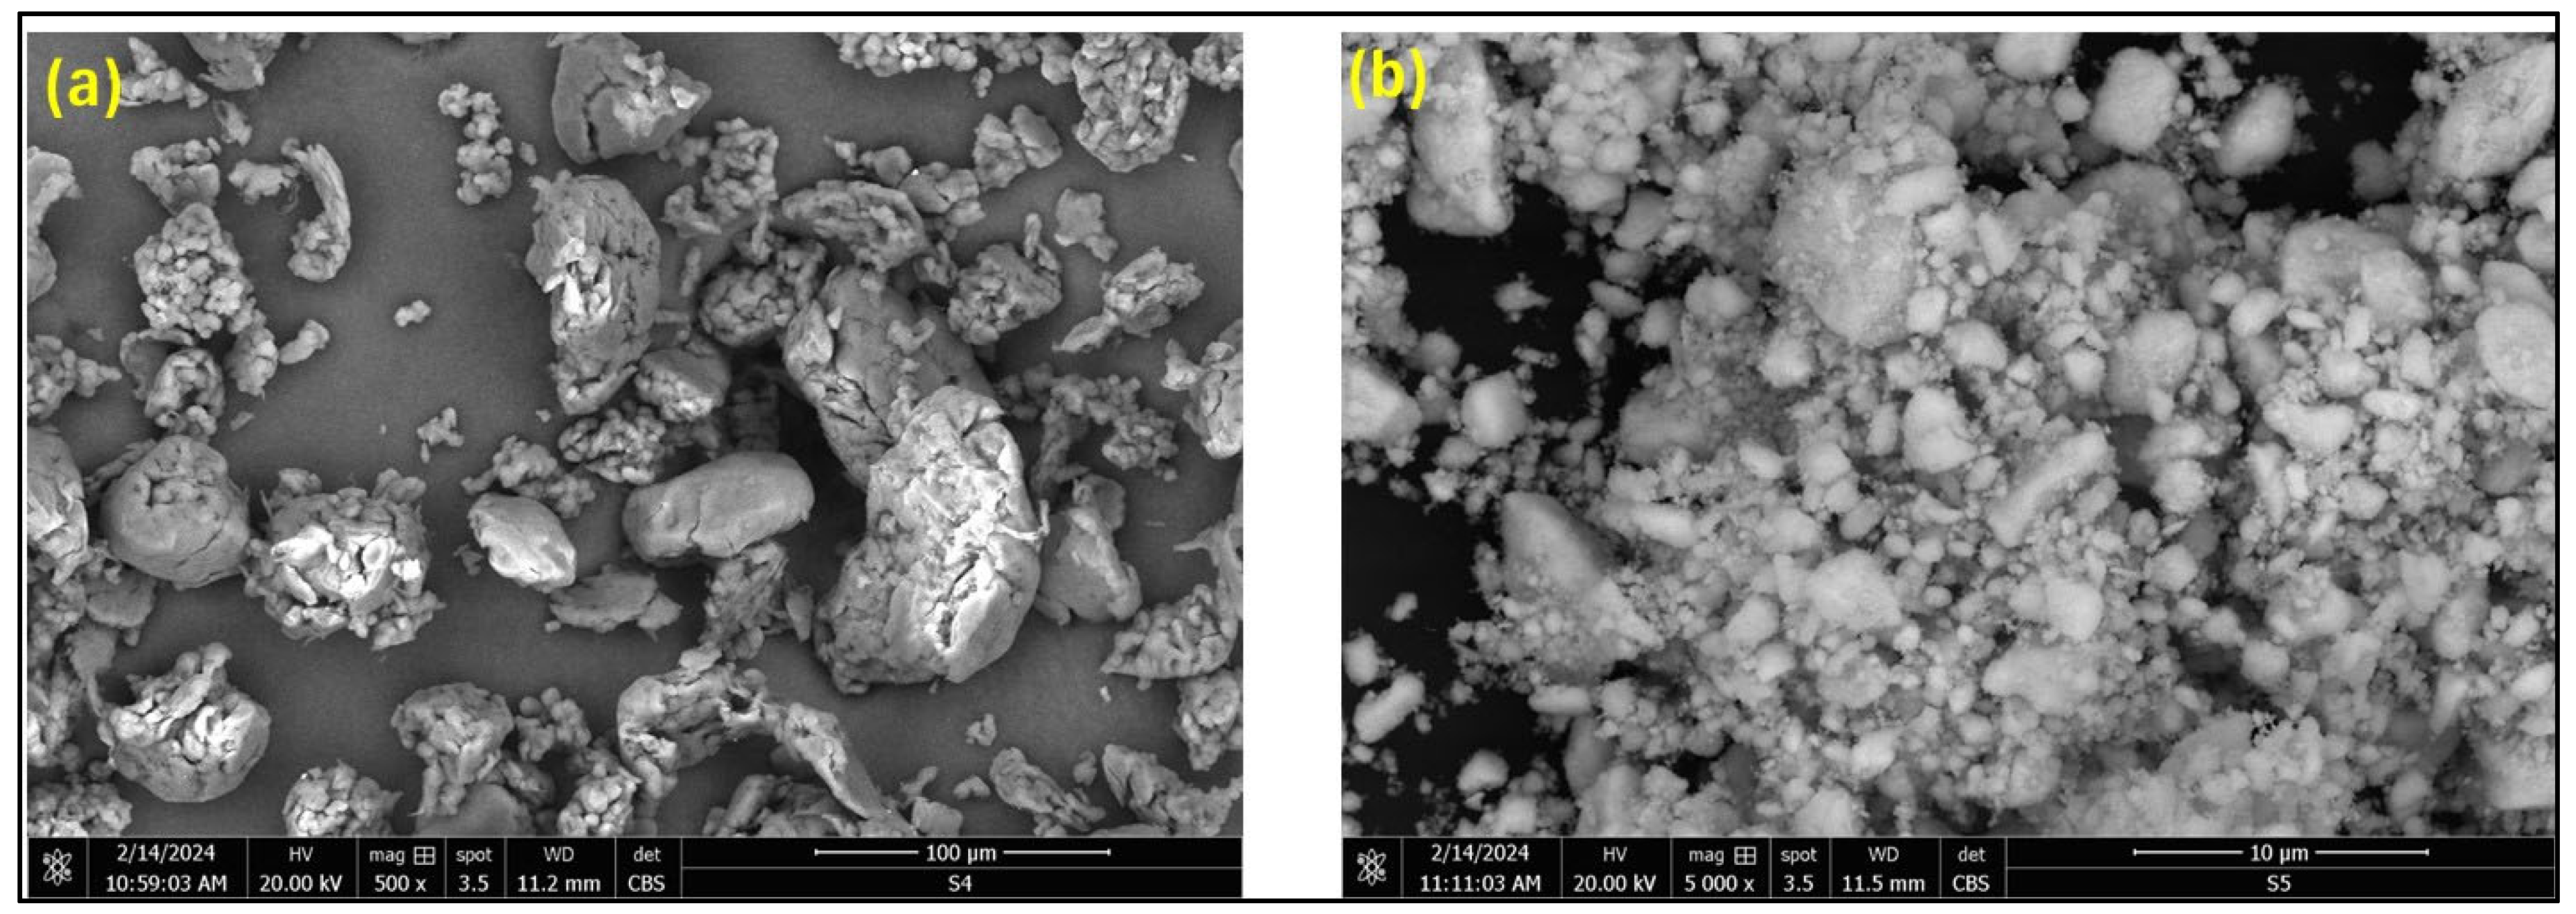
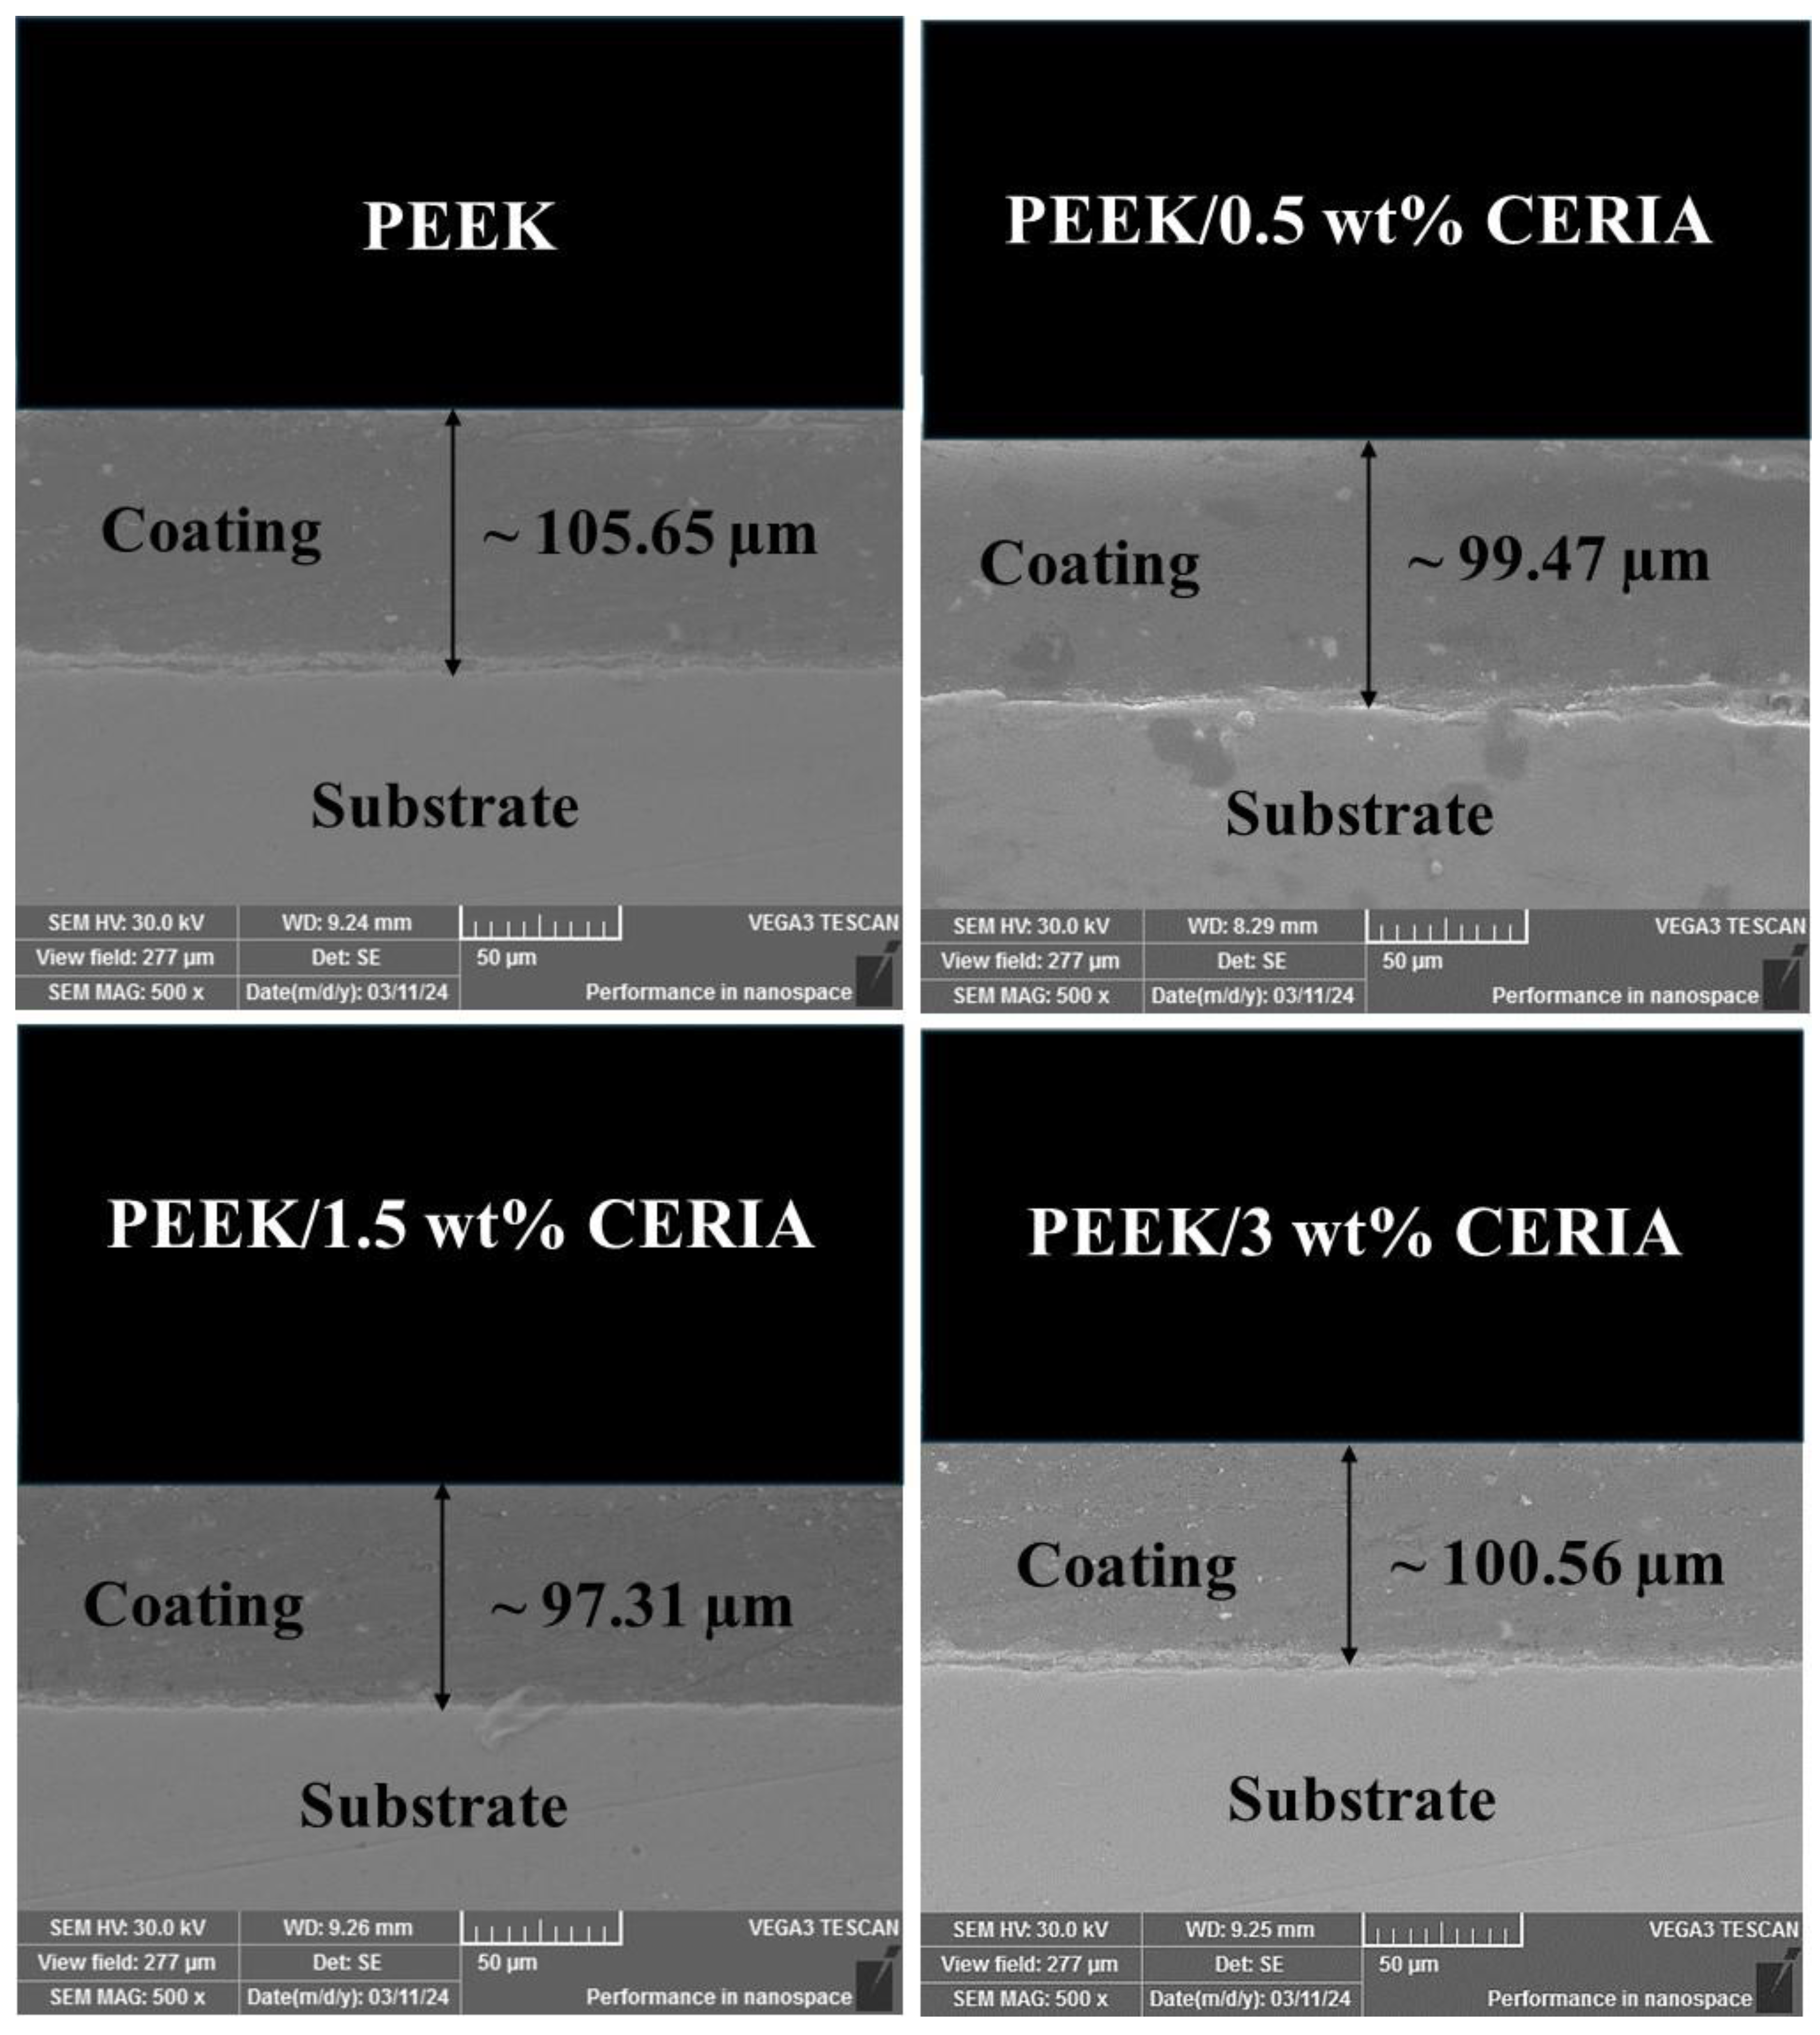
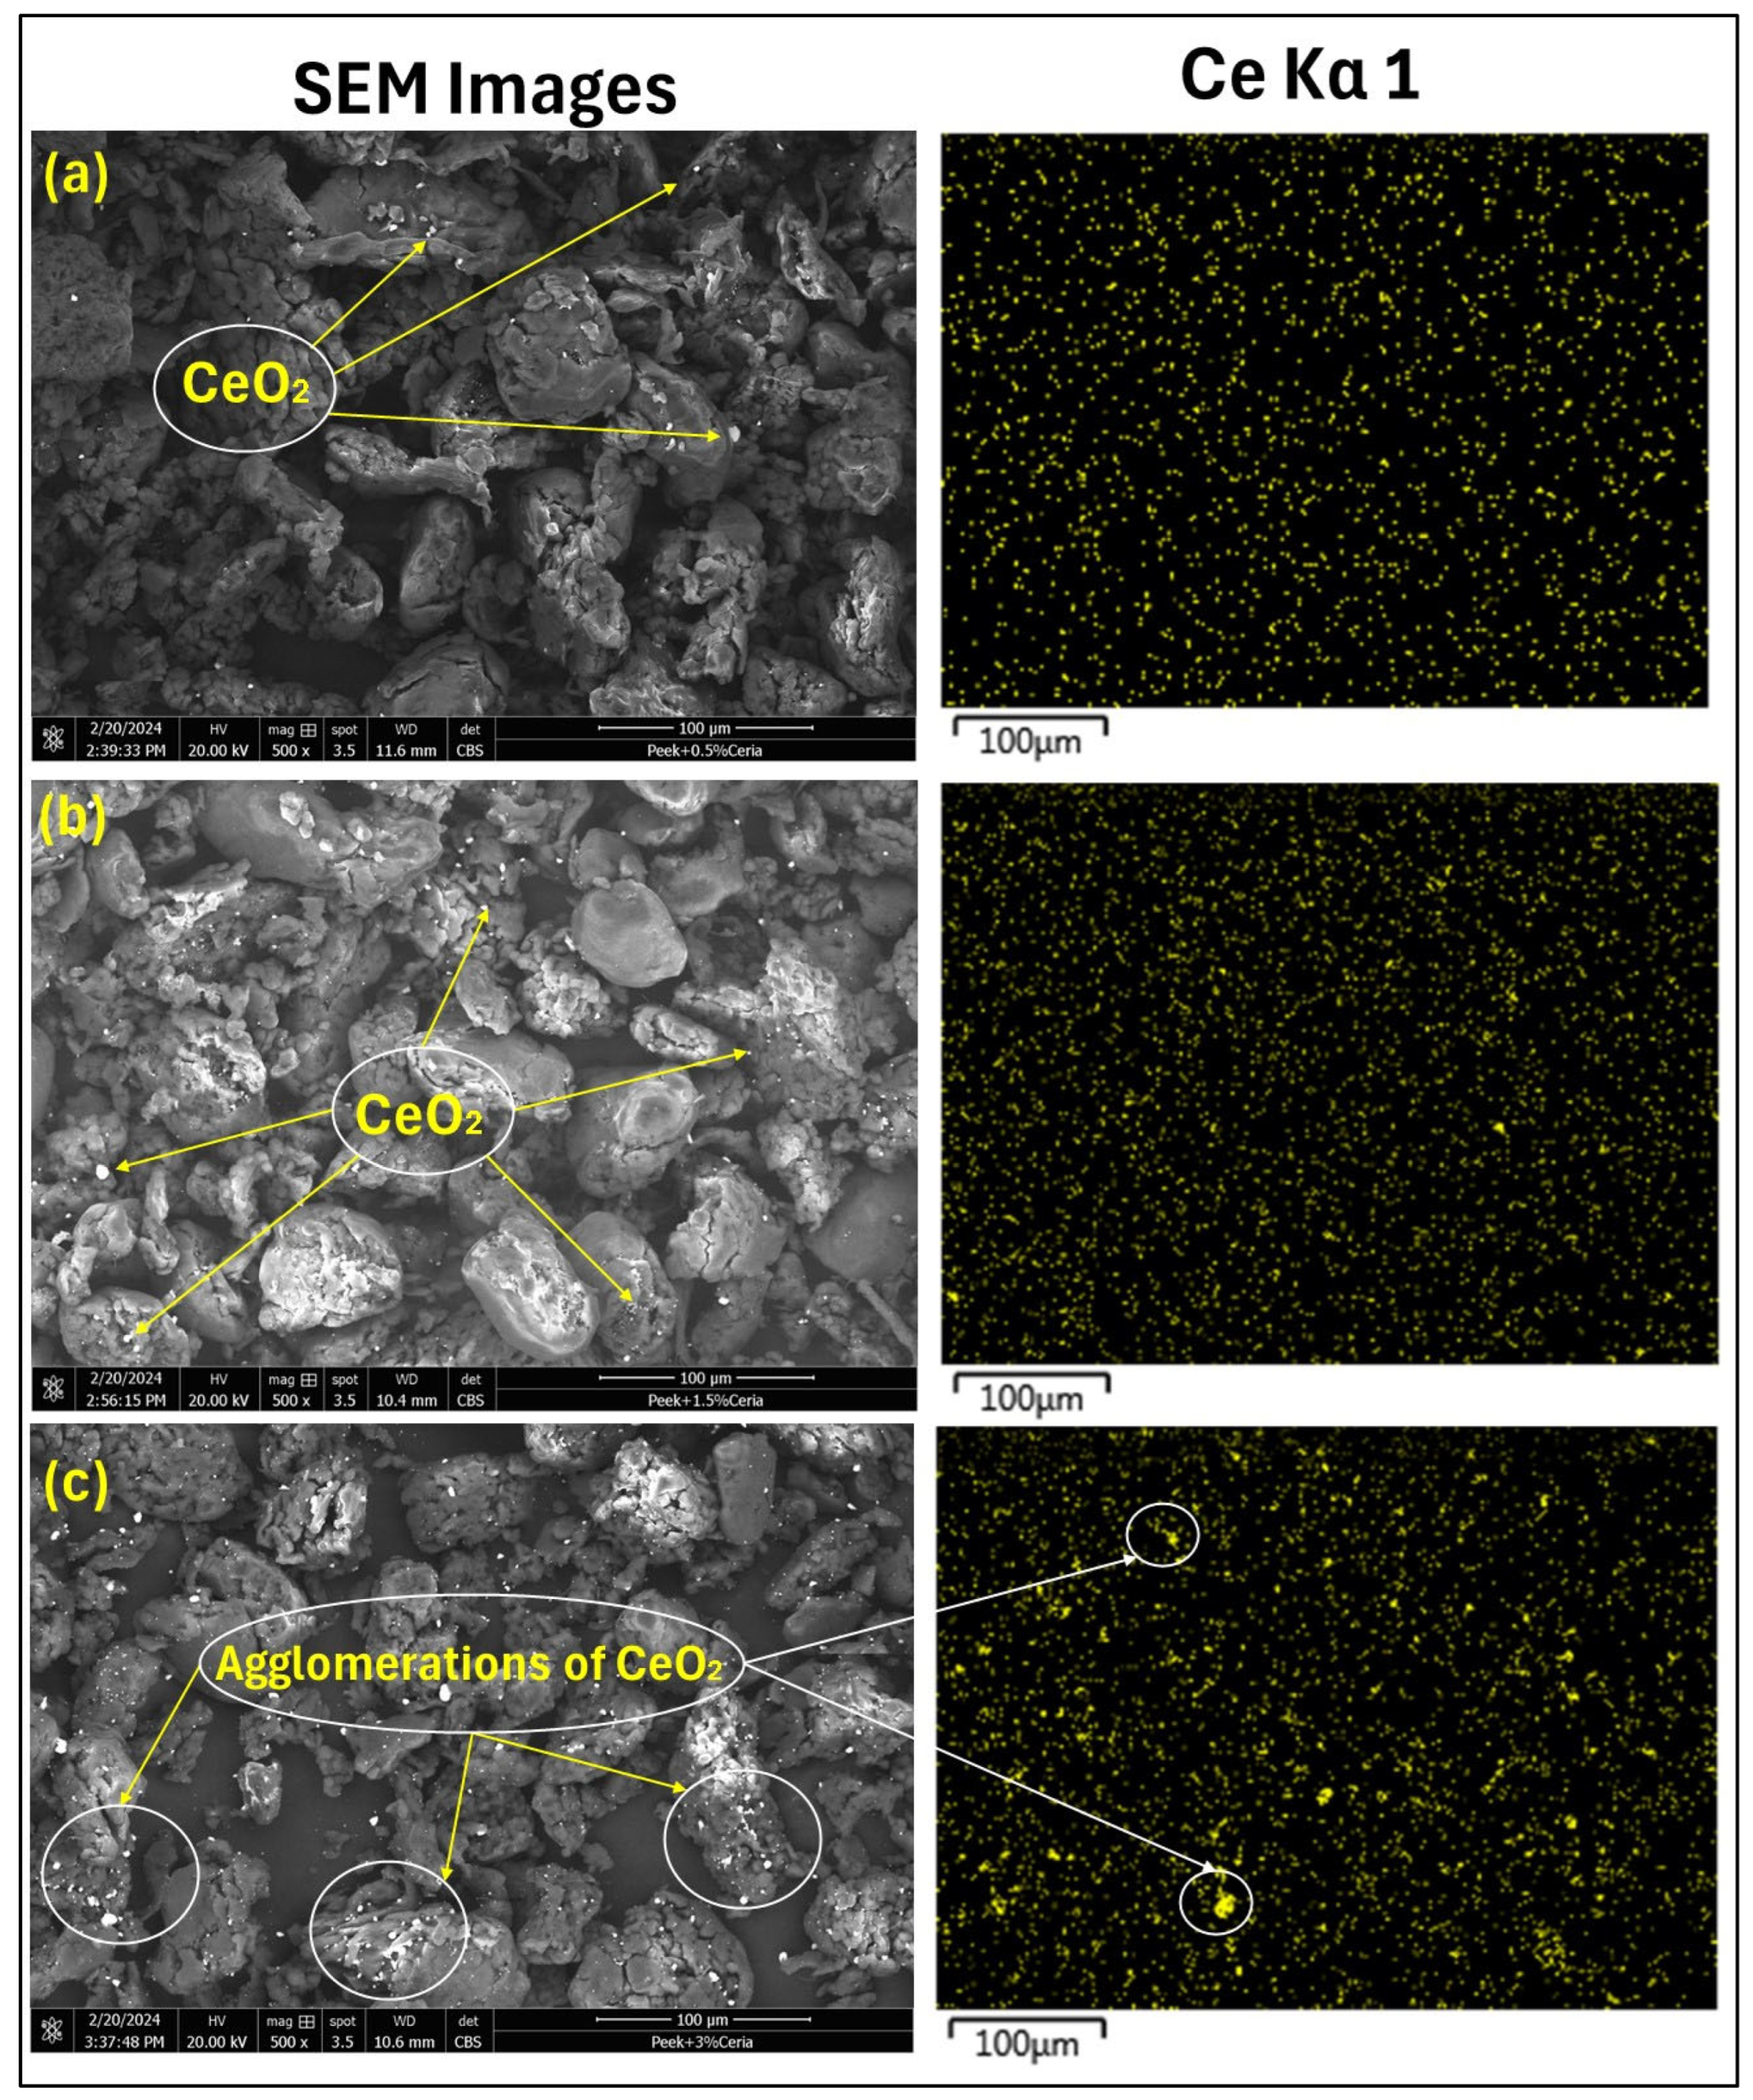
4.3. Analysis of the Thickness Measurements and Distribution of Nanoparticles in the Parent Matrix
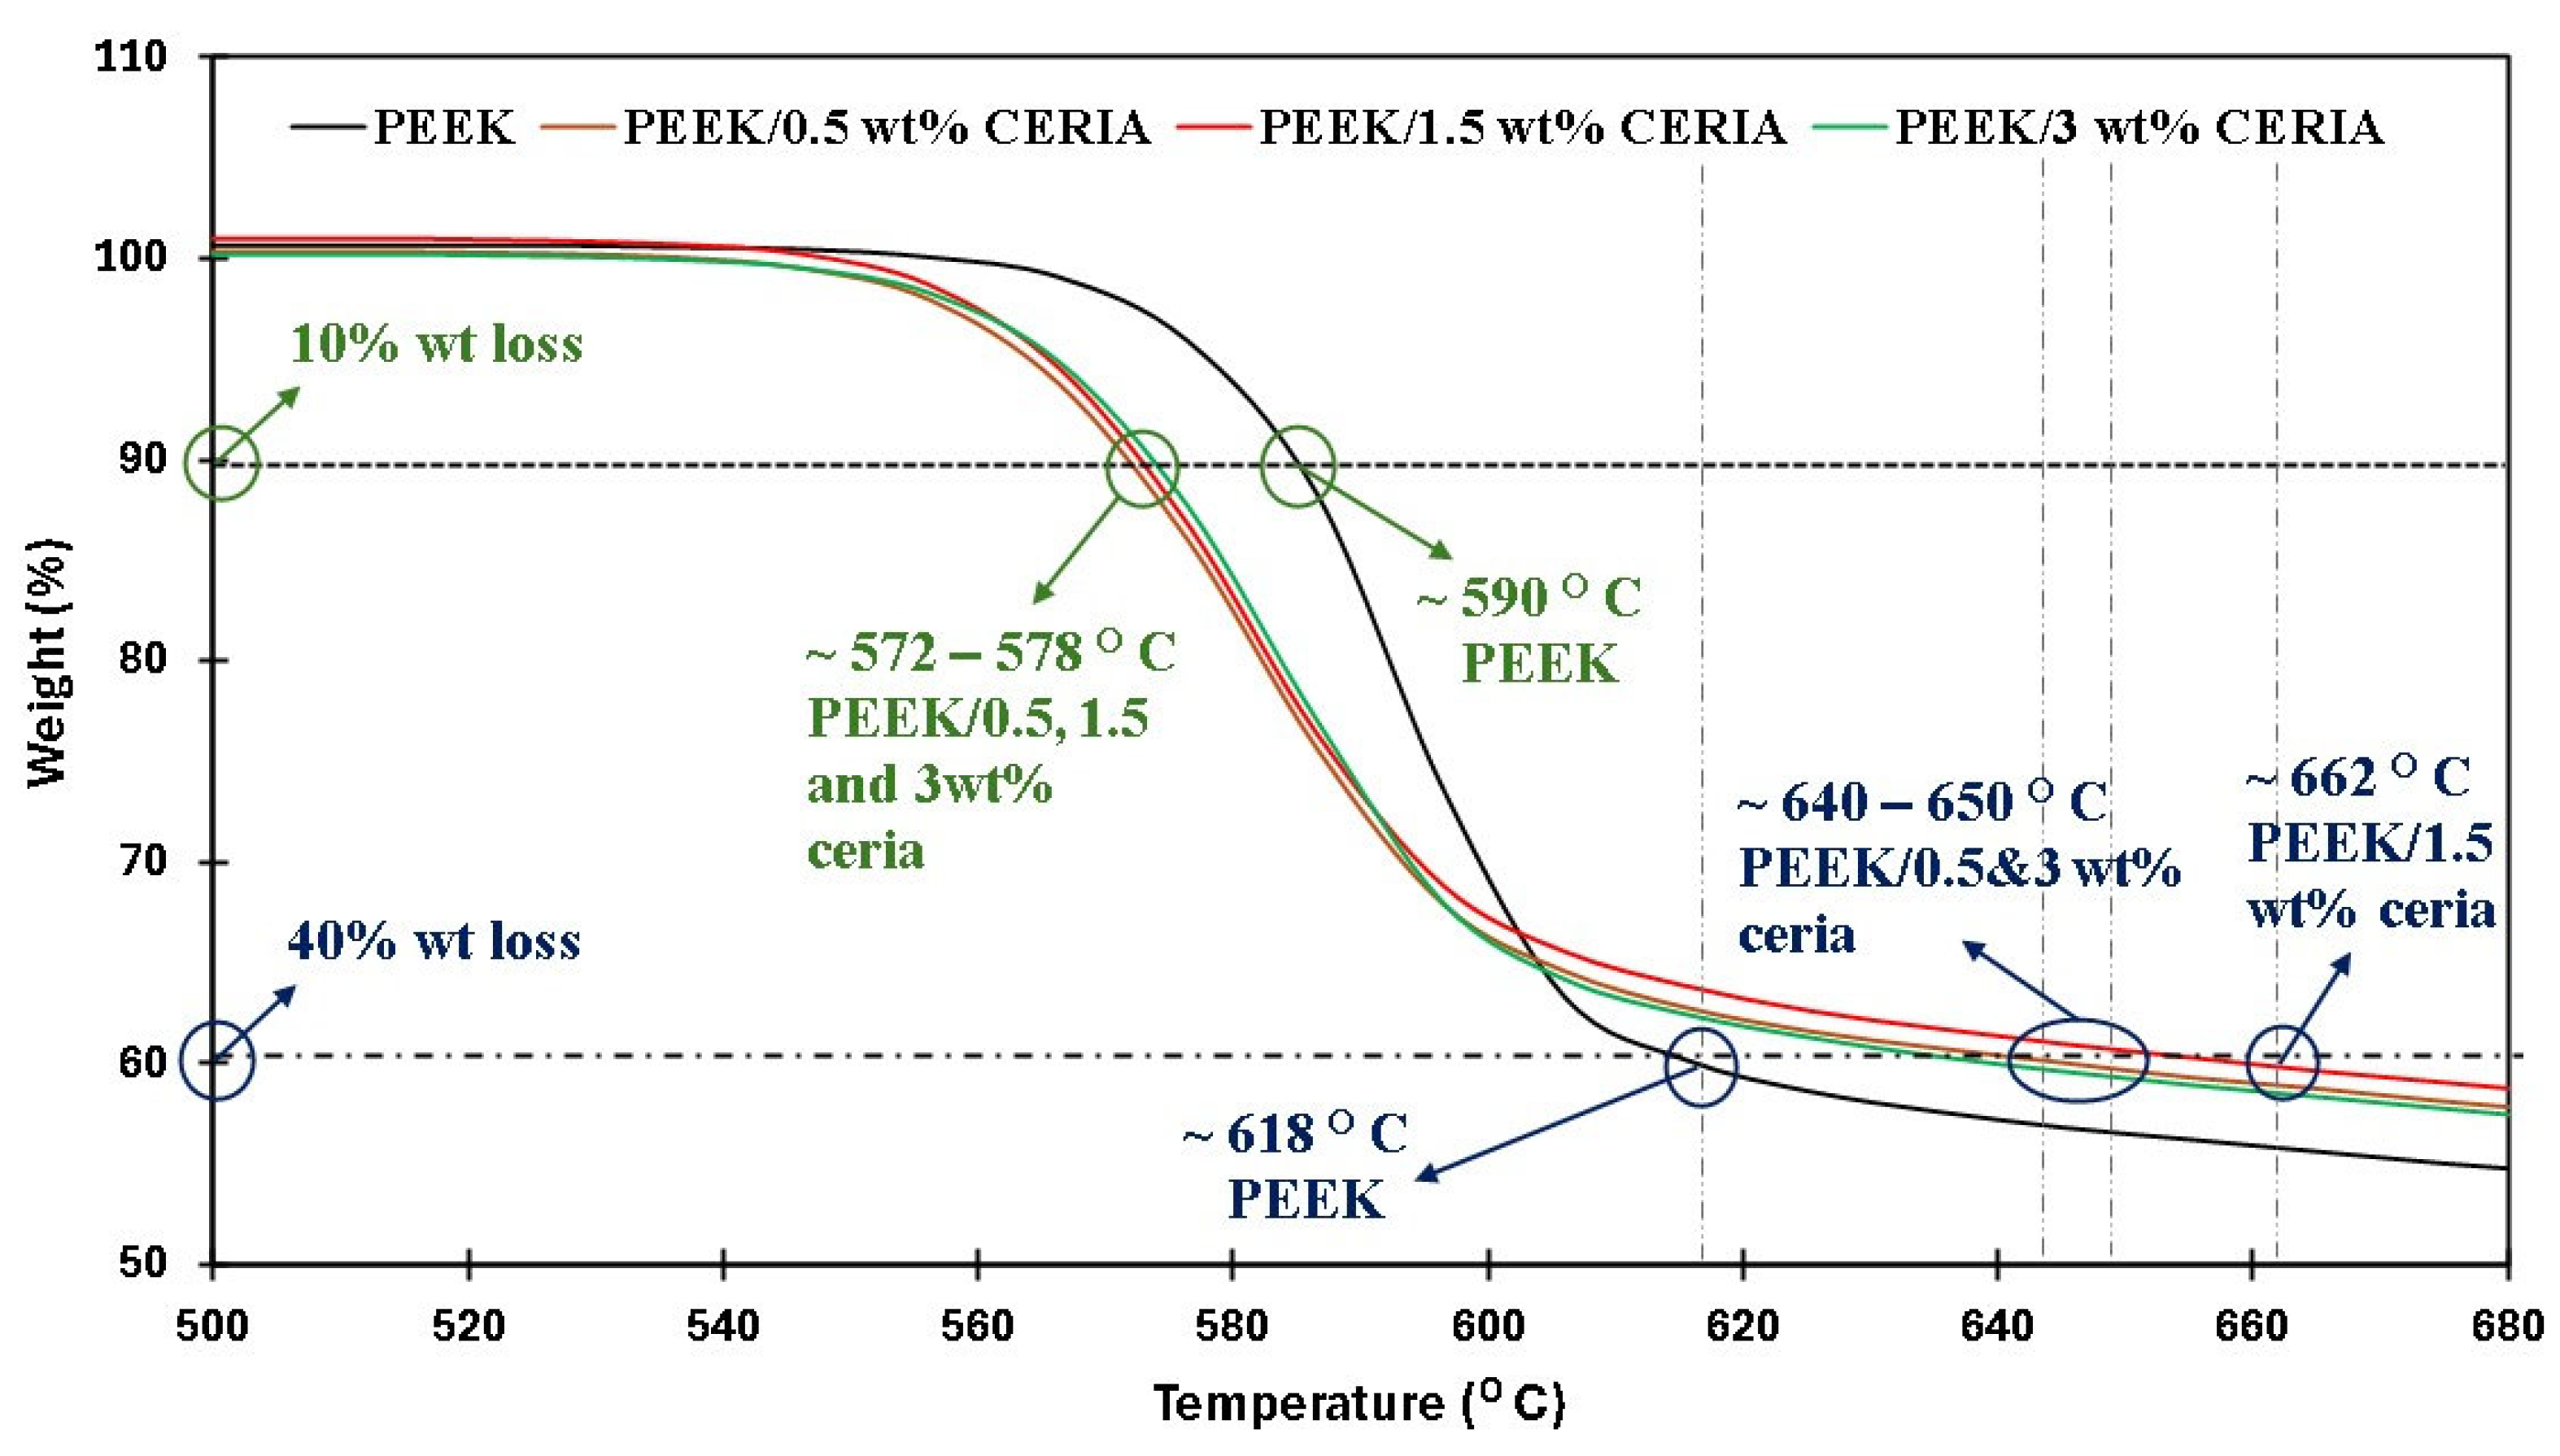
4.4. Thermal Stability
4.5. Tribological Results
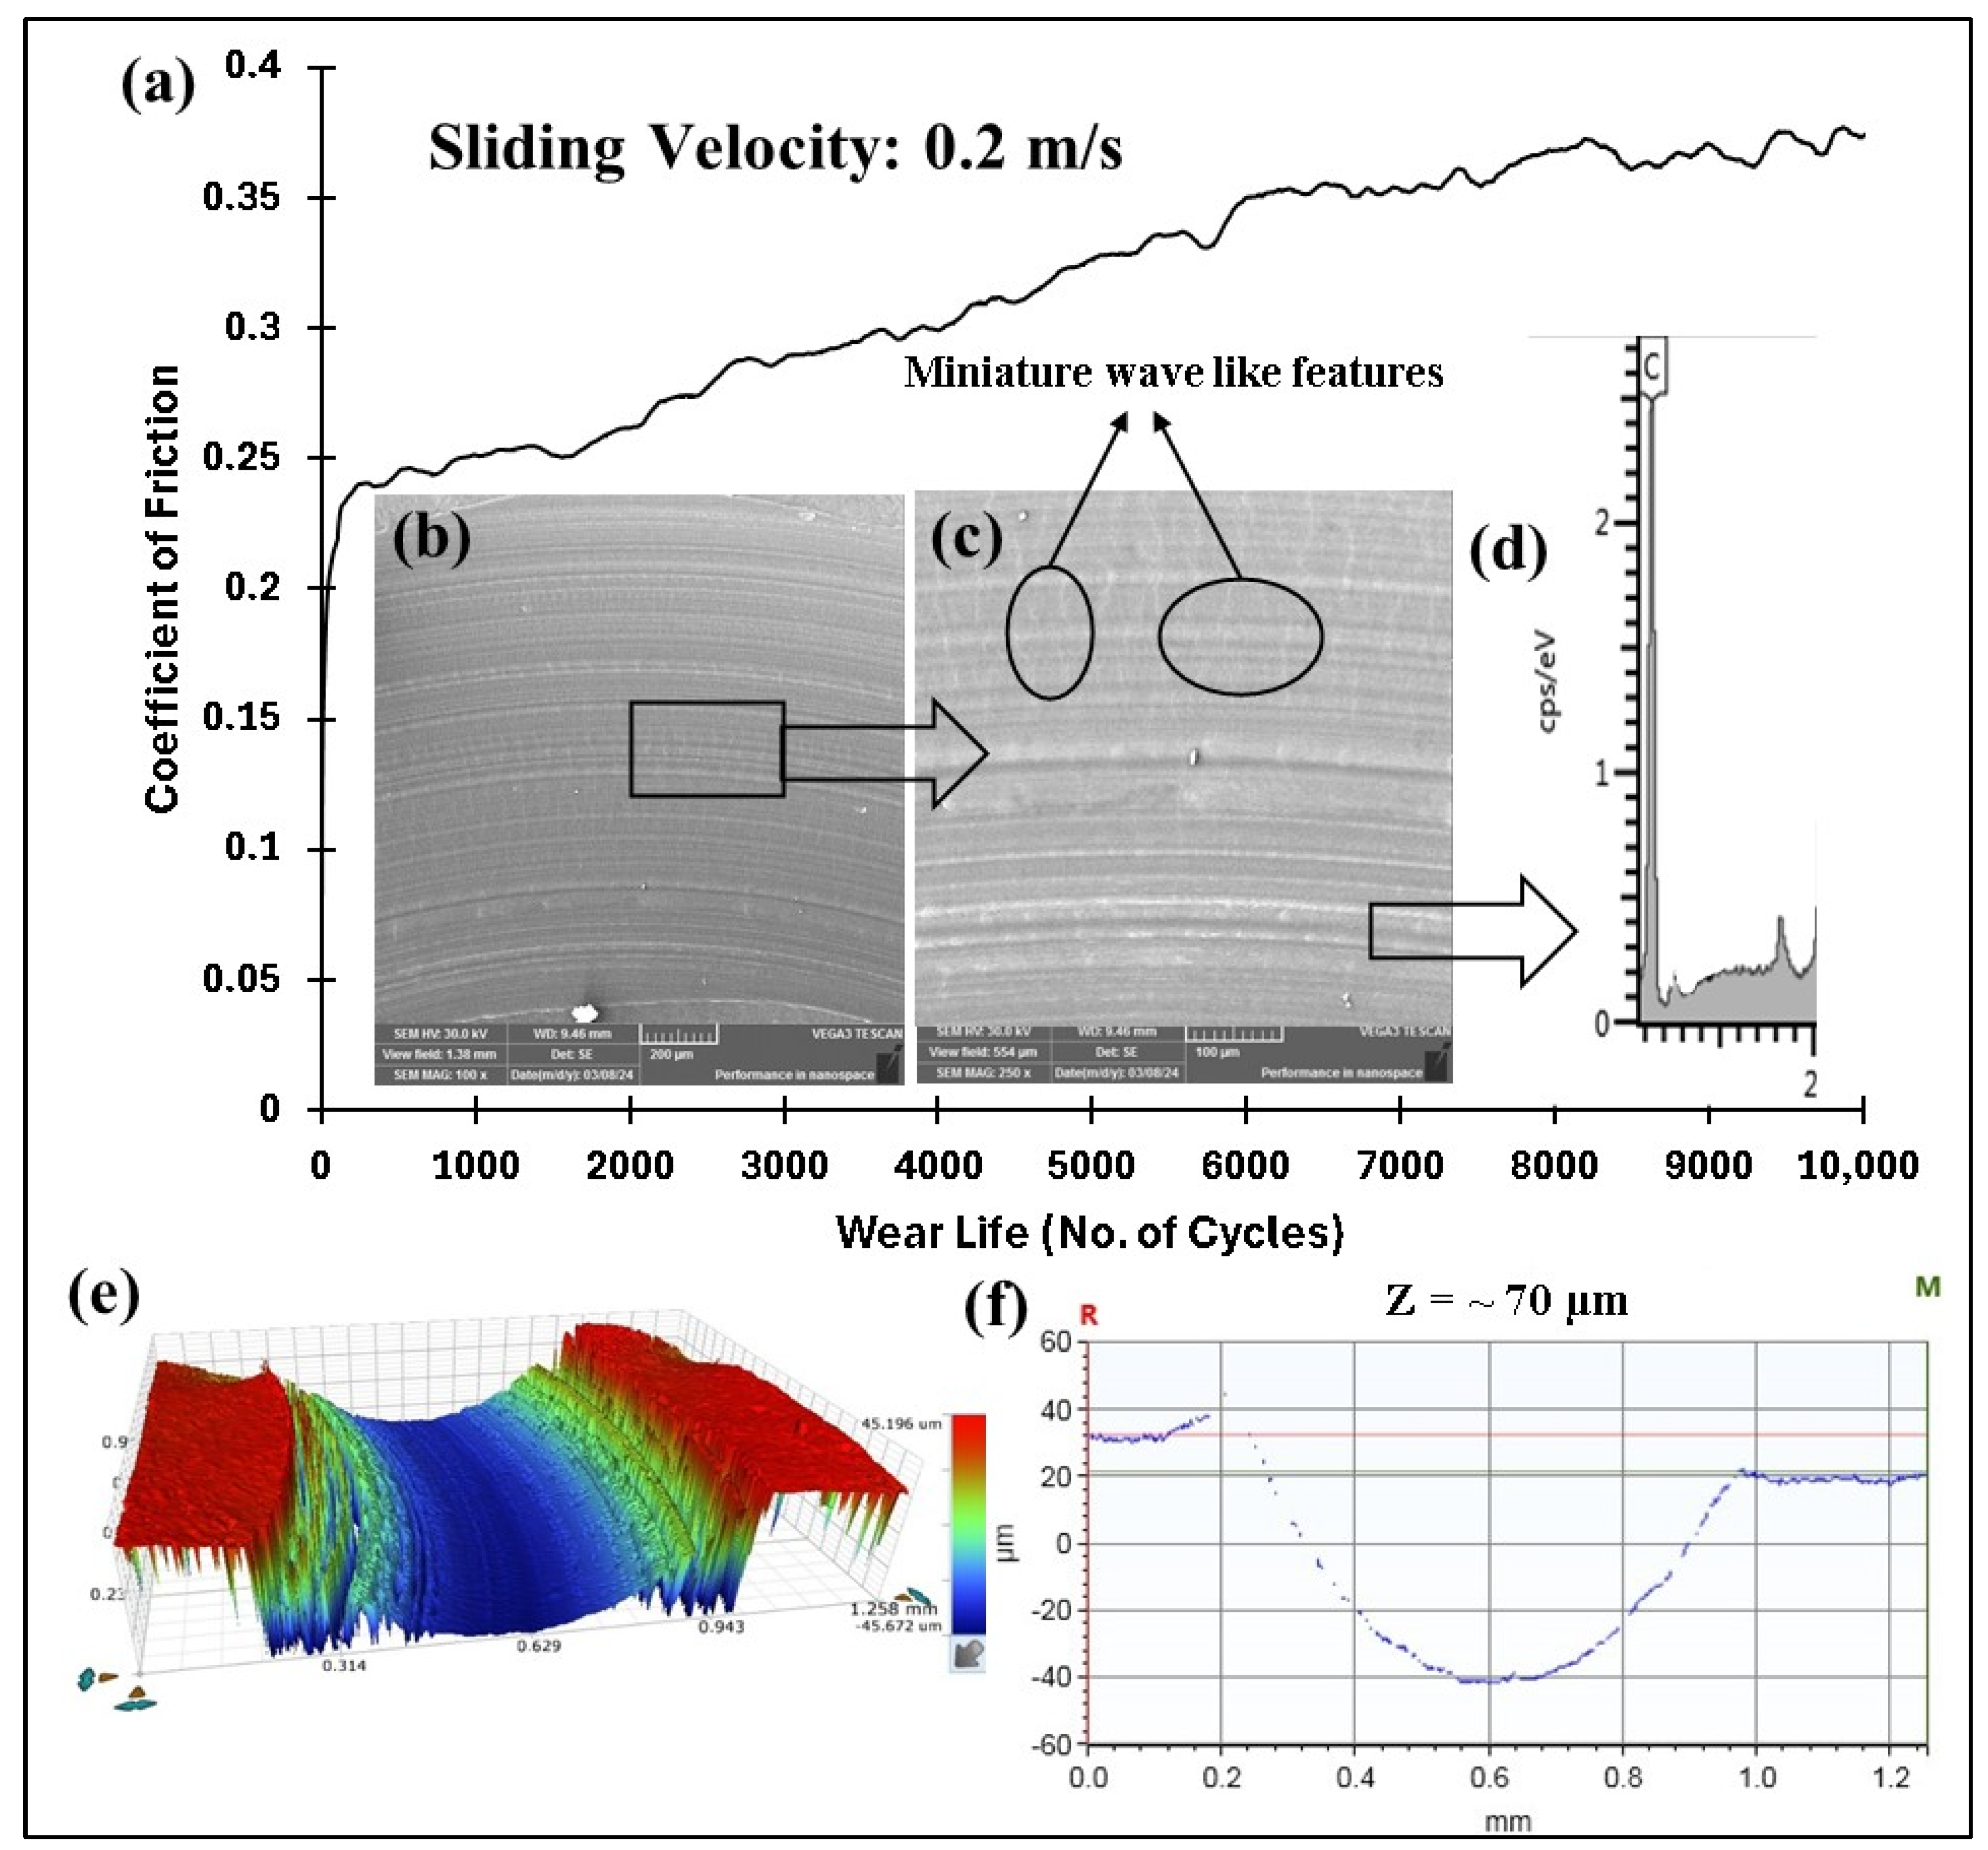
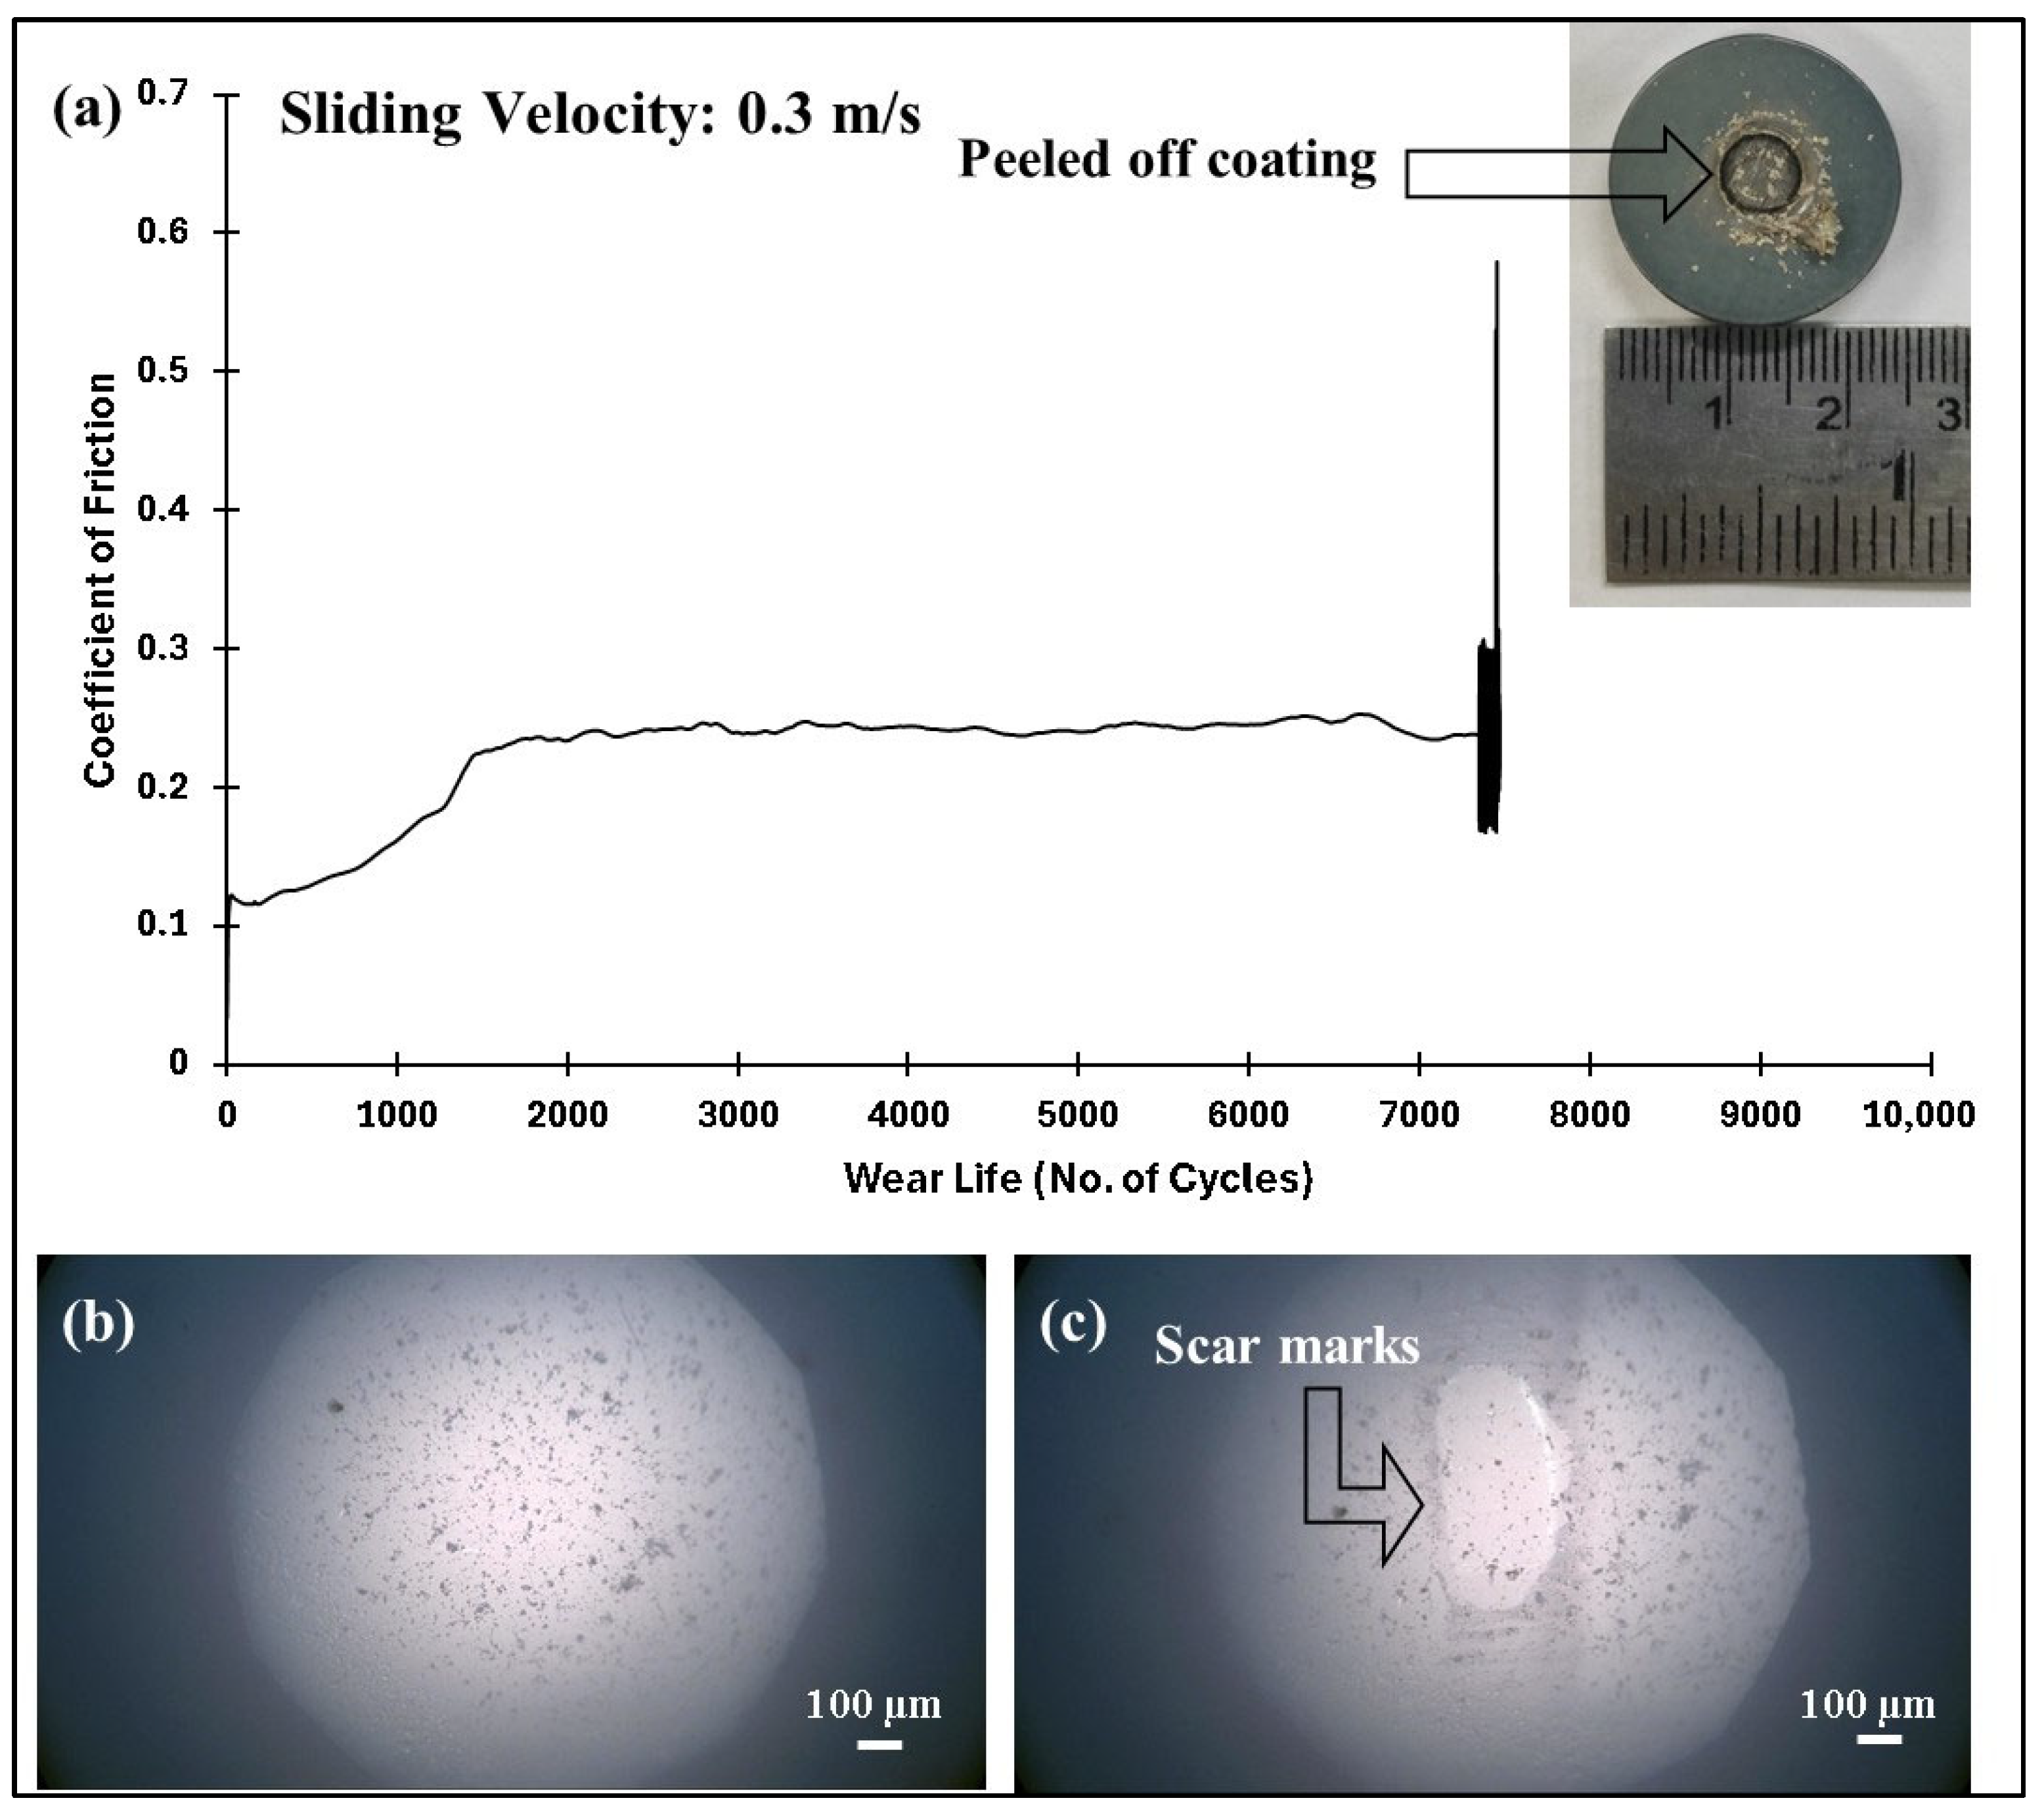
4.5.1. Effect of Load and Linear Speed on the Tribological Performance of Pristine PEEK Coatings
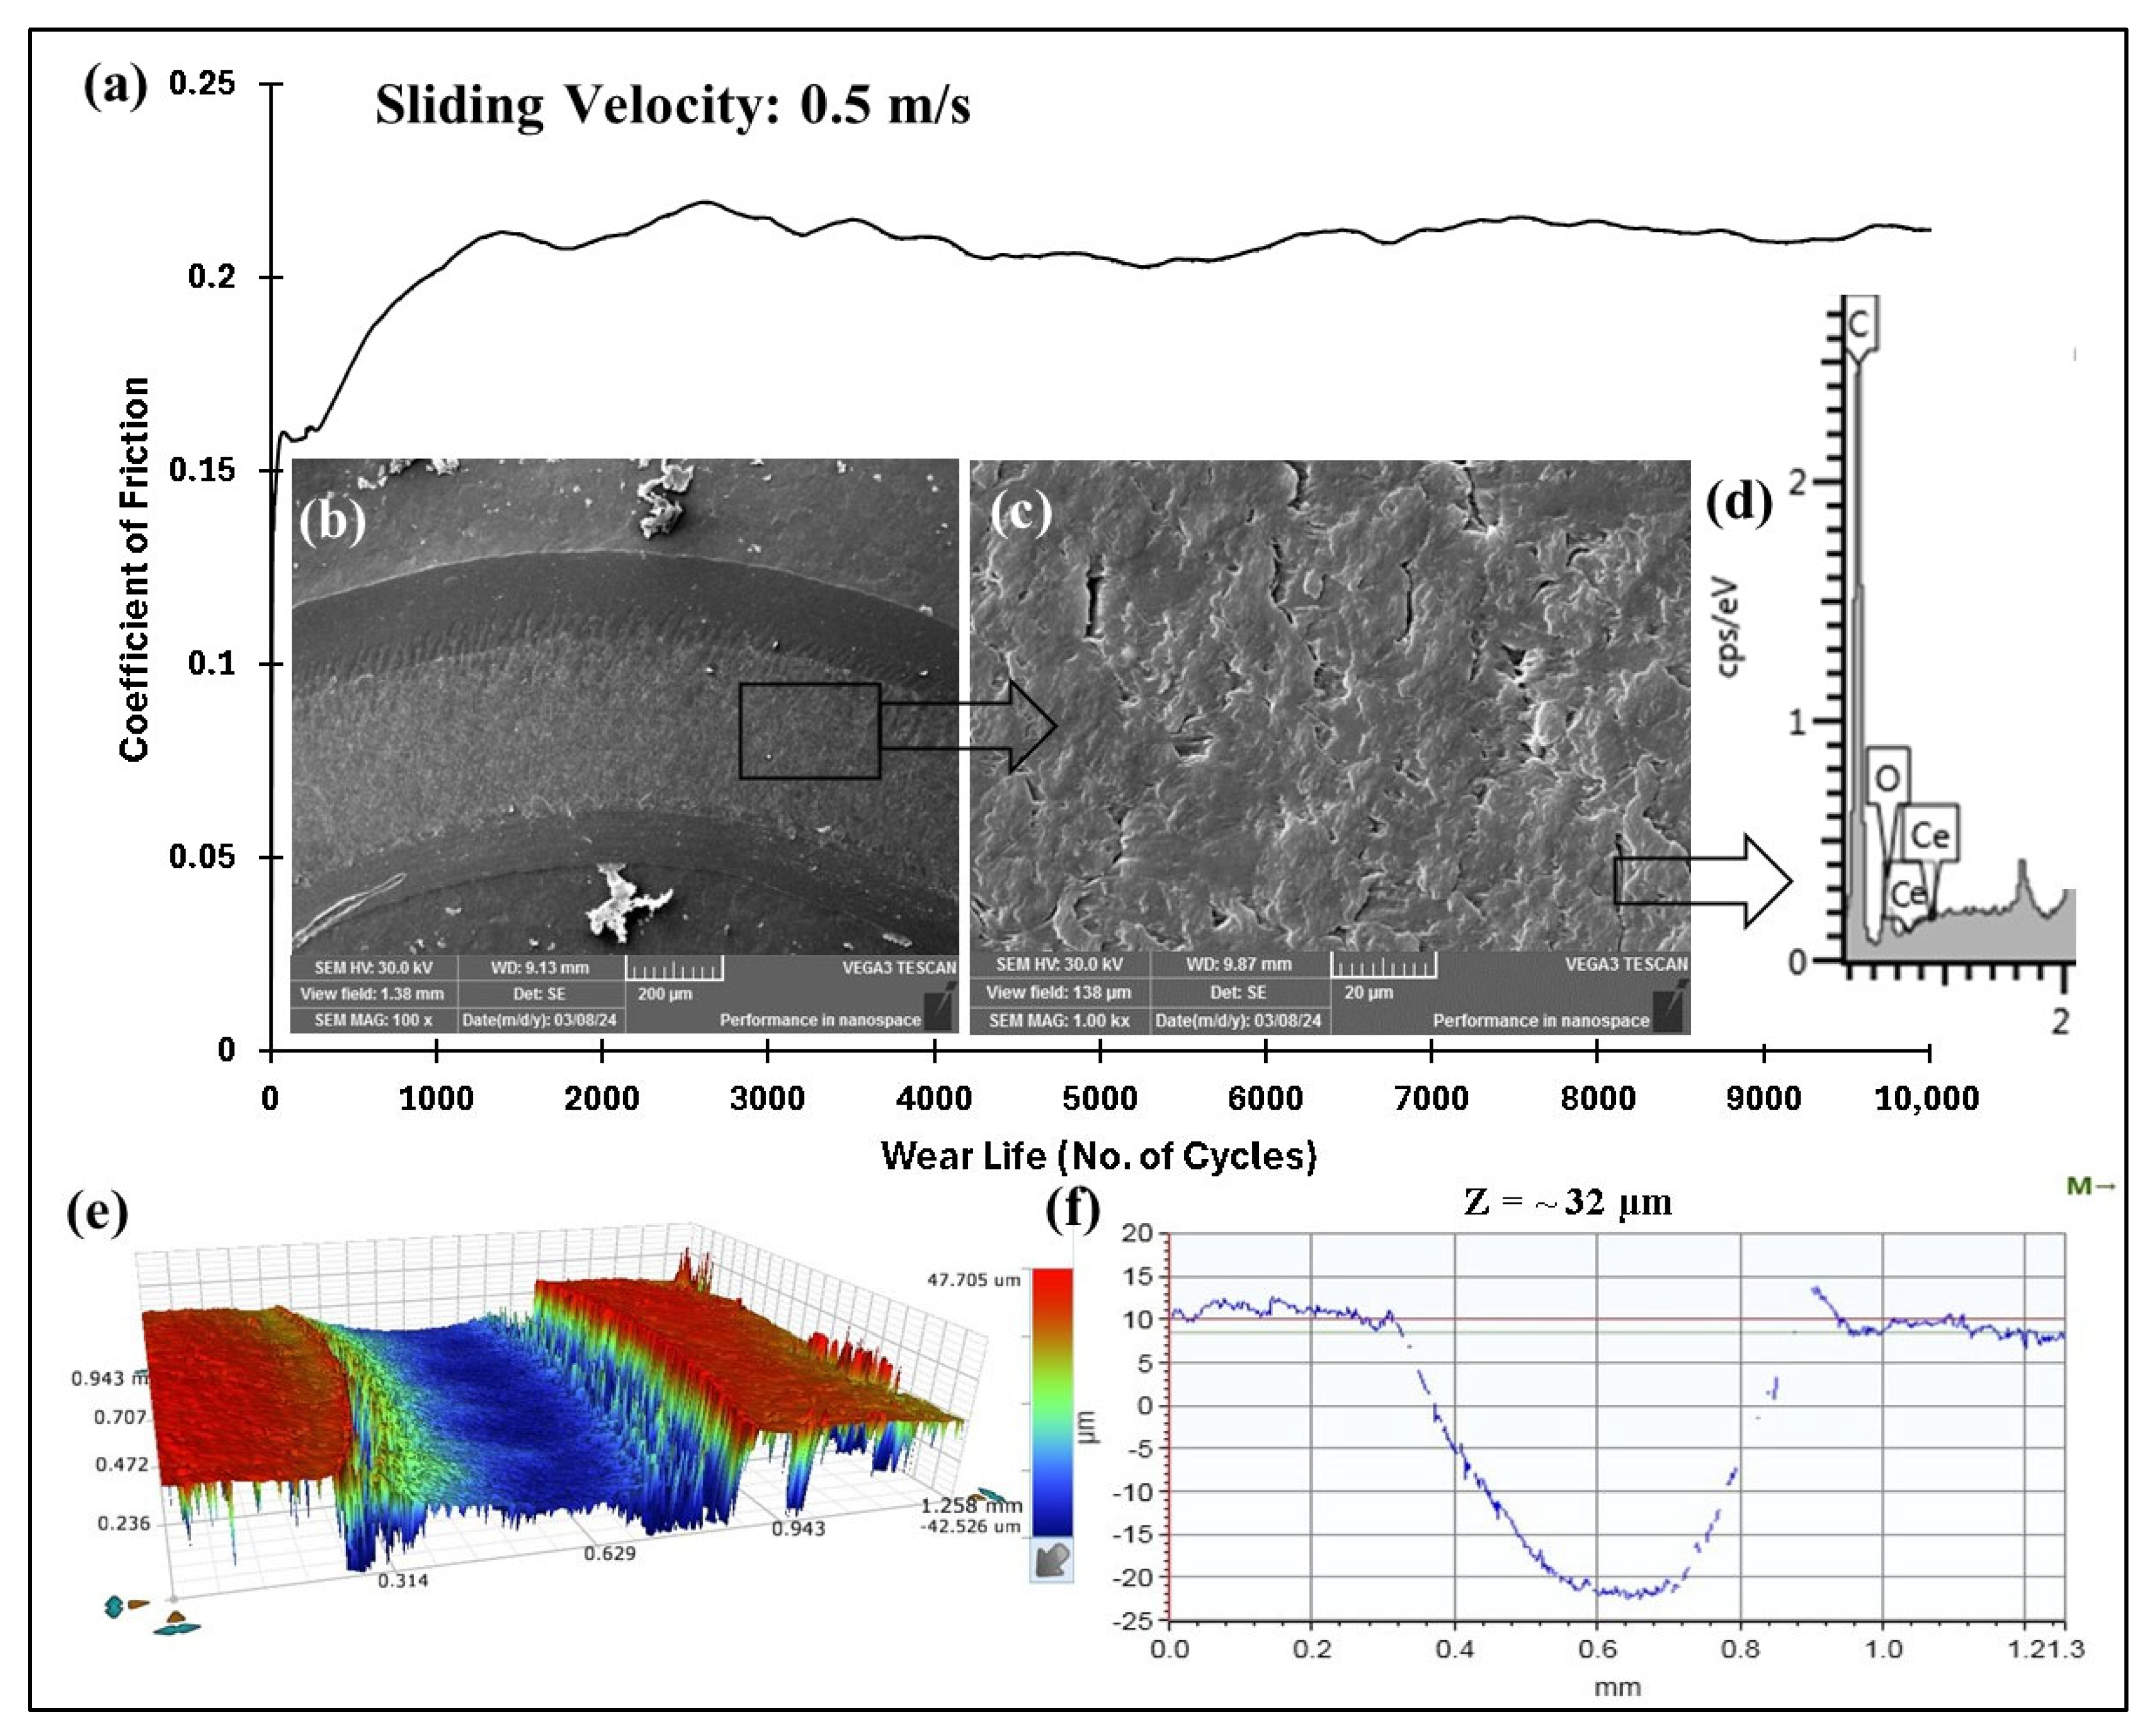
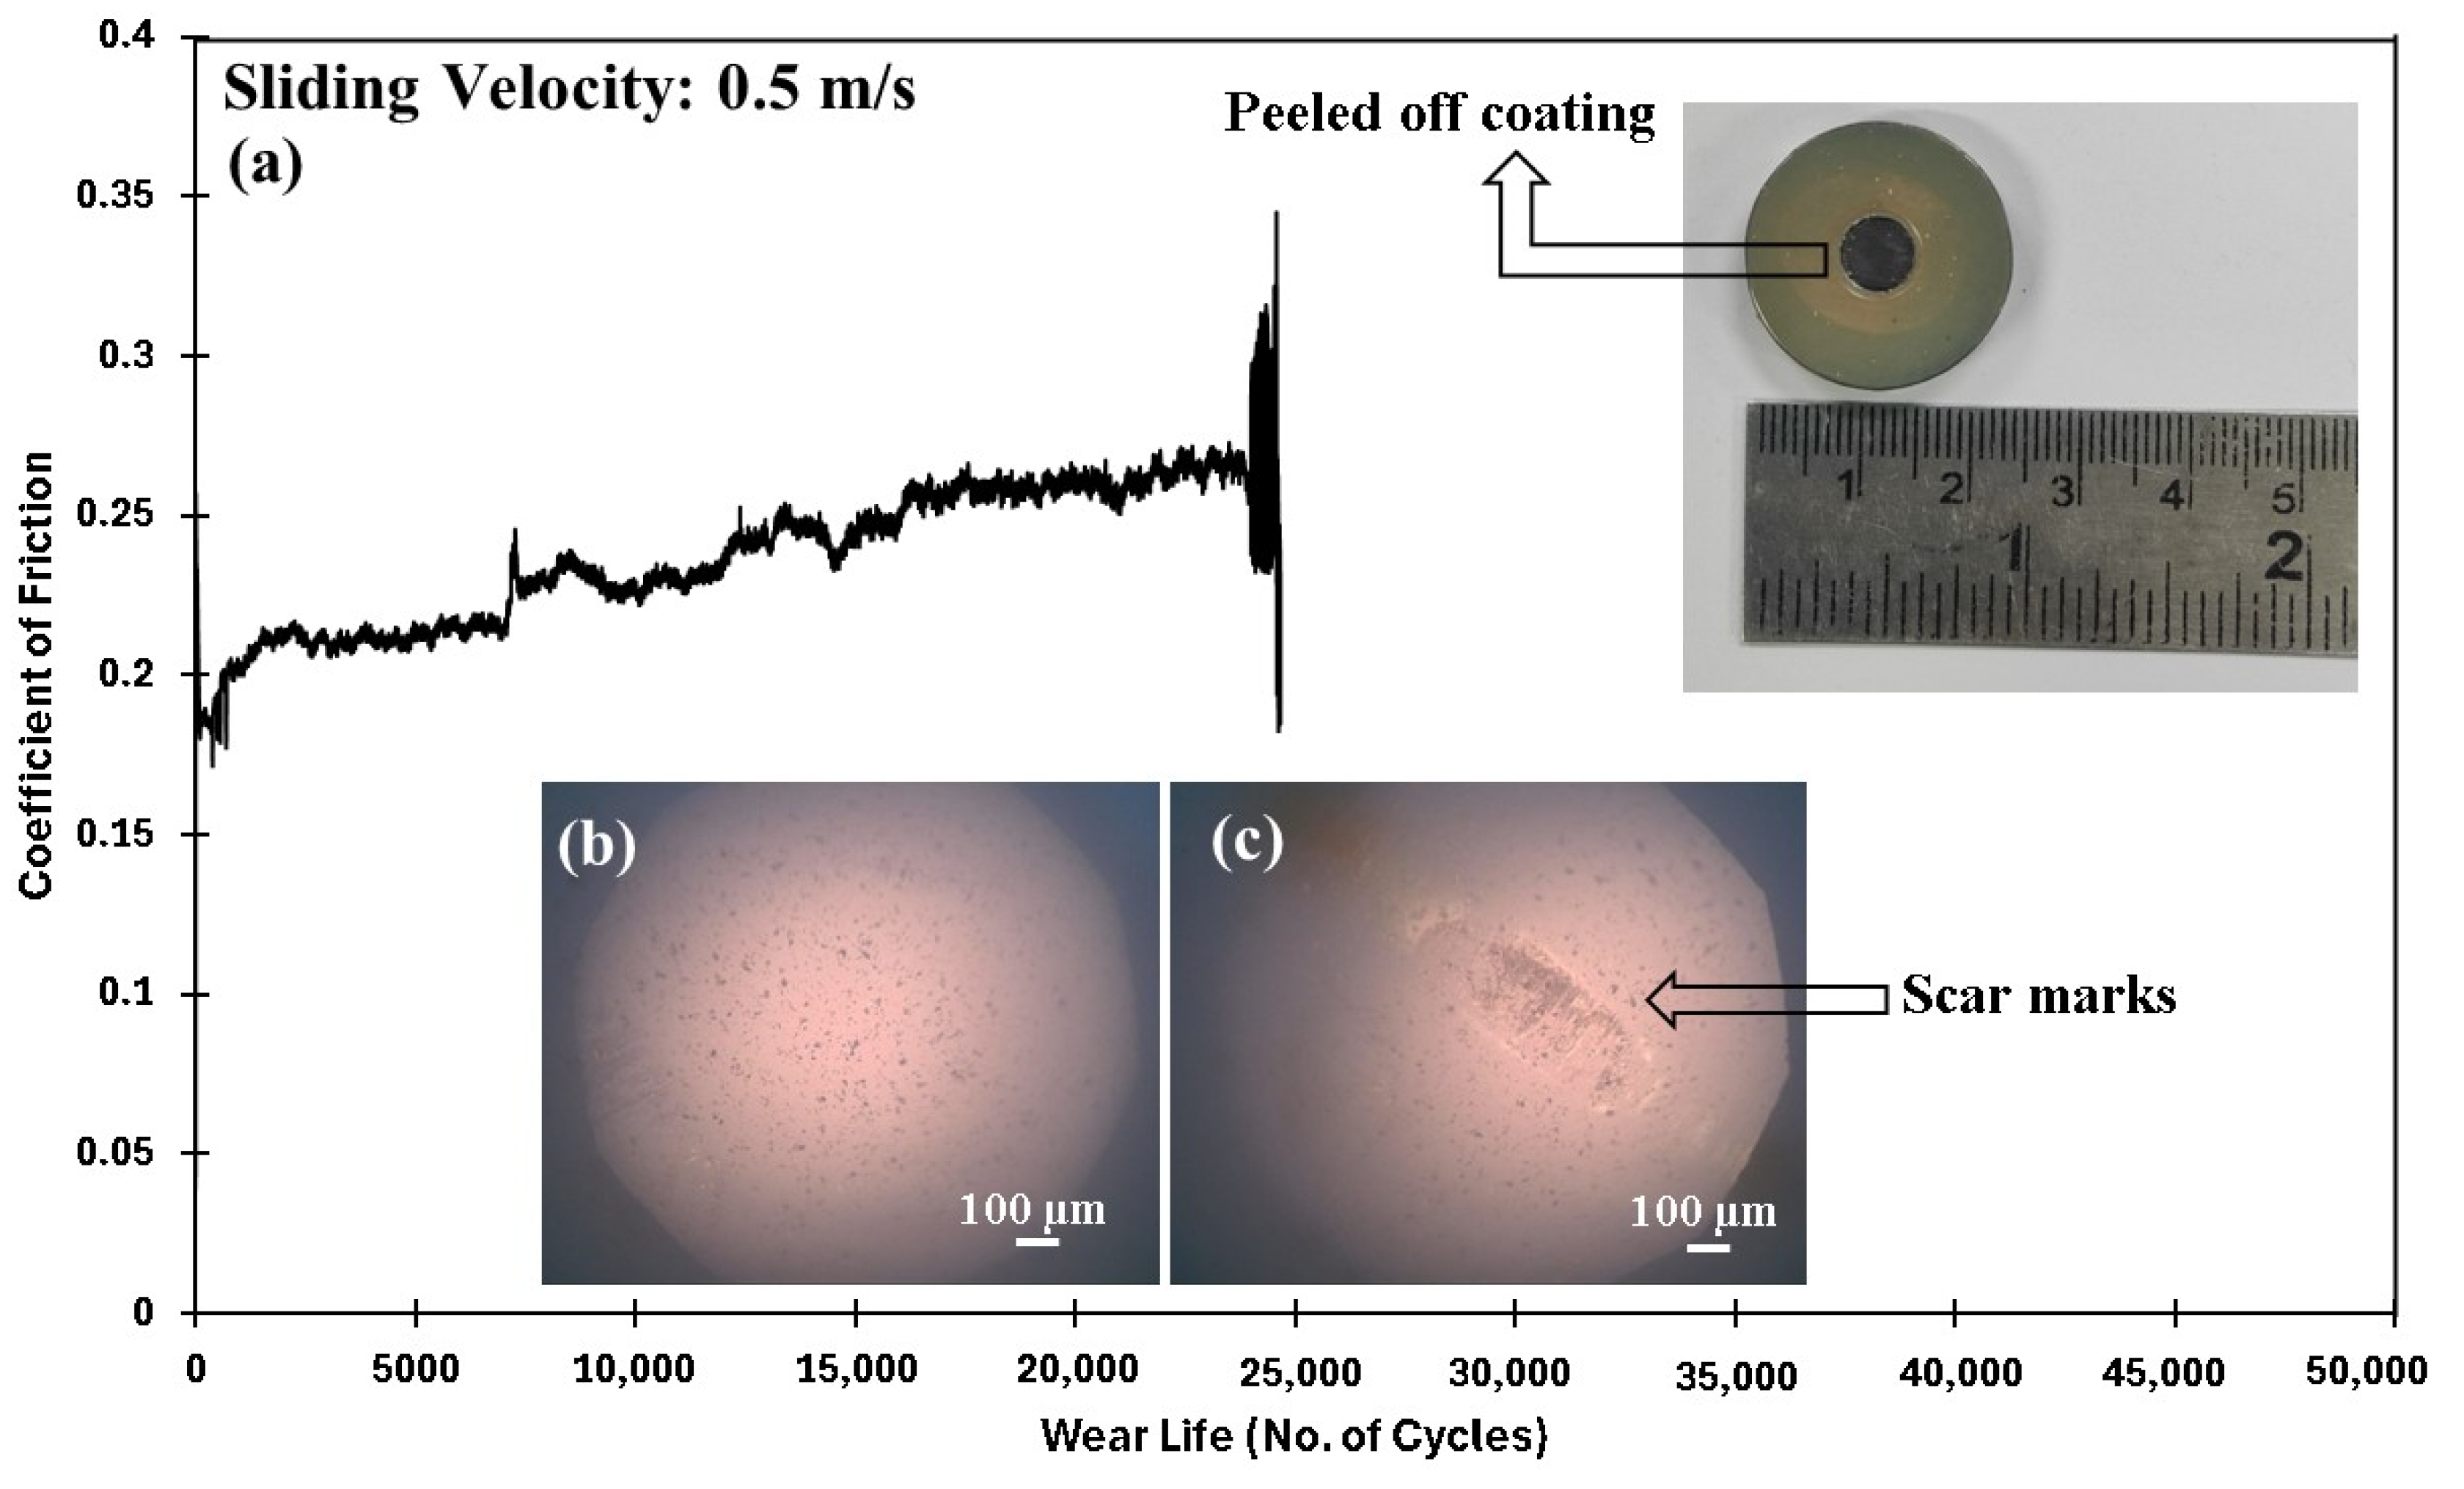
4.5.2. Effect of Load and Linear Speed on the Tribological Performance of PEEK/Ceria Nanocomposite Coatings
4.5.3. Accelerated Wear Life Testing
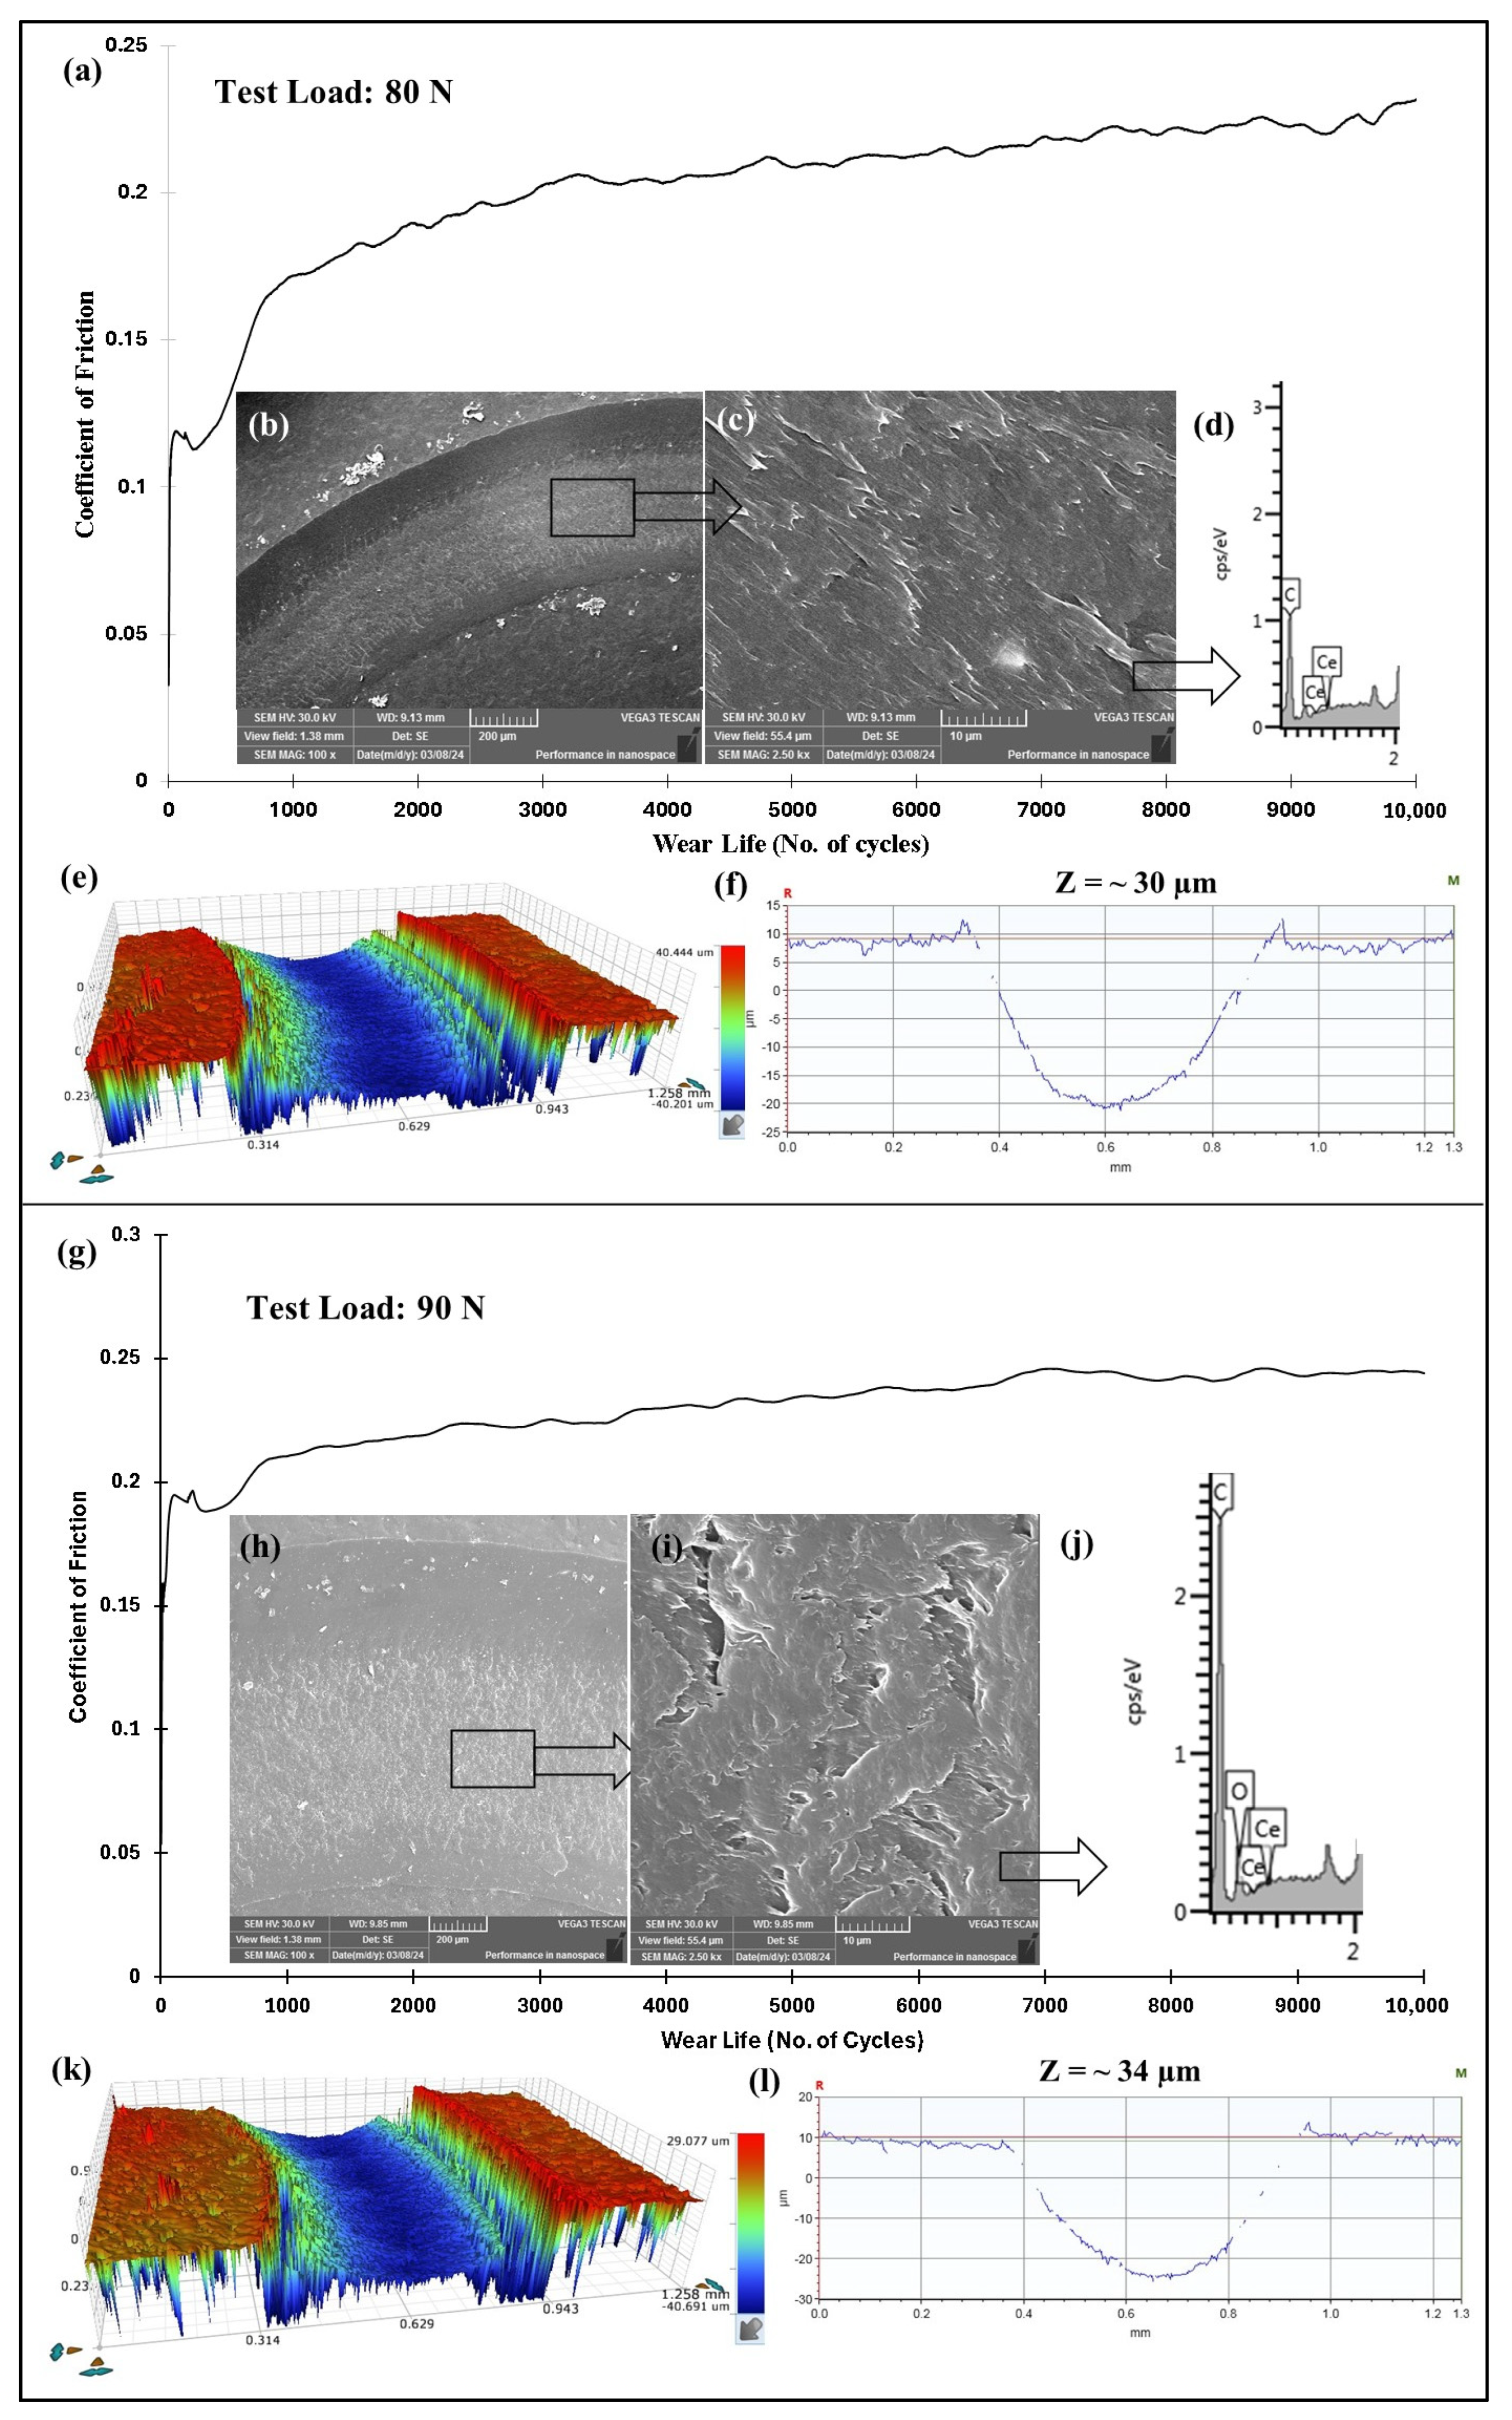
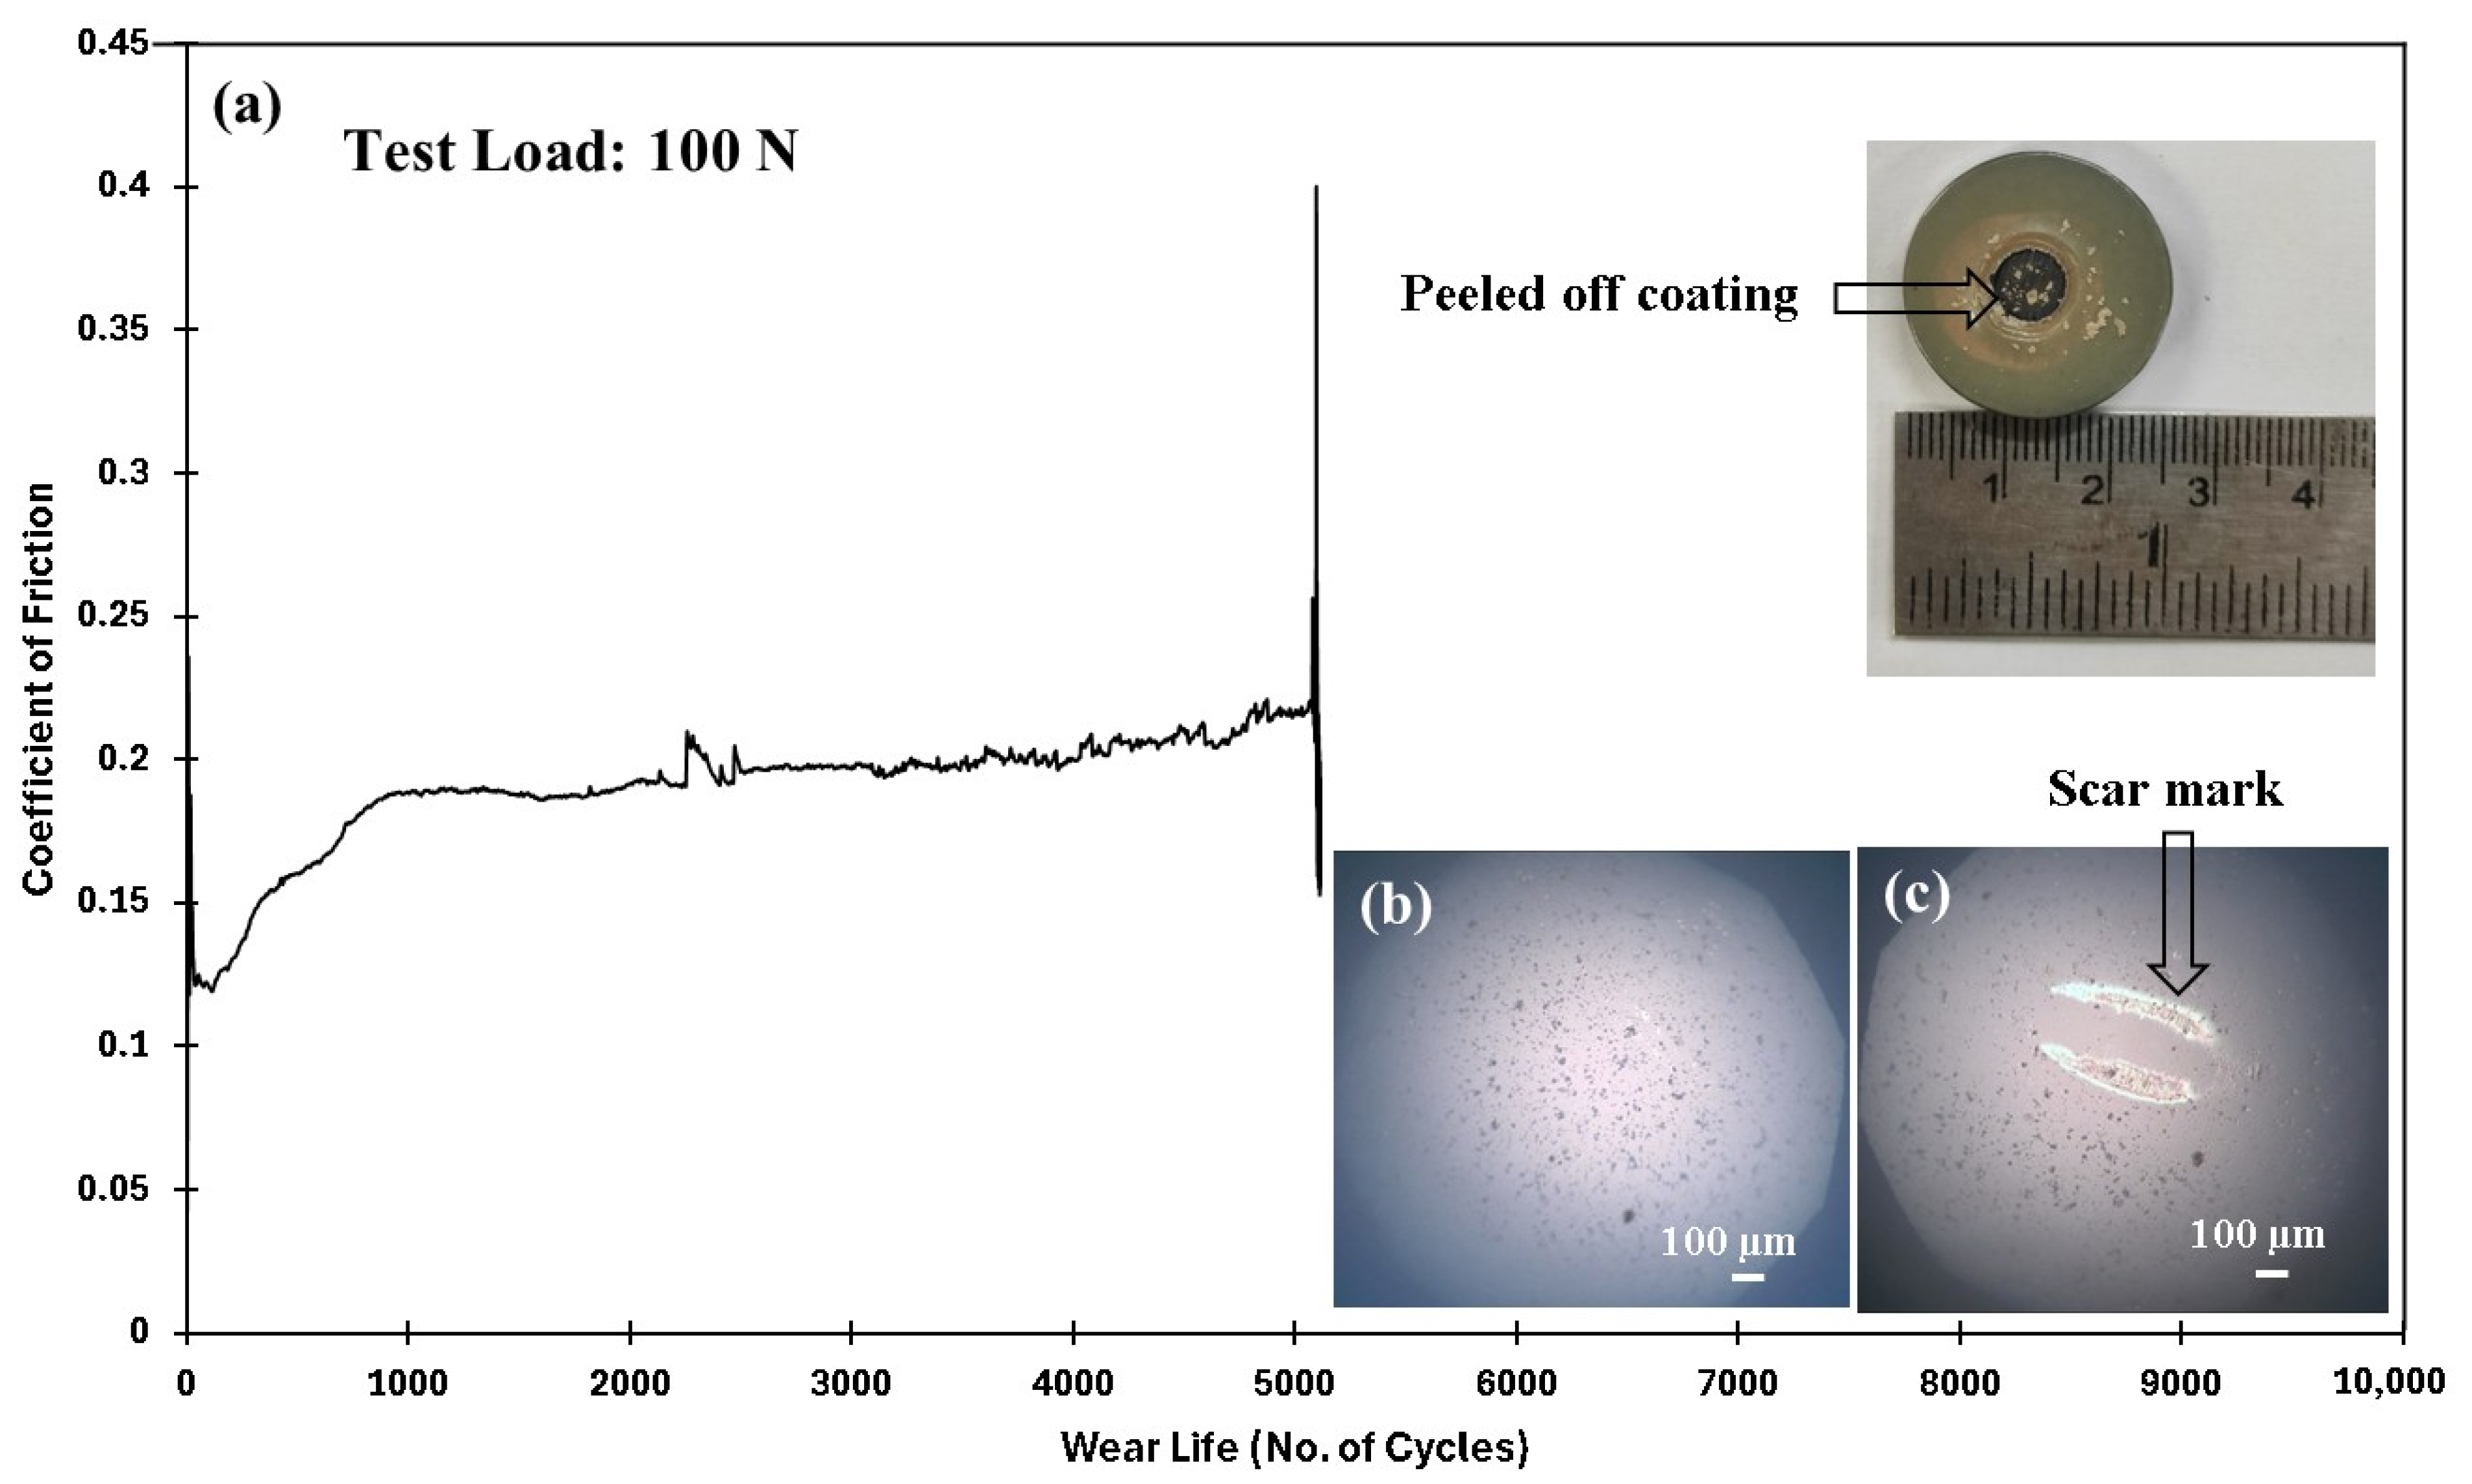
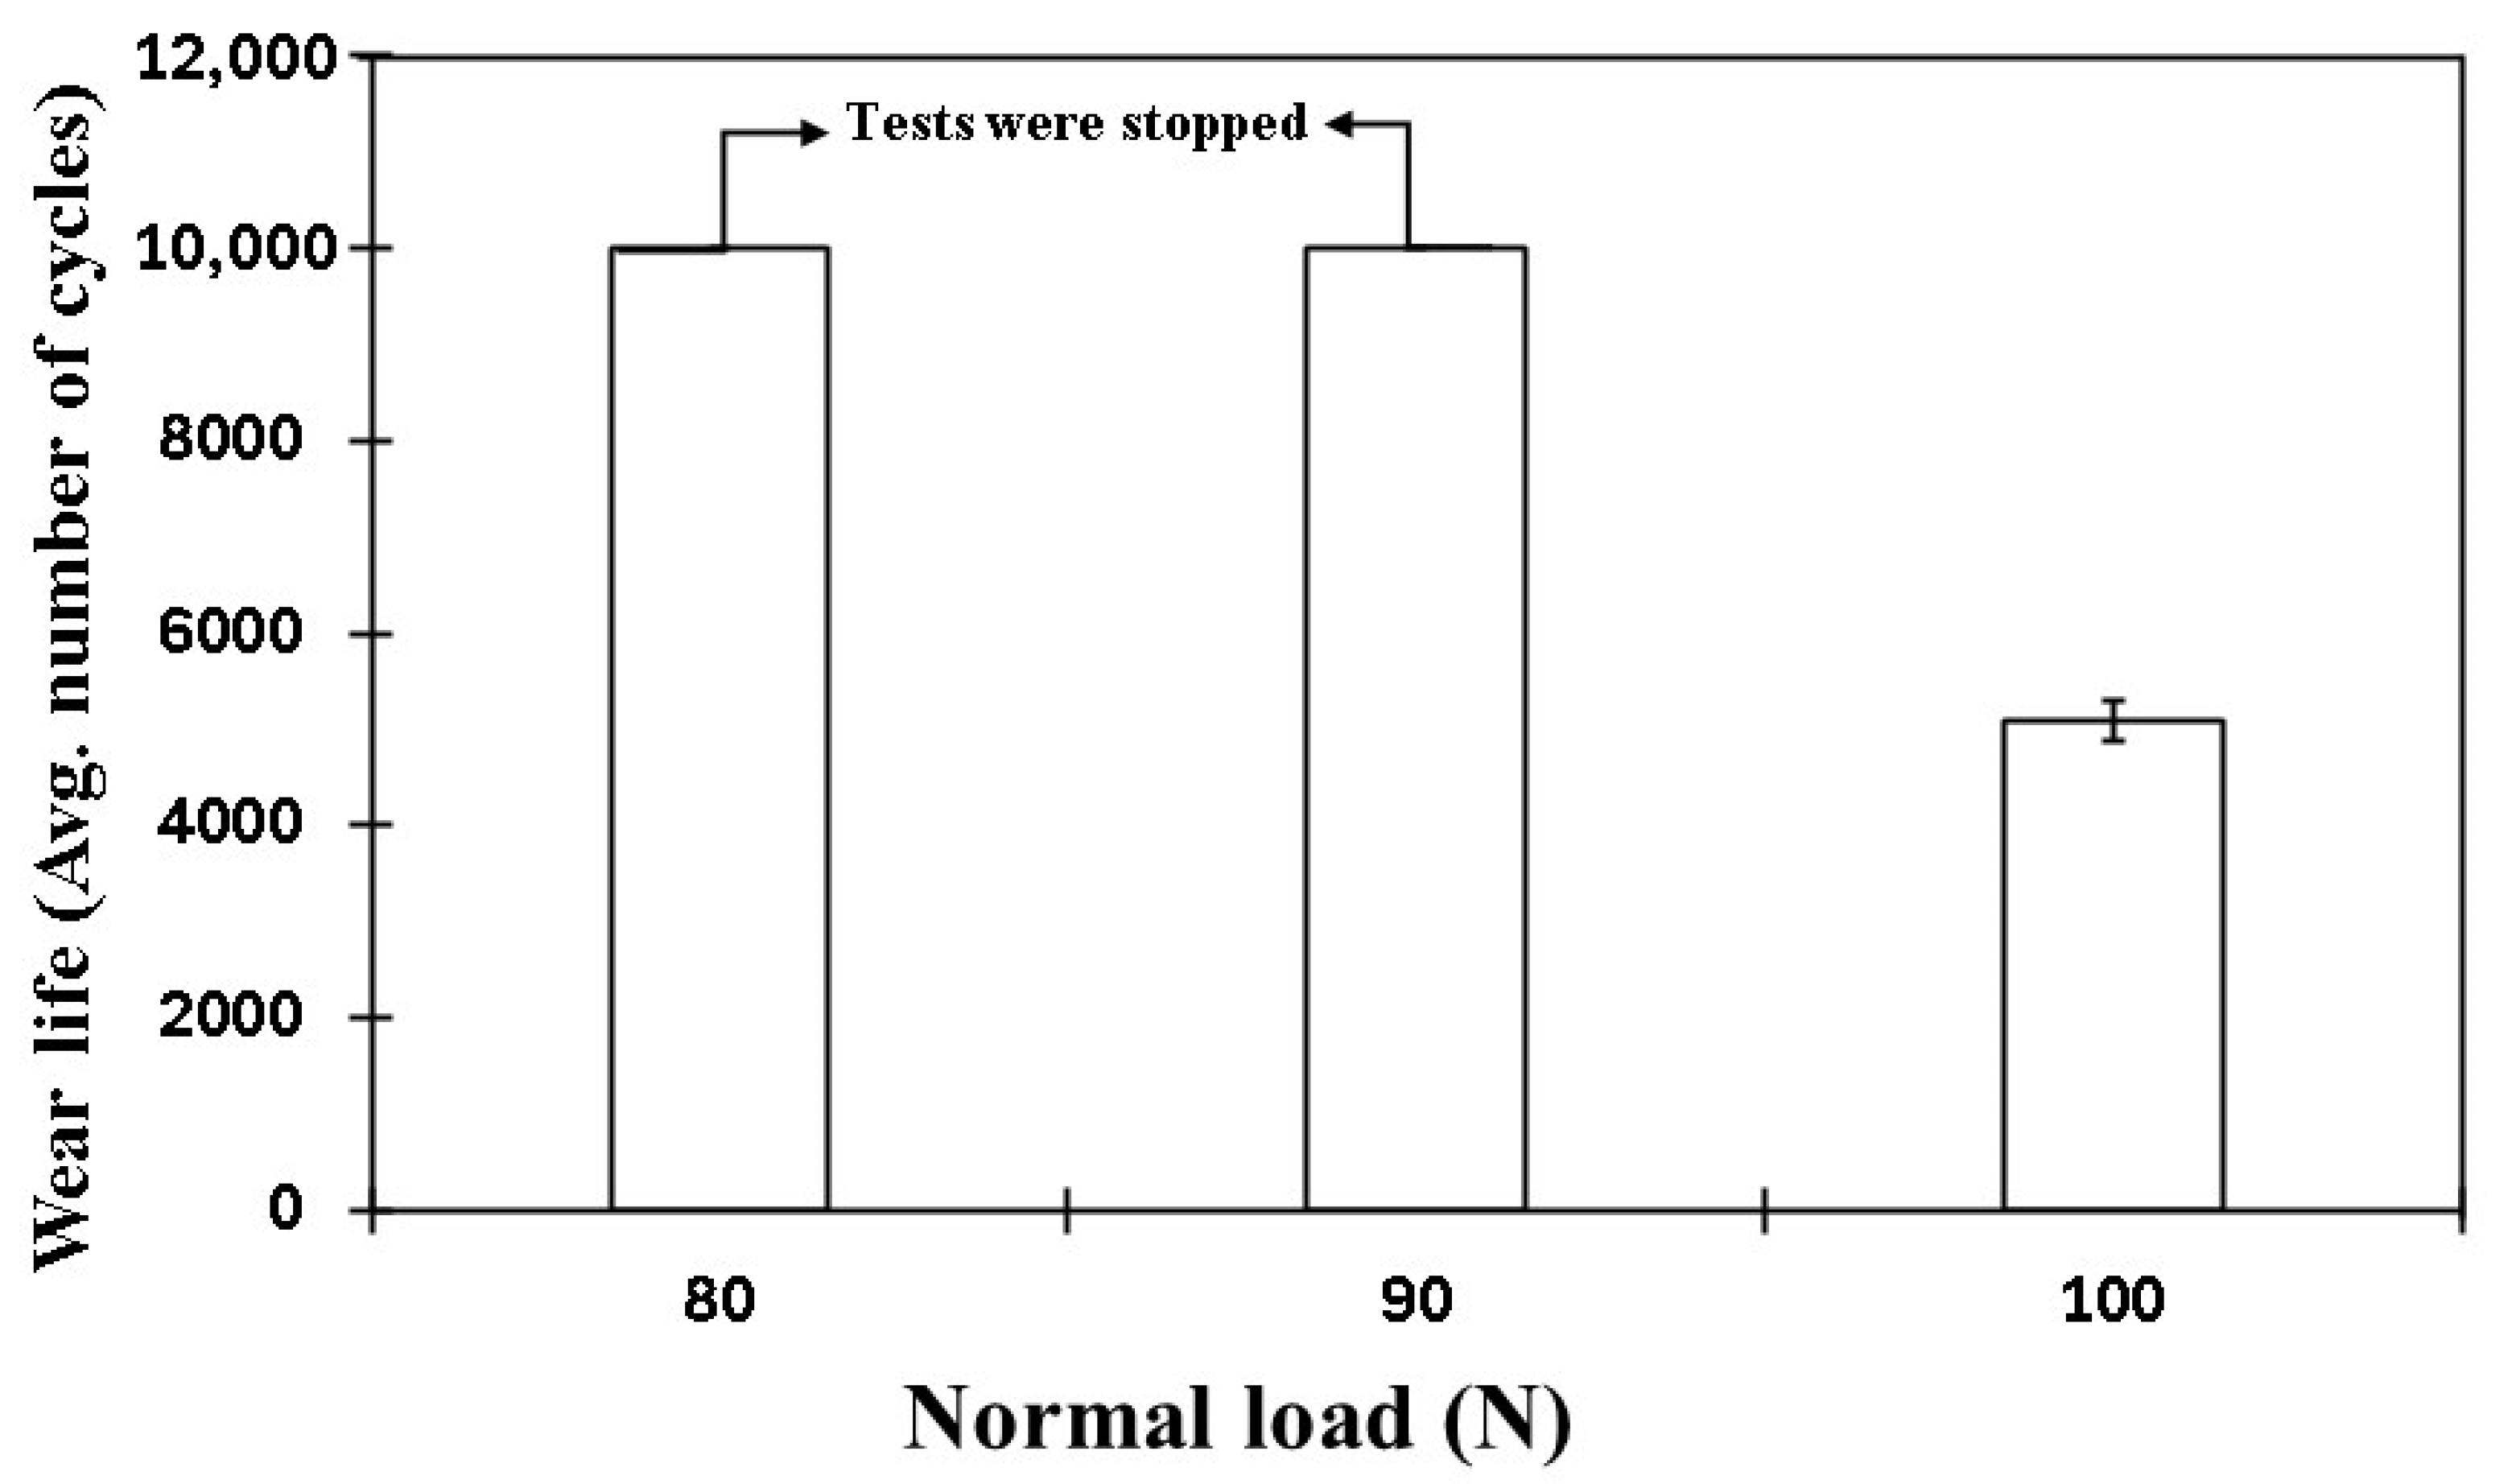
4.5.4. Effect of Normal Load on the Tribological Performance of PEEK/1.5 wt% Ceria Nanocomposite Coatings
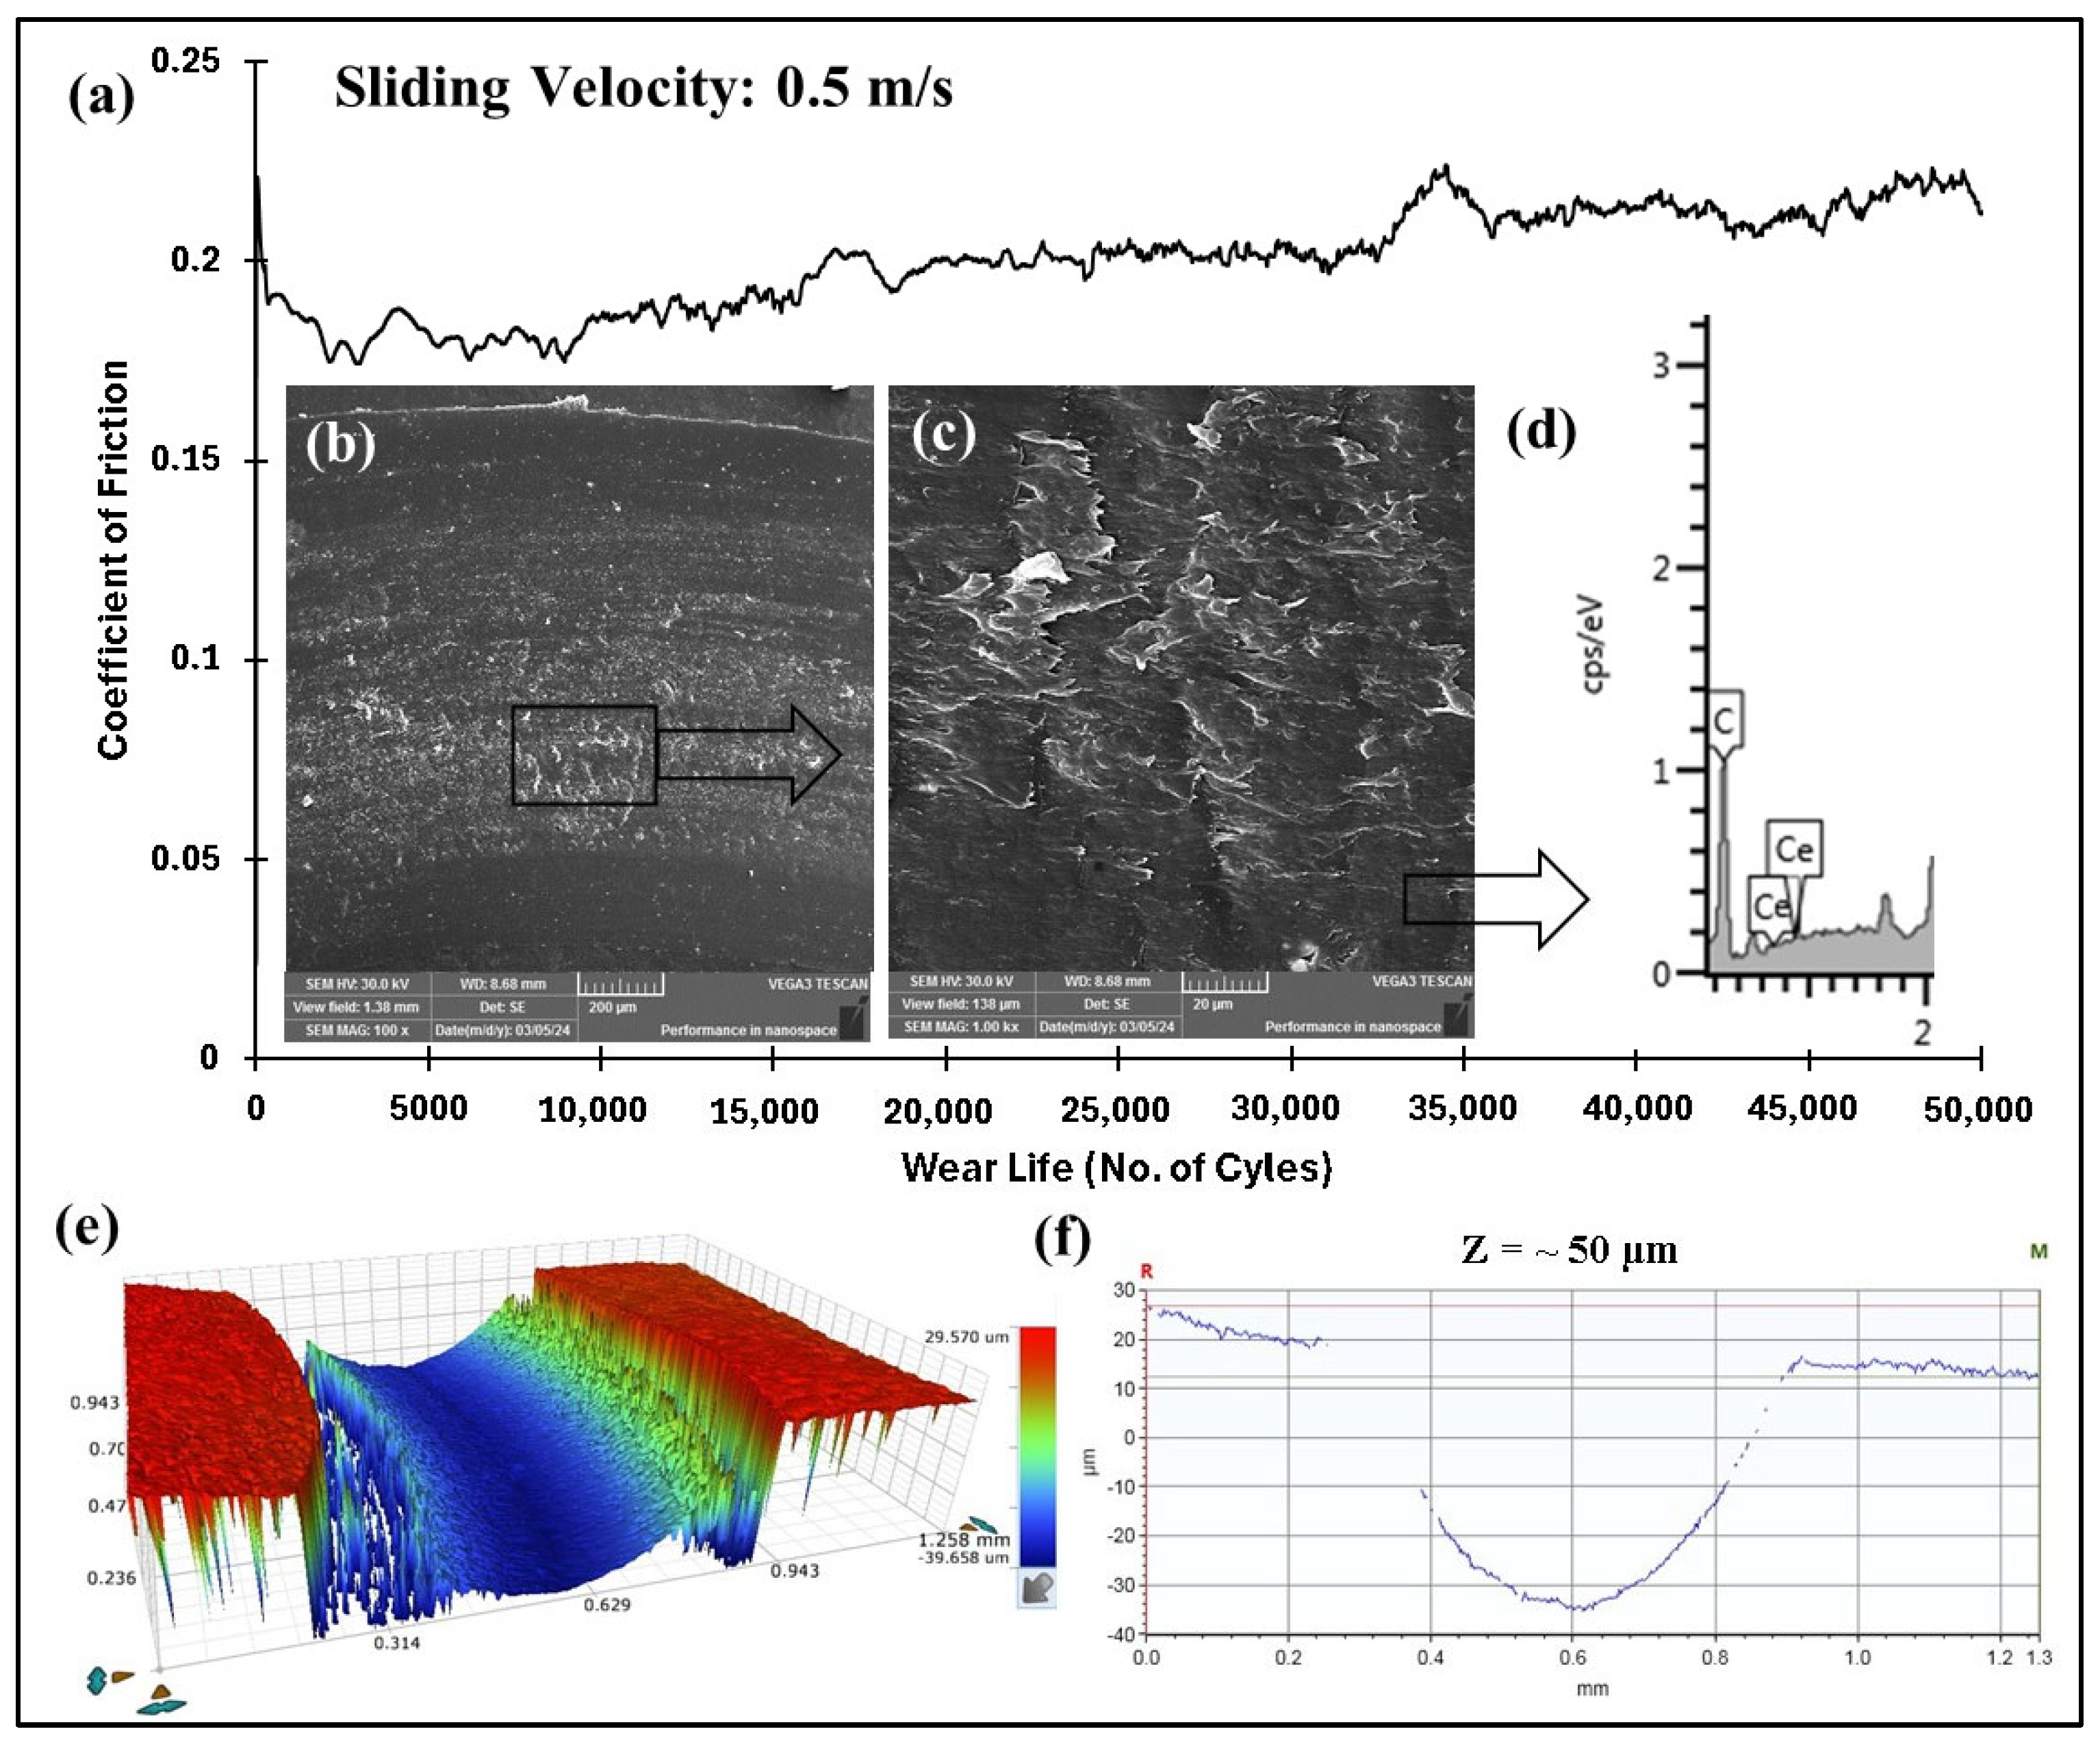
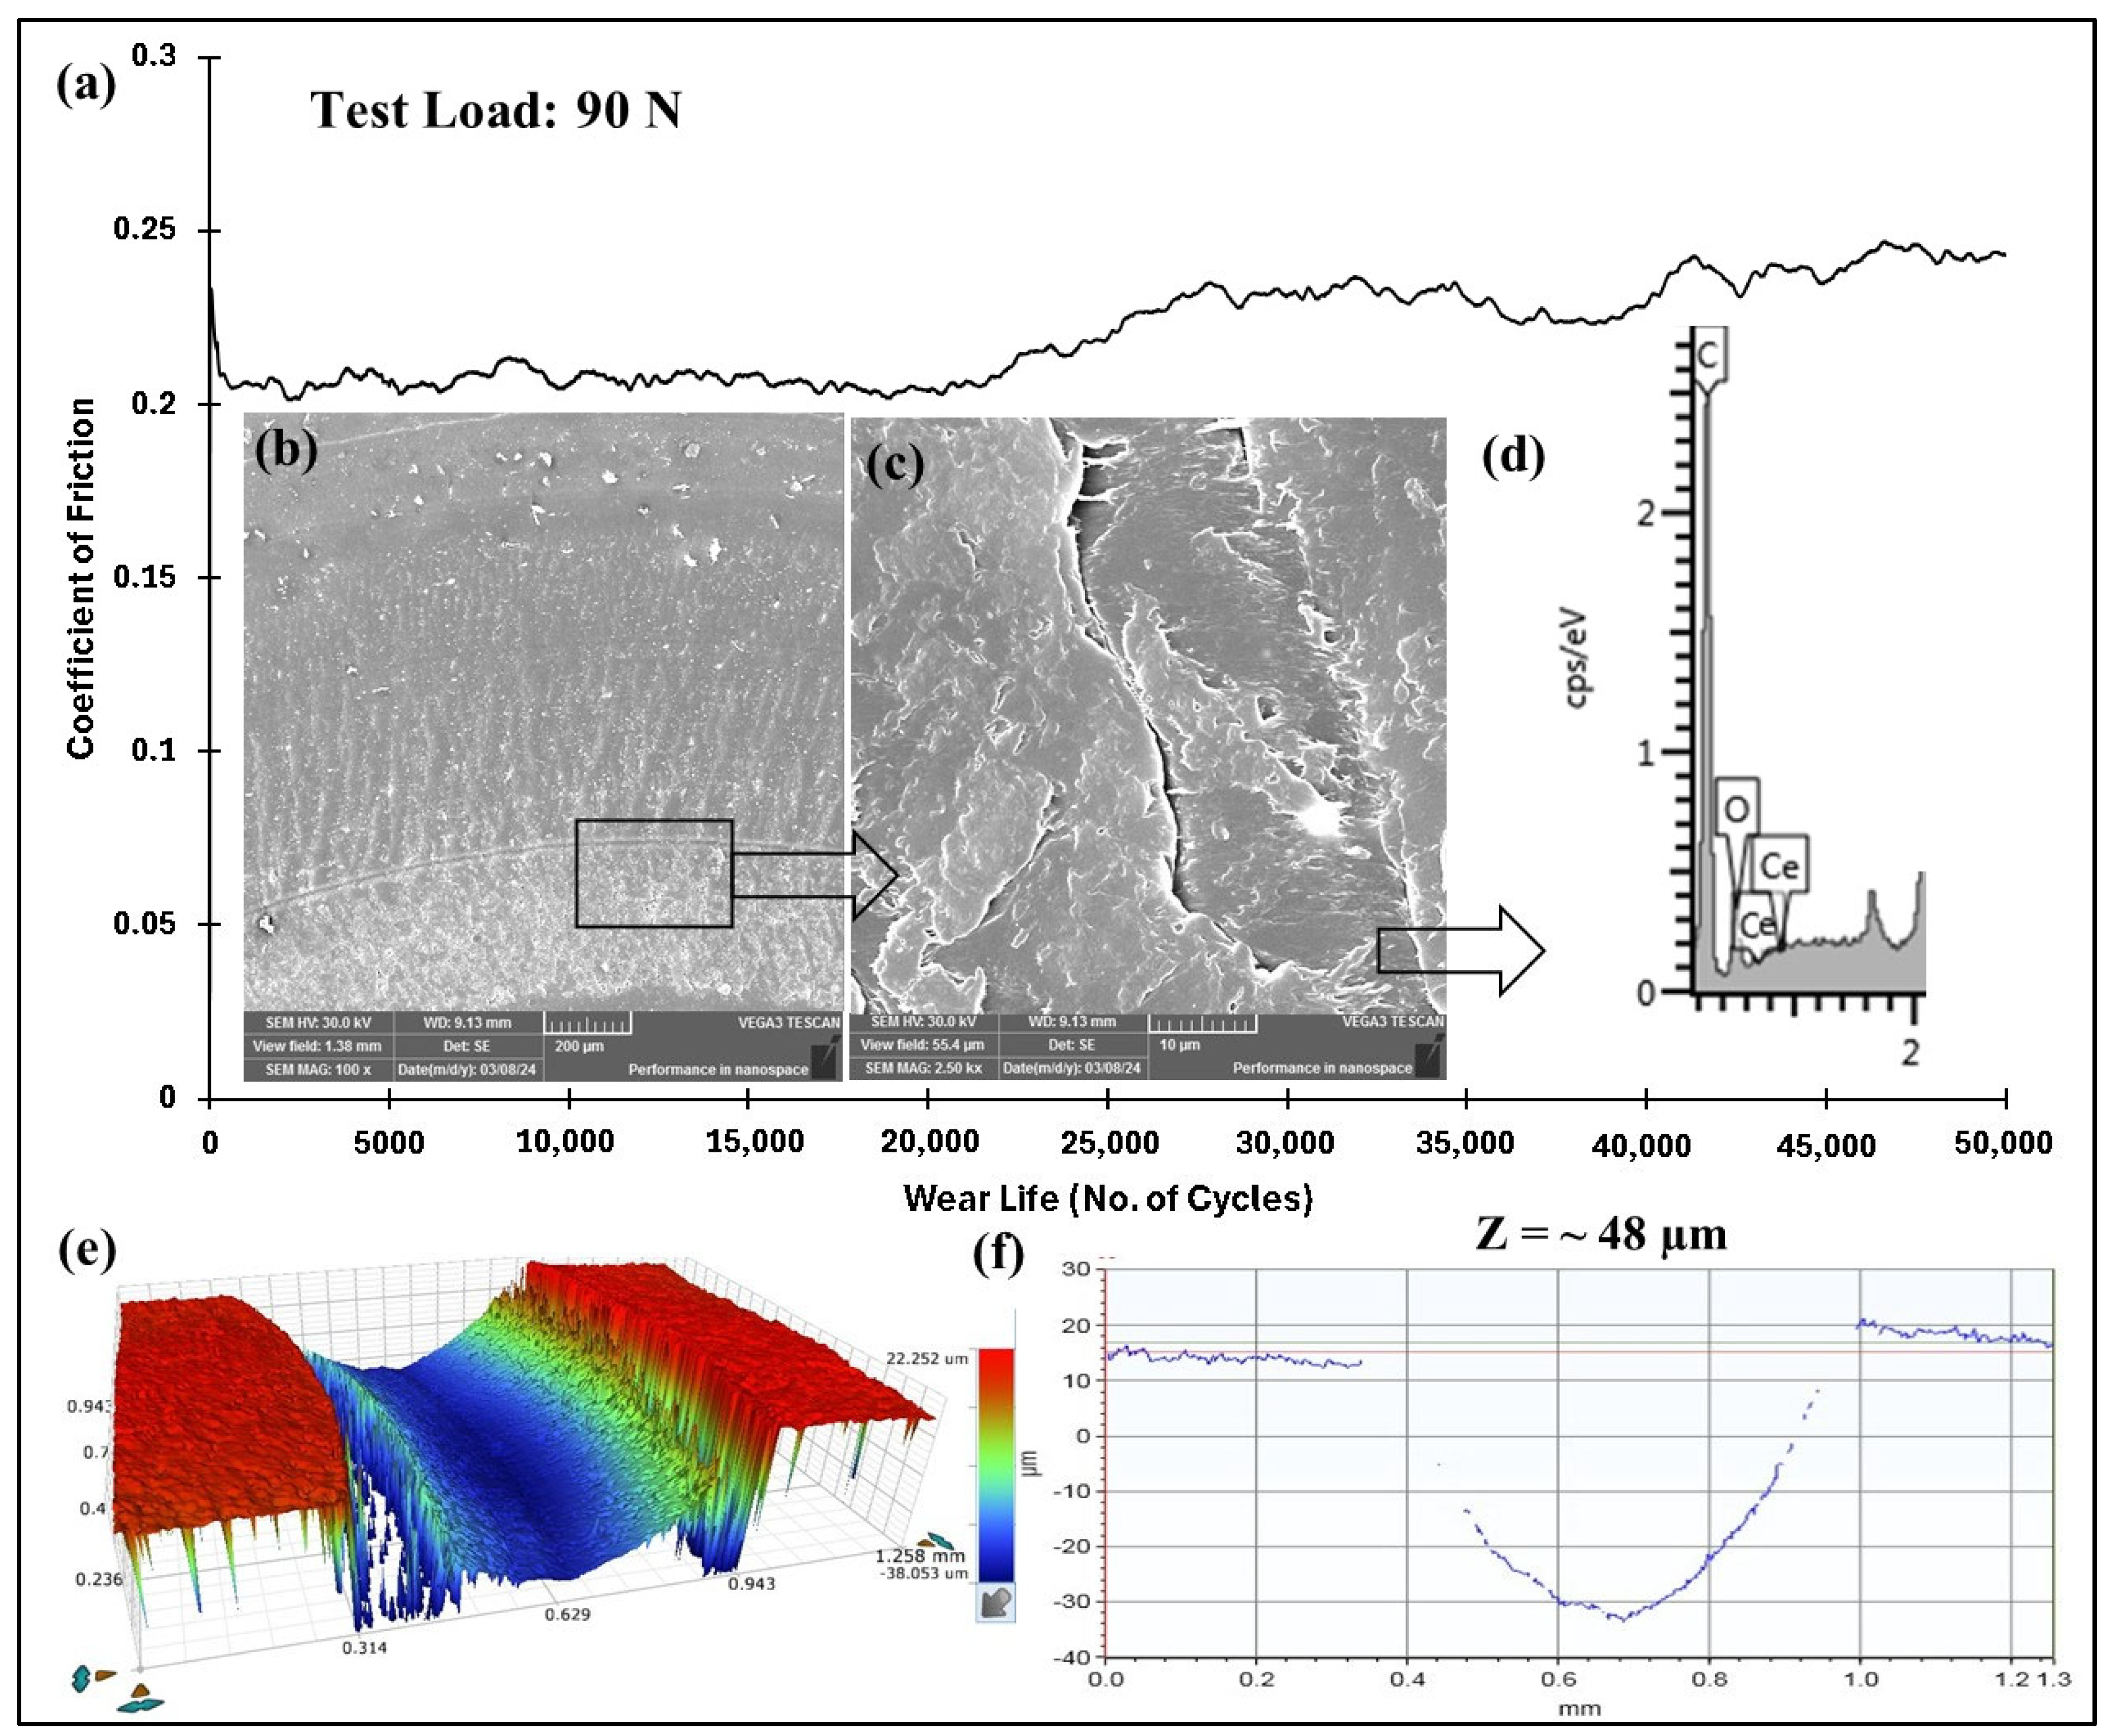
4.5.5. Accelerated Wear Life Testing of PEEK/1.5 wt% Ceria

| Ref. | Filler | Conc. (wt%) | Substrate | Counterface | Speed (m/s) | Load (N) | Distance (m) | Wear Track Radius (mm) | Thickness (µm) | COF | Sp. Wear Rate (10−6 mm3/Nm) |
|---|---|---|---|---|---|---|---|---|---|---|---|
| [21] | Teflon (PTFE) | 3 | Stainless steel | 100Cr6 ball | NA | 10 | 697 | 3 | 200 | 0.133 | 38 |
| [26] | Silicon dioxide (SiO2) | 10 | Plain C steel | Steel pin | 0.13 | 11 | 1000 | NA | 150 | 0.56 | 40 |
| [52] | Carbon fiber (CF) | 10 | Stainless steel | Ceramic ball | 0.2 | 7 | 1512 | NA | 150–200 | 0.4 | 75 |
| [23] | Silicon carbide (SiC) | 7 | Aluminium | 100Cr6 ball | 1.4 | 9 | 2000 | NA | 40 | 0.27 | 20 |
| [53] | Hexagonal boron nitride (h-BN) | 1.5 | Low-carbon steel | Steel ball | 0.1 | 25 | 1000 | 8 | 200 | 0.27 | 20 |
| [54] | Alumina (Al2O3) | 1.5 | Titanium alloy | Alumina ball | 0.07 | 5 | 1000 | 6 | 120 | 0.29 | 1.9 |
| [55] | Titanium nitride (TiN) | 1.3 | Titanium alloy | Alumina ball | 0.04 | 5 | 2000 | 3 | 120 | 0.3 | 1.1 |
| * | Cerium dioxide (CeO2) | 1.5 | Mild steel | Alumina ball | 0.4 | 90 | 1000 | 3 | 100 | 0.22 | 2.042 |
| 0.5 | 70 | 0.201 | 2.692 |
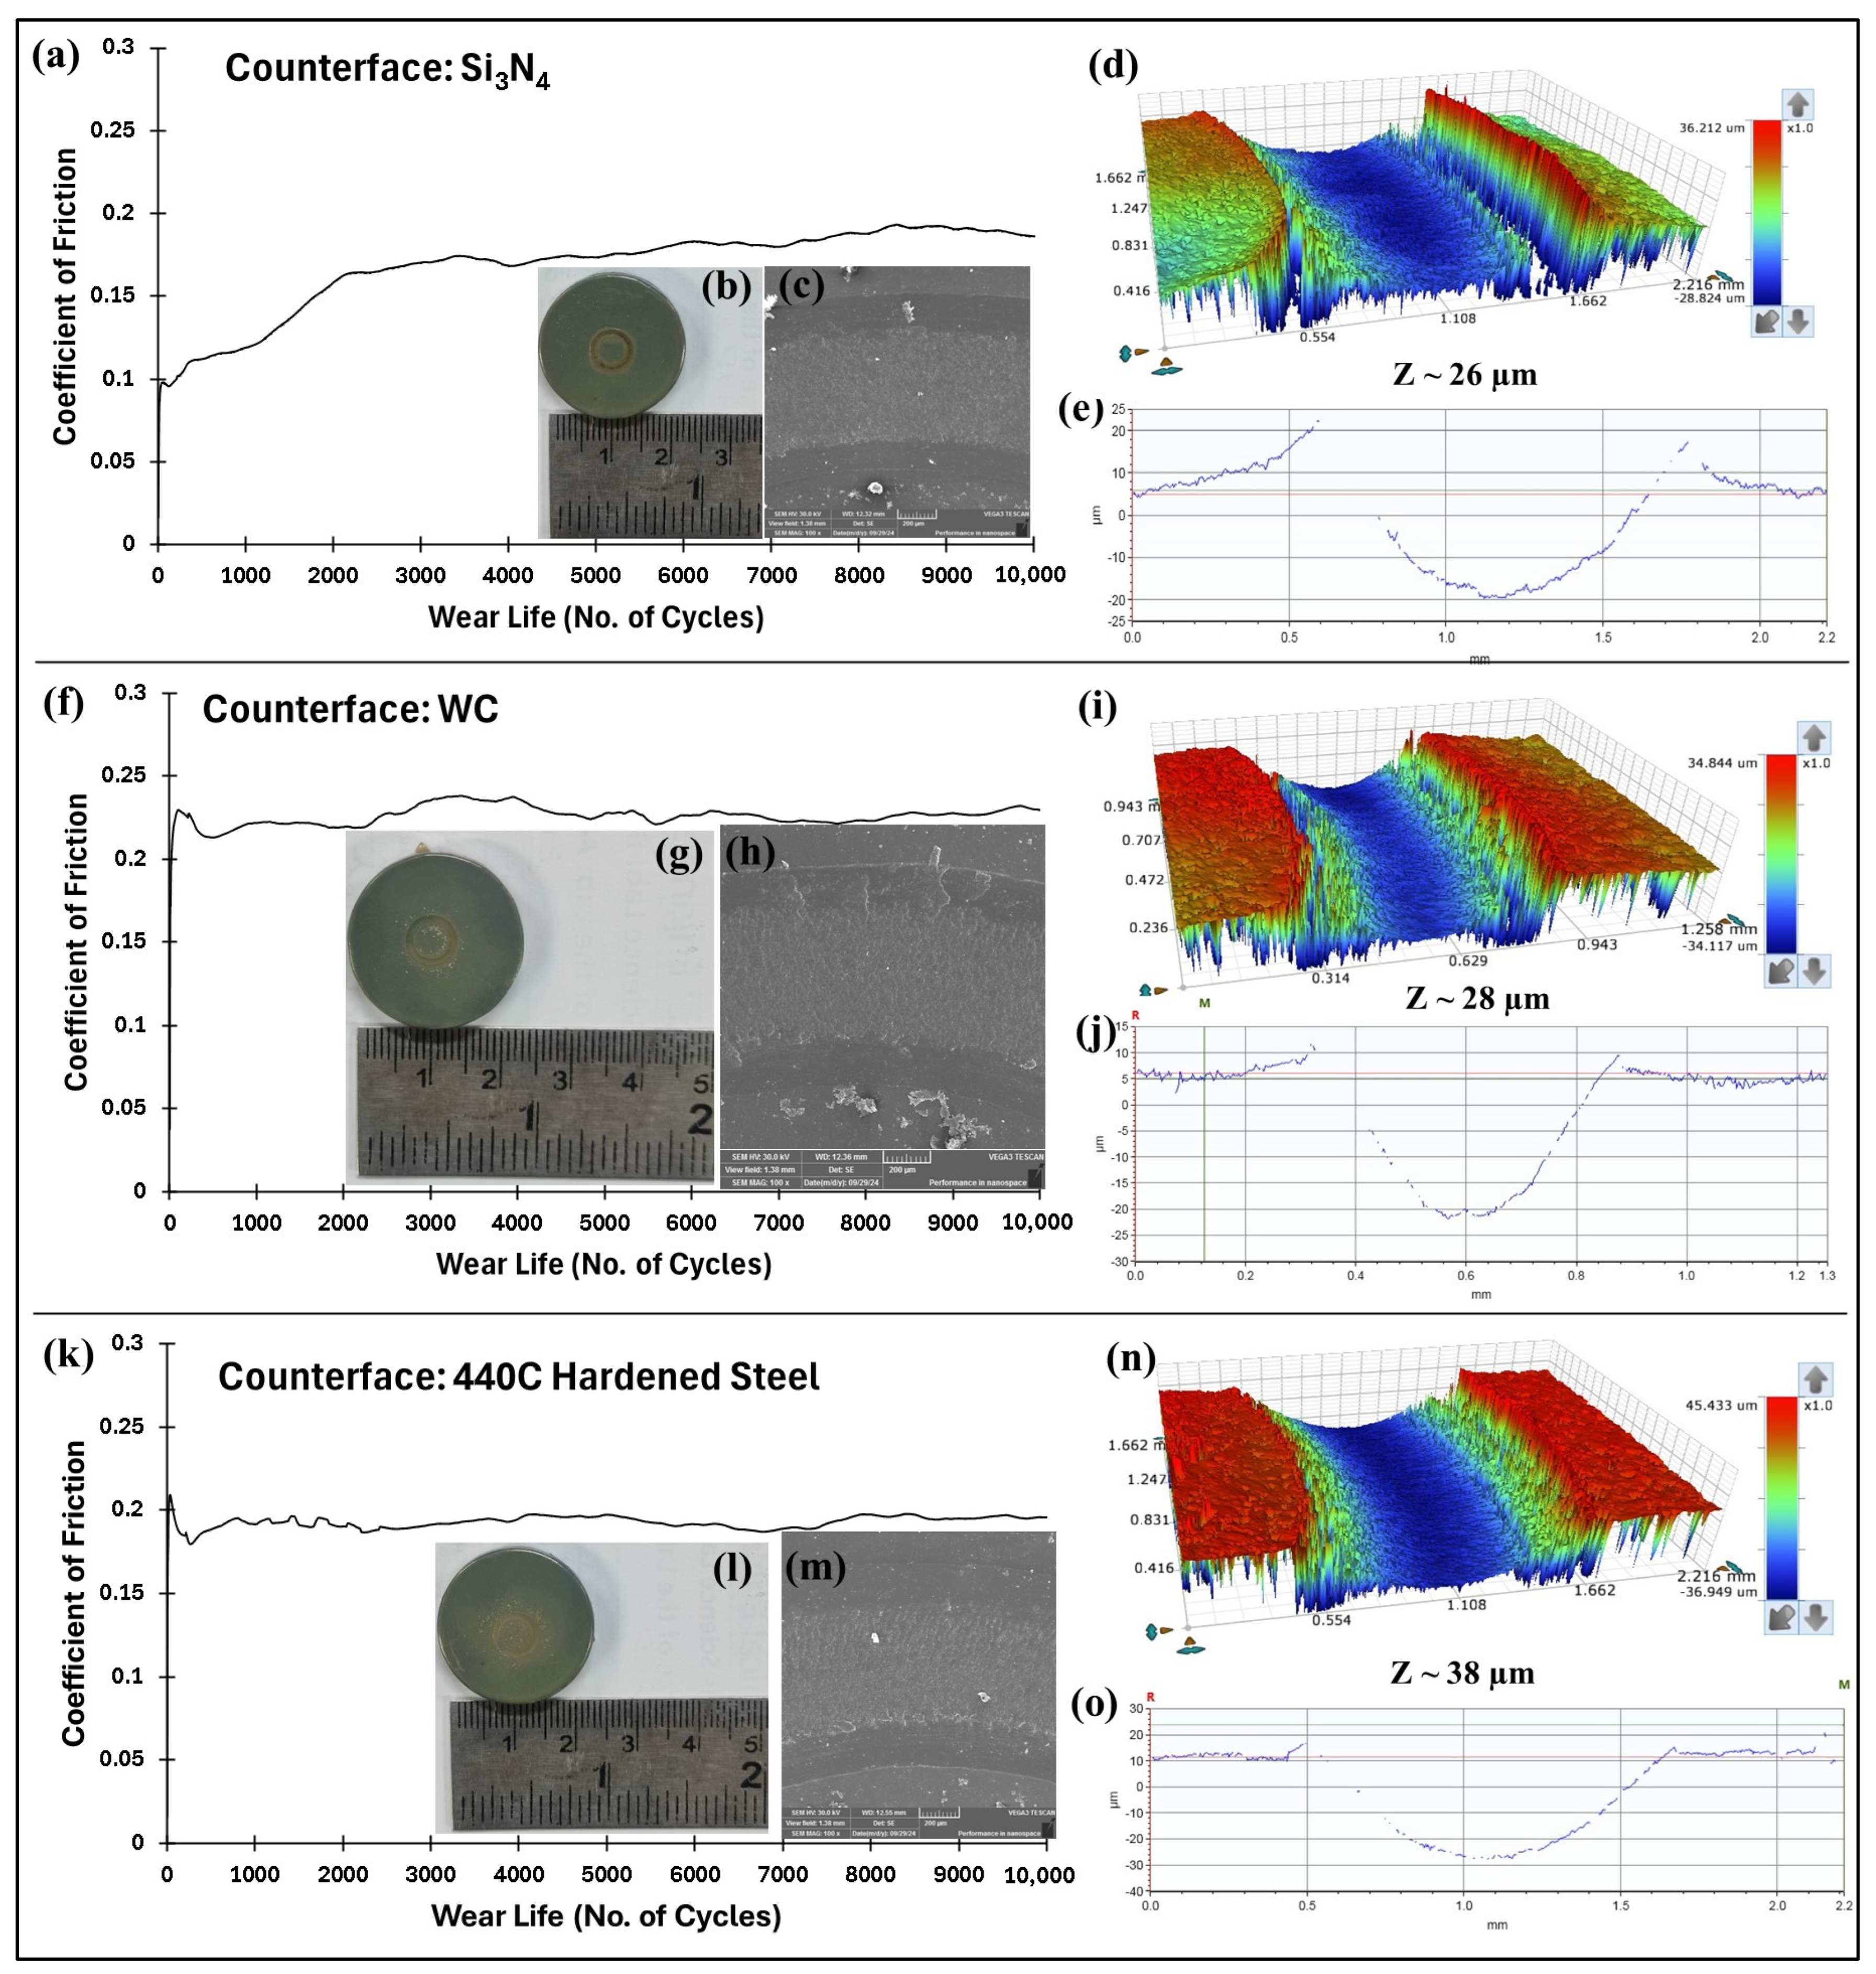
4.6. Effect of Different Counterfaces on the Tribological Performance of the Optimized PEEK/1.5 wt% Ceria Nanocomposite Coatings
4.7. Analysis of UV Radiation Tests on the PEEK Coatings
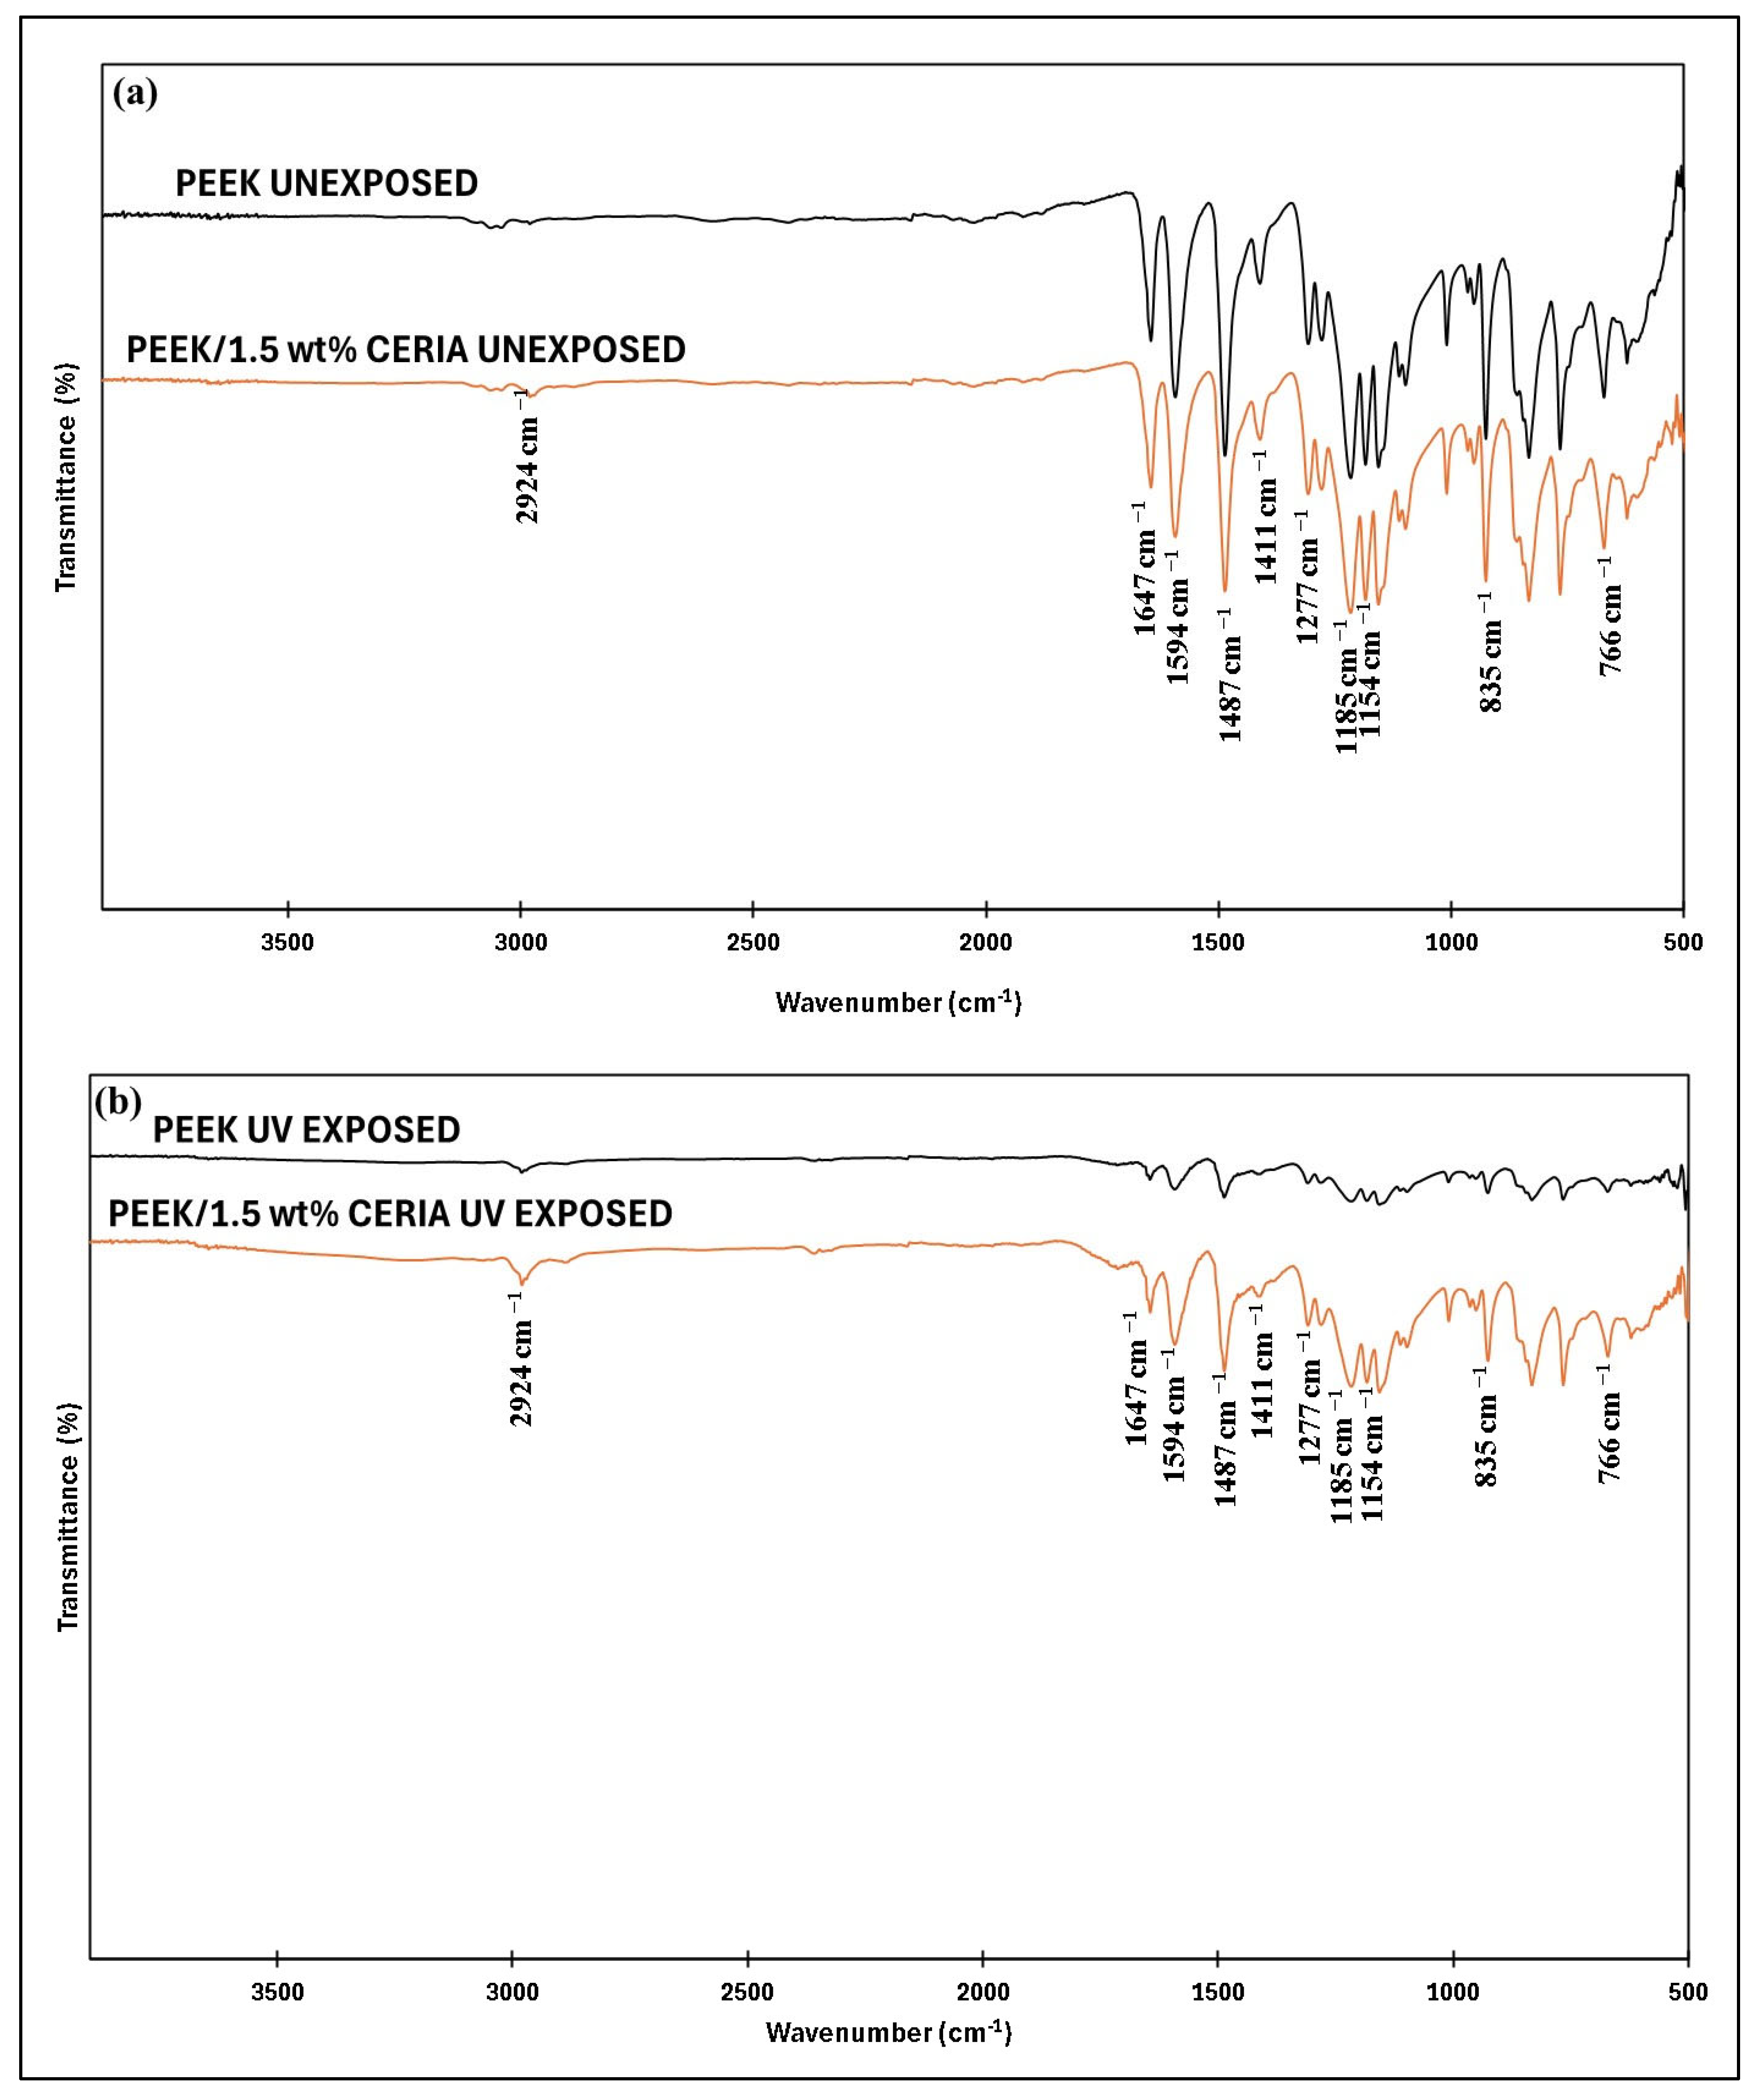
4.7.1. FTIR Analysis of the PEEK and PEEK/1.5 wt% Ceria Nanocomposite Coating Exposed to UV Radiation
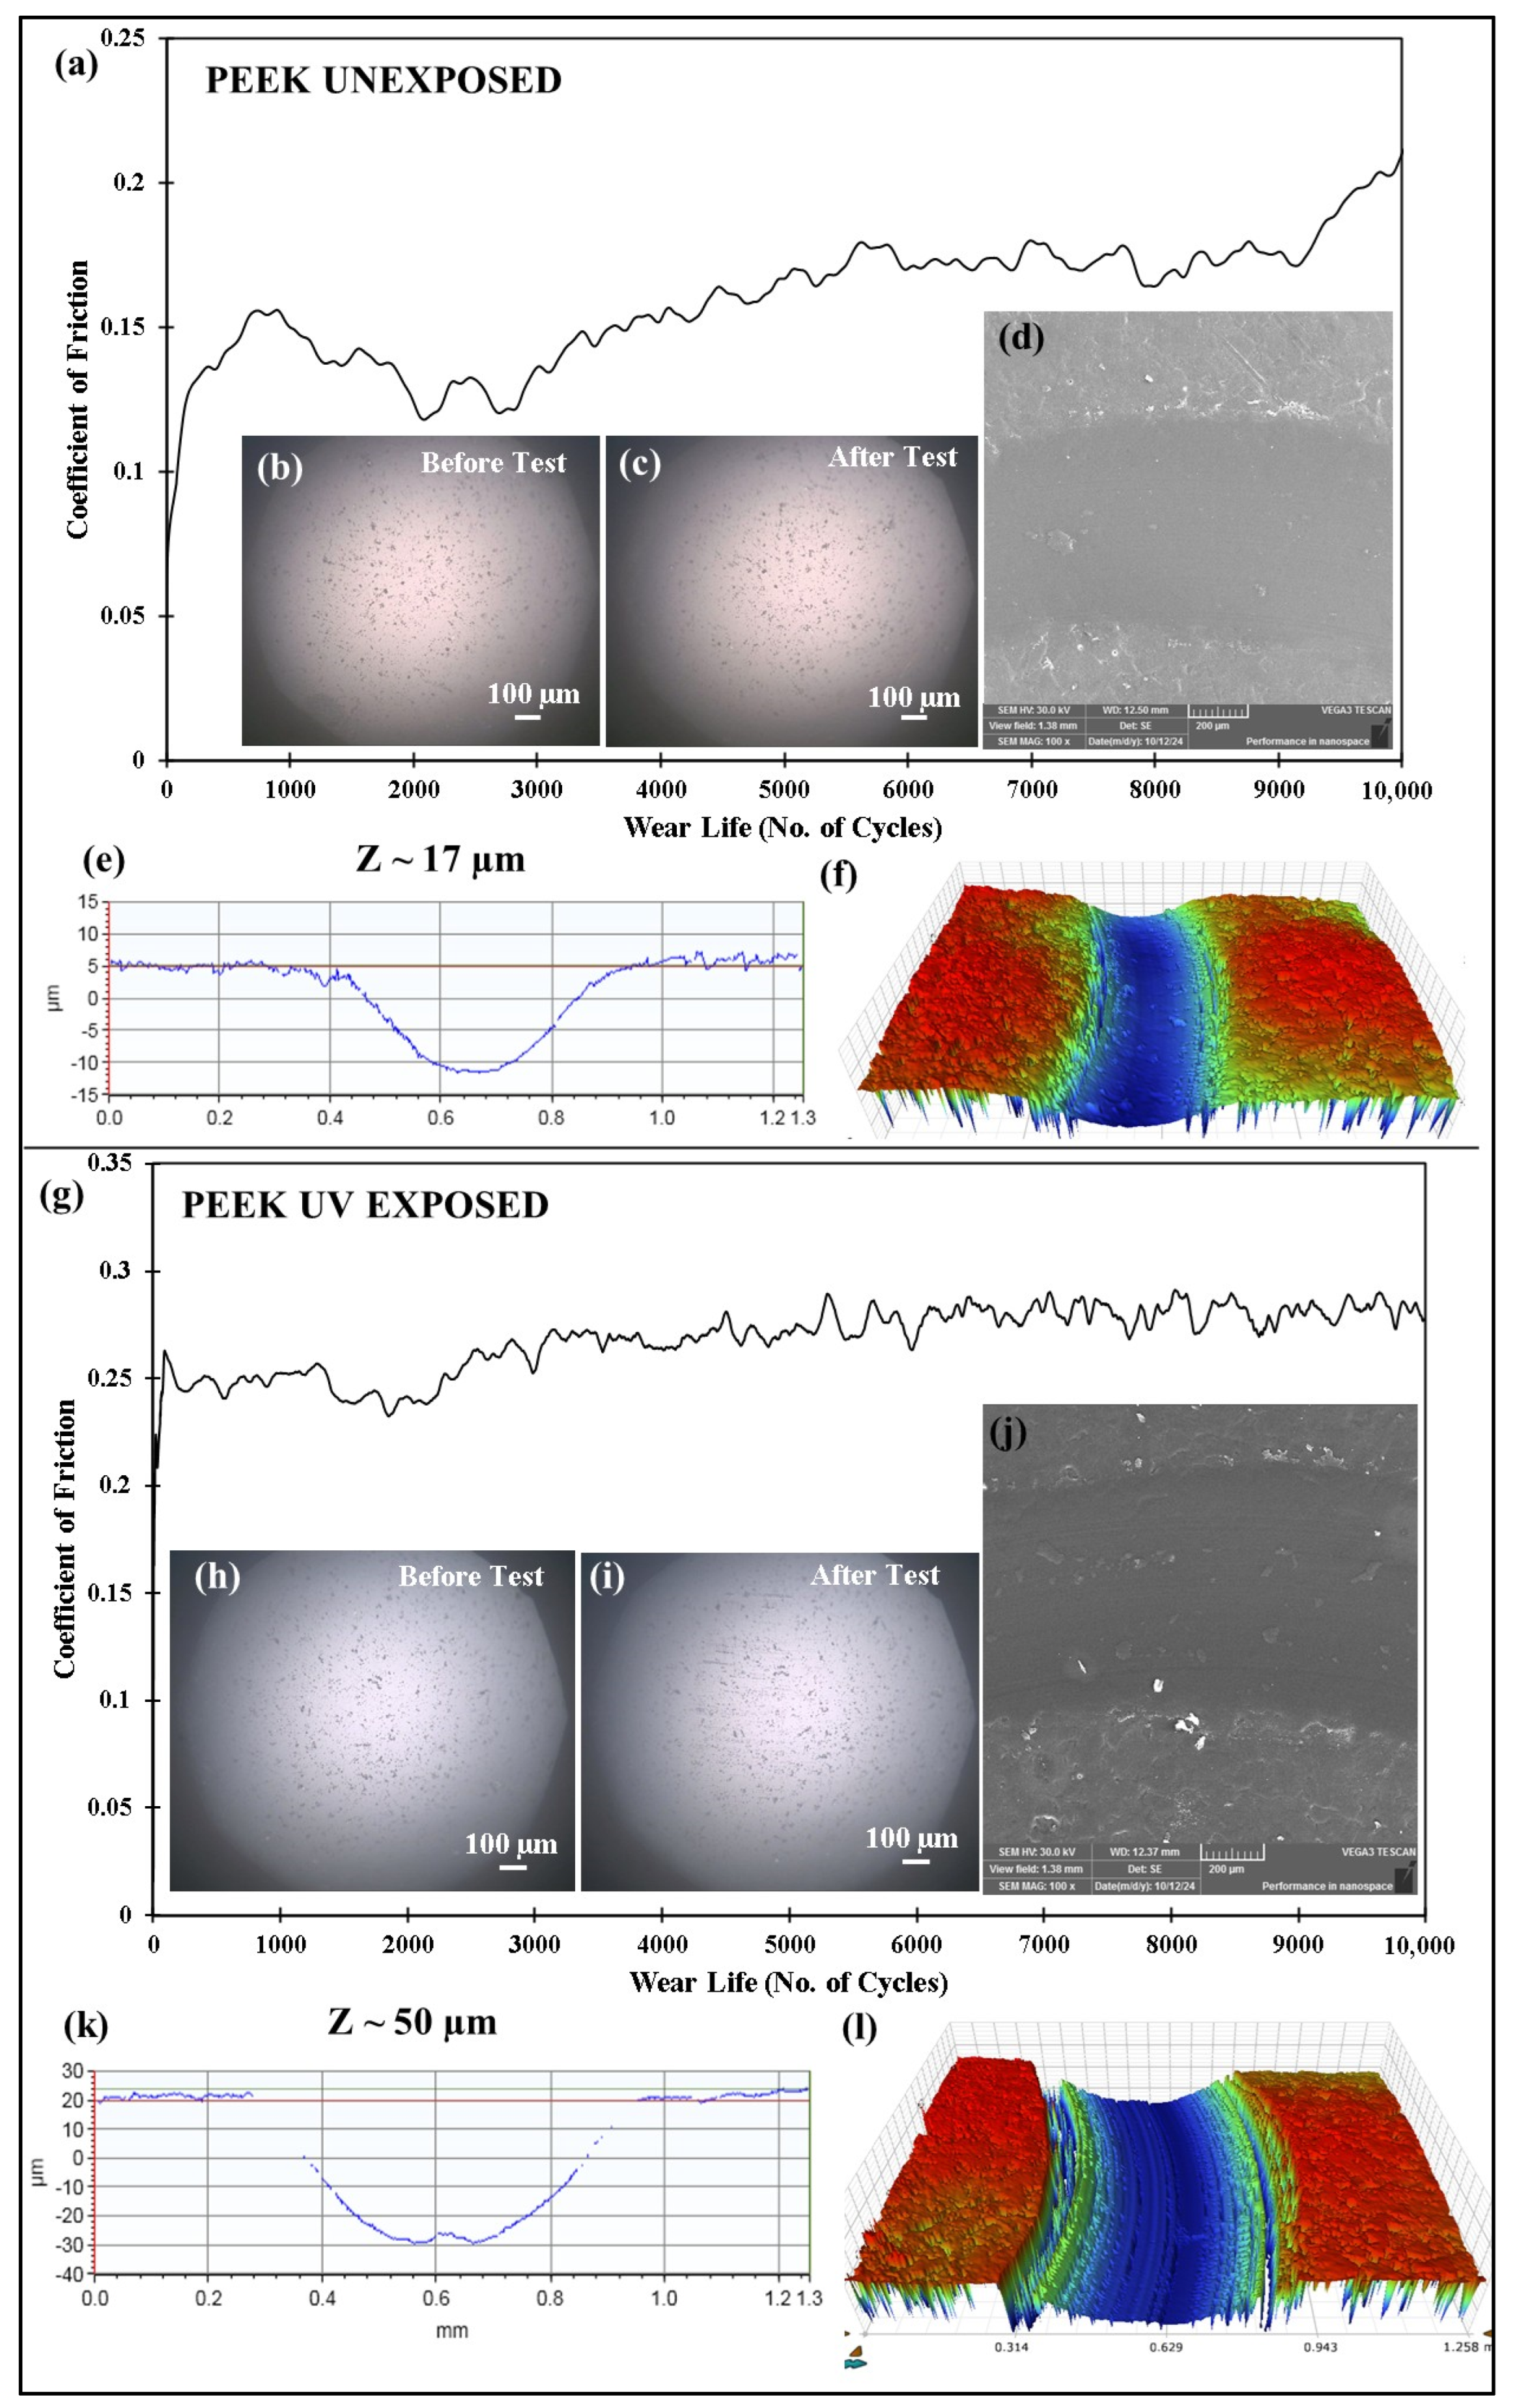
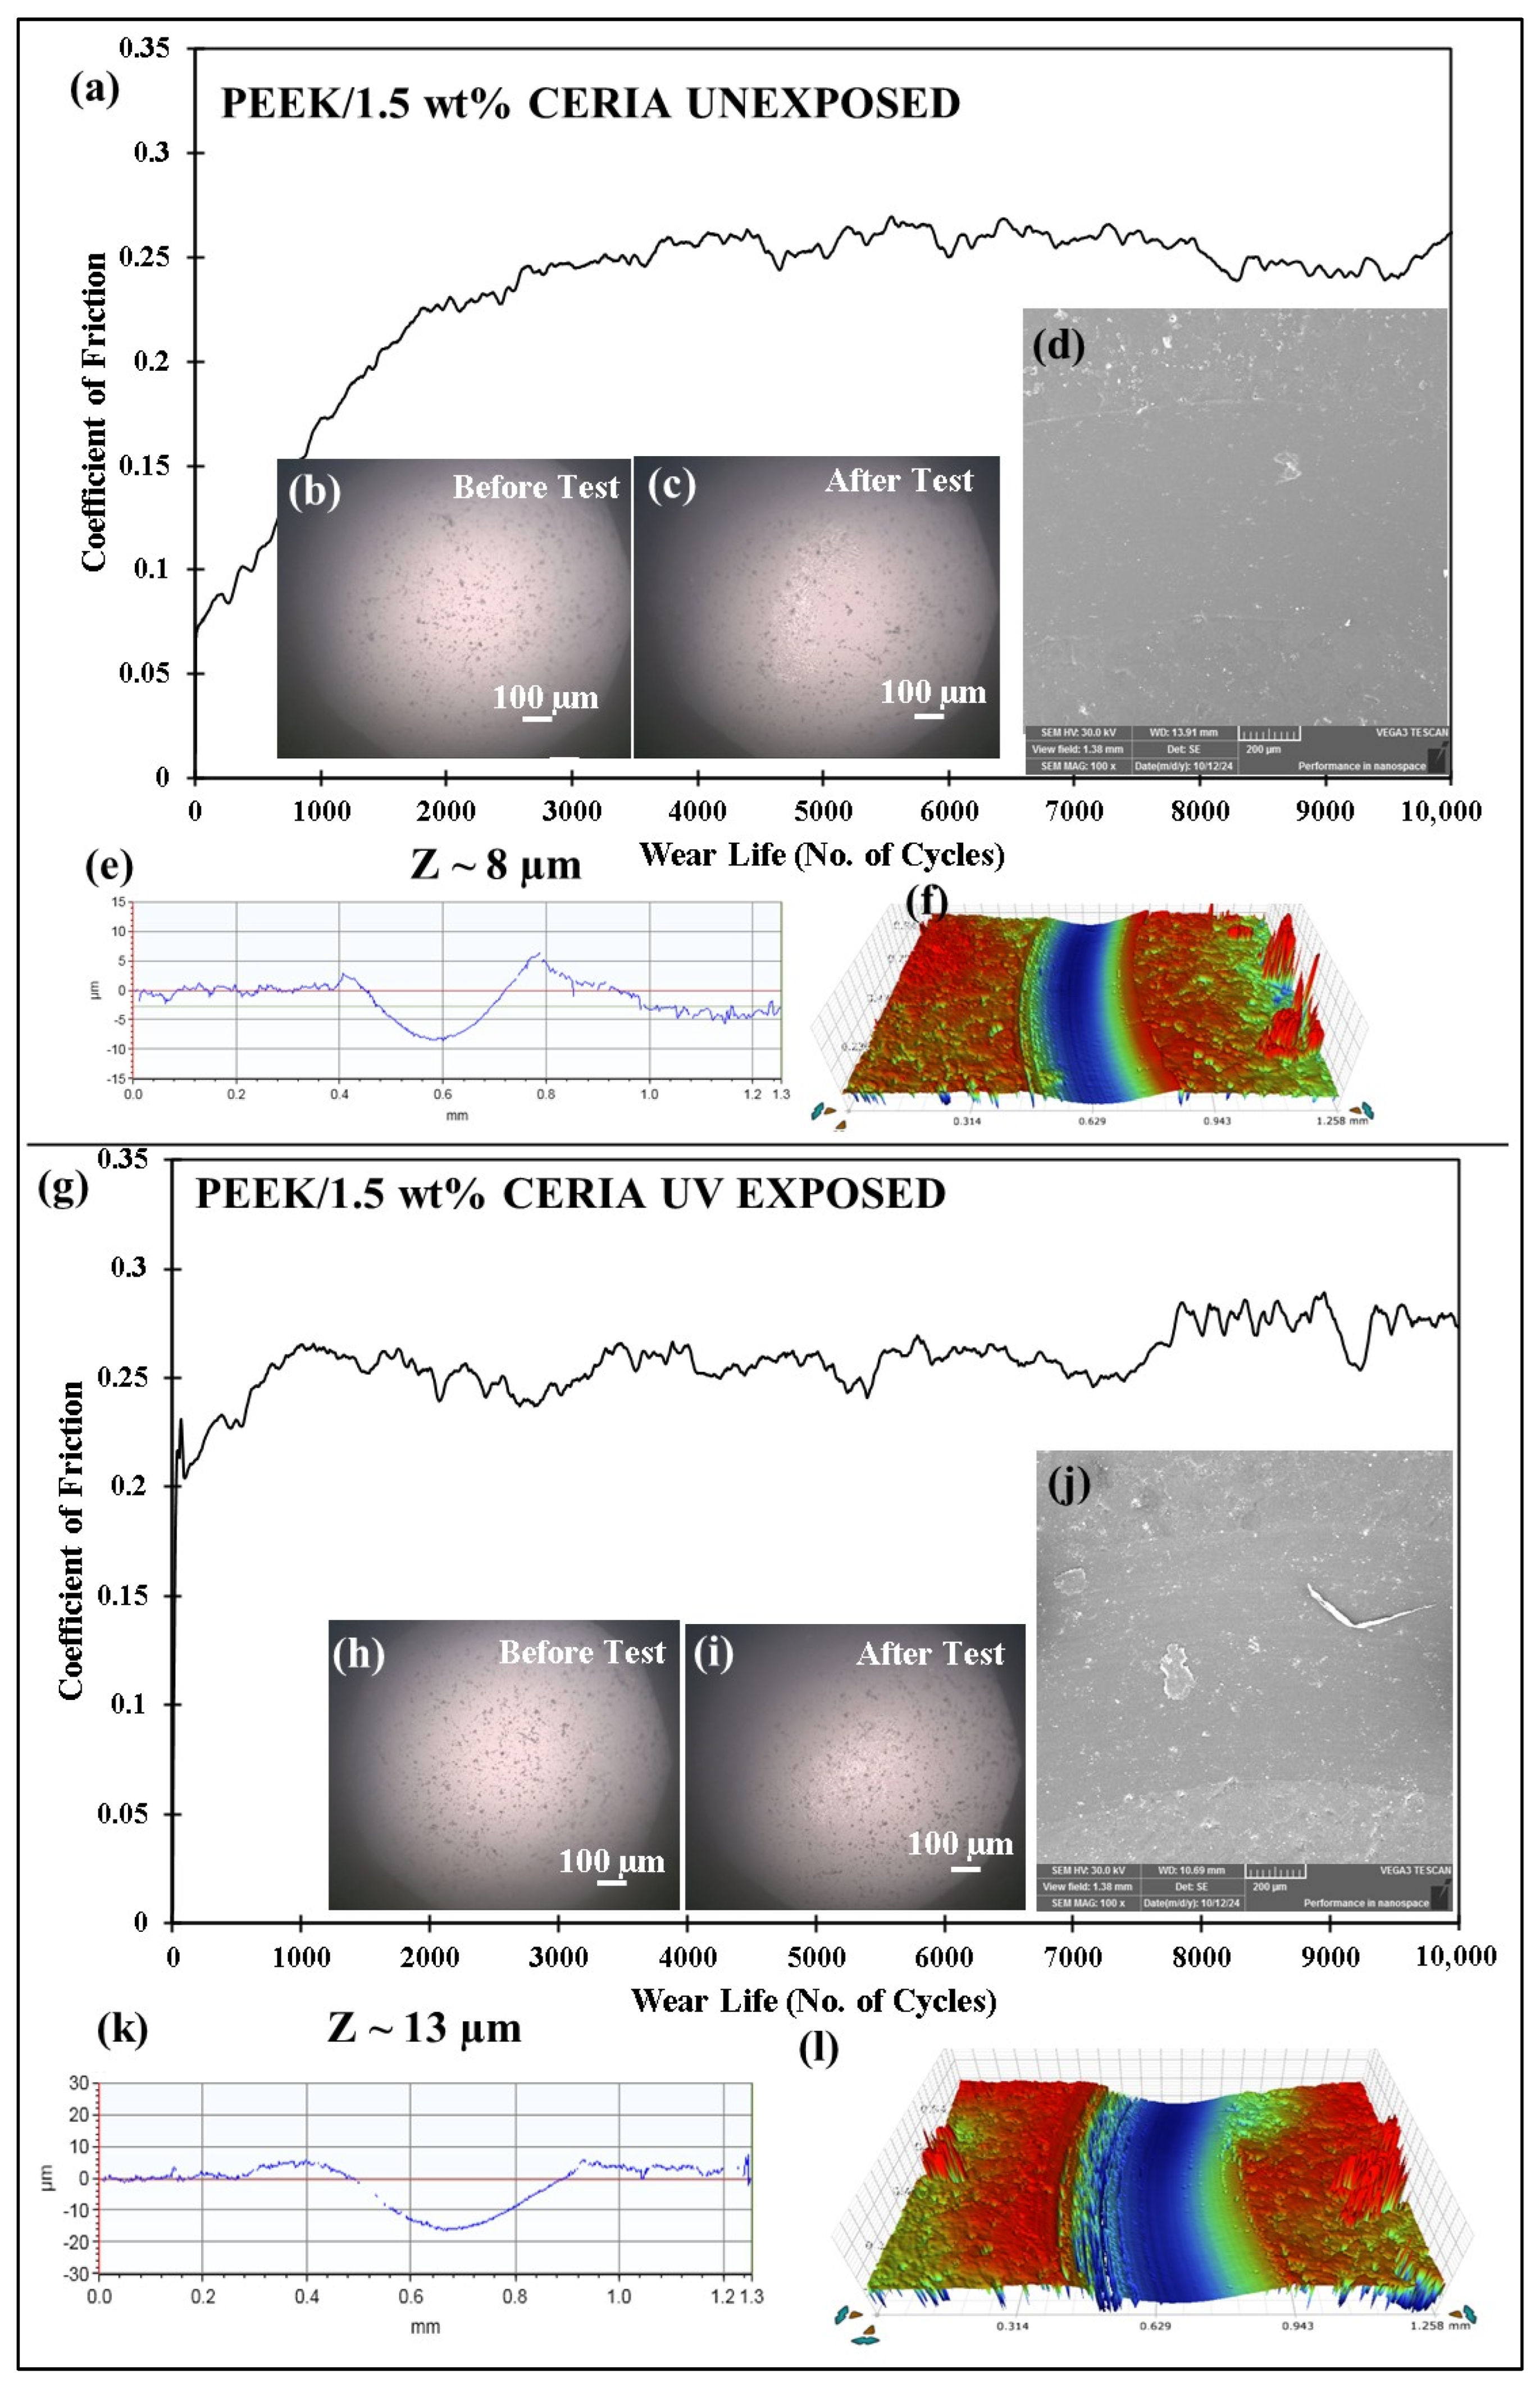
4.7.2. Tribological Performance of Pristine PEEK and Optimized PEEK/1.5 wt% Ceria Nanocomposite Coatings Before and After Exposure to UV Radiation
5. Conclusions
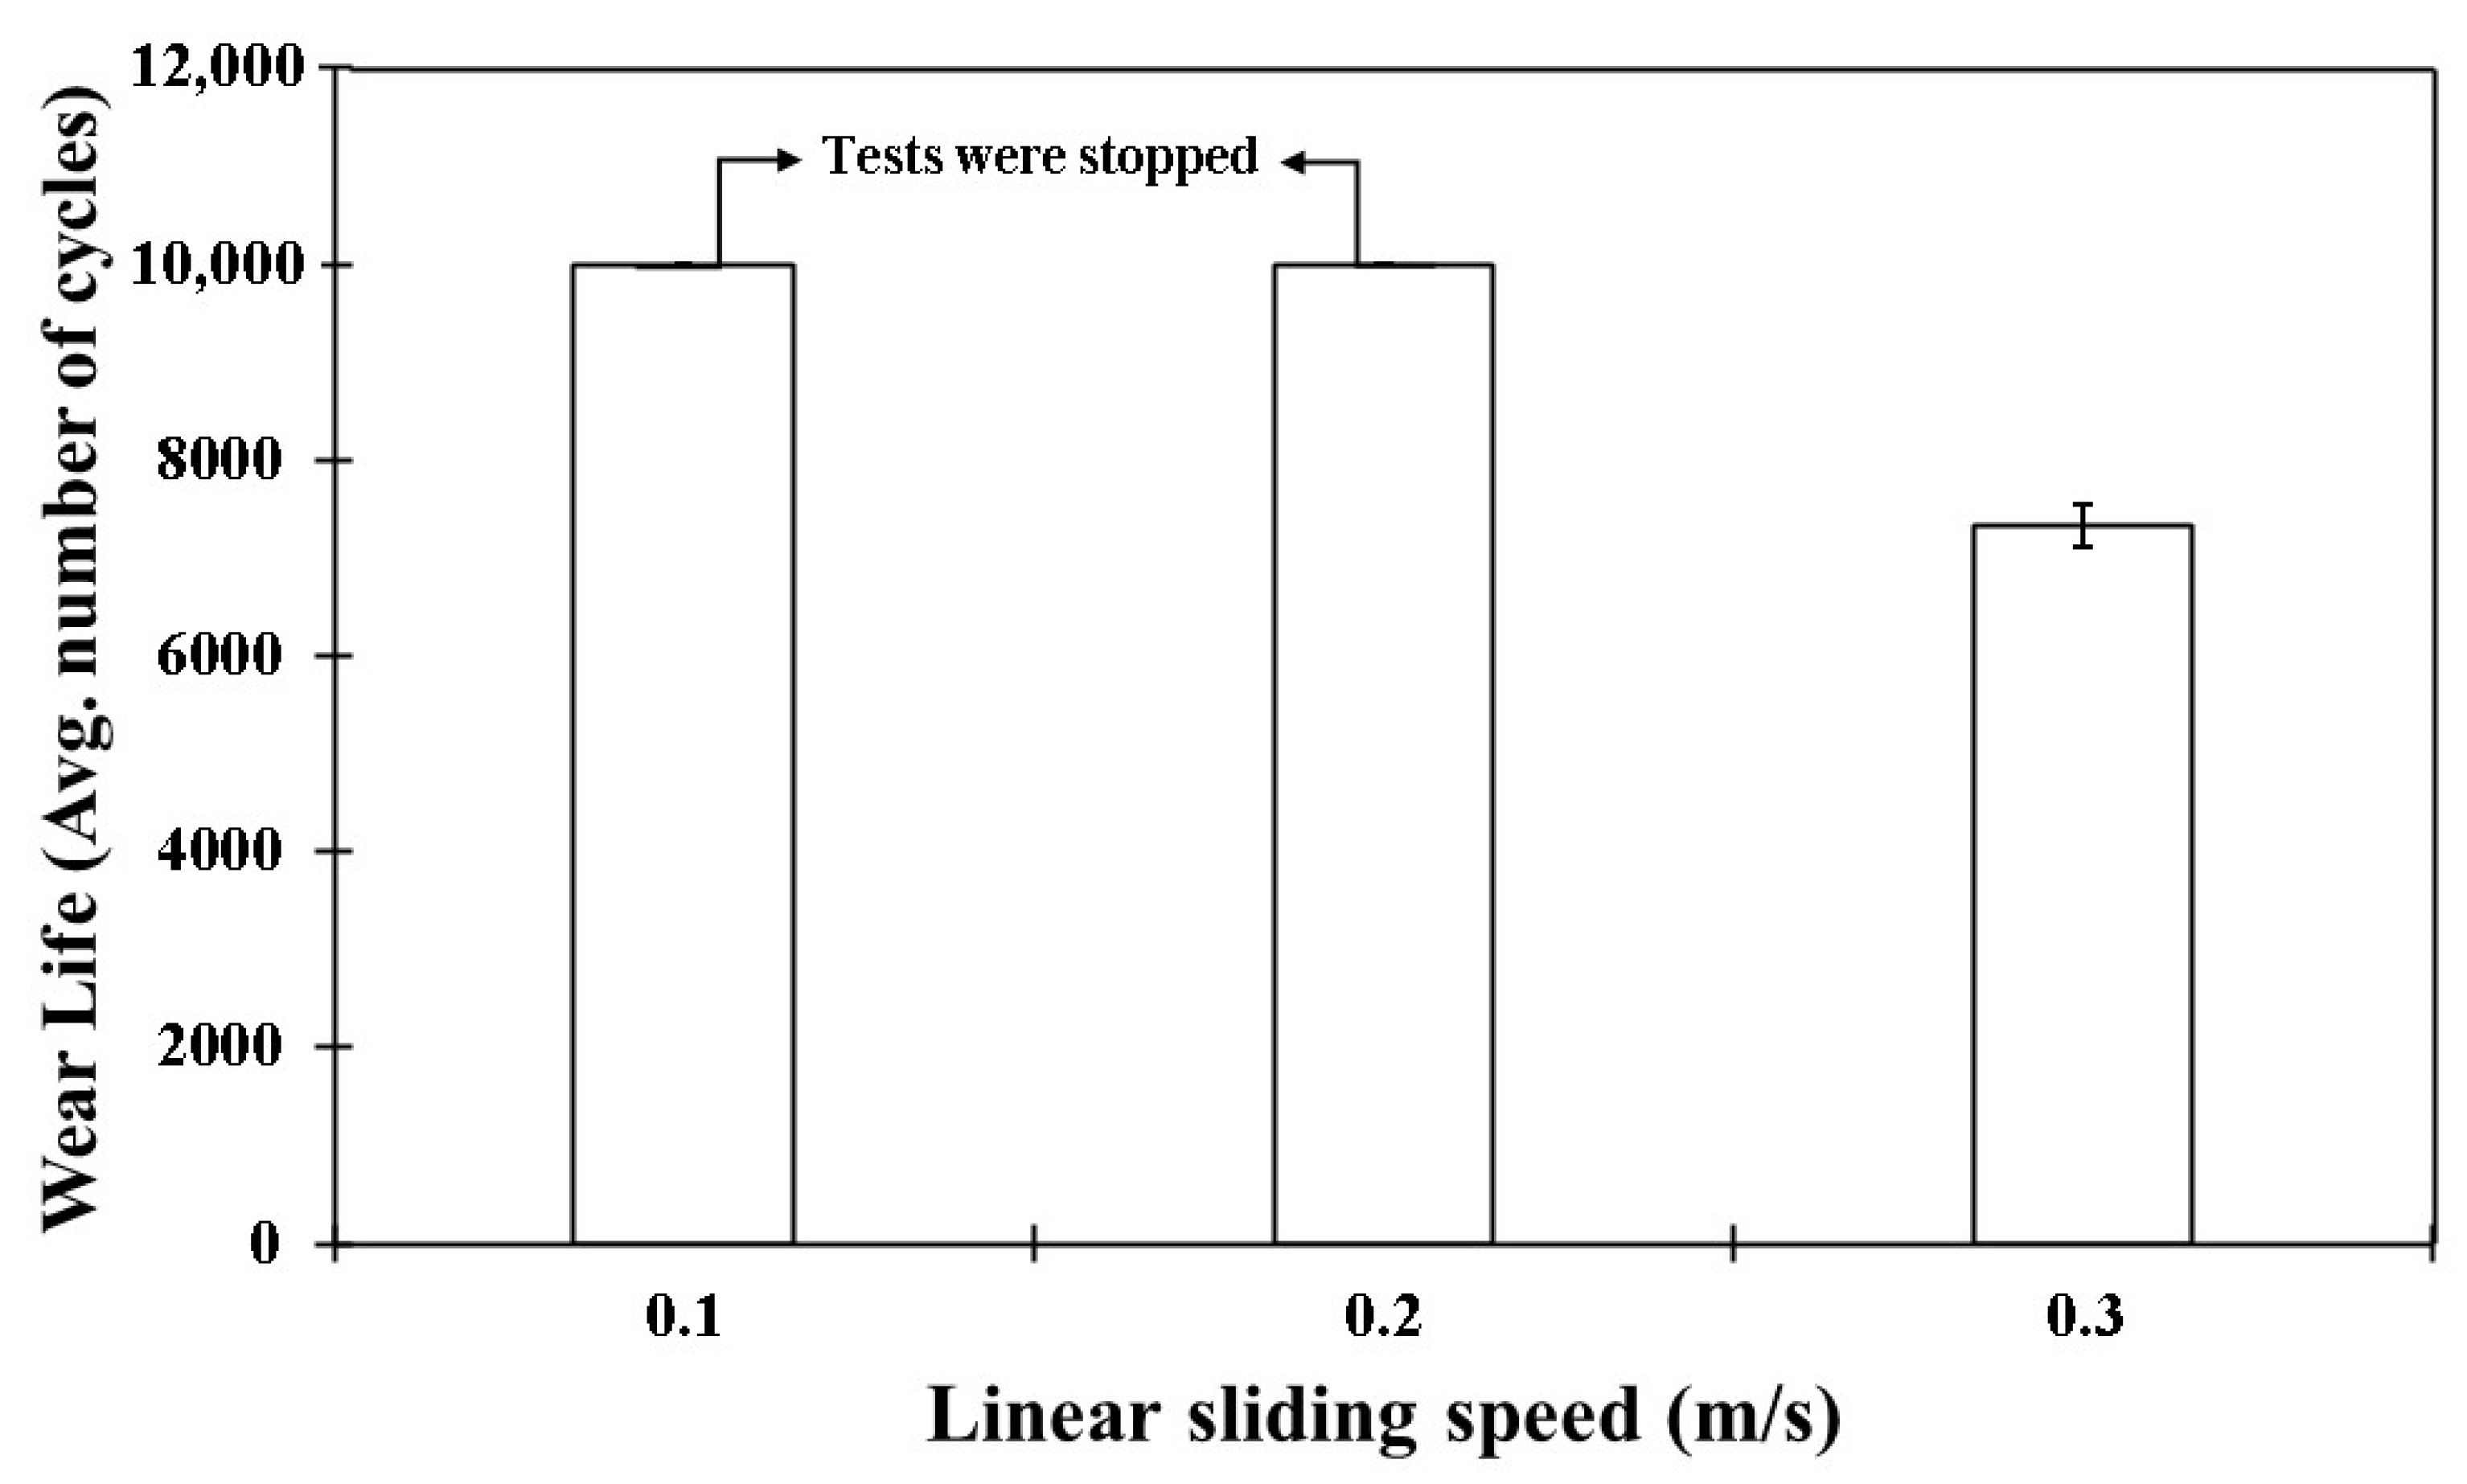
- At a normal load of 70 N and a sliding speed of 0.3 m/s, the pristine PEEK coating exhibited a wear life of approximately 7500 cycles before failure.
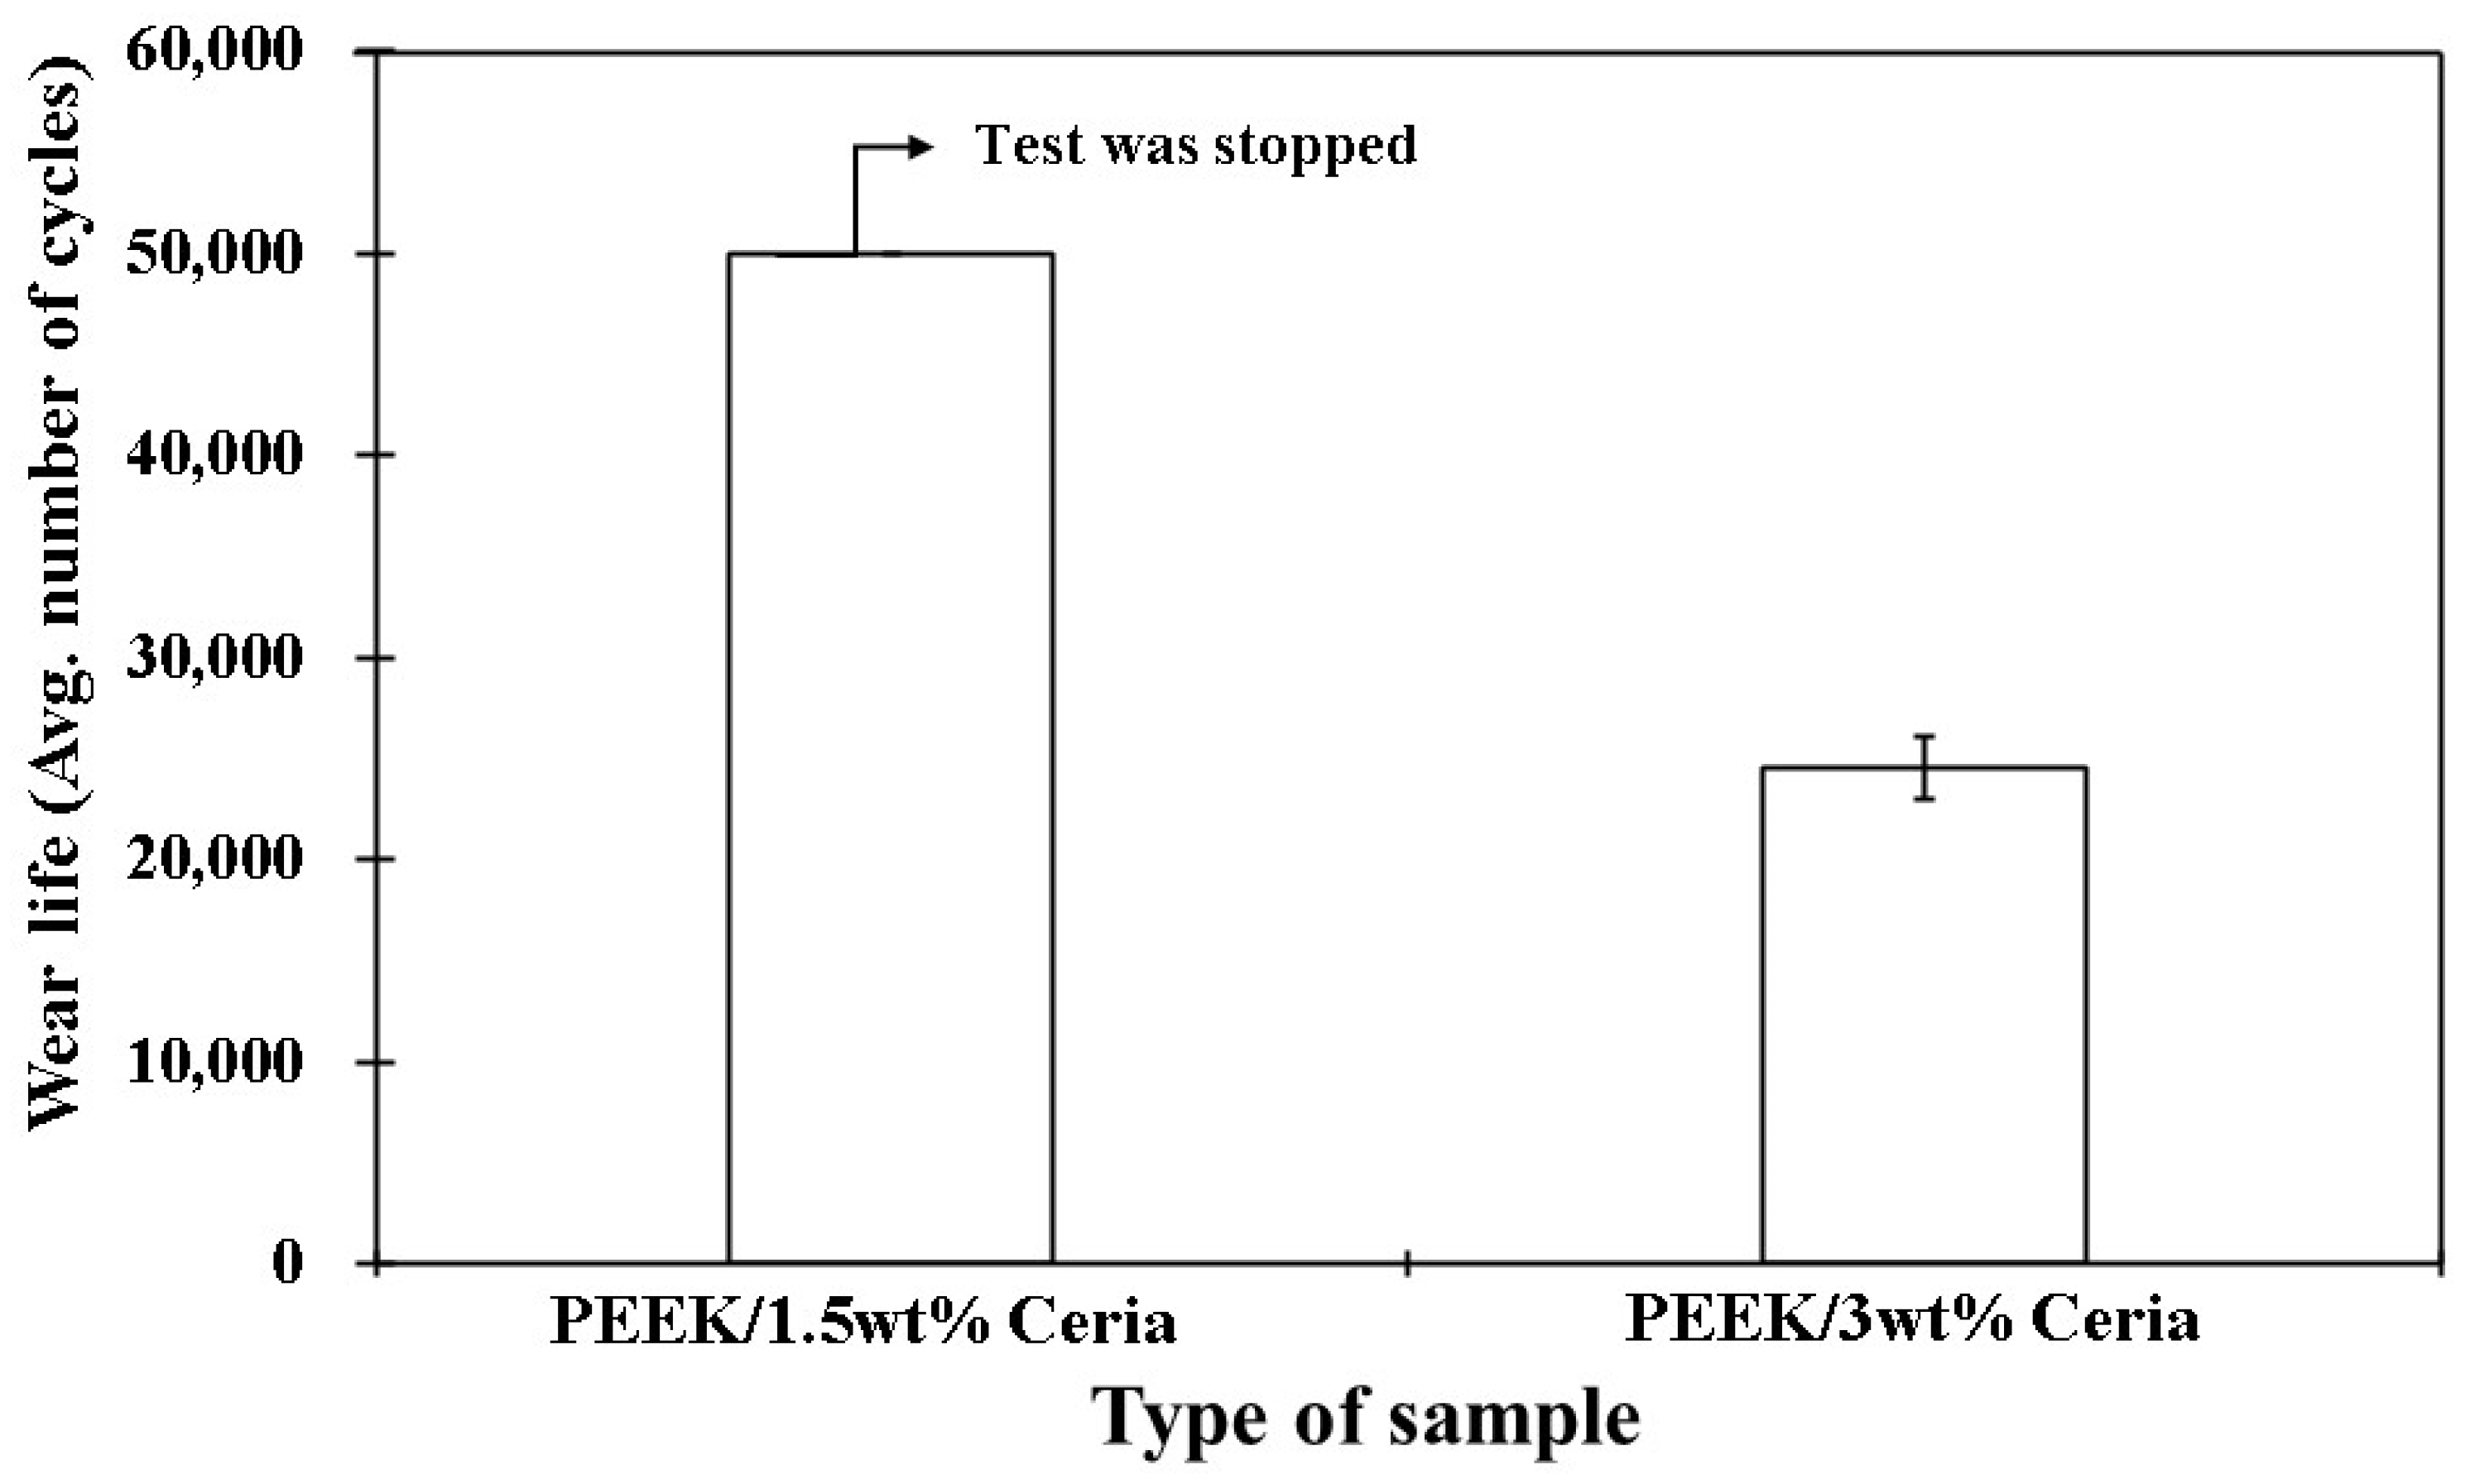
- The coating’s wear life was significantly increased by the incorporation of ceria nanofillers; the ideal filler loading was found to be 1.5 wt%, resulting in a wear life of over 50,000 cycles at a normal load of 70 N and a linear speed of 0.5 m/s.
- Among the tested concentrations, the 1.5 wt% ceria also demonstrated optimal performance, recording a wear life of over 50,000 cycles when tested at a load of 90 N, with a linear speed of 0.4 m/s.
- A lower ceria concentration provided an insufficient bridging effect, and the formation of agglomerations were found to be the leading reasons for the premature failure of the 0.5 and 3 wt% loadings, respectively.
- The counterface materials had minimal impact on the tribological performance of the PEEK/1.5 wt% ceria nanocomposite coating, indicating that the coating effectively maintained its wear resistance and stability regardless of the counterface in contact.
- This study also confirmed that UV exposure degrades pristine PEEK’s wear performance, while the addition of ceria nanoparticles was found to significantly enhance UV resistance, thereby improving the mechanical and tribological properties of the composite coating.
Author Contributions
Funding
Institutional Review Board Statement
Data Availability Statement
Conflicts of Interest
References
- Nunez, E.E.; Yeo, S.M.; Polychronopoulou, K.; Polycarpou, A.A. Tribological study of high bearing blended polymer-based coatings for air-conditioning and refrigeration compressors. Surf. Coat. Technol. 2011, 205, 2994–3005. [Google Scholar] [CrossRef]
- Palathai, T.; Tharajak, J.; Sombatsompop, N. Hardness, adhesion index and microstructure of PEEK coating on Al or Fe substrate by LVOF flame spray. Mater. Sci. Eng. A 2008, 485, 66–73. [Google Scholar] [CrossRef]
- Seenath, A.A.; Baig, M.M.A.; Katiyar, J.K.; Mohammed, A.S. A Comprehensive Review on the Tribological Evaluation of Polyether Ether Ketone Pristine and Composite Coatings. Polymers 2024, 16, 2994. [Google Scholar] [CrossRef] [PubMed]
- Chi, M.-H.; Tsou, H.-K.; Chung, C.-J.; He, J.-L. Biomimetic hydroxyapatite grown on biomedical polymer coated with titanium dioxide interlayer to assist osteocompatible performance. Thin Solid Film. 2013, 549, 98–102. [Google Scholar] [CrossRef]
- Barhoumi, N.; Khlifi, K.; Attia-Essaies, S. Mechanical and bioactive properties of PVD TiO2 coating modified PEEK for biomedical applications. J. Mech. Behav. Biomed. Mater. 2023, 144, 105935. [Google Scholar] [CrossRef]
- Cao, L.; Yang, J.; Li, J.; Zeng, D.; Lin, Z.; Yu, Z.; Hang, S.; Li, W.; Wang, Q.; Li, S.; et al. Tantalum nanoparticles reinforced polyetheretherketone coatings on titanium substrates: Bio-tribological and cell behaviour. Tribol. Int. 2022, 175, 107847. [Google Scholar] [CrossRef]
- Gaitanelis, D.; Chanteli, A.; Worrall, C.; Weaver, P.M.; Kazilas, M. A multi-technique and multi-scale analysis of the thermal degradation of PEEK in laser heating. Polym. Degrad. Stab. 2023, 211, 110282. [Google Scholar] [CrossRef]
- Gaitanelis, D.; Worrall, C.; Kazilas, M. Detecting, characterising and assessing PEEK’s and CF-PEEK’s thermal degradation in rapid high-temperature processing. Polym. Degrad. Stab. 2022, 204, 110096. [Google Scholar] [CrossRef]
- Denault, J.; Dumouchel, M. Consolidation Process of PEEK/Carbon Composite for Aerospace Applications. Adv. Perform. Mater. 1998, 5, 83–96. [Google Scholar] [CrossRef]
- Choudhury, S.S.; Pandey, M.; Bhattacharya, S. Recent Developments in Surface Modification of PEEK Polymer for Industrial Applications: A Critical Review. Rev. Adhes. Adhes. 2022, 9, 401–433. [Google Scholar]
- de Leon, A.C.C.; da Silva, Í.G.M.; Pangilinan, K.D.; Chen, Q.; Caldona, E.B.; Advincula, R.C. High performance polymers for oil and gas applications. React. Funct. Polym. 2021, 162, 104878. [Google Scholar] [CrossRef]
- Rinaldi, M.; Cecchini, F.; Pigliaru, L.; Ghidini, T.; Lumaca, F.; Nanni, F. Additive Manufacturing of Polyether Ether Ketone (PEEK) for Space Applications: A Nanosat Polymeric Structure. Polymers 2020, 13, 11. [Google Scholar] [CrossRef]
- Friedrich, K. Polymer composites for tribological applications. Adv. Ind. Eng. Polym. Res. 2018, 1, 3–39. [Google Scholar] [CrossRef]
- Azam, M.U.; Samad, M.A. A novel organoclay reinforced UHMWPE nanocomposite coating for tribological applications. Prog. Org. Coat. 2018, 118, 97–107. [Google Scholar] [CrossRef]
- Samad, M.A. Recent Advances in UHMWPE/UHMWPE Nanocomposite/UHMWPE Hybrid Nanocomposite Polymer Coatings for Tribological Applications: A Comprehensive Review. Polymers 2021, 13, 608. [Google Scholar] [CrossRef]
- Mohammed, A.S.; Fareed, M.I. Surface Modification of Polyether Ether Ketone (PEEK) with a Thin Coating of UHMWPE for Better Tribological Properties. Tribol. Trans. 2017, 60, 881–887. [Google Scholar] [CrossRef]
- Cao, L.; Zhang, P.; Li, S.-J.; Wang, Q.-W.; Zeng, D.-H.; Yu, C.-Y.; Li, Q.-Y.; Liao, Y.-W.; Lin, Z.-D.; Li, W. Effects of TaN nanoparticles on microstructure, mechanical properties and tribological performance of PEEK coating prepared by electrophoretic deposition. Trans. Nonferrous Met. Soc. China 2022, 32, 3334–3348. [Google Scholar] [CrossRef]
- Cheon, K.-H.; Park, C.; Kang, M.-H.; Kang, I.-G.; Lee, M.-K.; Lee, H.; Kim, H.-E.; Jung, H.-D.; Jang, T.-S. Construction of tantalum/poly(ether imide) coatings on magnesium implants with both corrosion protection and osseointegration properties. Bioact. Mater. 2021, 6, 1189–1200. [Google Scholar] [CrossRef]
- Shanaghi, A.; Souri, A.R.; Saedi, H.; Chu, P.K. Effects of the tantalum intermediate layer on the nanomechanical properties and biocompatibility of nanostructured tantalum/tantalum nitride bilayer coating deposited by magnetron sputtering on the nickel titanium alloy. Appl. Nanosci. 2021, 11, 1867–1880. [Google Scholar] [CrossRef]
- Liao, Y.; Cao, L.; Wang, Q.; Li, S.; Lin, Z.; Li, W.; Zhang, P.; Yu, C. Enhanced tribological properties of PEEK-based composite coatings reinforced by PTFE and graphite. J. Appl. Polym. Sci. 2022, 139, 51878. [Google Scholar] [CrossRef]
- Zhu, S.; Zhang, Y.; Li, Q.; Wei, L.; Guan, S. Influence of polytetrafluoroethylene (PTFE) content on mechanical and tribological properties of poly(ether ether ketone)/PTFE coatings prepared by electrostatic powder spraying technique. High Perform. Polym. 2014, 27, 3–9. [Google Scholar] [CrossRef]
- Kadiyala, A.K.; Bijwe, J.; Kalappa, P. Investigations on influence of nano and micron sized particles of SiC on performance properties of PEEK coatings. Surf. Coat. Technol. 2018, 334, 124–133. [Google Scholar] [CrossRef]
- Zhang, G.; Liao, H.; Li, H.; Mateus, C.; Bordes, J.-M.; Coddet, C. On dry sliding friction and wear behaviour of PEEK and PEEK/SiC-composite coatings. Wear 2006, 260, 594–600. [Google Scholar] [CrossRef]
- Corni, I.; Neumann, N.; Novak, S.; König, K.; Veronesi, P.; Chen, Q.; Ryan, M.P.; Boccaccini, A.R. Electrophoretic deposition of PEEK-nano alumina composite coatings on stainless steel. Surf. Coat. Technol. 2009, 203, 1349–1359. [Google Scholar] [CrossRef]
- Seuss, S.; Subhani, T.; Kang, M.Y.; Okudaira, K.; Ventura, I.E.A.; Boccaccini, A.R. Electrophoretic Deposition of PEEK-TiO2 Composite Coatings on Stainless Steel. Key Eng. Mater. 2012, 507, 127–133. [Google Scholar] [CrossRef]
- Hedayati, M.; Salehi, M.; Bagheri, R.; Panjepour, M.; Naeimi, F. Tribological and mechanical properties of amorphous and semi-crystalline PEEK/SiO2 nanocomposite coatings deposited on the plain carbon steel by electrostatic powder spray technique. Prog. Org. Coat. 2012, 74, 50–58. [Google Scholar] [CrossRef]
- Li, Y.; Man, Z.; Lin, X.; Wei, L.; Wang, H.; Lei, M.K. Role of Well-Dispersed Carbon Nanotubes and Limited Matrix Degradation on Tribological Properties of Flame-Sprayed PEEK Nanocomposite Coatings. J. Tribol. 2021, 144, 012101. [Google Scholar] [CrossRef]
- Zhou, N.; Jia, J.; Zhao, S.; Zhang, D.; Feng, M. Interfacial enhancement of CF/PEEK composites by coating sulfonated PEEK sizing agent. Surf. Interfaces 2023, 37, 102652. [Google Scholar] [CrossRef]
- Lin, L.; Ecke, N.; Huang, M.; Pei, X.-Q.; Schlarb, A.K. Impact of nanosilica on the friction and wear of a PEEK/CF composite coating manufactured by fused deposition modeling (FDM). Compos. Part B Eng. 2019, 177, 107428. [Google Scholar] [CrossRef]
- Tovar-Vargas, D.; Roitero, E.; Anglada, M.; Jiménez-Piqué, E.; Reveron, H. Mechanical properties of ceria-calcia stabilized zirconia ceramics with alumina additions. J. Eur. Ceram. Soc. 2021, 41, 5602–5612. [Google Scholar] [CrossRef]
- Huang, X.; Yu, L.; Dong, Y. Corrosion resistance of a novel ceria doped aluminum phosphate ceramic coating on cast Al-Si alloy by steam-assisted curing. Corros. Sci. 2021, 182, 109256. [Google Scholar] [CrossRef]
- Dhall, A.; Self, W. Cerium Oxide Nanoparticles: A Brief Review of Their Synthesis Methods and Biomedical Applications. Antioxidants 2018, 7, 97. [Google Scholar] [CrossRef]
- Nosrati, H.; Heydari, M.; Khodaei, M. Cerium oxide nanoparticles: Synthesis methods and applications in wound healing. Mater. Today Bio 2023, 23, 100823. [Google Scholar] [CrossRef]
- Herrling, T.; Seifert, M.; Jung, K. Cerium dioxide: Future UV-filter in sunscreen? SOFW—J. 2013, 139, 10–14. [Google Scholar]
- Kowsuki, K.; Nirmala, R.; Ra, Y.-H.; Navamathavan, R. Recent advances in cerium oxide-based nanocomposites in synthesis, characterization, and energy storage applications: A comprehensive review. Results Chem. 2023, 5, 100877. [Google Scholar] [CrossRef]
- Zholobak, N.; Ivanov, V.; Shcherbakov, A.; Shaporev, A.; Polezhaeva, O.; Baranchikov, A.; Spivak, N.; Tretyakov, Y. UV-shielding property, photocatalytic activity and photocytotoxicity of ceria colloid solutions. J. Photochem. Photobiol. B Biol. 2011, 102, 32–38. [Google Scholar] [CrossRef]
- Deepak, J.; Adarsha, H.; Bhat, S.; Kumar, N.P.R. Studies on development of alumina and ceria coated magnesium AZ91 composite for enhanced properties. Mater. Today Proc. 2021, 46, 9027–9031. [Google Scholar] [CrossRef]
- Zhang, Z.; Lu, X.; Han, B.; Luo, J. Rare earth effect on the microstructure and wear resistance of Ni-based coatings. Mater. Sci. Eng. A 2007, 454–455, 194–202. [Google Scholar] [CrossRef]
- Wang, Y.; Wang, Z.; Yang, Y.; Chen, W. The effects of ceria on the mechanical properties and thermal shock resistance of thermal sprayed NiAl intermetallic coatings. Intermetallics 2008, 16, 682–688. [Google Scholar] [CrossRef]
- Bhattacharyya, A.S. Indentation of Coatings at micro/nano scale: Crack formation and deflection. arXiv 2016. [Google Scholar] [CrossRef]
- Kuo, M.C.; Tsai, C.M.; Huang, J.C.; Chen, M. PEEK composites reinforced by nano-sized SiO2 and Al2O3 particulates. Mater. Chem. Phys. 2005, 90, 185–195. [Google Scholar] [CrossRef]
- Lin, Y.-W.; Fang, C.-H.; Meng, F.-Q.; Ke, C.-J.; Lin, F.-H. Hyaluronic Acid Loaded with Cerium Oxide Nanoparticles as Antioxidant in Hydrogen Peroxide Induced Chondrocytes Injury: An In Vitro Osteoarthritis Model. Molecules 2020, 25, 4407. [Google Scholar] [CrossRef] [PubMed]
- Vettumperumal, R.; Dhineshbabu, N.R.; PV, E.; Kit, C.C. XRD Peak Profile and Inverse Pole Figure Analysis of Ceria (CeO2) Nanoparticles. Iran. J. Sci. 2024, 48, 1653–1661. [Google Scholar] [CrossRef]
- Ansari, A.A.; Labis, J.P.; Alam, M.; Ramay, S.M.; Ahmad, N.; Mahmood, A. Synthesis, Structural and Optical Properties of Mn-Doped Ceria Nanoparticles: A Promising Catalytic Material. Acta Metall. Sin. 2016, 29, 265–273. [Google Scholar] [CrossRef]
- Rachmaniar, S.; Nugraha, D.A.; Santjojo, D.J.D.H.; Tjahjanto, R.T.; Mufti, N.; Masruroh. Prevention of particle agglomeration in sol–gel synthesis of TiO2 nanoparticles via addition of surfactant. J. Nanopart. Res. 2024, 26, 45. [Google Scholar] [CrossRef]
- Zhang, G.; Li, W.-Y.; Cherigui, M.; Zhang, C.; Liao, H.; Bordes, J.-M.; Coddet, C. Structures and tribological performances of PEEK (poly-ether-ether-ketone)-based coatings designed for tribological application. Prog. Org. Coat. 2007, 60, 39–44. [Google Scholar] [CrossRef]
- Hamdan, S.; Swallowe, G.M. The strain-rate and temperature dependence of the mechanical properties of polyetherketone and polyetheretherketone. J. Mater. Sci. 1996, 31, 1415–1423. [Google Scholar] [CrossRef]
- Aliabadi, A.; Hadavi, S.M.M.; Eshraghi, M.J. Mechanistic investigation of aluminide coating formation by low-pressure chemical vapor deposition method on NiCoCrAlY coating in presence of nickel-ceria composite layer. Ceram. Int. 2021, 47, 20051–20063. [Google Scholar] [CrossRef]
- Chang, Z.; Wang, Y.; Zhang, Z.; Gao, K.; Hou, G.; Shen, J.; Zhang, L.; Liu, J. Creep behavior of polymer nanocomposites: Insights from molecular dynamics simulation. Polymer 2021, 228, 123895. [Google Scholar] [CrossRef]
- Patel, P.; Hull, T.R.; McCabe, R.W.; Flath, D.; Grasmeder, J.; Percy, M. Mechanism of thermal decomposition of poly(ether ether ketone) (PEEK) from a review of decomposition studies. Polym. Degrad. Stab. 2010, 95, 709–718. [Google Scholar] [CrossRef]
- Wang, C.; Luan, J.; Xu, Z.; Zhao, W.; Zhang, M. Preparation and properties of a novel, high-performance polyether ether ketone fabric. High Perform. Polym. 2017, 30, 095400831773113. [Google Scholar] [CrossRef]
- Li, Y.; Wei, L.; Man, Z.; Liu, S.; Wang, S.; Lei, M. Mechanical and tribological properties of carbon fiber-reinforced polyetheretherketone composite coatings by flame-spraying method. Polym. Compos. 2022, 43, 8443–8457. [Google Scholar] [CrossRef]
- Tharajak, J.; Palathai, T.; Sombatsompop, N. Morphological and physical properties and friction/wear behavior of h-BN filled PEEK composite coatings. Surf. Coat. Technol. 2015, 273, 20–29. [Google Scholar] [CrossRef]
- Moskalewicz, T.; Zimowski, S.; Zych, A.; Łukaszczyk, A.; Reczyńska, K.; Pamuła, E. Electrophoretic Deposition, Microstructure and Selected Properties of Composite Alumina/Polyetheretherketone Coatings on the Ti-13Nb-13Zr Alloy. J. Electrochem. Soc. 2018, 165, D116. [Google Scholar] [CrossRef]
- Moskalewicz; Warcaba; Zimowski; Łukaszczyk, A. Improvement of the Ti-6Al-4V Alloy’s Tribological Properties and Electrochemical Corrosion Resistance by Nanocomposite TiN/PEEK708 Coatings. Metall. Mater. Trans. A 2019, 50, 5914–5924. [Google Scholar] [CrossRef]
- Paleo, A.J.; Krause, B.; Soares, D.; Melle-Franco, M.; Muñoz, E.; Pötschke, P.; Rocha, A.M. Thermoelectric Properties of N-Type Poly (Ether Ether Ketone)/Carbon Nanofiber Melt-Processed Composites. Polymers 2022, 14, 4803. [Google Scholar] [CrossRef]
- Lu, C.; Qiu, S.; Lu, X.; Wang, J.; Xiao, L.; Zheng, T.; Wang, X.; Zhang, D. Enhancing the Interfacial Strength of Carbon Fiber/Poly(ether ether ketone) Hybrid Composites by Plasma Treatments. Polymers 2019, 11, 753. [Google Scholar] [CrossRef]
- Yan, T.; Yan, F.; Li, S.; Li, M.; Liu, Y.; Zhang, M.; Jin, L.; Shang, L.; Liu, L.; Ao, Y. Interfacial enhancement of CF/PEEK composites by modifying water-based PEEK-NH2 sizing agent. Compos. Part B Eng. 2020, 199, 108258. [Google Scholar] [CrossRef]
- Al-Mufti, S.M.; Ali, M.; Rizvi, S.J.A. Synthesis and structural properties of sulfonated poly ether ether ketone (SPEEK) and Poly ether ether ketone (PEEK). In Proceedings of the 3RD INTERNATIONAL CONFERENCE ON CONDENSED MATTER AND APPLIED PHYSICS (ICC-2019), Bikaner, India, 4 May 2020; Volume 2220. [Google Scholar] [CrossRef]
- Kwon, G.; Kim, H.; Gupta, K.C.; Kang, I.-K. Enhanced Tissue Compatibility of Polyetheretherketone Disks by Dopamine-Mediated Protein Immobilization. Macromol. Res. 2018, 26, 128–138. [Google Scholar] [CrossRef]
- Singh, S.; Prakash, C.; Ramakrishna, S. 3D printing of polyether-ether-ketone for biomedical applications. Eur. Polym. J. 2019, 114, 234–248. [Google Scholar] [CrossRef]
- Culica, M.; Andreea, C.-S.; Melinte, V.; Coseri, S. Cellulose Acetate Incorporating Organically Functionalized CeO2 NPs: Efficient Materials for UV Filtering Applications. Materials 2020, 13, 2955. [Google Scholar] [CrossRef] [PubMed]
- Cosnita, M.; Cazan, C.; Pop, M.A.; Cristea, D. Aging resistance under short time ultraviolet (UV) radiations of polymer wood composites entirely based on wastes. Environ. Technol. Innov. 2023, 31, 103208. [Google Scholar] [CrossRef]
- Khotbehsara, M.M.; Manalo, A.; Aravinthan, T.; Turner, J.; Ferdous, W.; Hota, G. Effects of ultraviolet solar radiation on the properties of particulate-filled epoxy based polymer coating. Polym. Degrad. Stab. 2020, 181, 109352. [Google Scholar] [CrossRef]
- Thappa, S.; Gupta, A.; Kumar, D.; Anand, Y.; Anand, S. Ceria doped solar selective coating for solar thermal application. Sol. Energy 2024, 282, 112922. [Google Scholar] [CrossRef]
- Li, Z.; Tong, L.; Ma, Y.; Zhao, L. Fabrication of CeO2/CaO nanocomposite as ultraviolet screening agent and its application in sunscreen. Ceram. Int. 2024, 50 Pt B, 20431–20440. [Google Scholar] [CrossRef]
- Habib, S.; Qureshi, A.; Faisal, M.; Kahraman, R.; Ahmed, E.M.; Shakoor, R.A. Advancing steel protection with Ceria@Talc-8-hydroxyquinoline modified Polyurethane coatings. Prog. Org. Coat. 2024, 191, 108446. [Google Scholar] [CrossRef]
- Wu, Y.; Ta, H.T. Different approaches to synthesising cerium oxide nanoparticles and their corresponding physical characteristics, and ROS scavenging and anti-inflammatory capabilities. J. Mater. Chem. B 2021, 9, 7291–7301. [Google Scholar] [CrossRef]


| Coating | Load (N)/Speed (m/s)/Sliding Distance (Cycles) | Wear Track Depth (µm) | Coefficient of Friction (COF) | Outcome |
|---|---|---|---|---|
| Pristine PEEK | 70/0.1/10,000 | 29 | 0.31 | No Failure |
| 70/0.2/10,000 | 70 | 0.35 | No Failure | |
| 70/0.3/10,000 | N/A | N/A | Failed (~7500 cycles) | |
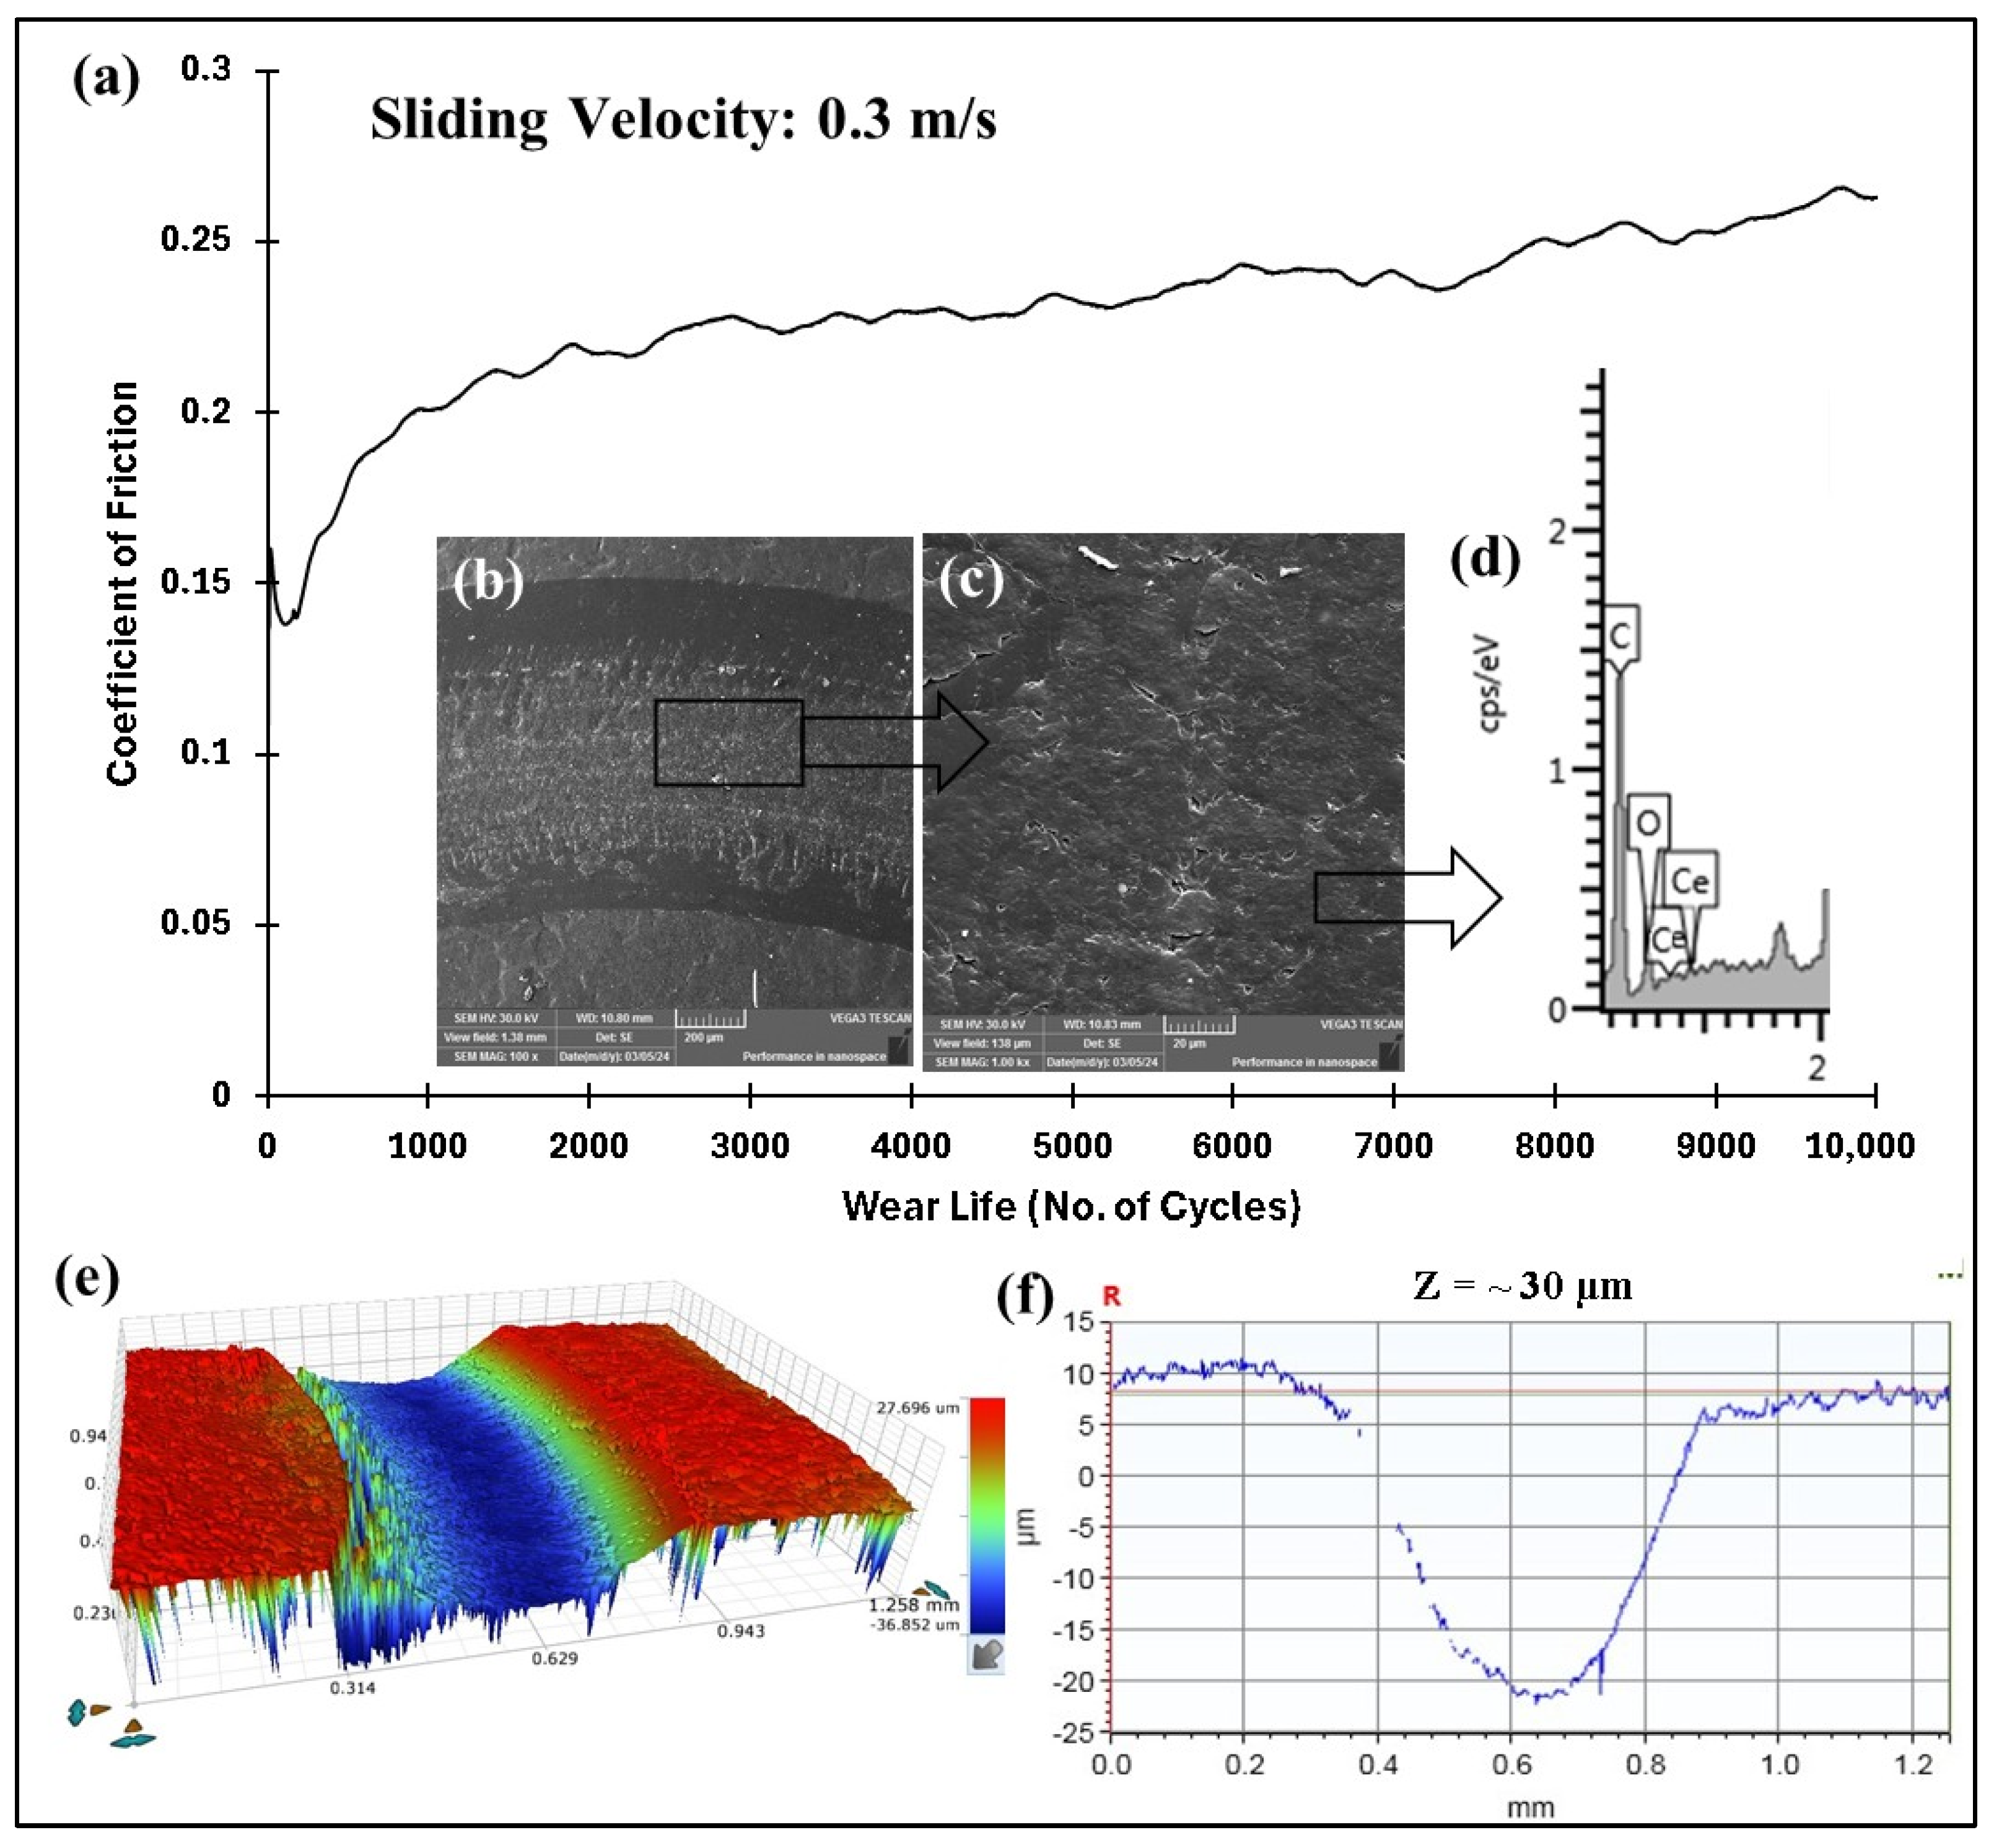
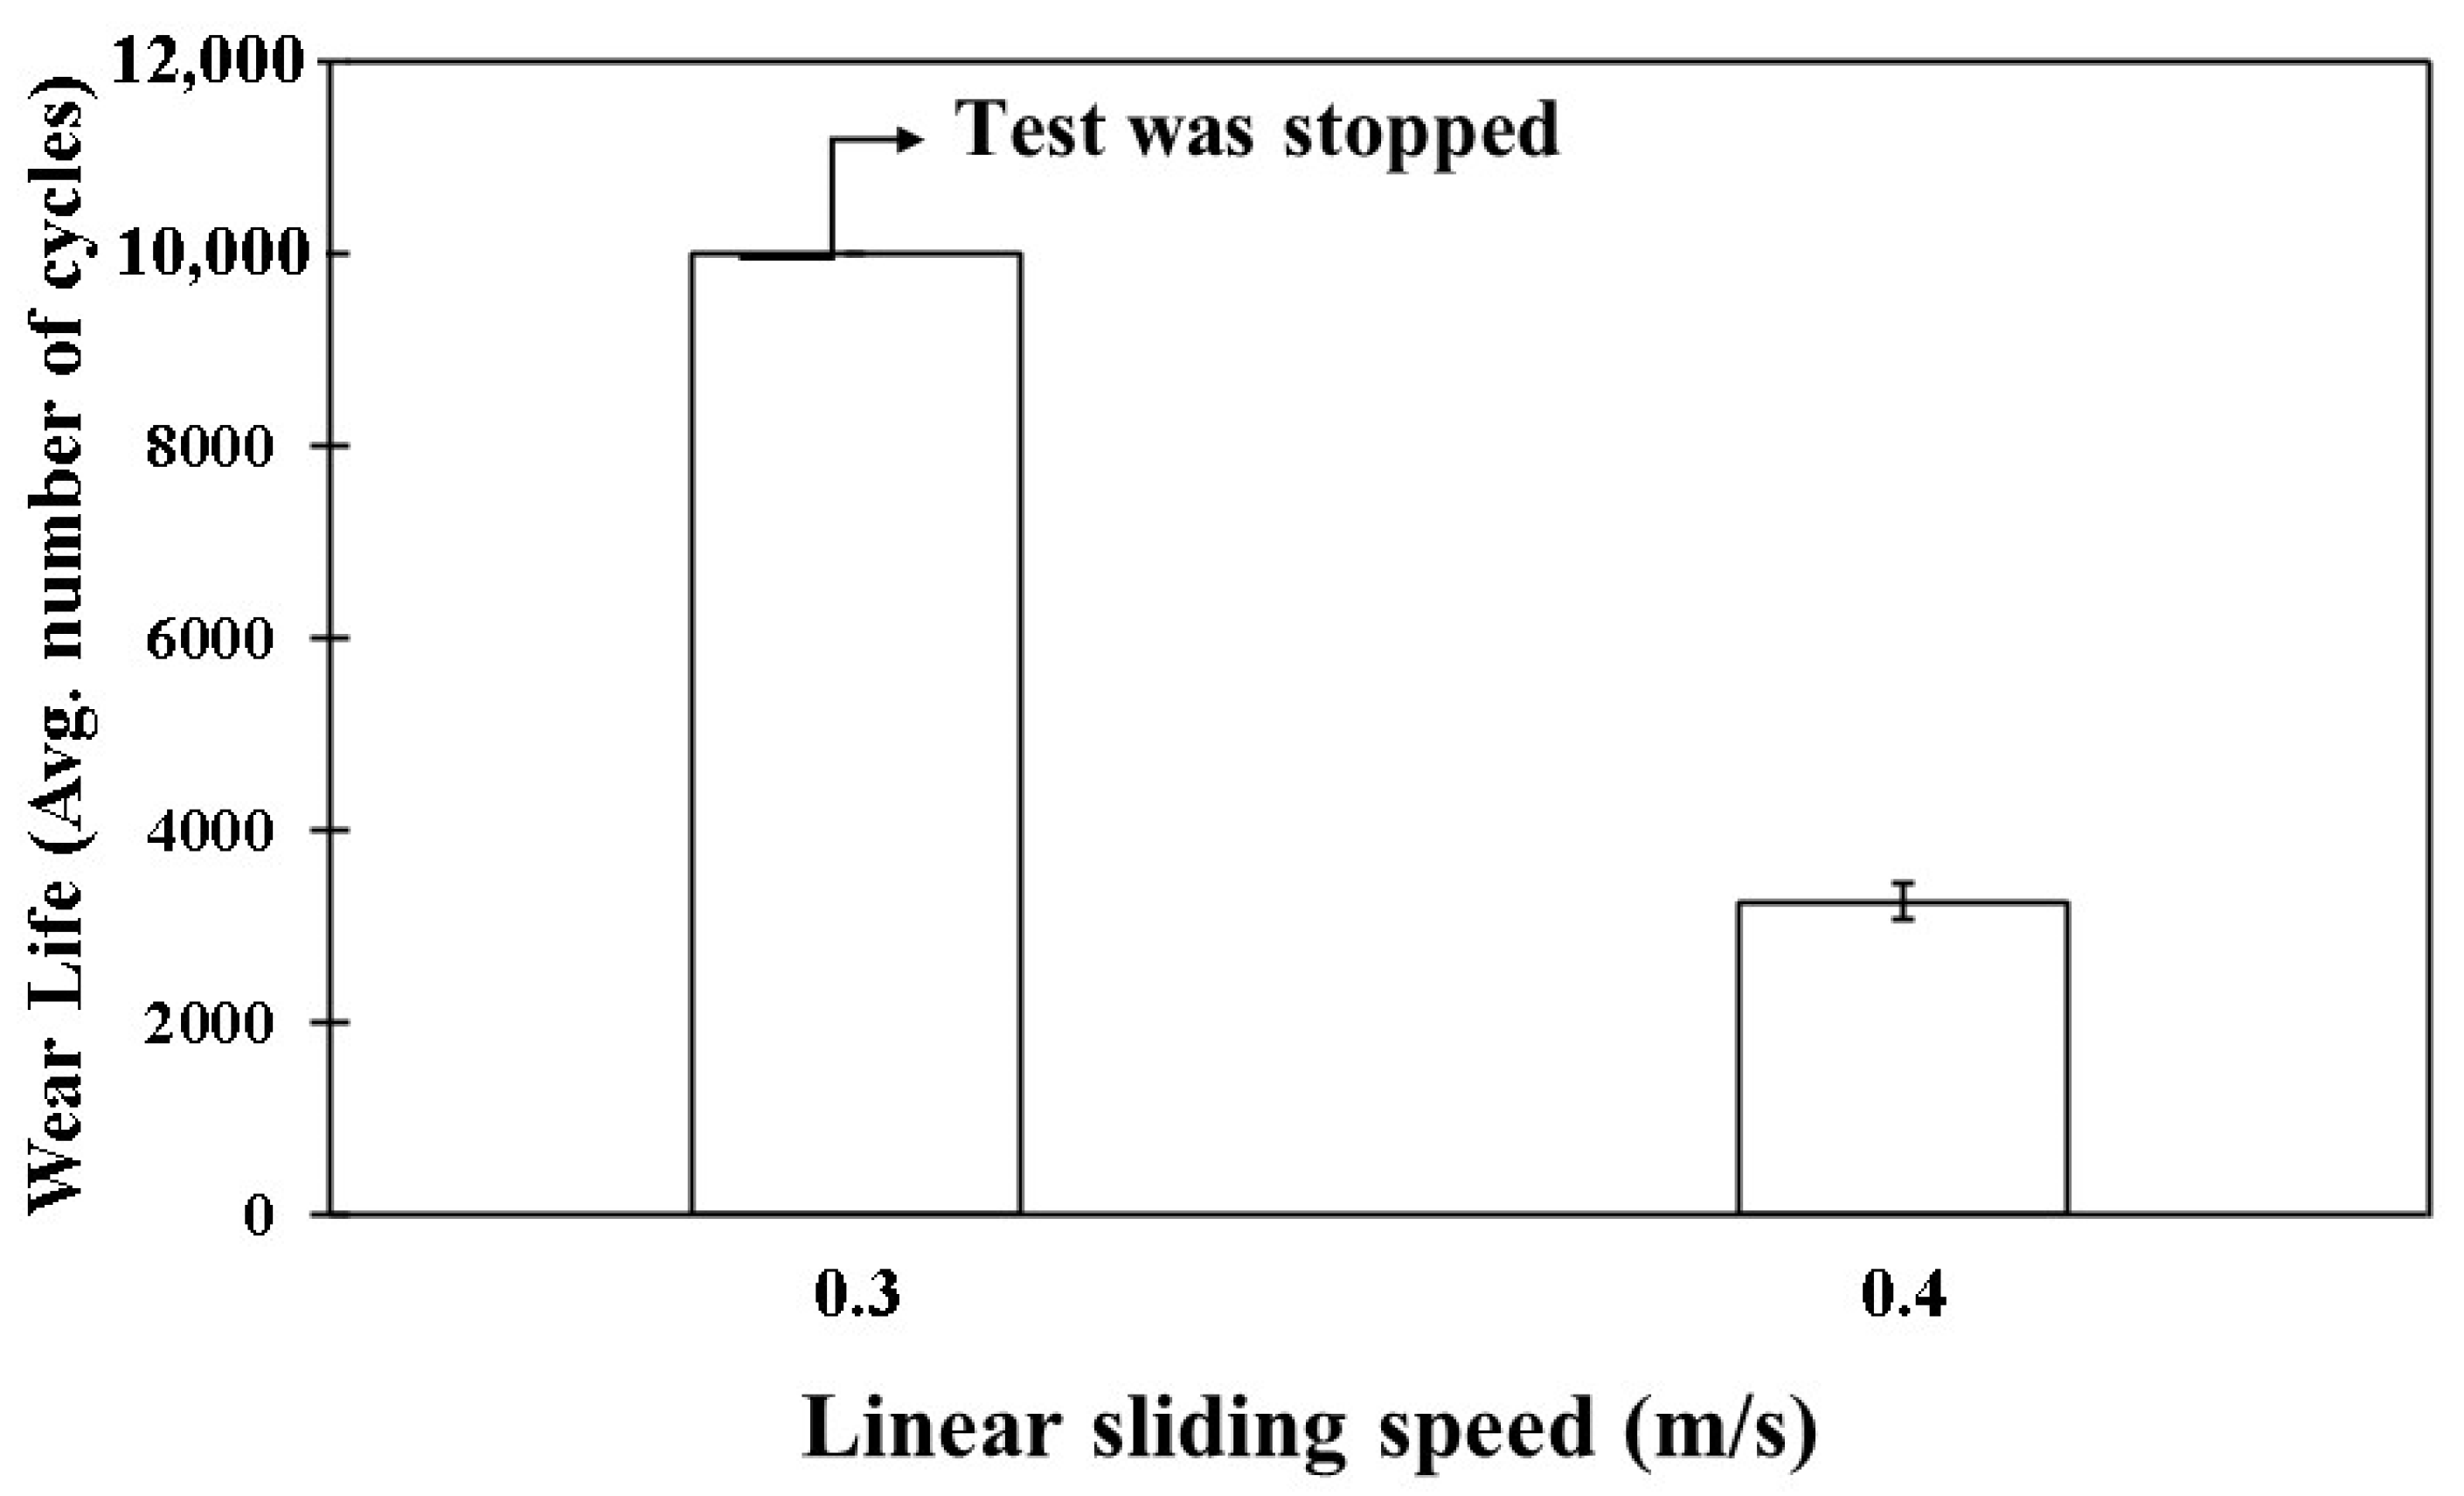
| PEEK/0.5 wt% CeO2 | 70/0.3/10,000 | 30 | 0.23 | No Failure |
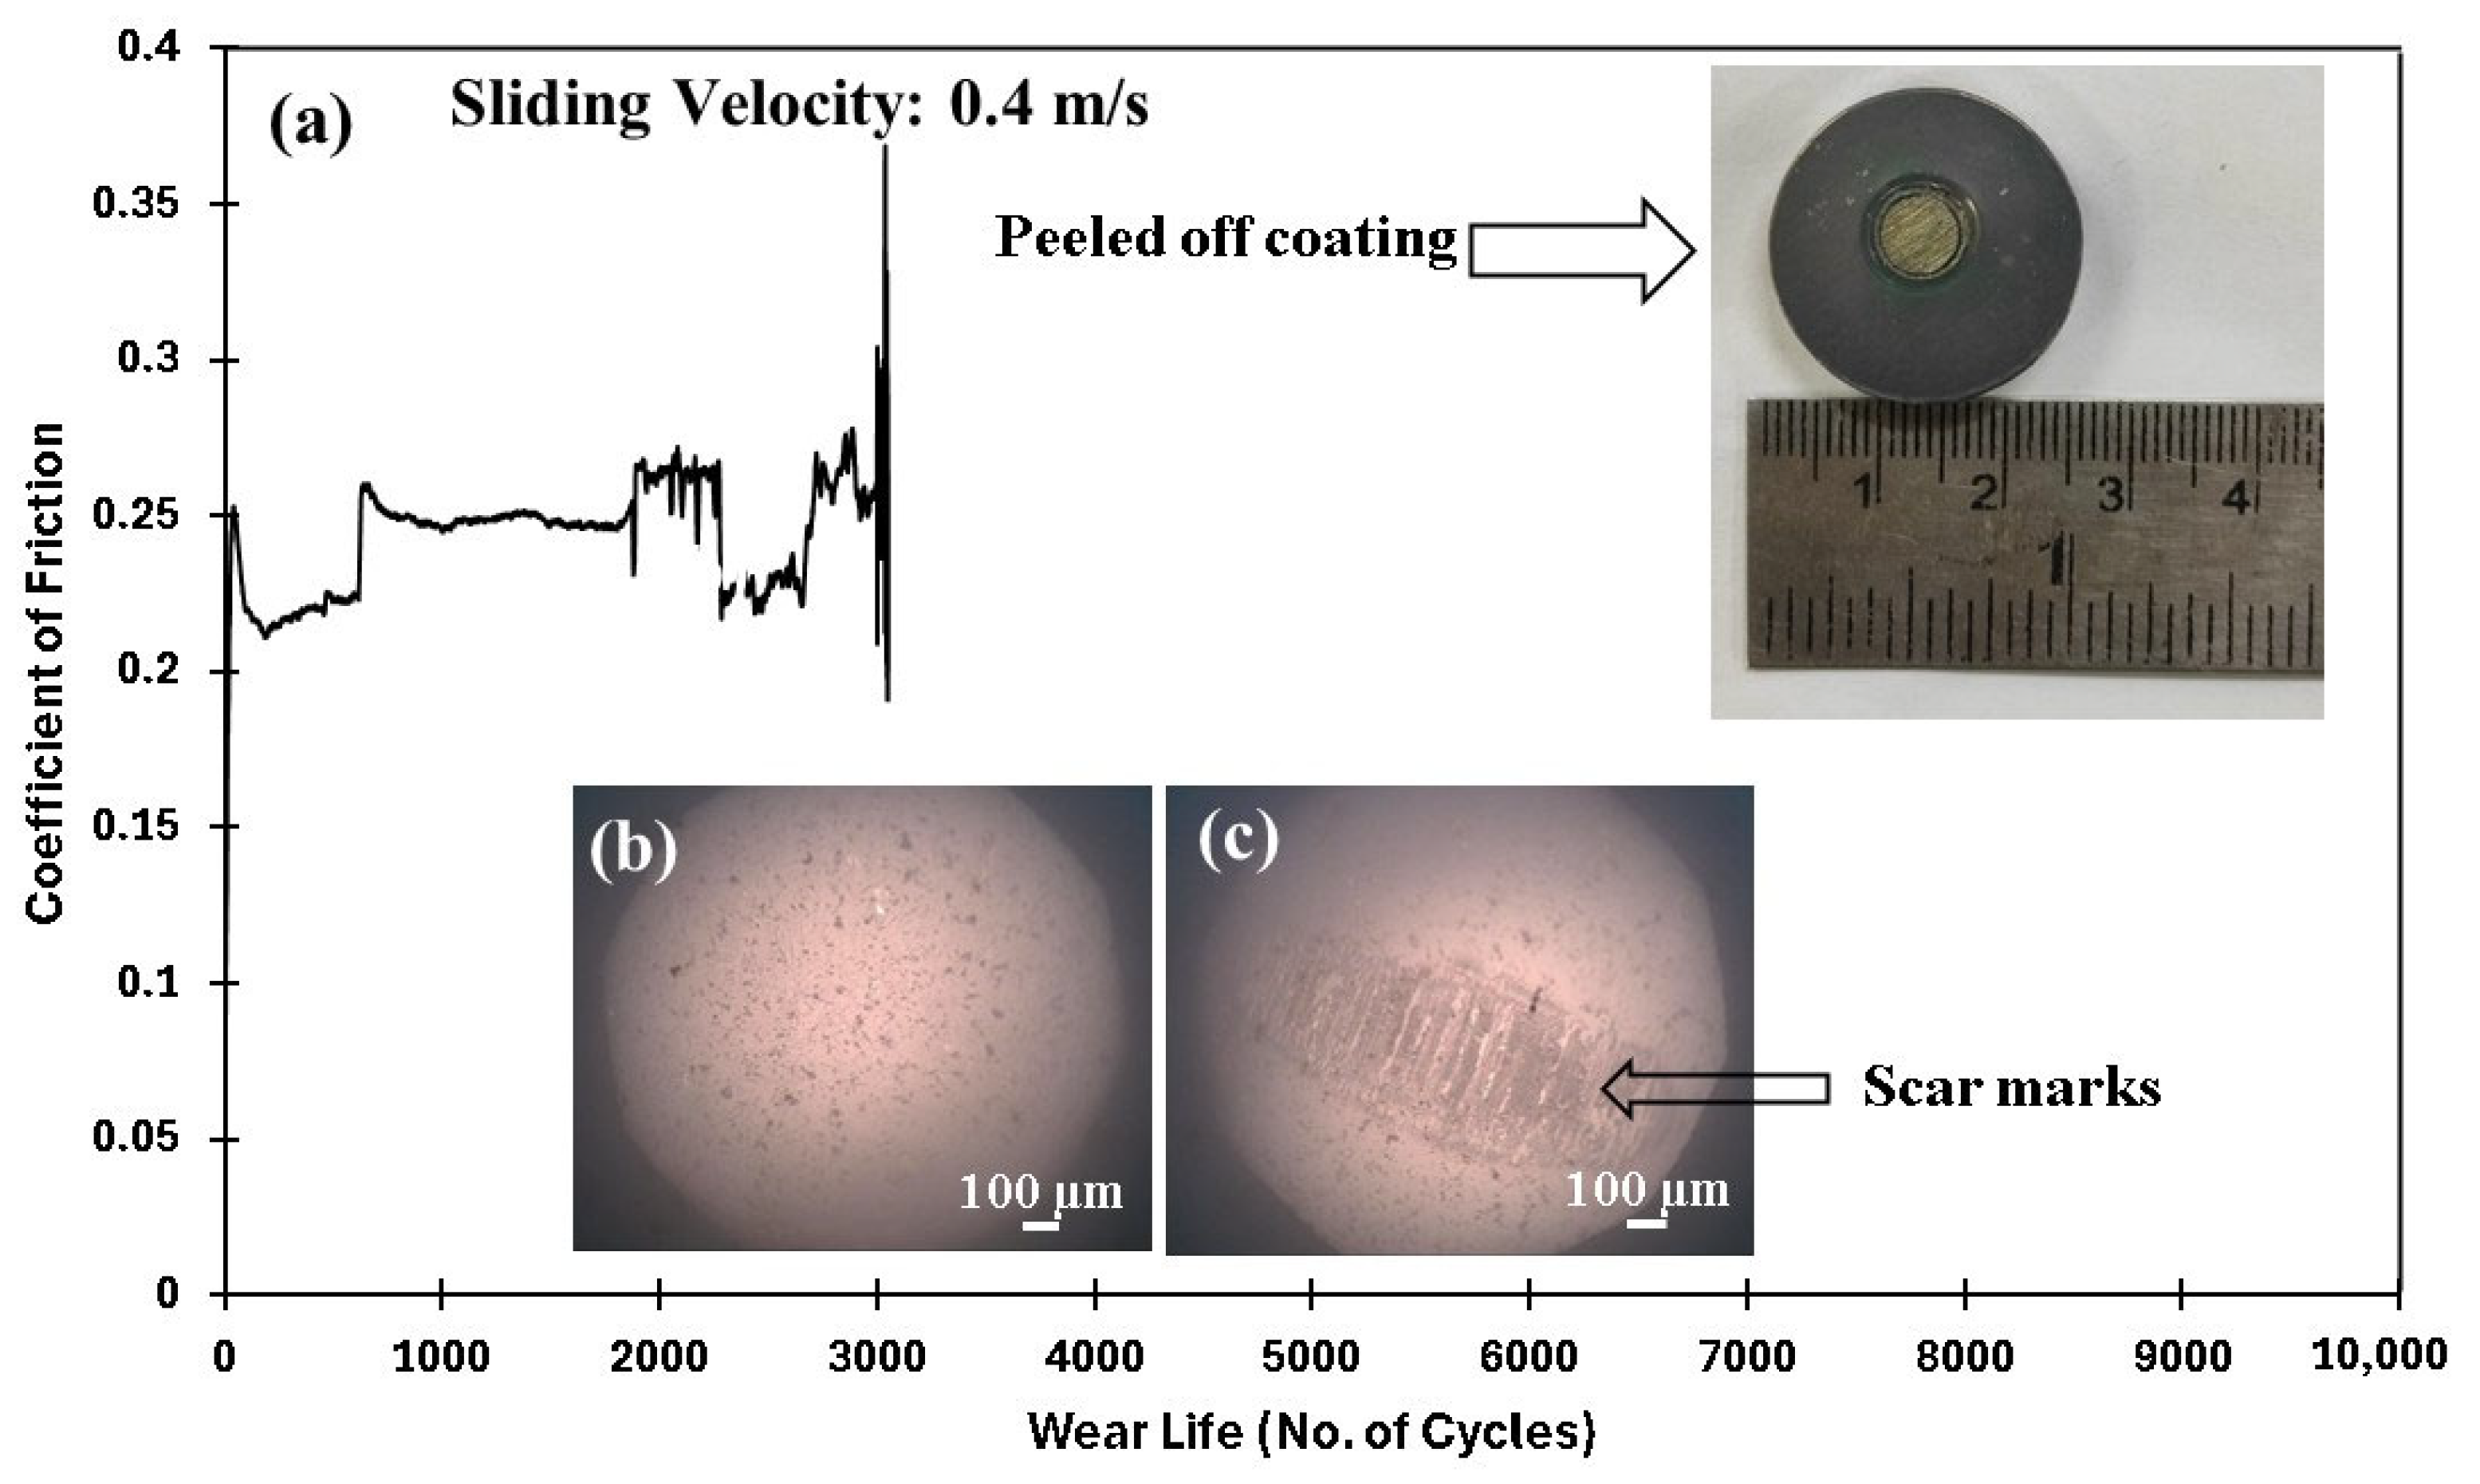
| 70/0.4/10,000 | N/A | N/A | Failed (~3100 cycles) | |
| PEEK/1.5 wt% CeO2 | 70/0.4/10,000 | 26 | 0.22 | No Failure |
| 70/0.5/10,000 | 28 | 0.19 | No Failure | |
| 70/0.5/50,000 | 50 | 0.2 | No Failure | |
| PEEK/3 wt% CeO2 | 70/0.5/10,000 | 32 | 0.21 | No Failure |
| 70/0.5/50,000 | N/A | N/A | Failed (~26,000 cycles) |
| Coating | Load (N)/Speed (m/s)/Sliding Distance (Cycles) | Wear Track Depth (µm) | Coefficient of Friction (COF) | Outcome |
|---|---|---|---|---|
| PEEK/1.5 wt% CeO2 | 80/0.4/10,000 | 30 | 0.22 | No Failure |
| 90/0.4/10,000 | 34 | 0.24 | No Failure | |
| 100/0.4/10,000 | N/A | N/A | Failed (~5100 cycles) | |
| 90/0.4/50,000 | 48 | 0.204 | No Failure |
| Material | Roughness (Ra/µm) | Coefficient of Friction | Wear Track Depth (µm) |
|---|---|---|---|
| 440C hardened steel | 3.141 | 0.2263 | 38 |
| Alumina (Al2O3) | 3.187 | 0.2307 | 34 |
| Tungsten carbide (WC) | 3.241 | 0.193 | 28 |
| Silicon nitride (Si3N4) | 3.287 | 0.1693 | 26 |
Disclaimer/Publisher’s Note: The statements, opinions and data contained in all publications are solely those of the individual author(s) and contributor(s) and not of MDPI and/or the editor(s). MDPI and/or the editor(s) disclaim responsibility for any injury to people or property resulting from any ideas, methods, instructions or products referred to in the content. |
© 2025 by the authors. Licensee MDPI, Basel, Switzerland. This article is an open access article distributed under the terms and conditions of the Creative Commons Attribution (CC BY) license (https://creativecommons.org/licenses/by/4.0/).
Share and Cite
Seenath, A.A.; Baig, M.M.A.; Mohammed, A.S. Tribological Evaluation of Polyether Ether Ketone (PEEK) Nanocomposite Coatings Reinforced with Ceria—Effect of Composition, Load, Speed, Counterface, and UV Exposure. Polymers 2025, 17, 1487. https://doi.org/10.3390/polym17111487
Seenath AA, Baig MMA, Mohammed AS. Tribological Evaluation of Polyether Ether Ketone (PEEK) Nanocomposite Coatings Reinforced with Ceria—Effect of Composition, Load, Speed, Counterface, and UV Exposure. Polymers. 2025; 17(11):1487. https://doi.org/10.3390/polym17111487
Chicago/Turabian StyleSeenath, Amal A., Mirza Murtuza Ali Baig, and Abdul Samad Mohammed. 2025. "Tribological Evaluation of Polyether Ether Ketone (PEEK) Nanocomposite Coatings Reinforced with Ceria—Effect of Composition, Load, Speed, Counterface, and UV Exposure" Polymers 17, no. 11: 1487. https://doi.org/10.3390/polym17111487
APA StyleSeenath, A. A., Baig, M. M. A., & Mohammed, A. S. (2025). Tribological Evaluation of Polyether Ether Ketone (PEEK) Nanocomposite Coatings Reinforced with Ceria—Effect of Composition, Load, Speed, Counterface, and UV Exposure. Polymers, 17(11), 1487. https://doi.org/10.3390/polym17111487