4.1. Comparison of Simulation and Experiment
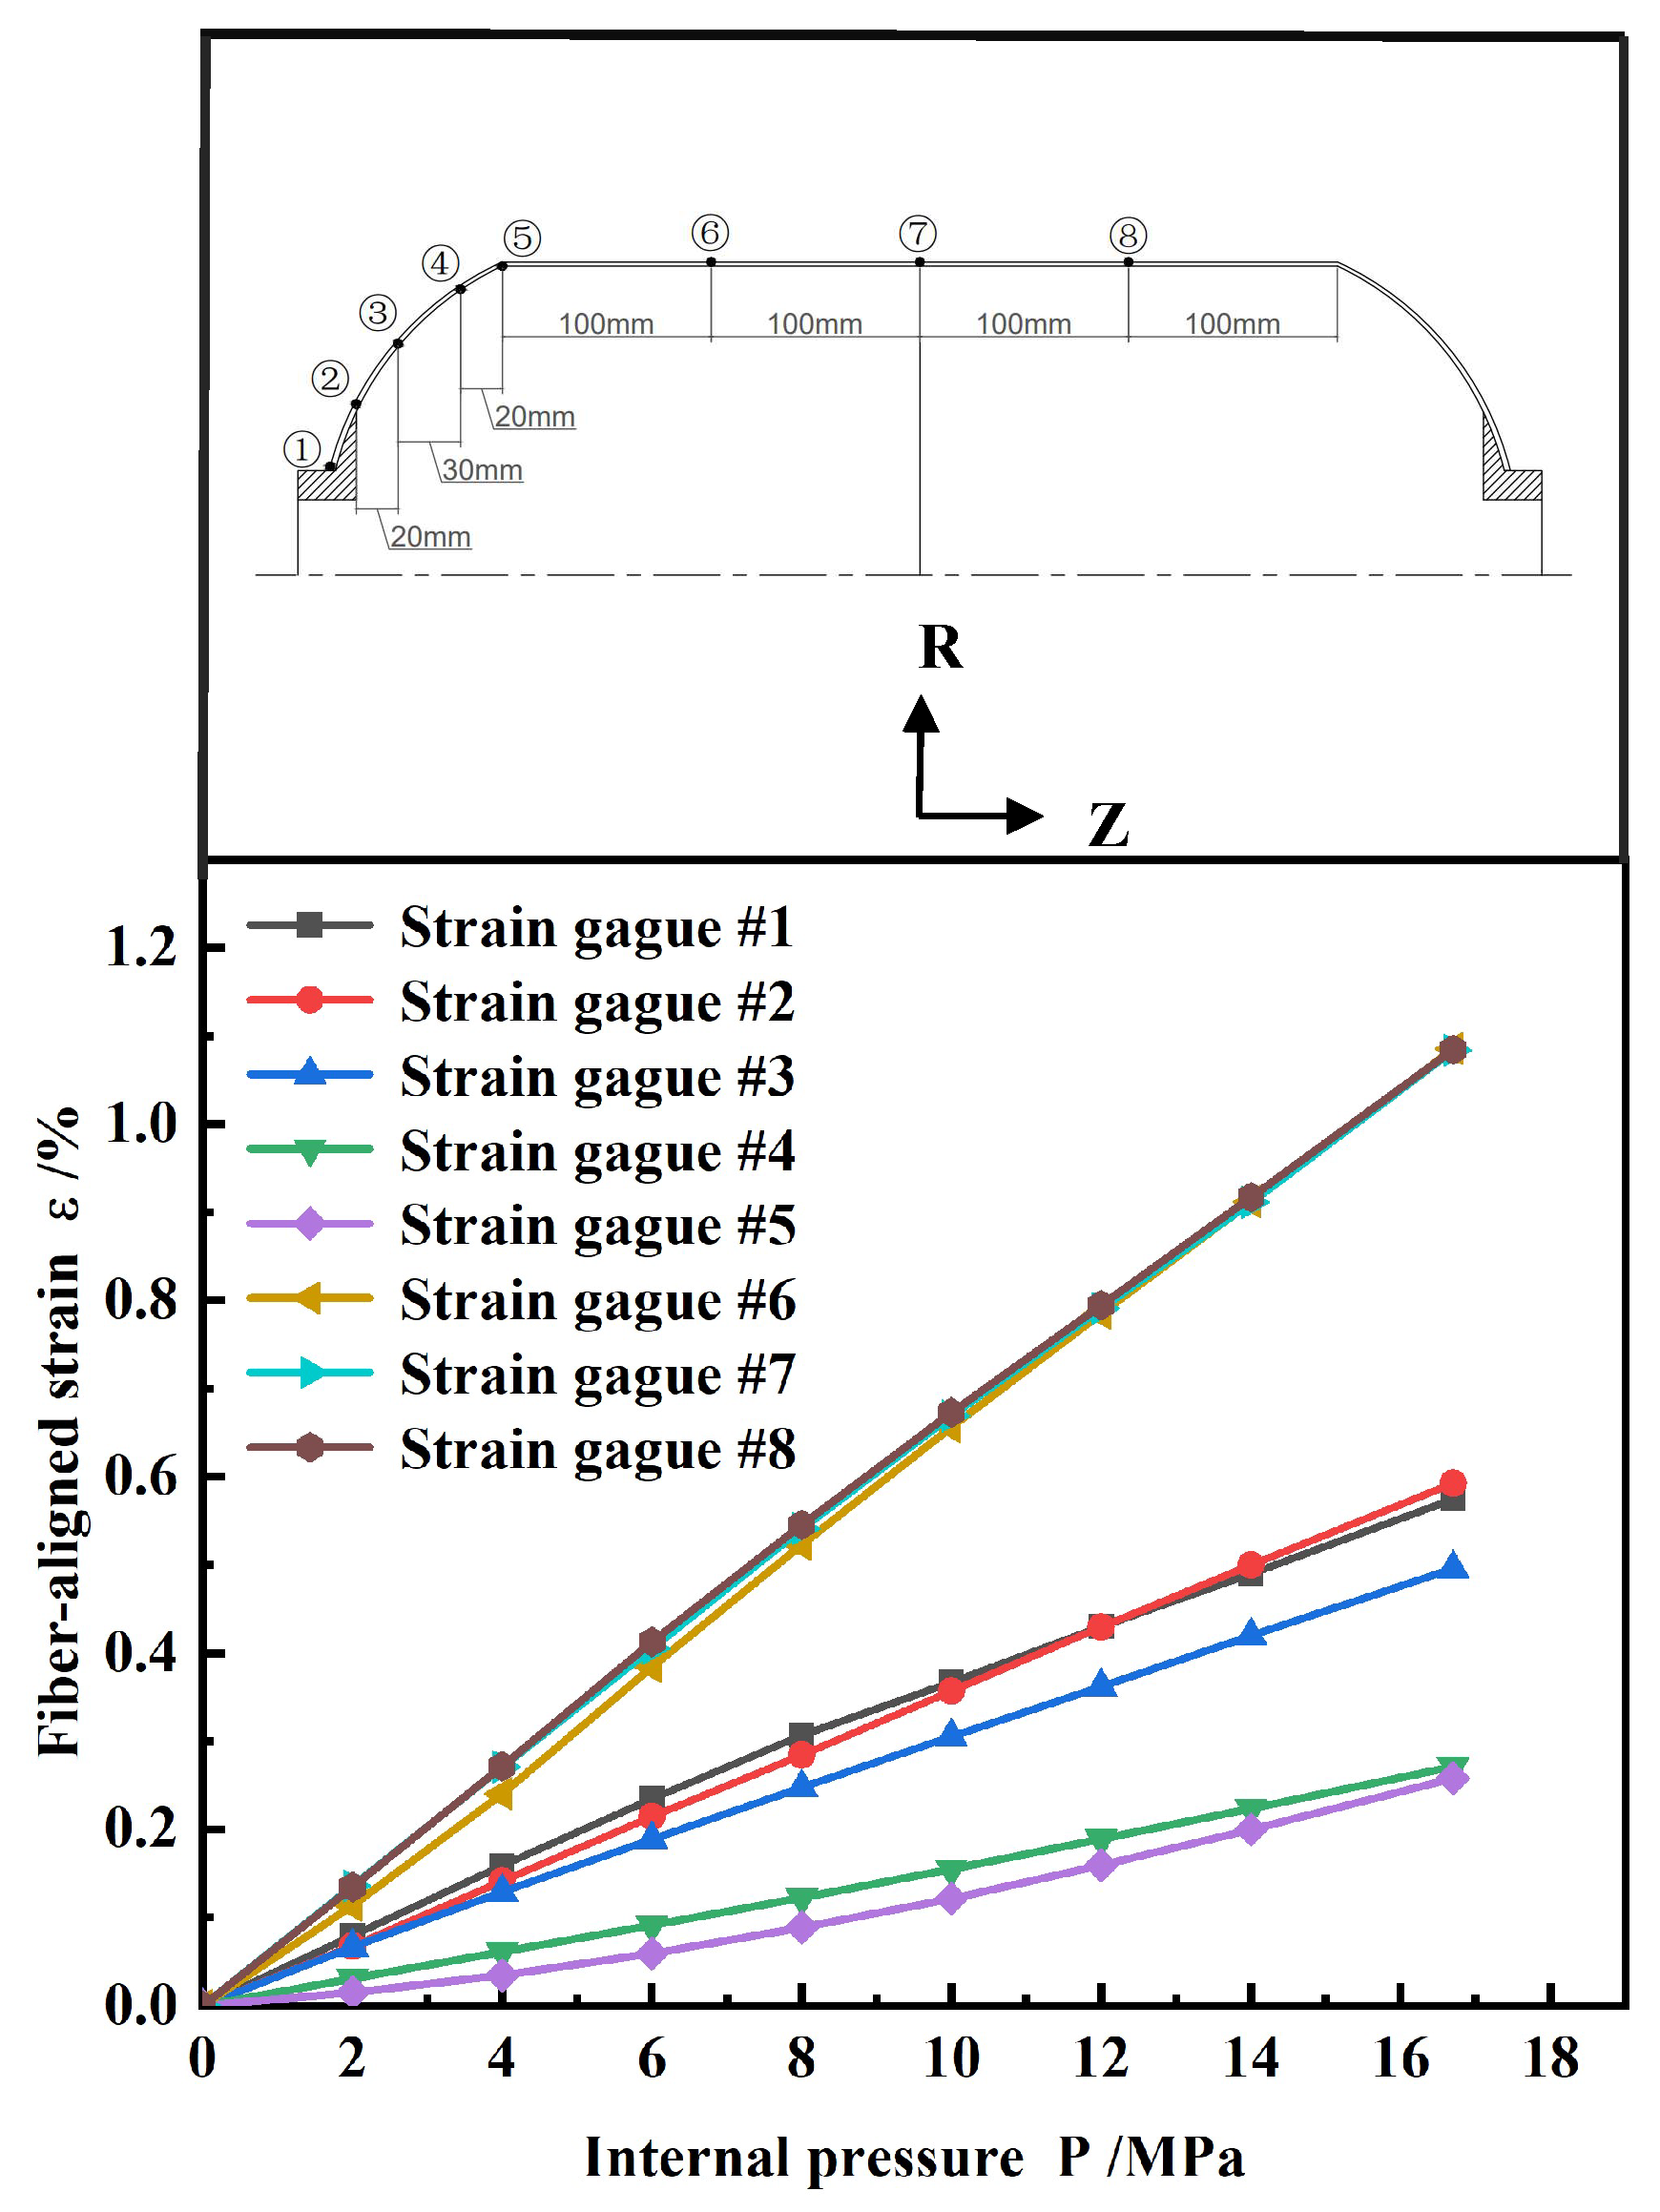
Figure 8 shows the relationship curve of fiber-aligned strain with internal pressure at 16.7 MPa. The strain increase was linear, with no obvious nonlinear characteristics observed. This indicated that the shell maintained good structural integrity under high-pressure conditions. Moreover, strain in the head section was significantly lower than in the barrel section, verifying the effectiveness of the reinforcement structure in reducing local strain.
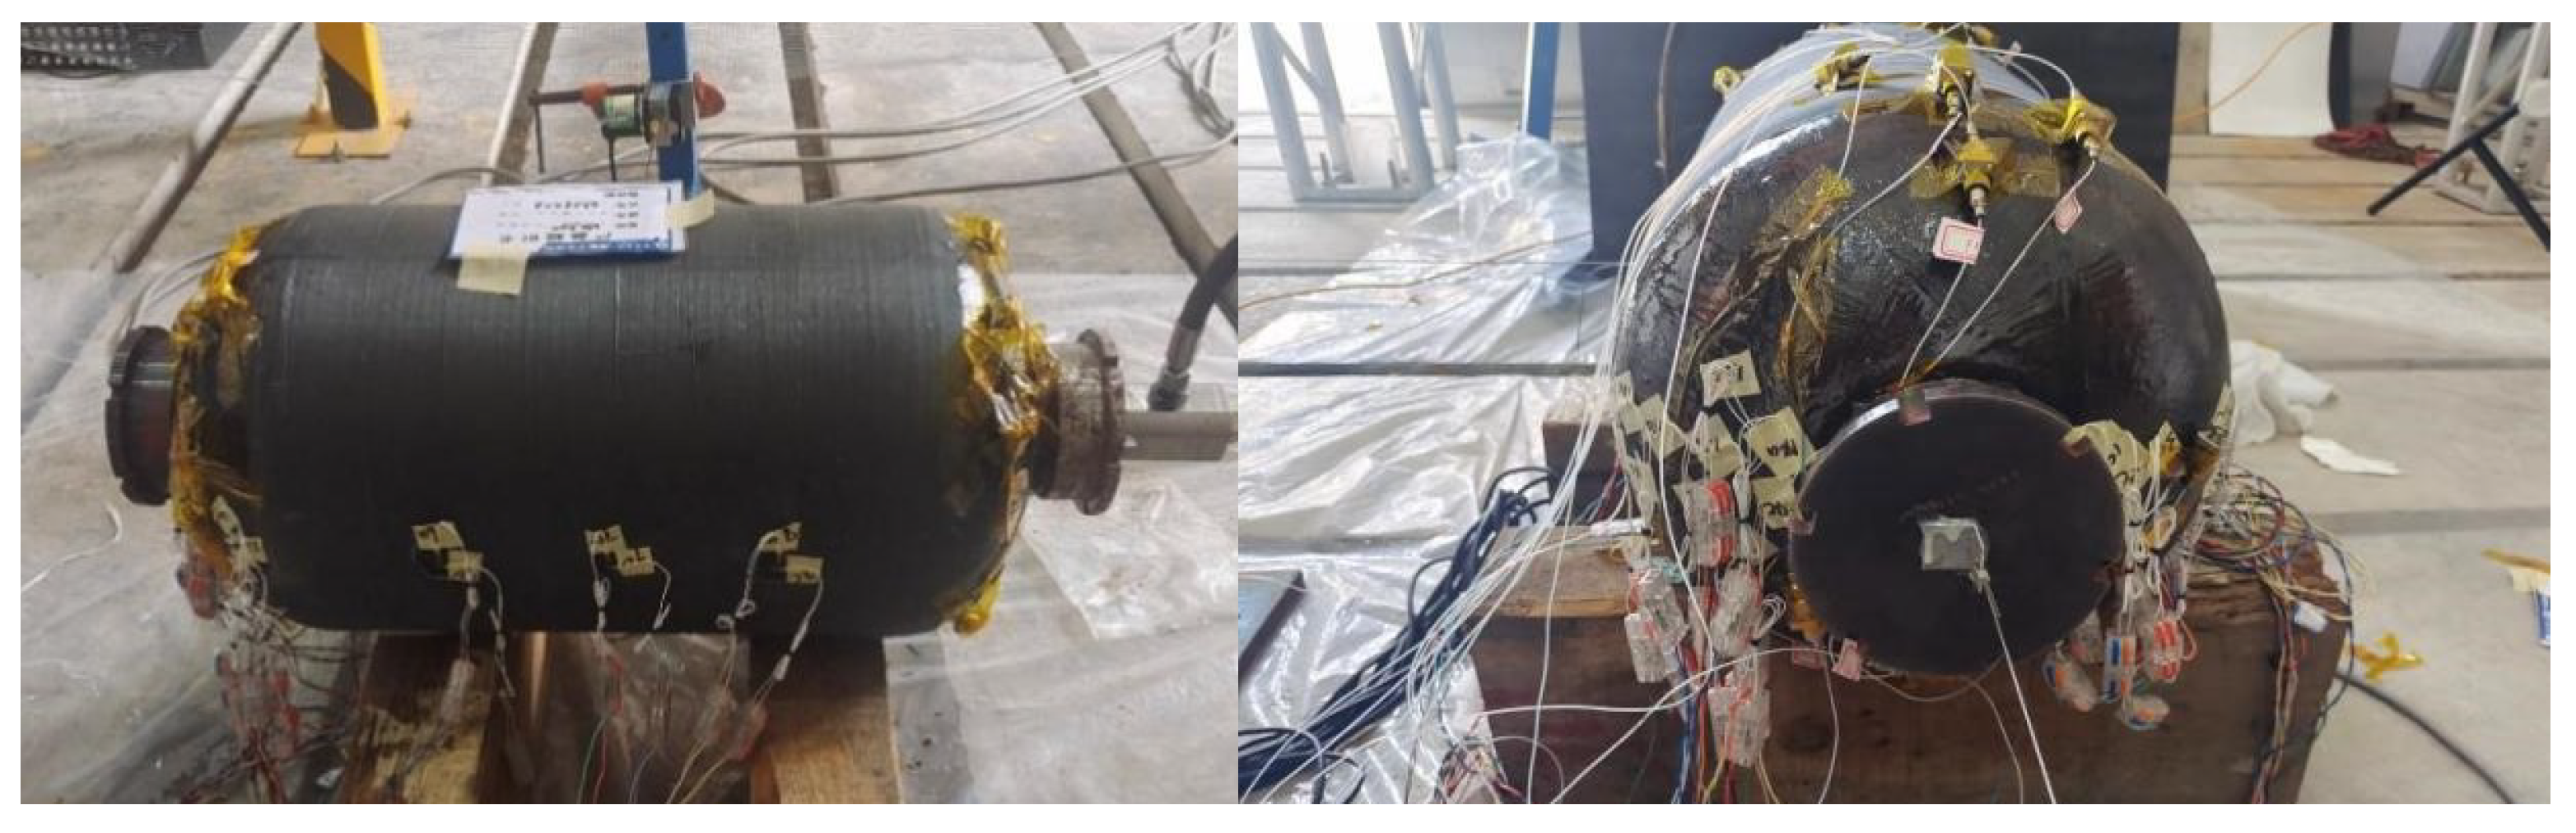
Previous tests have shown that damage to unreinforced structures mainly occurs at the interface between the metal head joint and the composite layer. Common failure modes include fiber breakage due to stress concentration at the interface and detachment of the metal joint from the composite layer under shear stress. This type of failure weakens the local load transfer capability and exacerbates overall structural degradation. This test further verified the effectiveness of the head reinforcement structure in enhancing the load-carrying capacity of the metal joint shoulder. Under low-pressure blasting conditions, the reinforcement structure effectively inhibited interface damage in the head section and prevented the metal joint from detaching or being ejected, improving the safety and integrity of the structure.
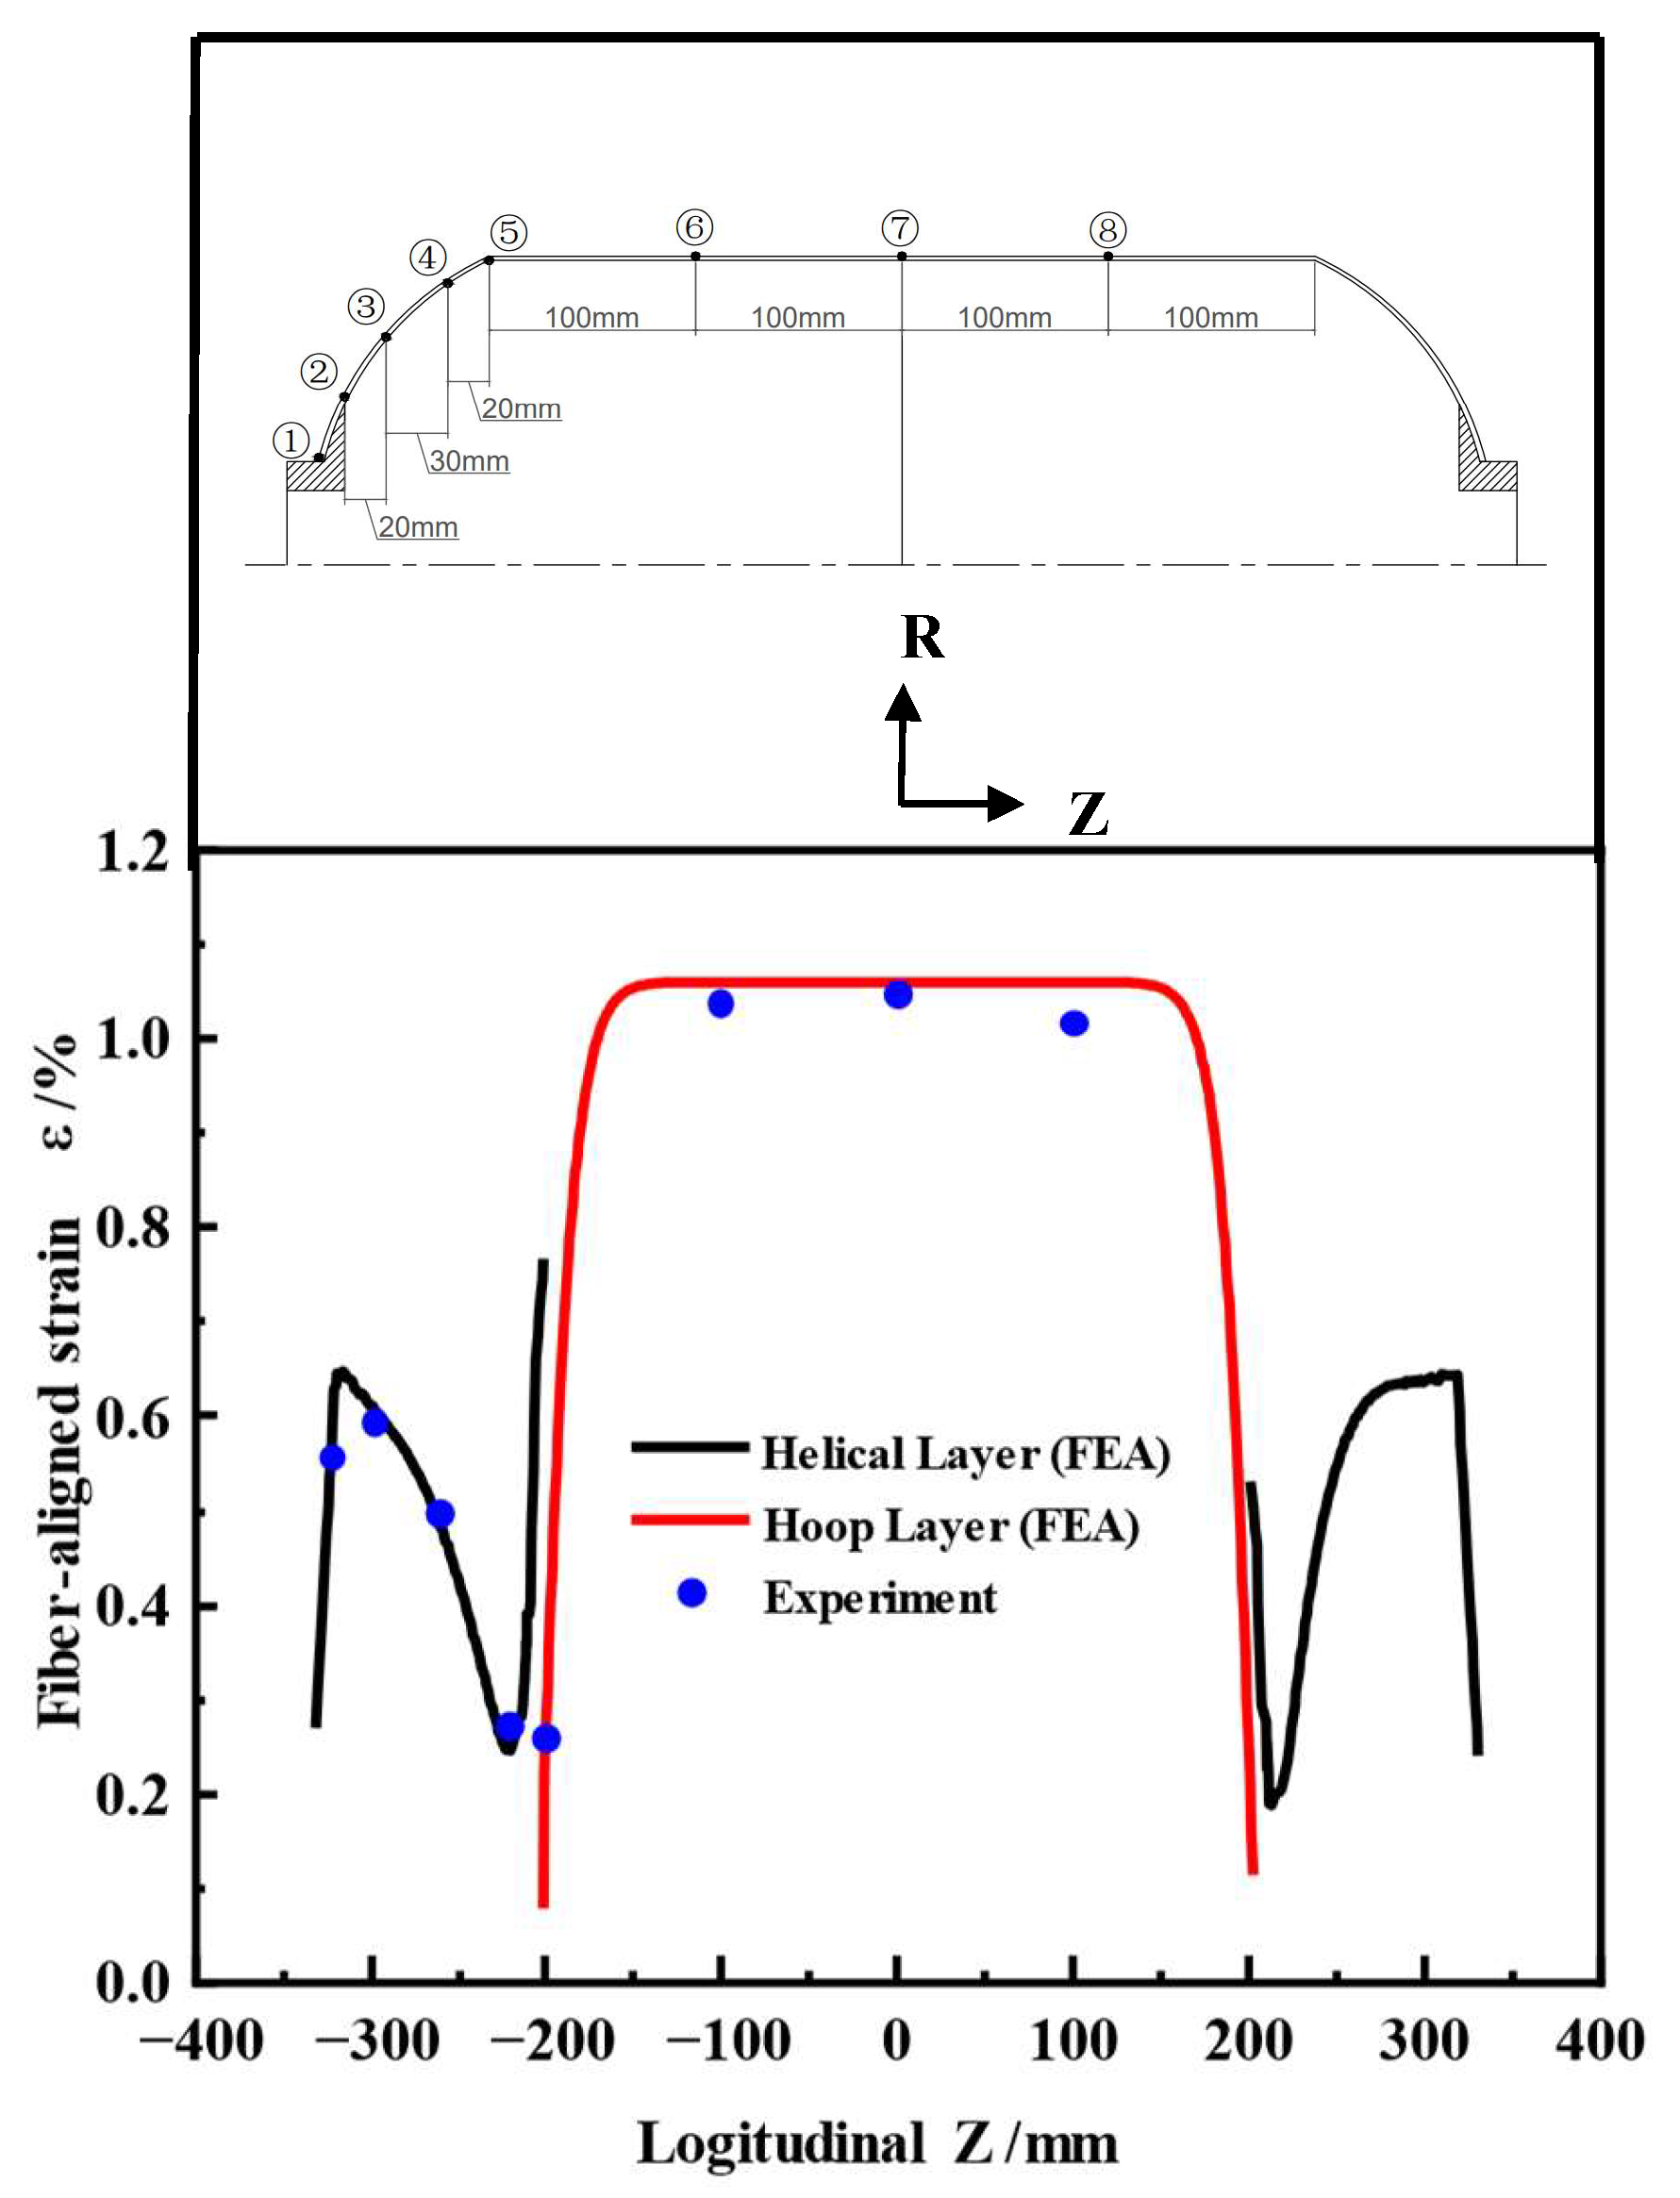
Figure 9 compares the fiber-aligned strains measured from the tests at 16.7 MPa water pressure with the finite element simulation results. Since the strain gauges were attached to the shell surface, the measured values correspond to the strain distribution in the outermost fiber layer. The black curve indicates the strain of the helical winding layer in the head section, while the red curve indicates the strain of the hoop winding layer in the barrel section.
Overall, the test values were in good agreement with the simulation results. The point with the largest deviation in the head section was point 4, showing an error of 5.9%. This point was located near the equator, which was the geometrical transition region from the cylinder section to the head section. The sudden change in local structure led to stress redistribution. The lack of hoop winding layer support in this region, along with the abrupt local stiffness change, limited the deformation, leading to a small strain value at this point. The maximum error in the barrel section occurred at point 8, with a 4% error, but the error at its symmetric position, point 6, was only 2%. Although the structure was symmetrical, the error still differed, which may have been related to measurement errors (such as strain gauge placement, contact state, or environmental effects). Manufacturing deviations, such as local layup deviation or resin enrichment, could lead to stiffness inconsistencies and cause deviations. Despite the local errors, the overall errors were within the engineering allowable range, confirming the accuracy and reliability of the simulation results.
4.2. Optimized Design of Finite Element Modeling
Traditional finite element simulation faces issues such as long computational cycles and high costs in structural optimization design. To address these problems, this paper introduces the surrogate modeling method. The agent model can predict the original model’s response with low computational resources, enabling the quick evaluation of different design parameter combinations and improving optimization efficiency. First, an experimental design was carried out before optimization. Then, the neural network agent model was constructed by combining approximate model optimization theory [
25,
26,
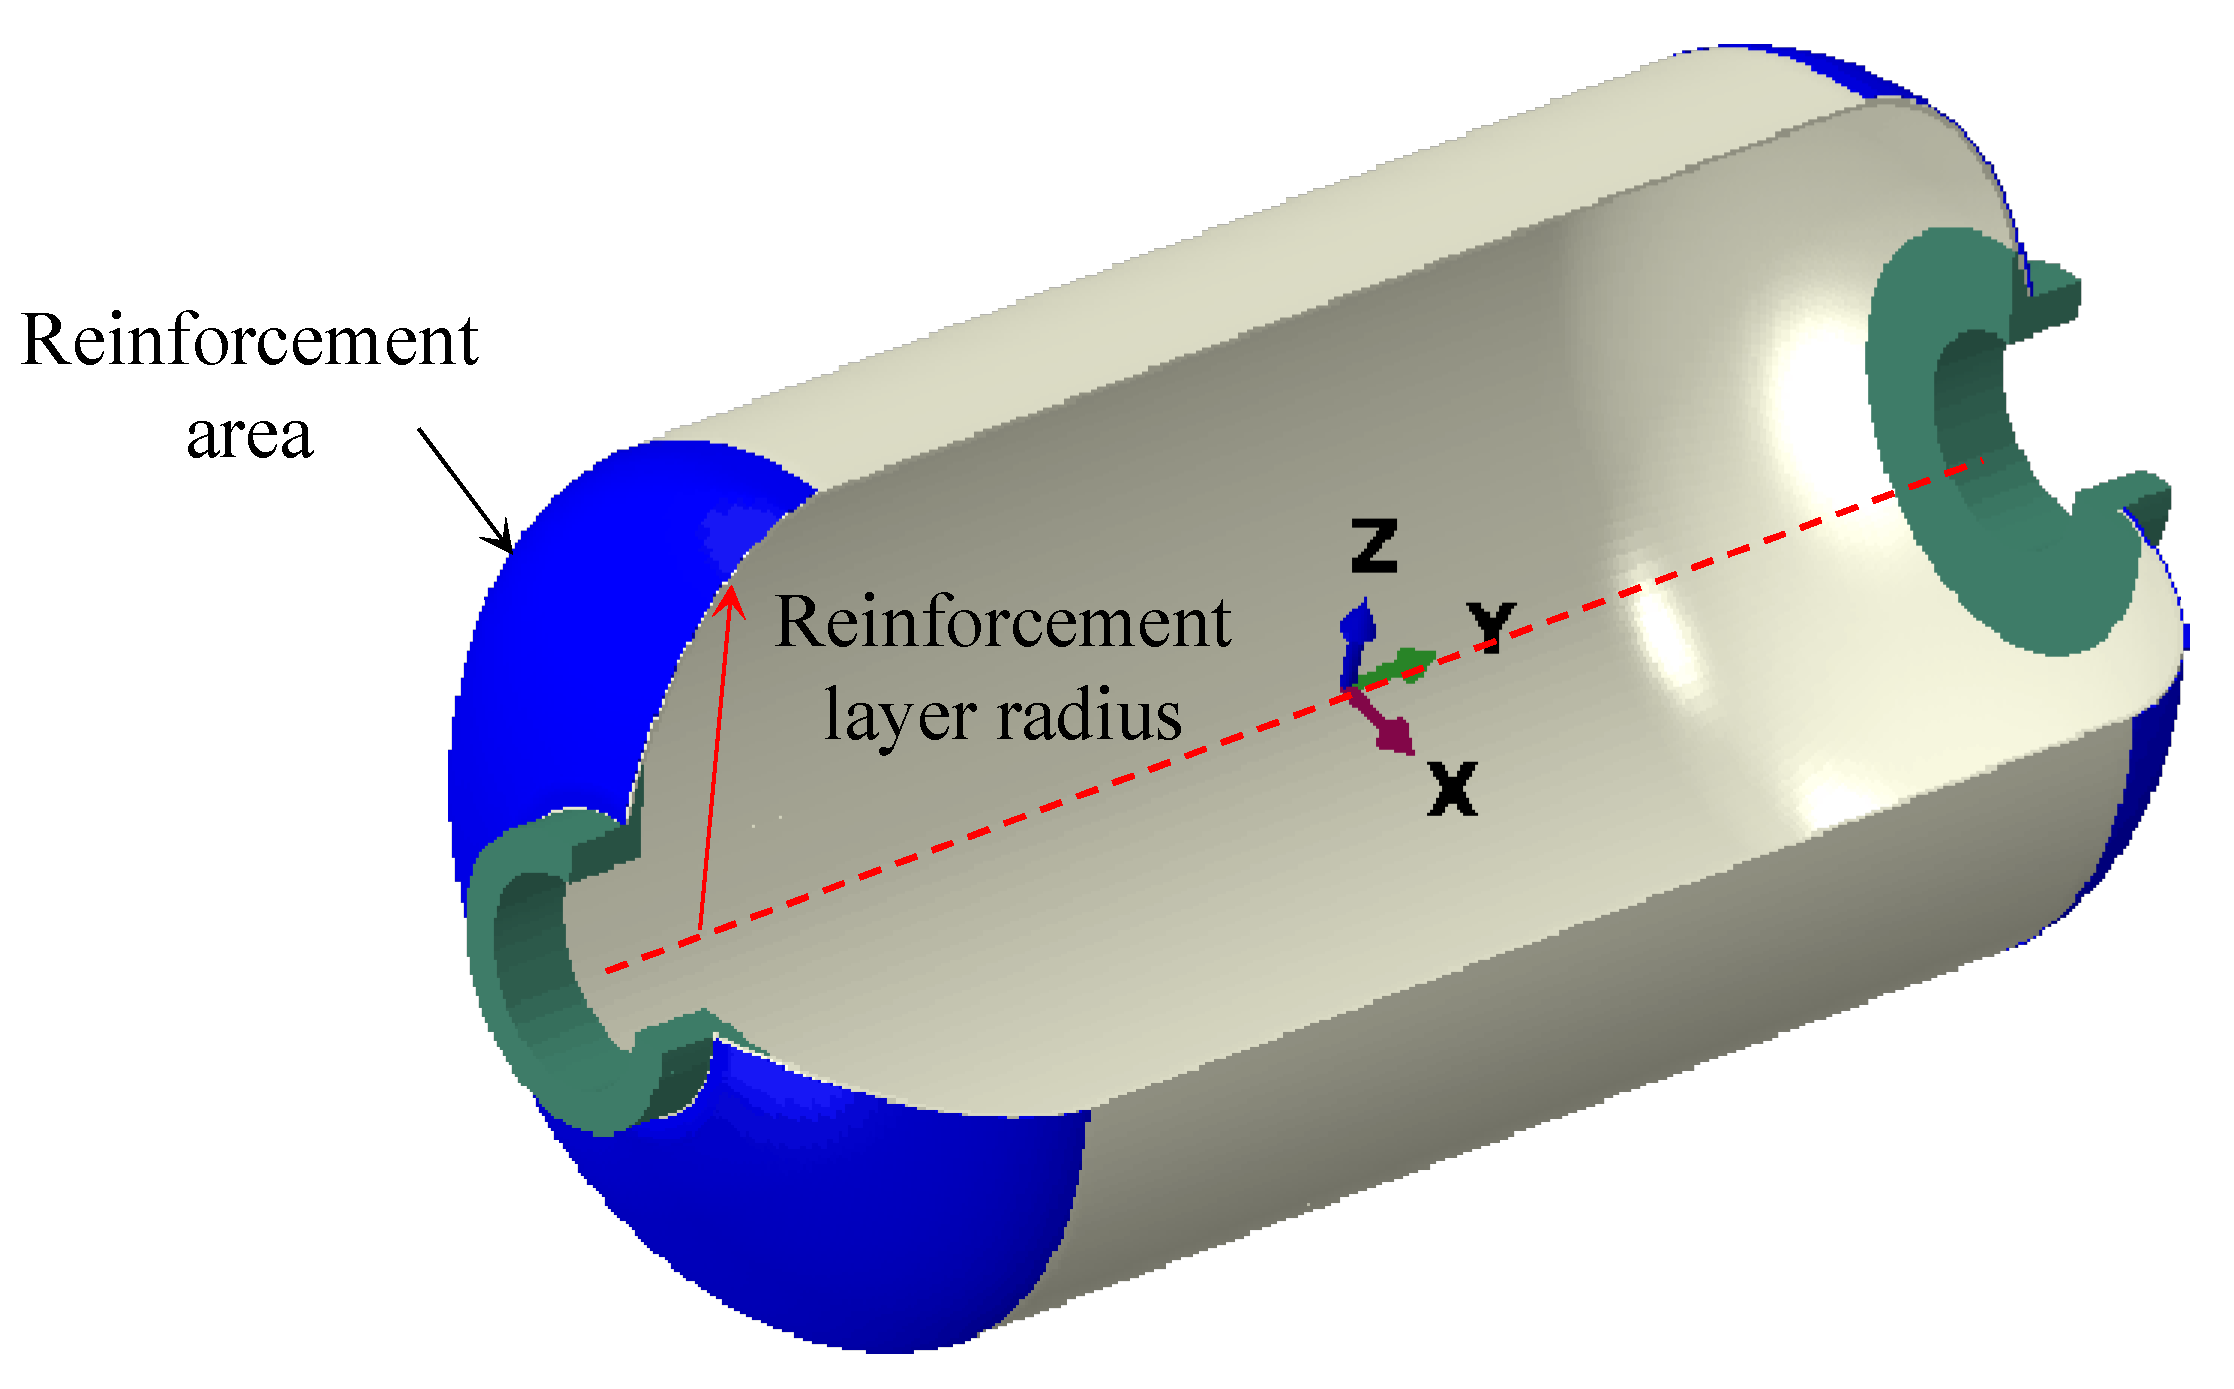
27]. Based on engineering practice in fiber wound shells, the starting radius, number of reinforcement layers, and fiber bandwidth were selected as design variables. T700 carbon fiber braided fabric was selected as the reinforcement material, with a single layer thickness of 0.2 mm. The schematic diagram of shell reinforcement is shown in
Figure 10.
Table 5 lists the range of values for the design variables. These parameters significantly affected structural performance. The starting radius of reinforcement affected both stress distribution and material usage in the head region; the number of reinforcement layers impacted the balance between the strength and weight of the shell; and the bandwidth determined winding efficiency and the uniformity of stress distribution. Selecting the optimal combination of parameters was crucial for structural performance optimization.
To construct the surrogate model, 30 design points were generated using Latin hypercube sampling [
28,
29] (LHS) within the defined design space. These were used to compute the maximum fiber-aligned stress in the dome region via finite element simulation, and the resulting dataset was used to train a neural network model.
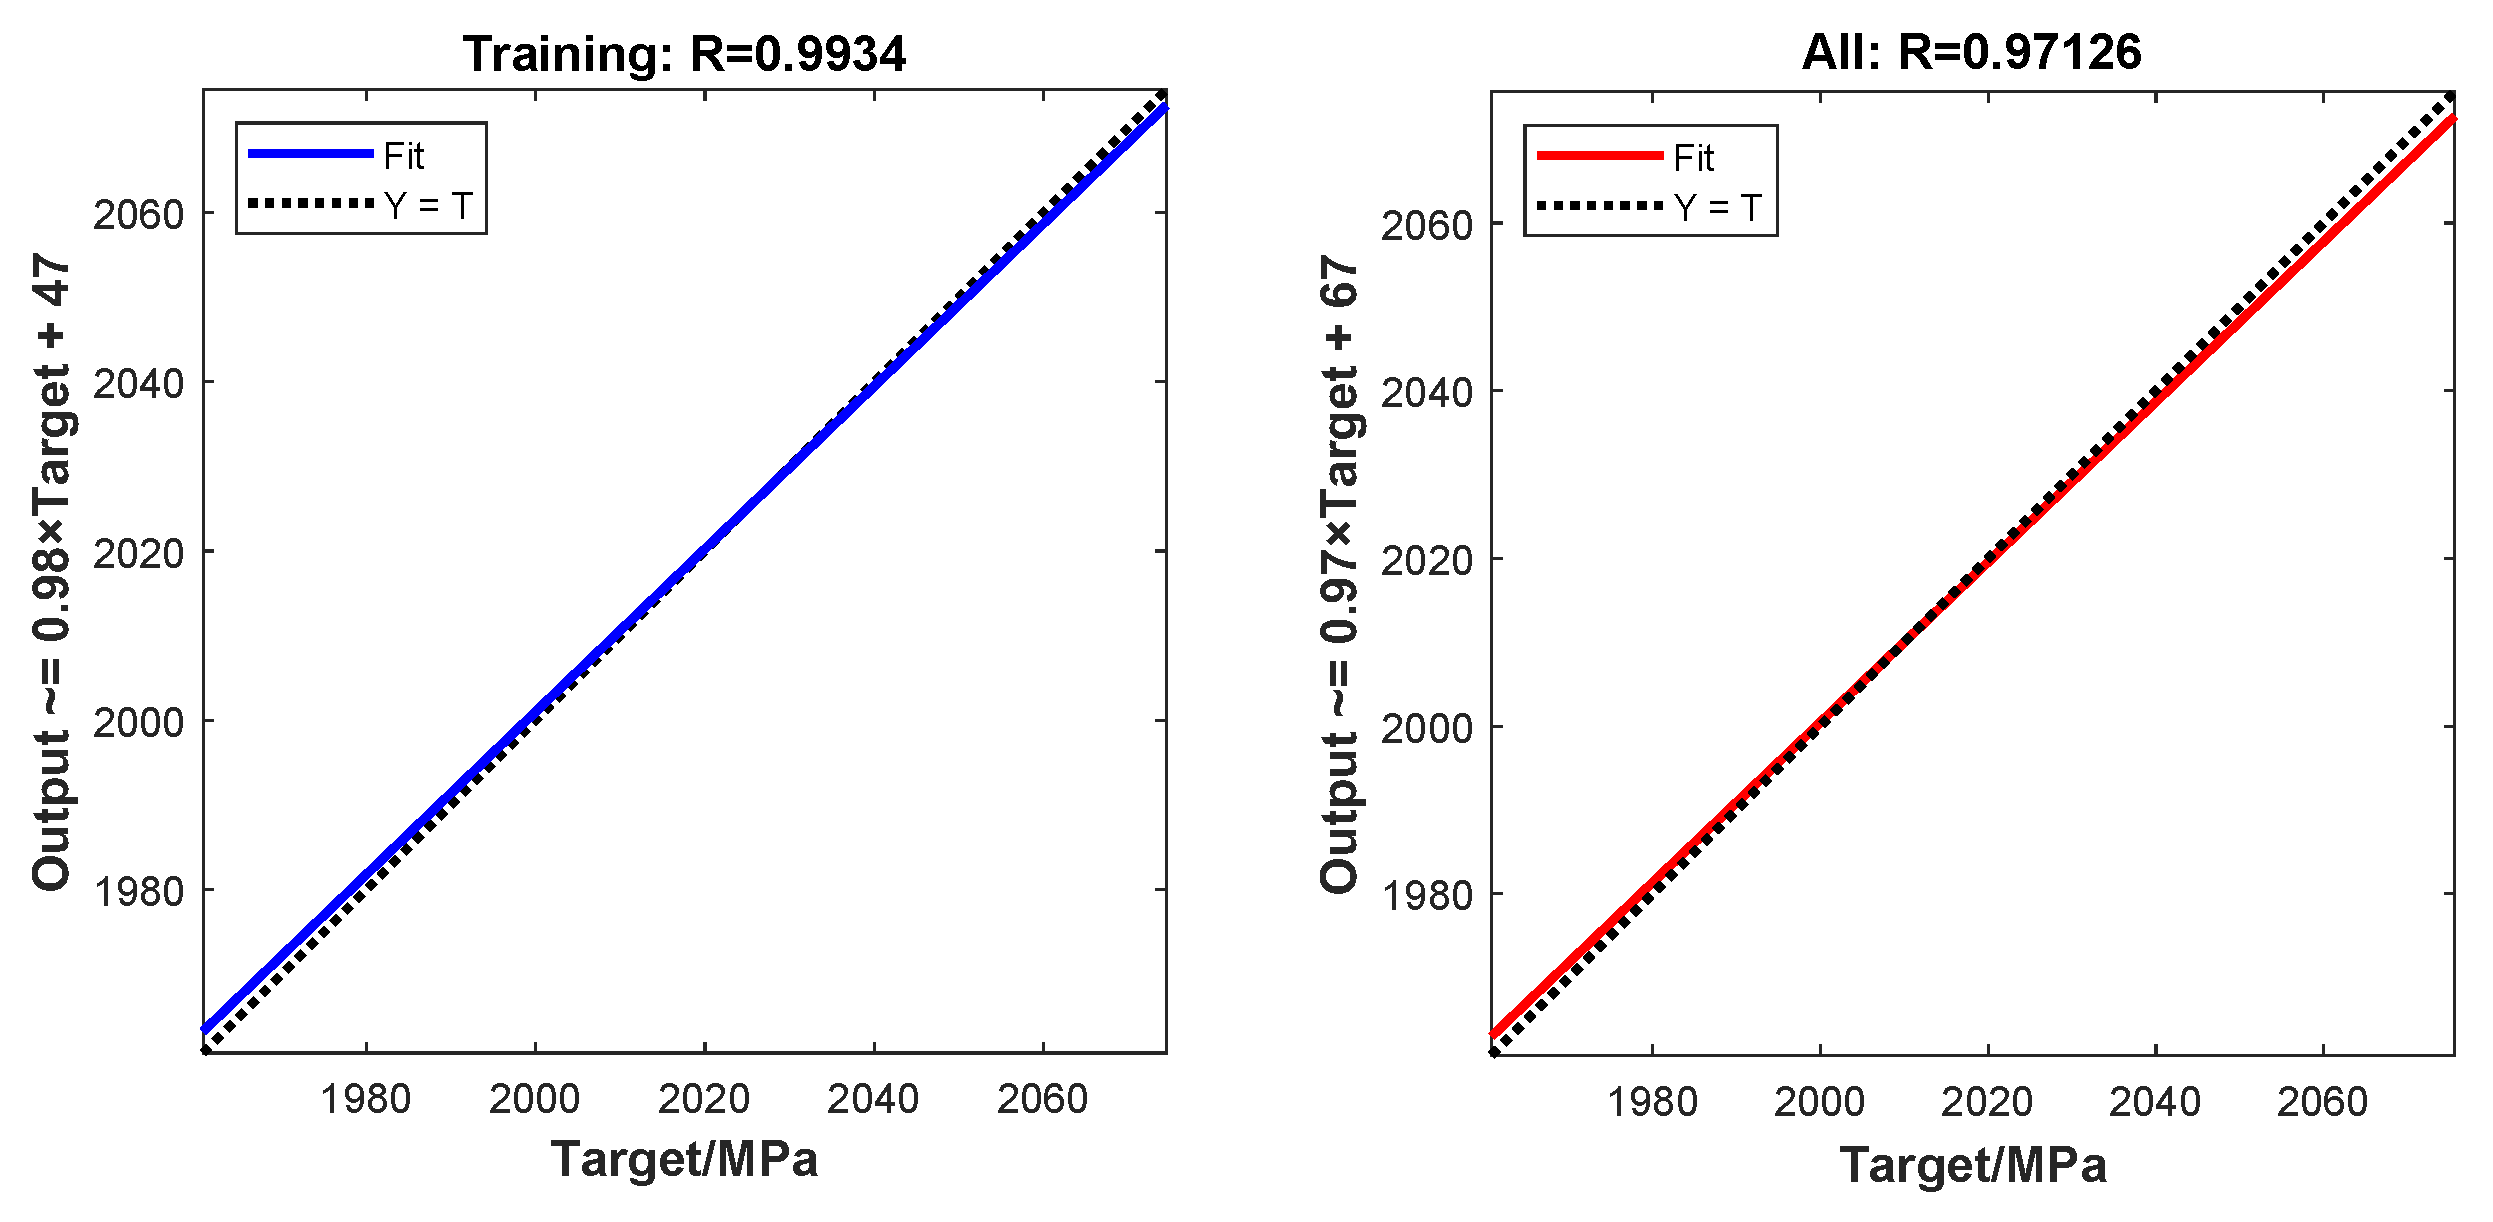
The constructed neural network adopted a 3-5-1 architecture: three input neurons (corresponding to the three design variables), five neurons in a single hidden layer, and one output neuron that predicted the system response. To rigorously evaluate model performance, the dataset was randomly split into training, validation, and testing subsets at a 70%:15%:15% ratio, ensuring stratified coverage across all parameter ranges.
The left panel of
Figure 11 shows the neural network’s fit to the training set, with a correlation coefficient of 0.99, indicating that the model accurately captured the underlying patterns in the training data. The correlation analysis of the overall dataset is shown in the right panel of
Figure 11, with a correlation coefficient of 0.97, further validating the model’s strong fit and generalization capability.
To further evaluate the generalization capability of the surrogate model, we employed additional winding configurations that were not included in the original dataset. These configurations served as unseen FEA simulation cases to assess the predictive performance of the model. As shown in
Table 6, the predicted fiber-aligned stresses were compared with the corresponding FEA results, and the relative errors were found to be 0.23%, 0.11%, and 0.19%, respectively. The results indicated that the surrogate model maintained a reasonable level of accuracy when applied to new input conditions.
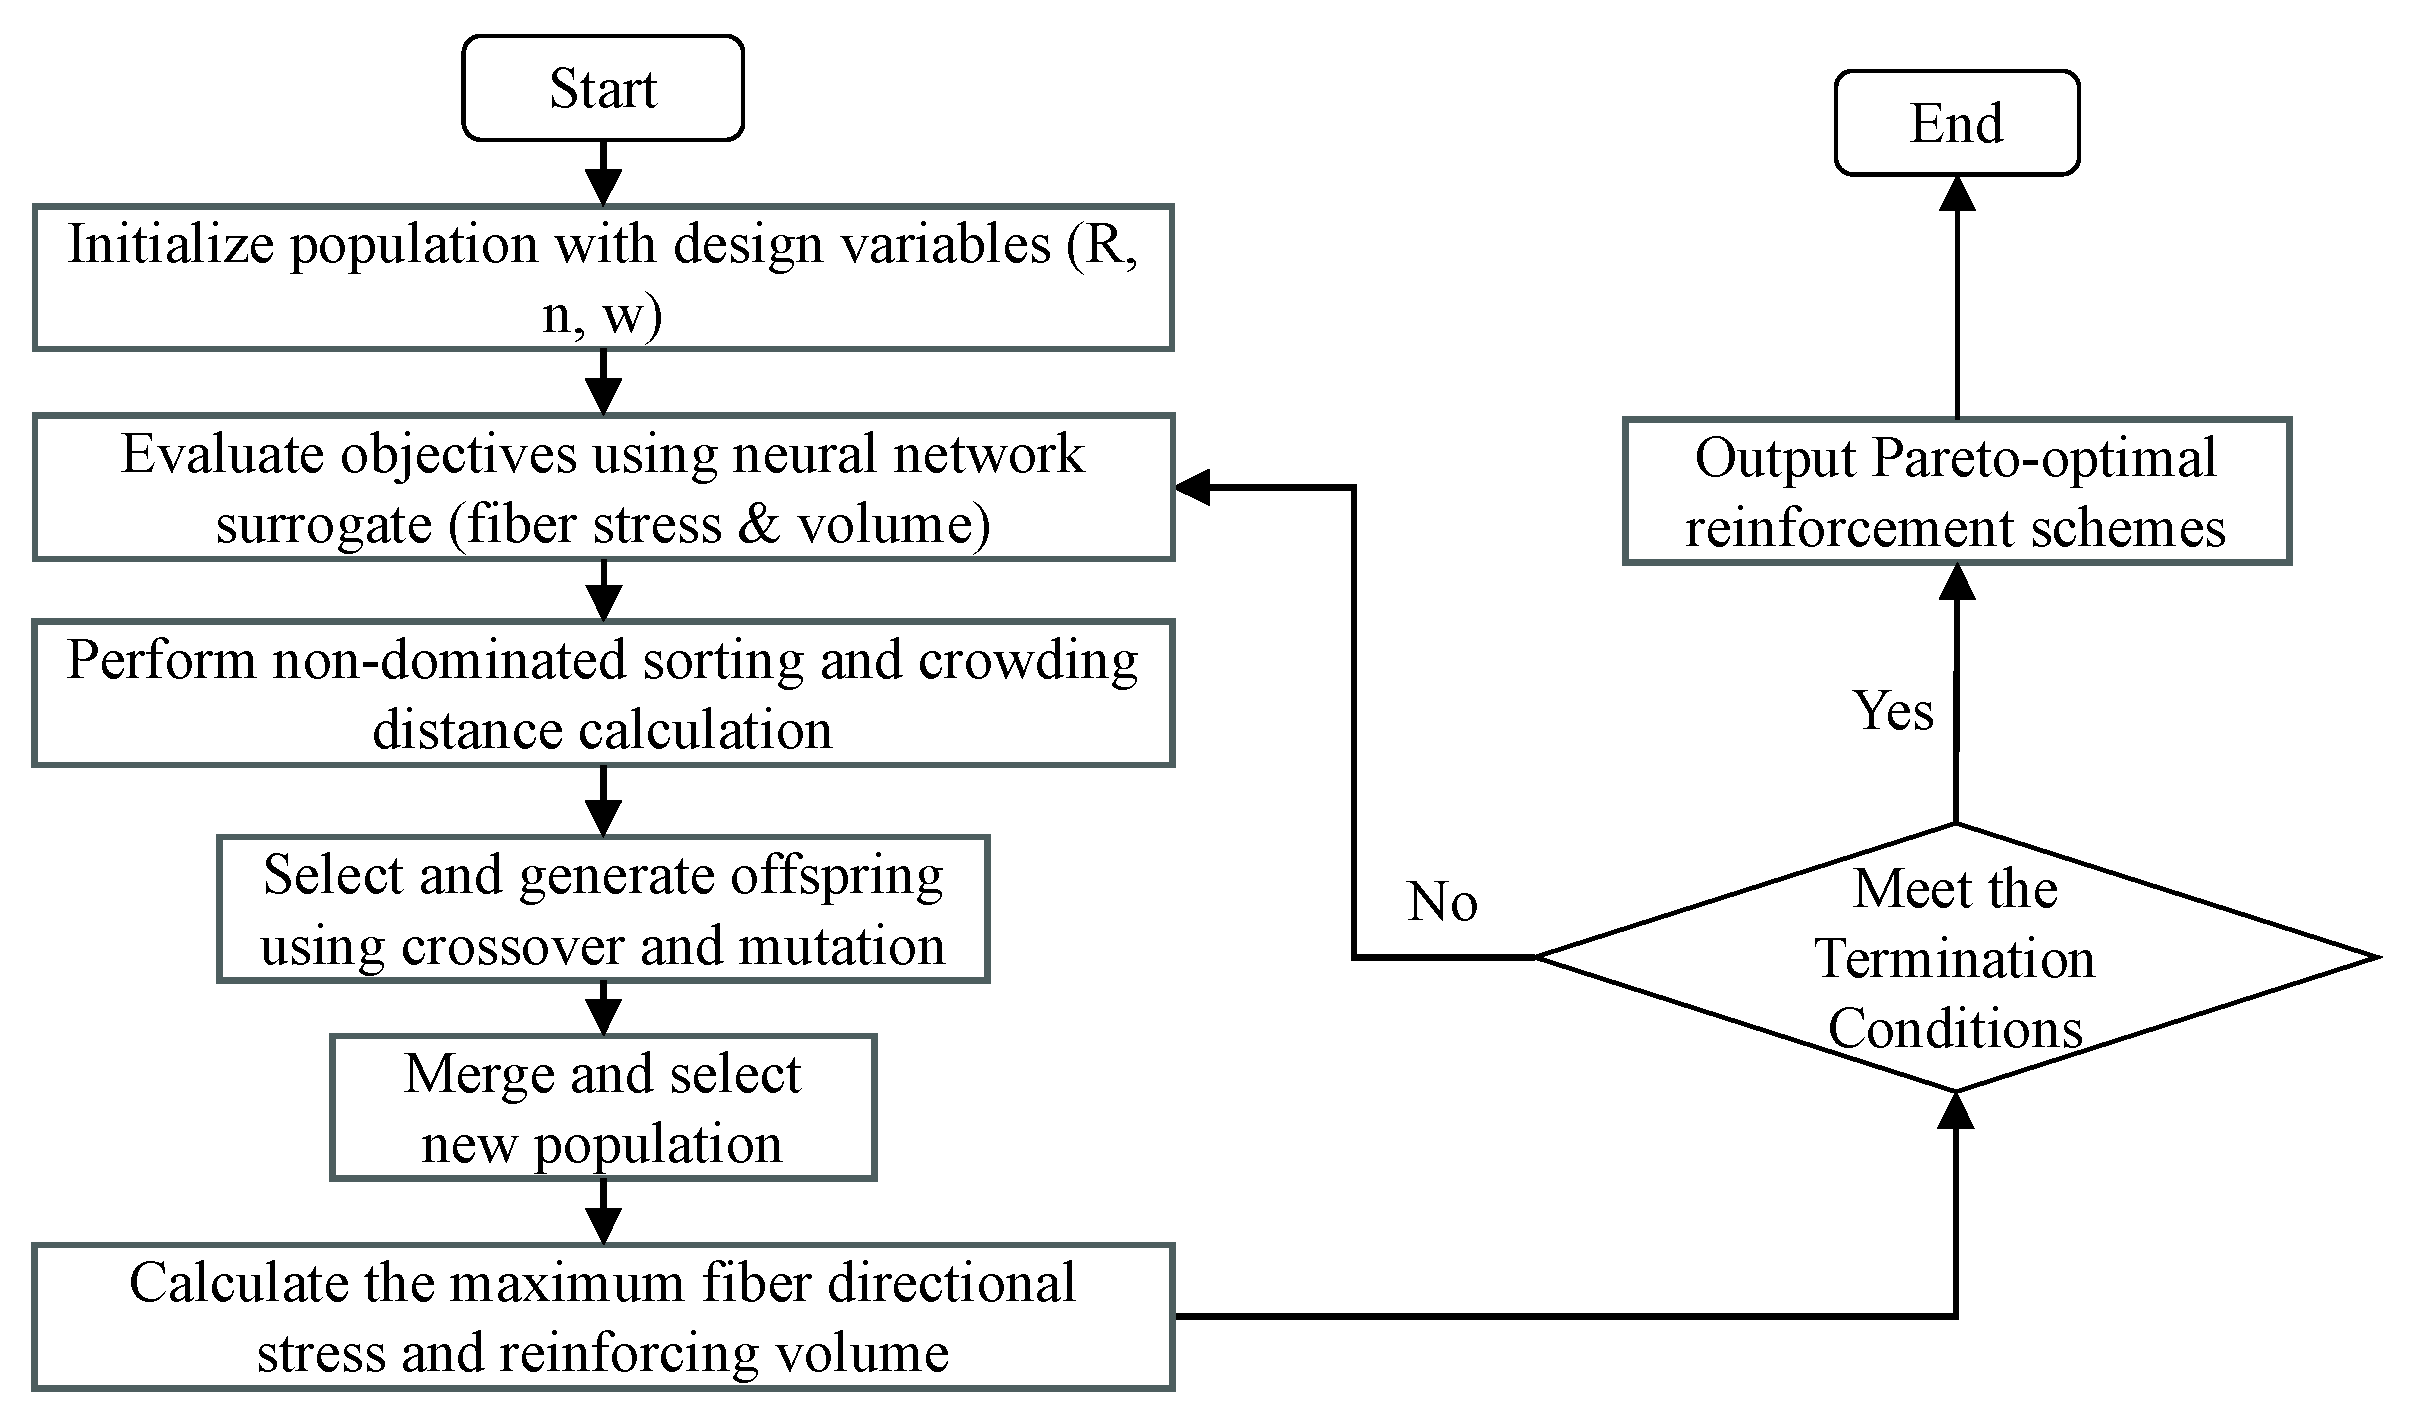
Considering the complexity of the multi-objective optimization task, the NSGA-II algorithm [
30,
31] was adopted due to its proven capability to handle non-linear objectives and ensure a diverse and well-converged Pareto front. In this study, two competing objectives were considered: minimizing fiber-aligned stress and minimizing reinforcement volume in the dome region. The reinforcement starting radius R, number of reinforcement layers n, and fiber bandwidth w were selected as design variables, each constrained within feasible manufacturing ranges.
F(x) is the fitness function. The neural network surrogate model was used to evaluate objectives efficiently during the optimization.
Figure 12 illustrates its optimization process.
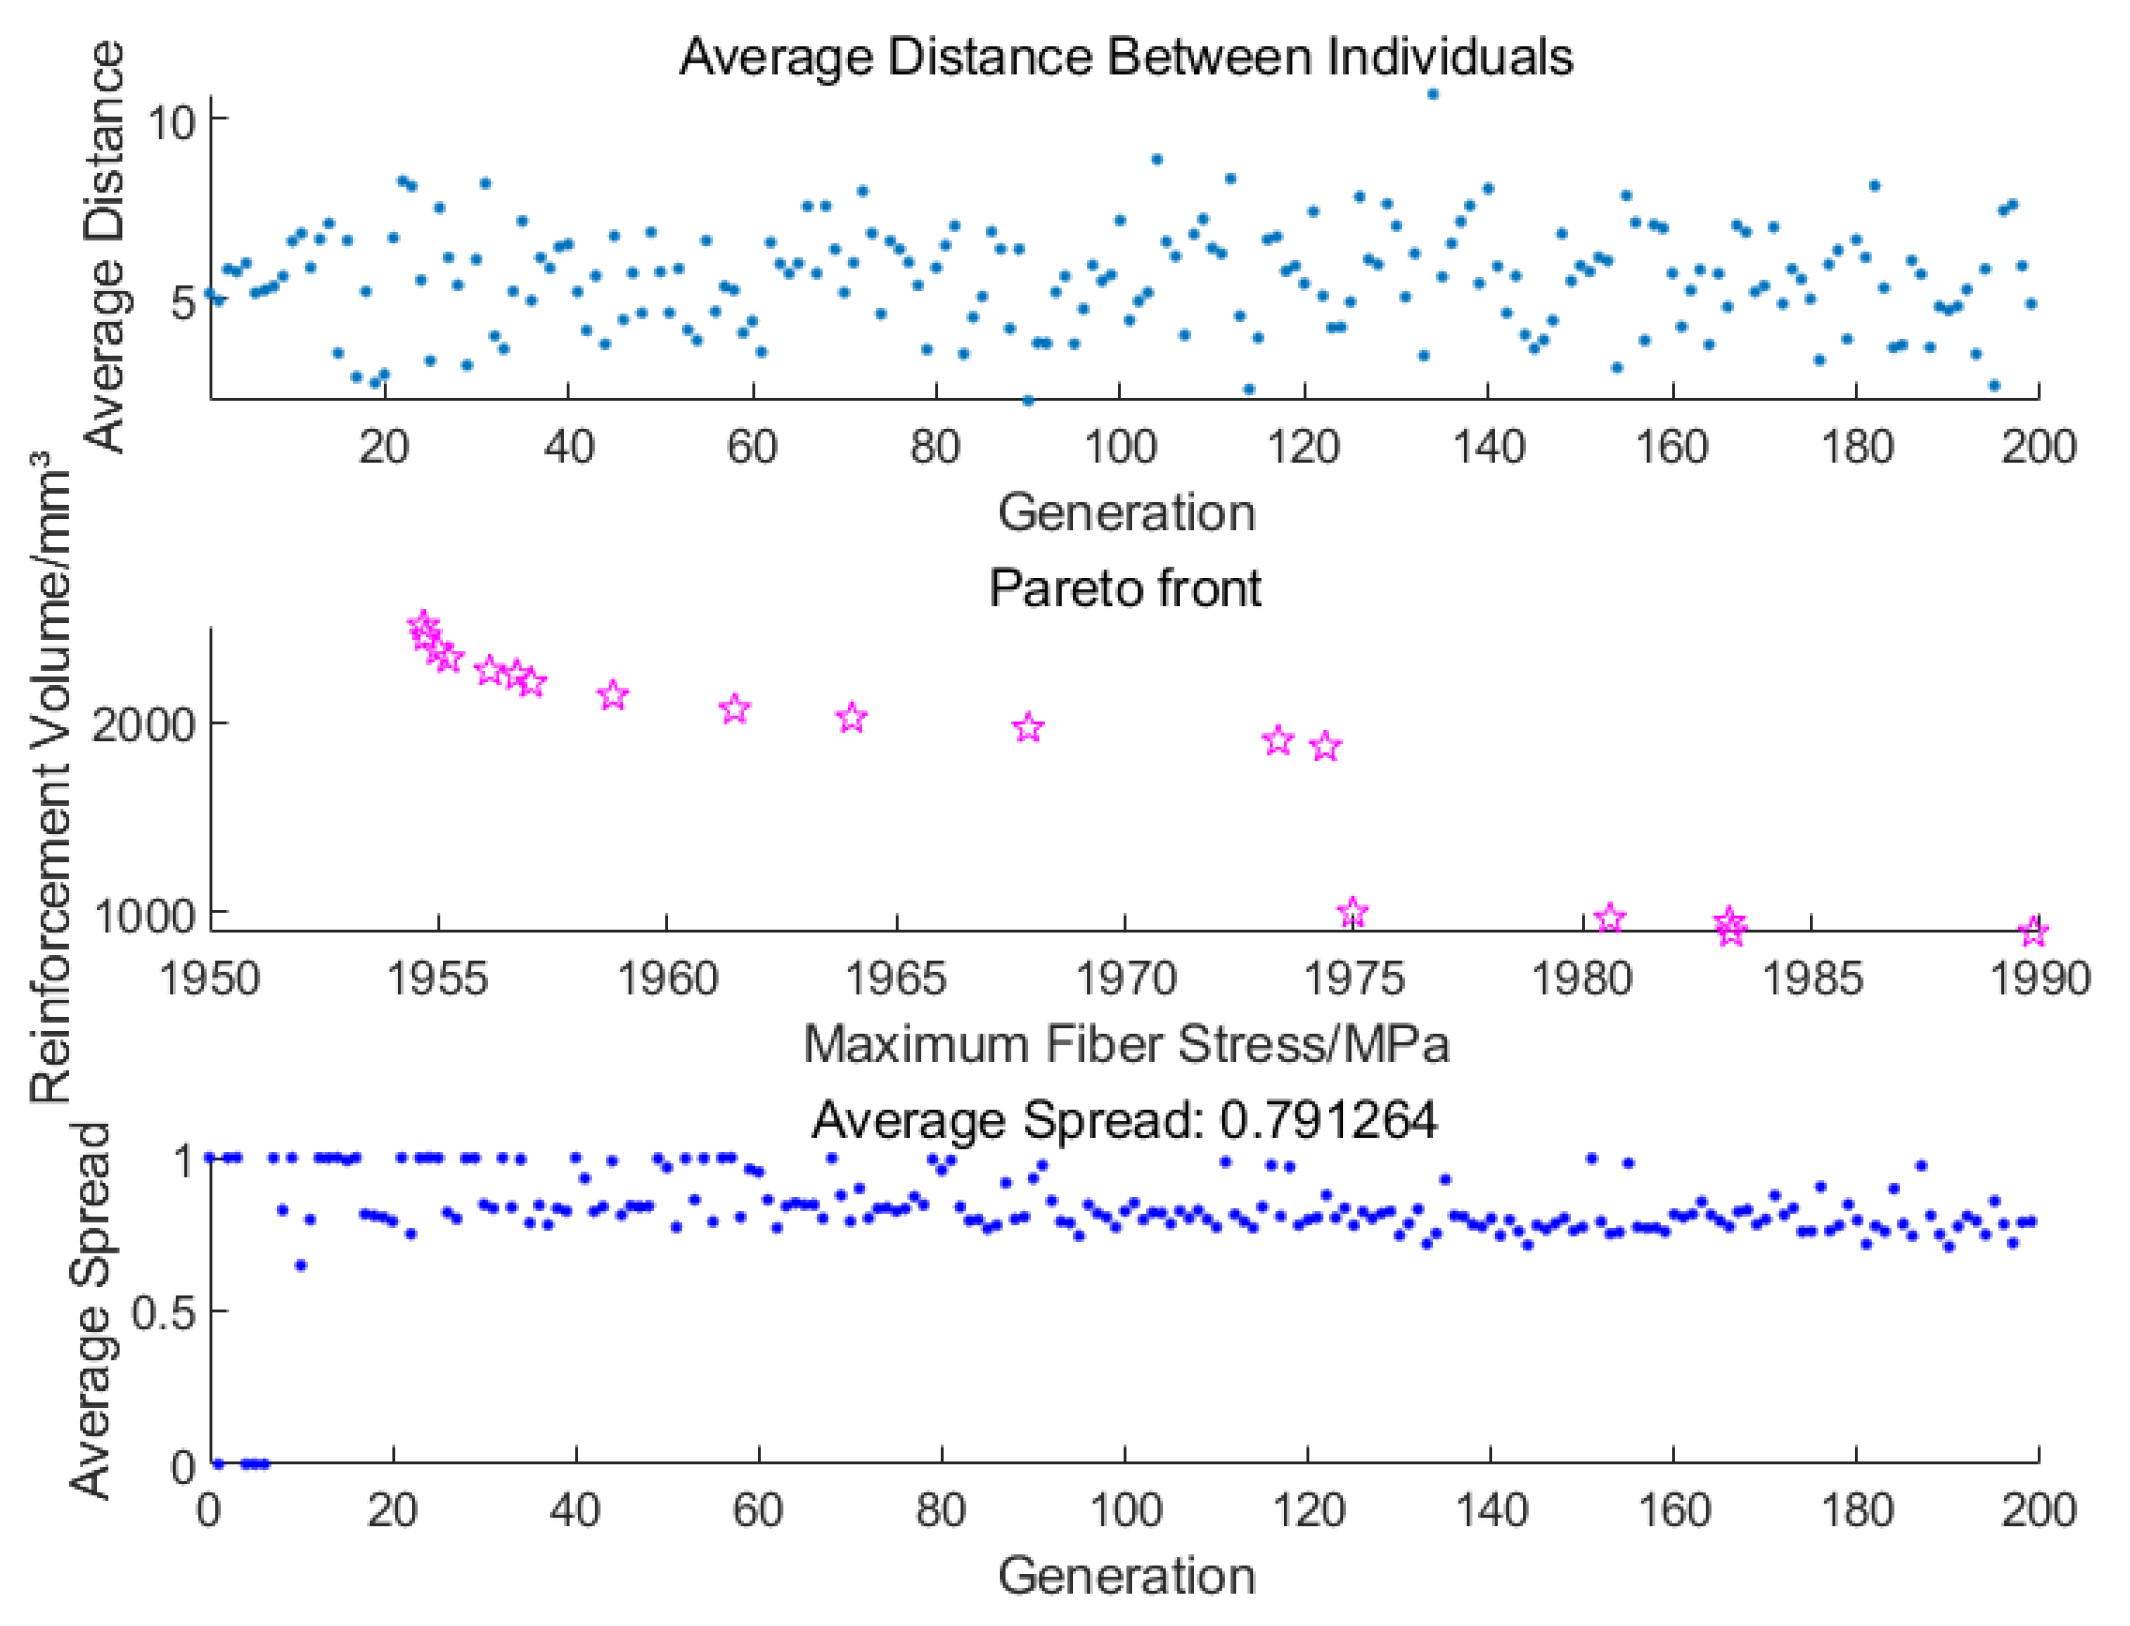
Figure 13 illustrates the results of the head reinforcement optimization process. The average distance of the population individuals in each generation (blue dots) fluctuates between 5 and 10 without any significant decrease, indicating that the population diversity remains high, which helps to avoid premature convergence. The Pareto front for objective 1 (fiber stress) and objective 2 (reinforcement volume) is uniformly distributed with good coverage, where the pink stars represent the non-dominated solutions obtained during the optimization process. This demonstrates that the algorithm achieves a satisfactory trade-off between multiple objectives. The average spread in each generation (also shown with blue dots) stabilizes at 0.8, suggesting that the solution set exhibits both good coverage and diversity.
The objective of this study was to achieve reinforcement lightweighting while maintaining structural strength. The results show that when R = 67 mm, n = 1 layer, and w = 7 mm, the optimal solution met the strength requirement (stress < 2000 MPa) and effectively minimized the reinforcement volume.
Table 7 lists the specific parameters of this design combination.
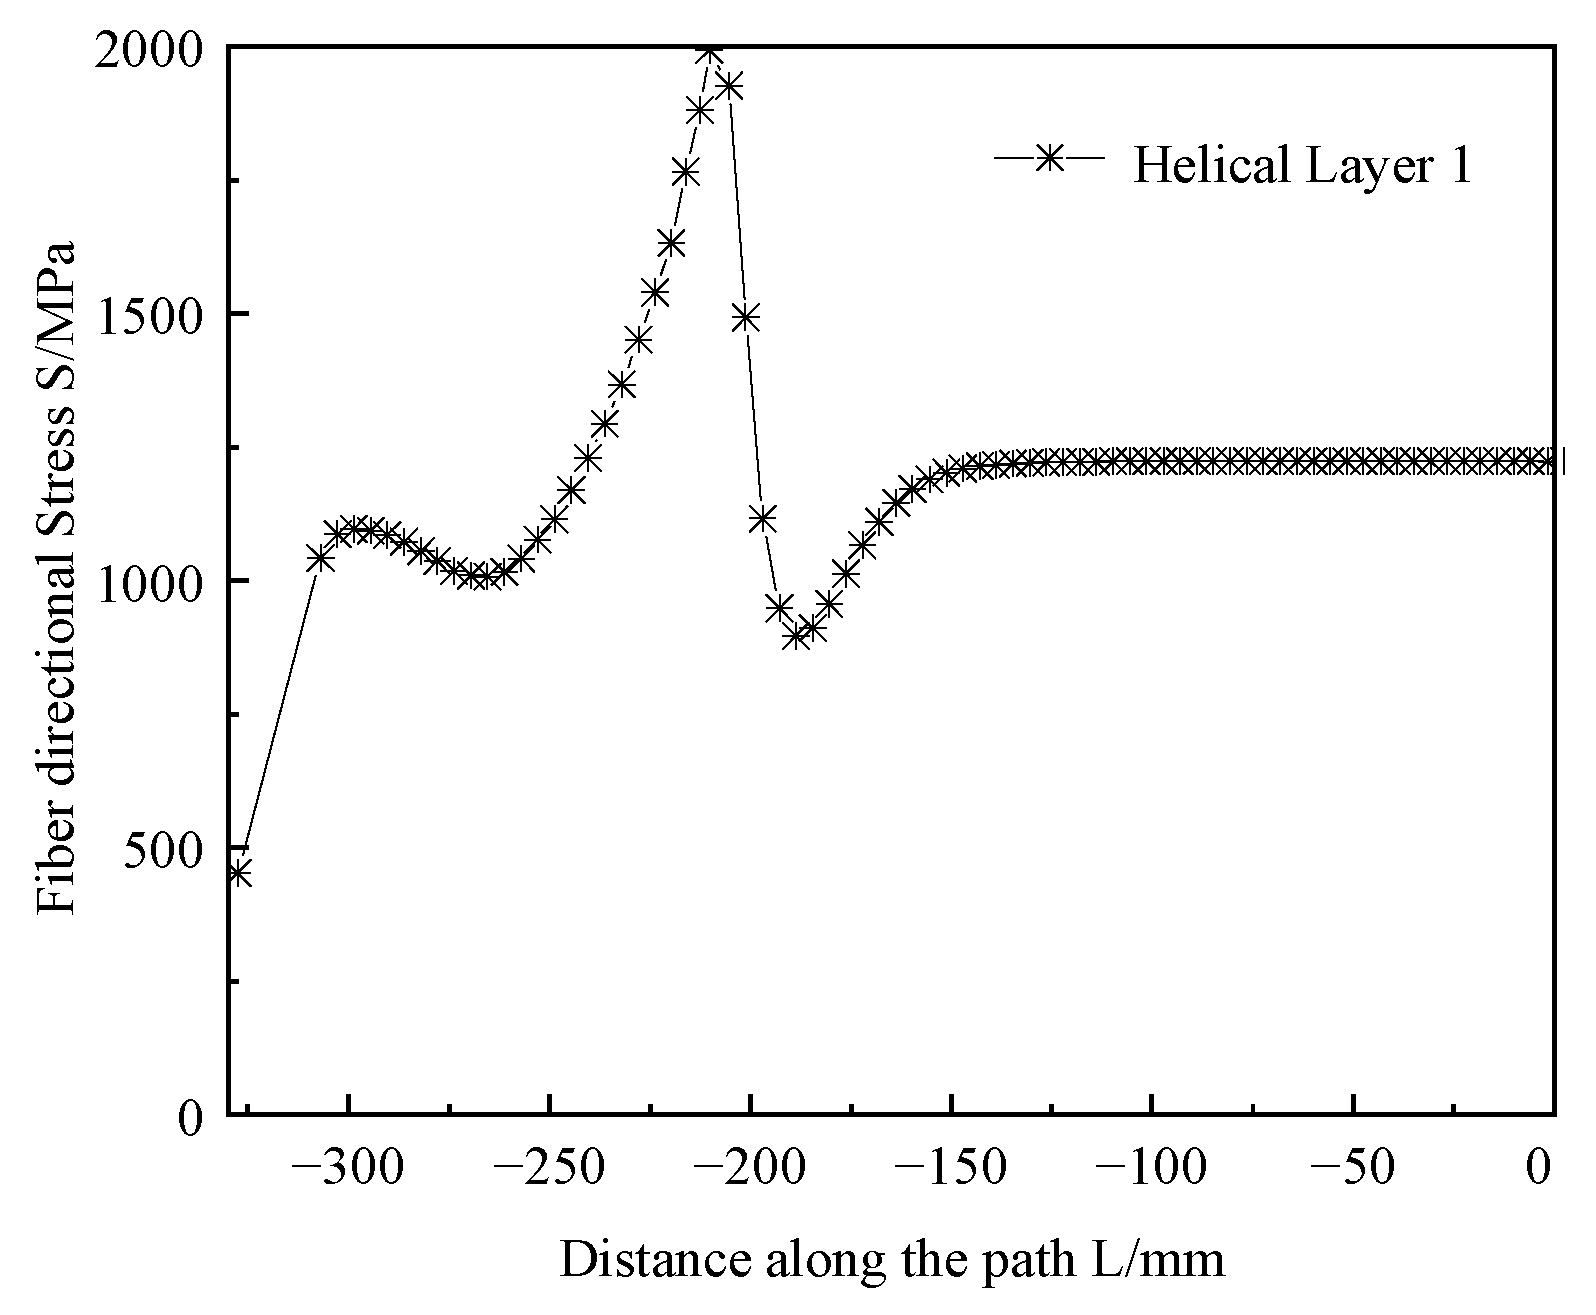
Given that the results of the optimization algorithm depended on the predictive performance of the surrogate model, the accuracy of the resulting optimal solution required validation. We applied the optimized parameter combinations to the finite element model for solving to evaluate the results of the optimized design. The simulation results are shown in
Figure 14, with the maximum fiber-aligned stress of the head being 1993.15 MPa.
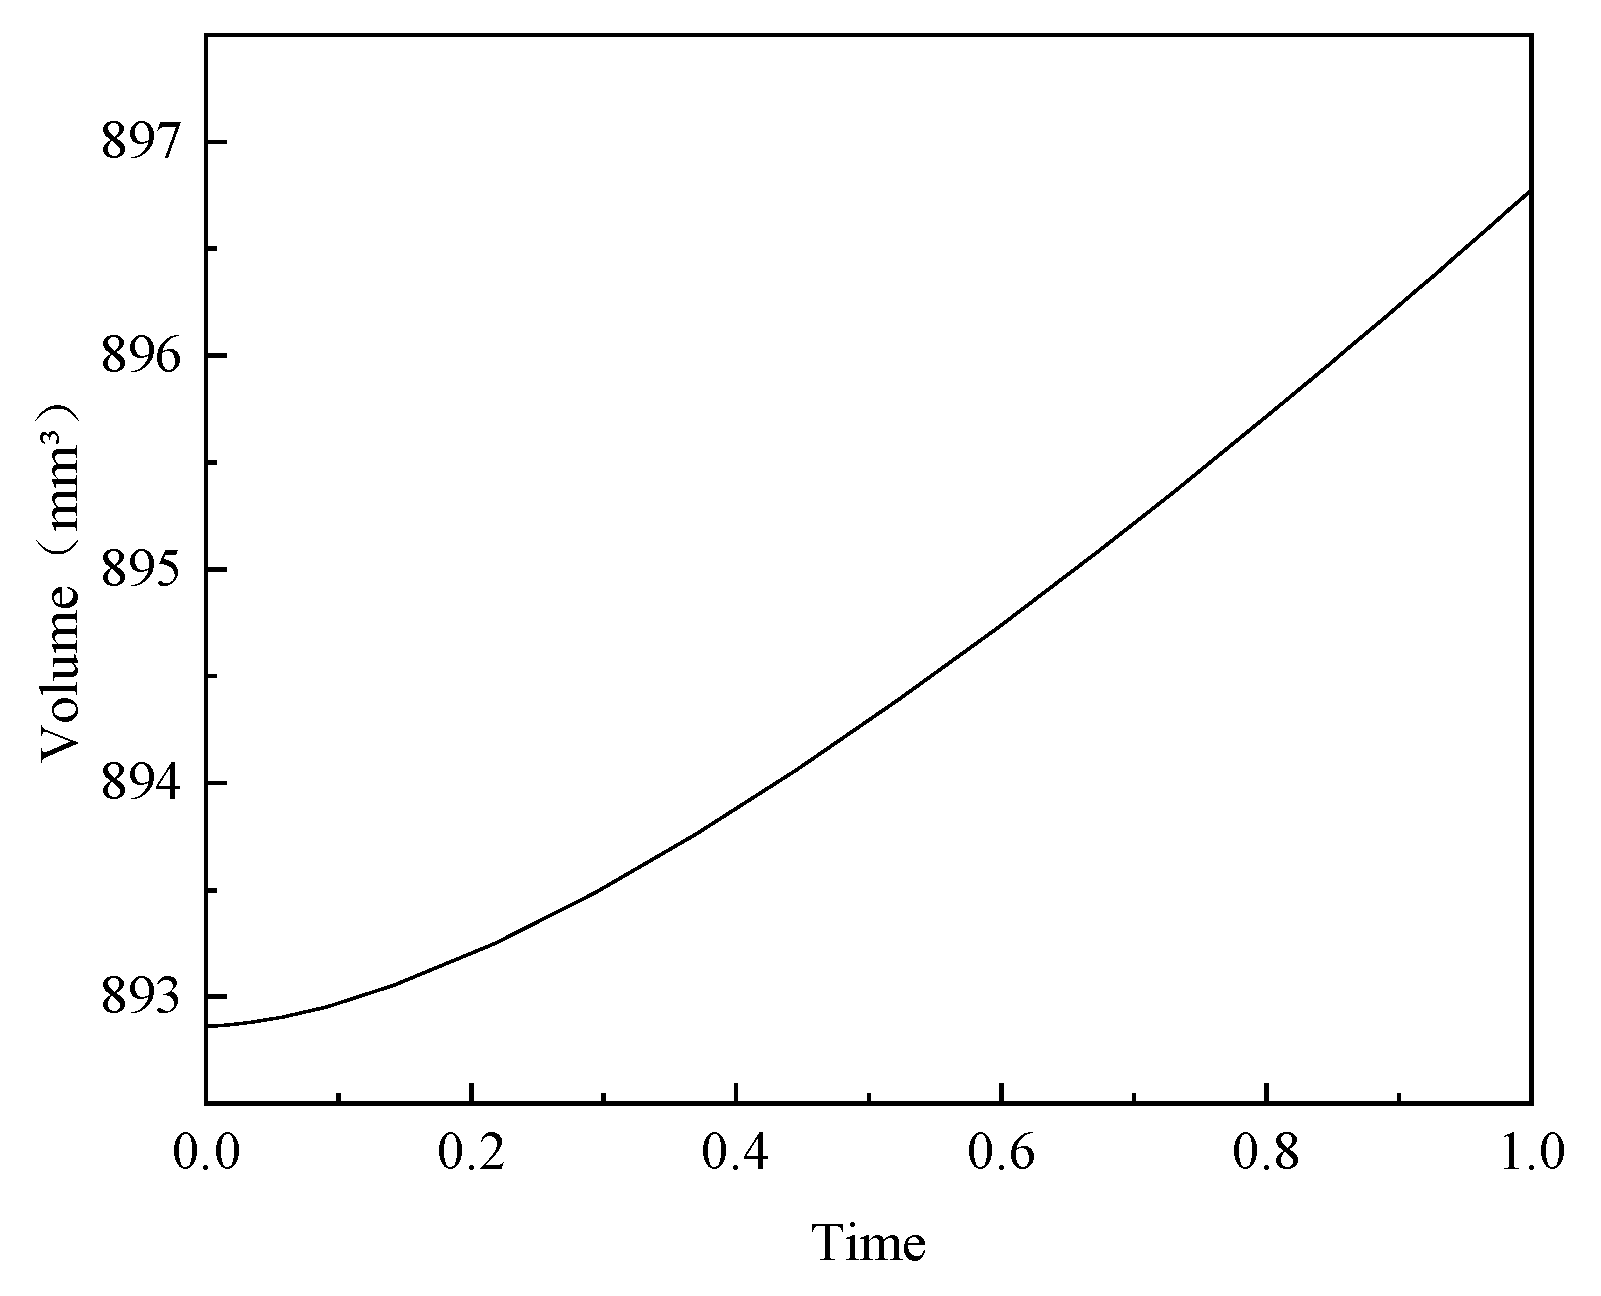
Figure 15 shows a head reinforcement volume of 892.86 mm
3 (1/36 of the overall model). Compared with the predicted values of the surrogate model, the maximum stress error was 0.17% and the reinforcement volume error was 0.29%. This result indicated that the constructed surrogate model had high prediction accuracy and reliability. After optimization of the shell structure, while ensuring that the maximum fiber-aligned stress in the head was less than 2000 MPa, the overall mass was calculated to be reduced from 2.641 kg to 2.396 kg, a reduction of 9.3%. This result proves the effectiveness of multi-objective optimization in optimizing the carbon fiber composite shell structure.
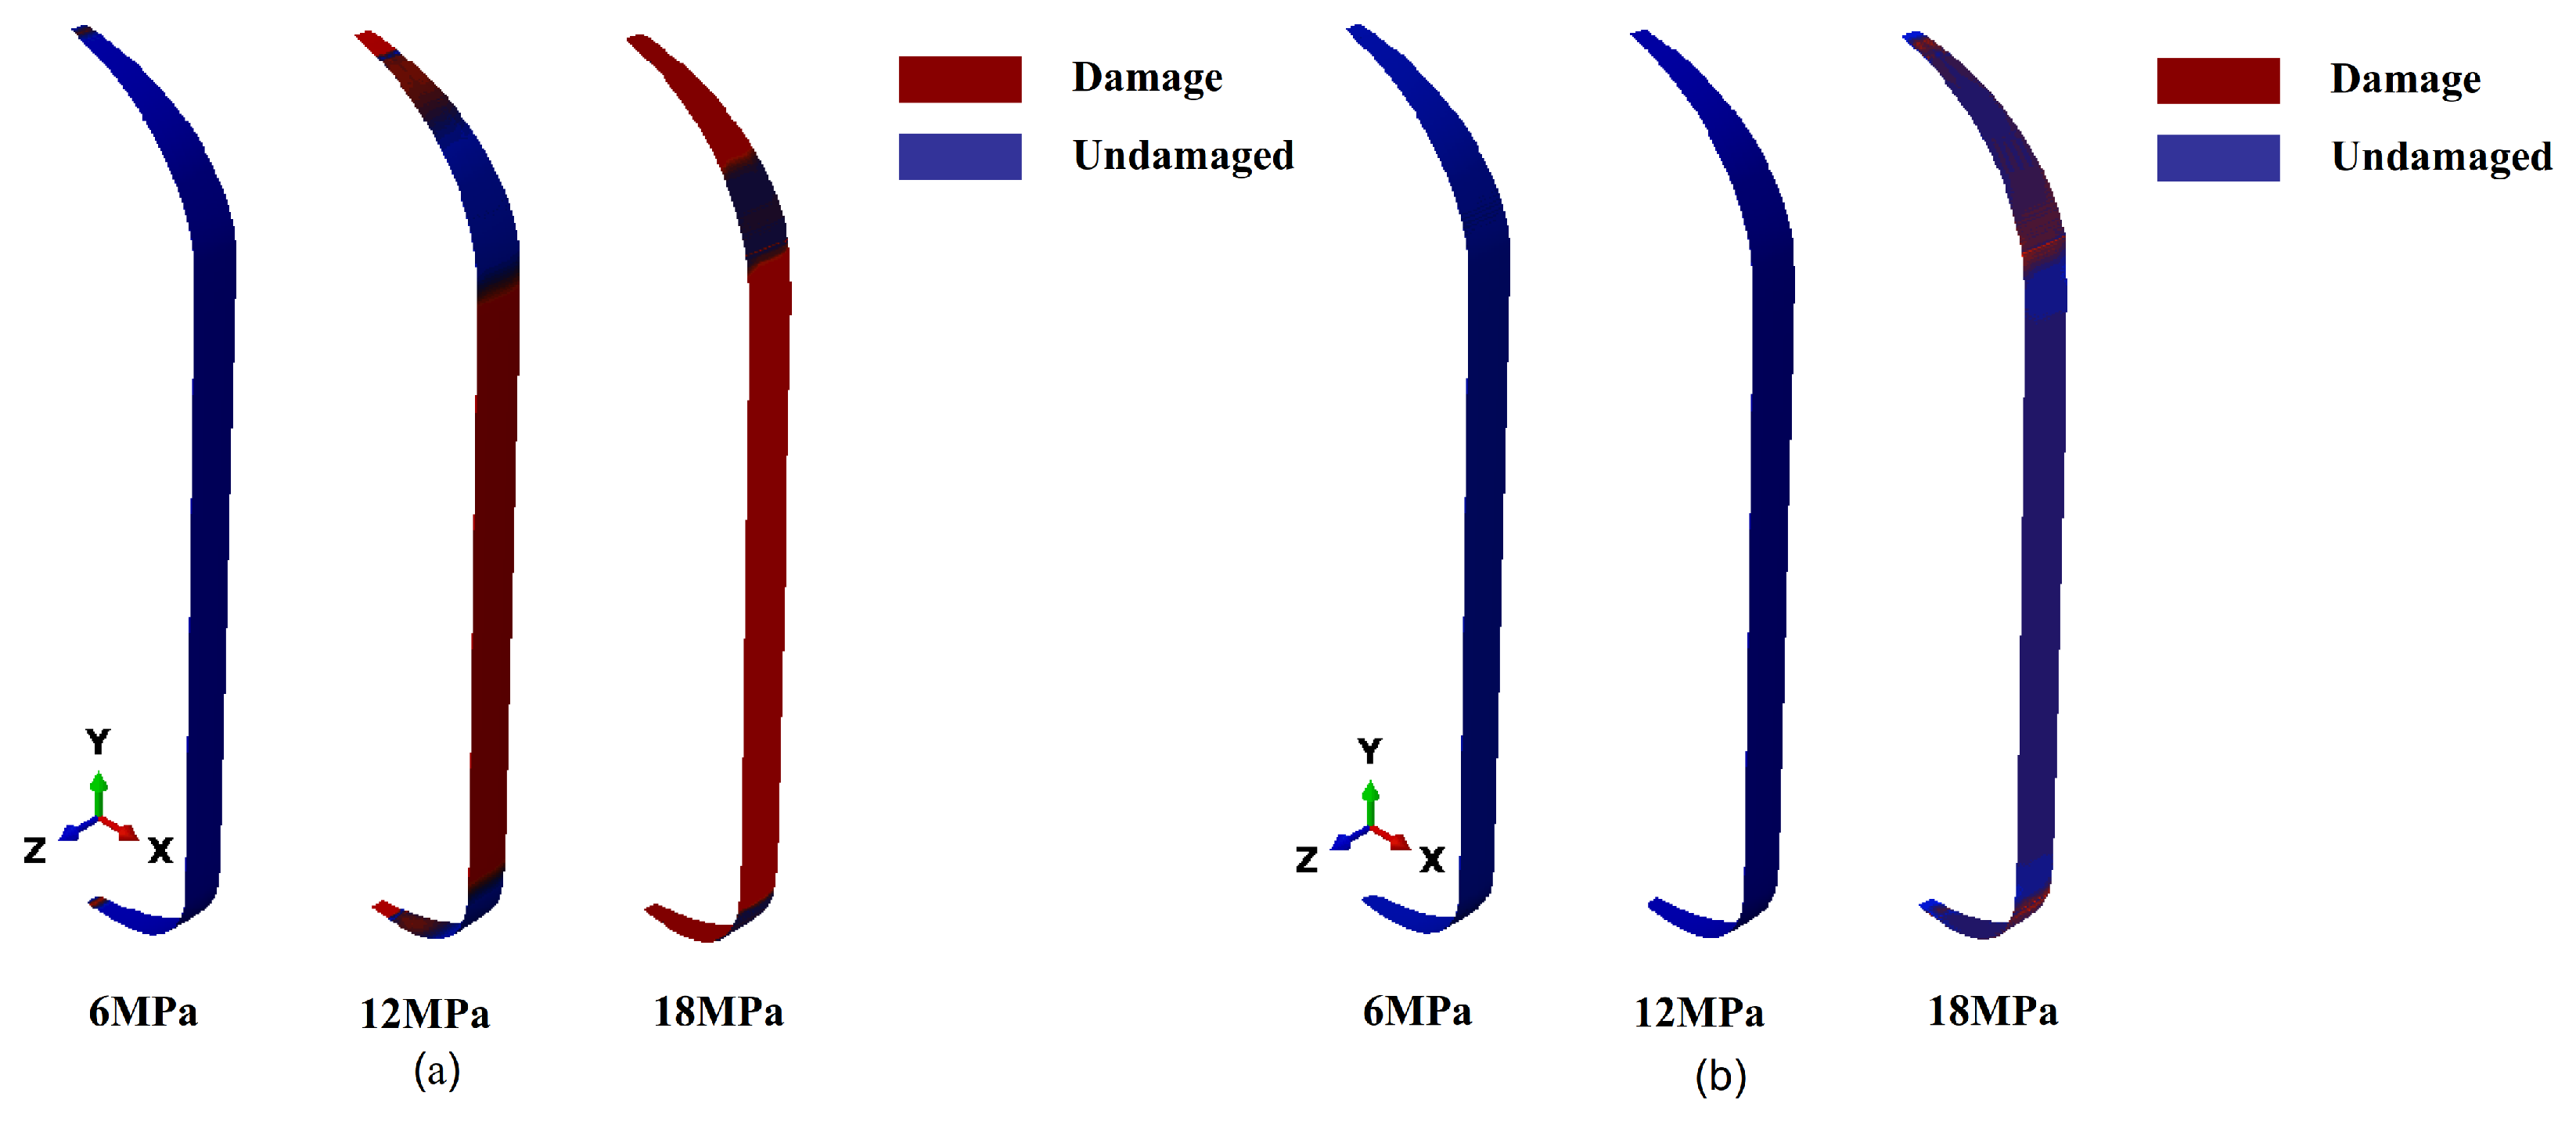
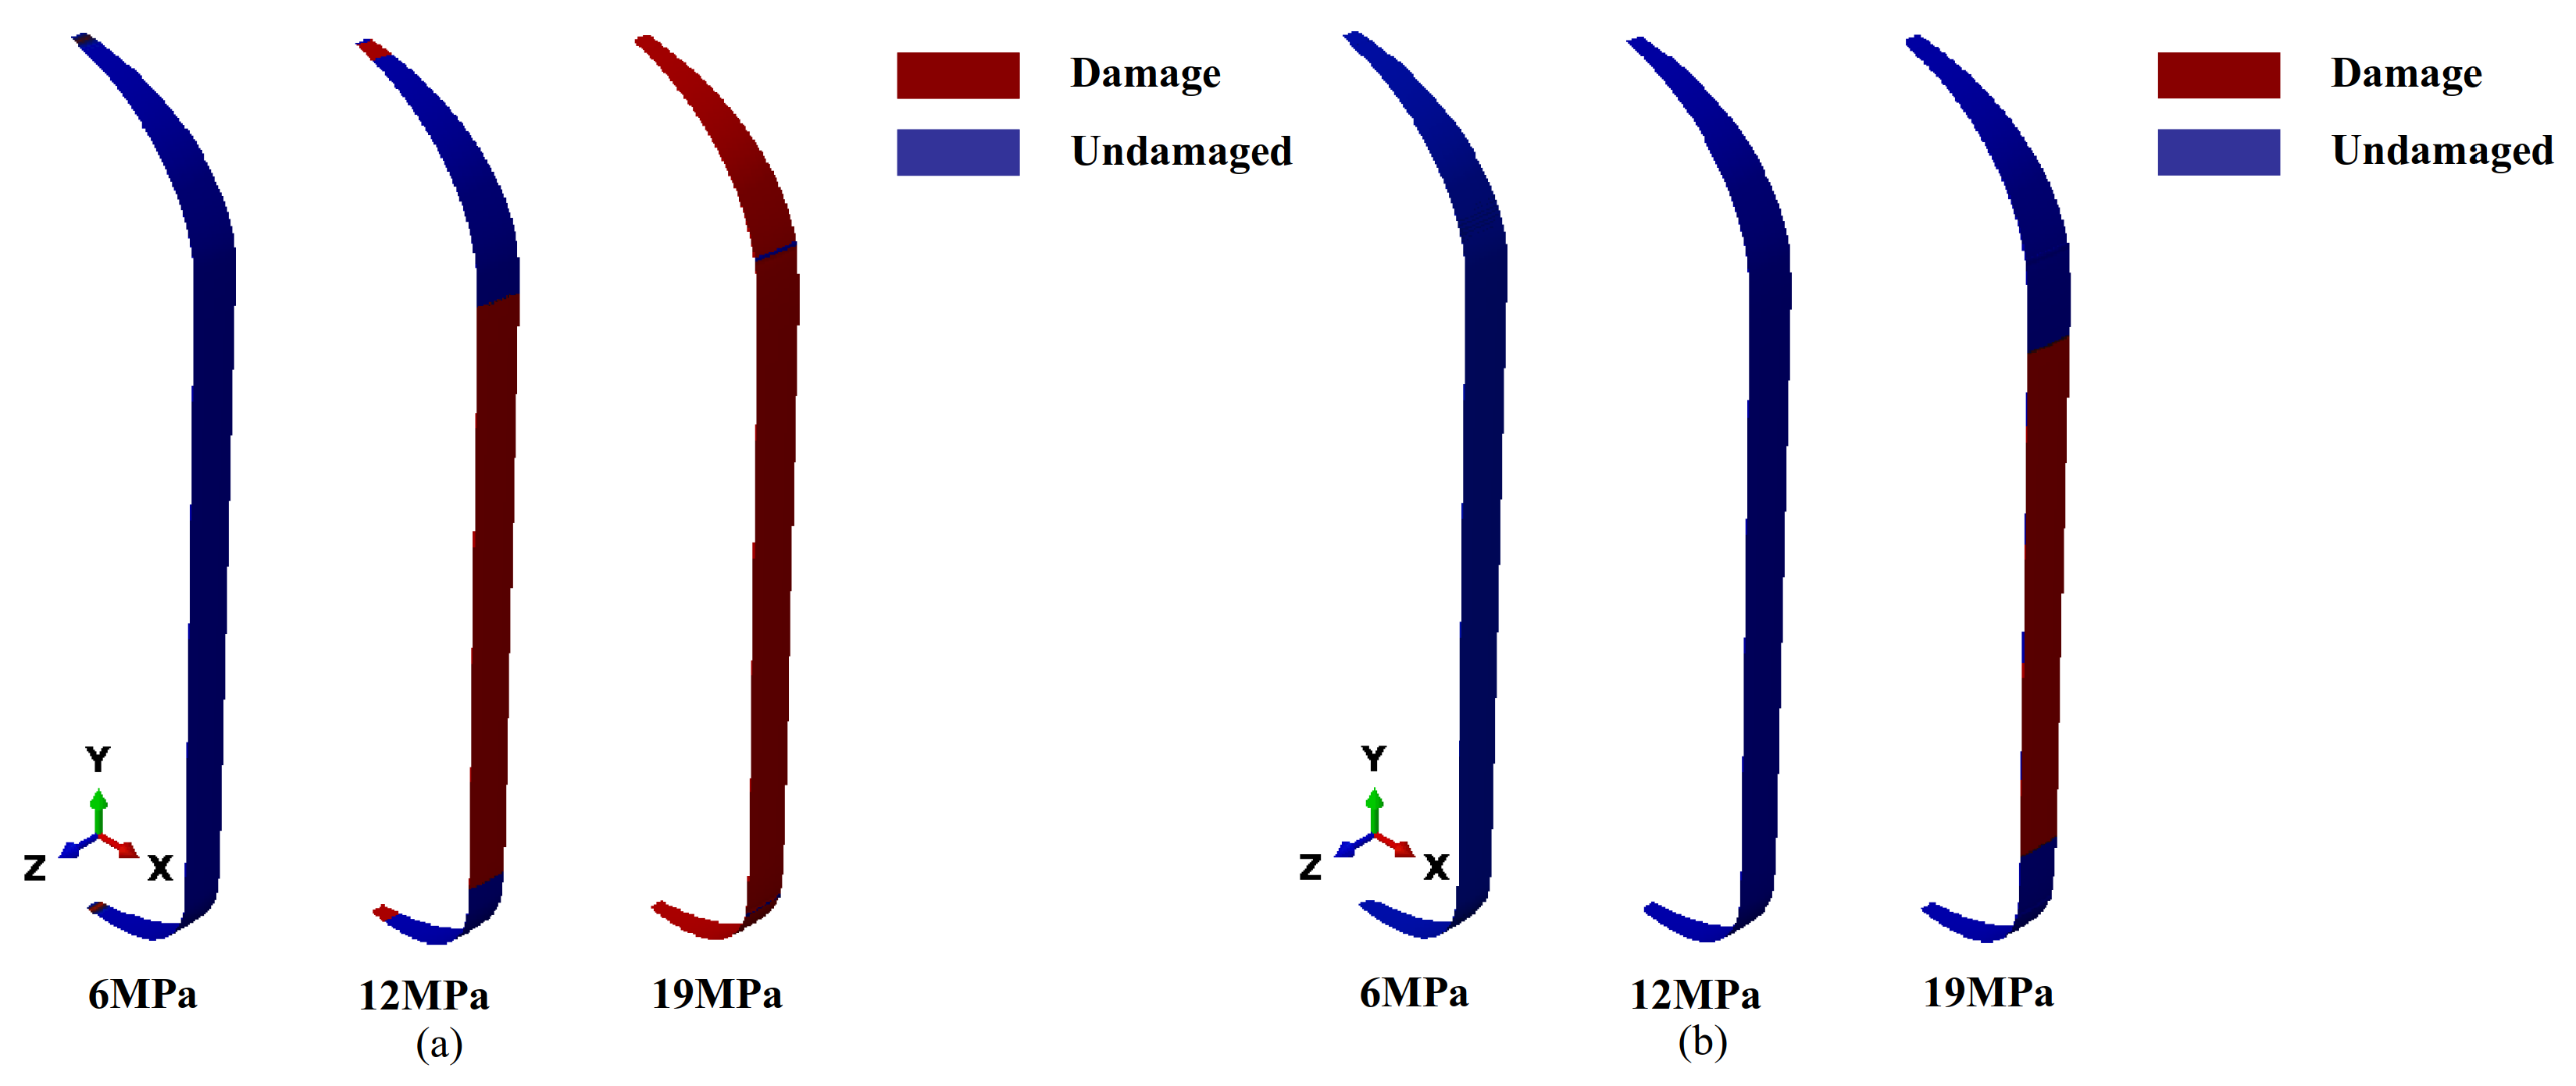
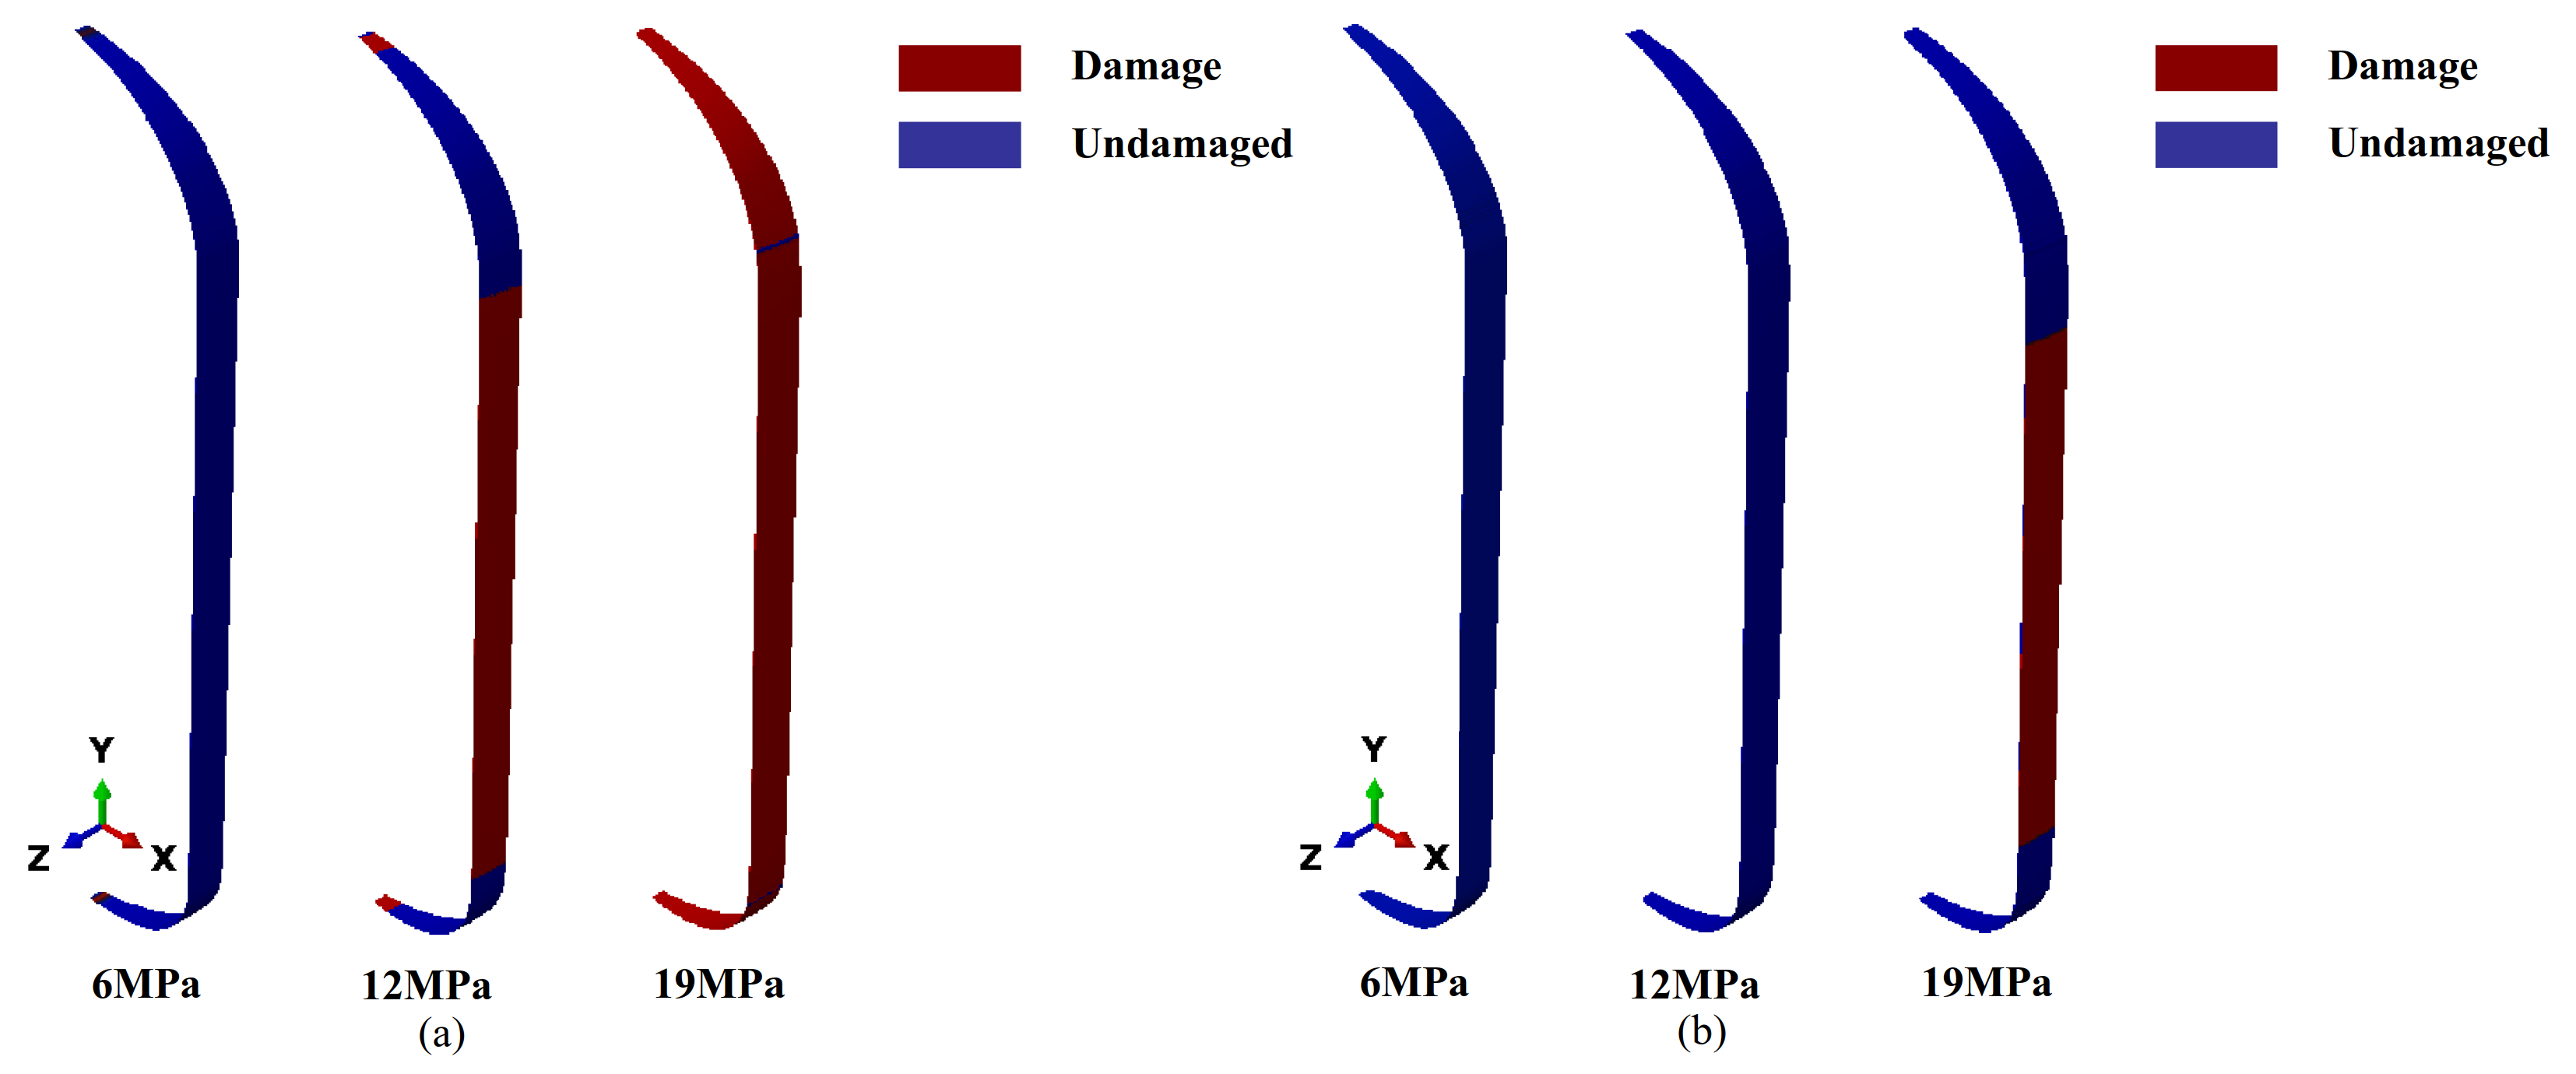
Finally, the optimal parameters were applied to structural damage analysis. The simulation analysis is shown in
Figure 16.
Figure 16a shows that the matrix damage first occurred in the cylinder body section at 12 MPa. With further loading, damage developed in the head region. This phenomenon was primarily due to the higher hoop stresses applied to the cylinder body, causing the matrix material to exhibit tensile damage first. As the load continued to increase, the stress in the head region rose, eventually causing failure of the matrix material there as well.
Figure 16b presents the simulation results of fiber failure, indicating that the fibers in the cylinder body section first failed over a large area, reflecting the critical state of structural damage under a 19 MPa internal pressure. This result strongly aligns with the phenomenon observed in the actual hydraulic bursting test, demonstrating the accuracy and reliability of the optimized solution.


