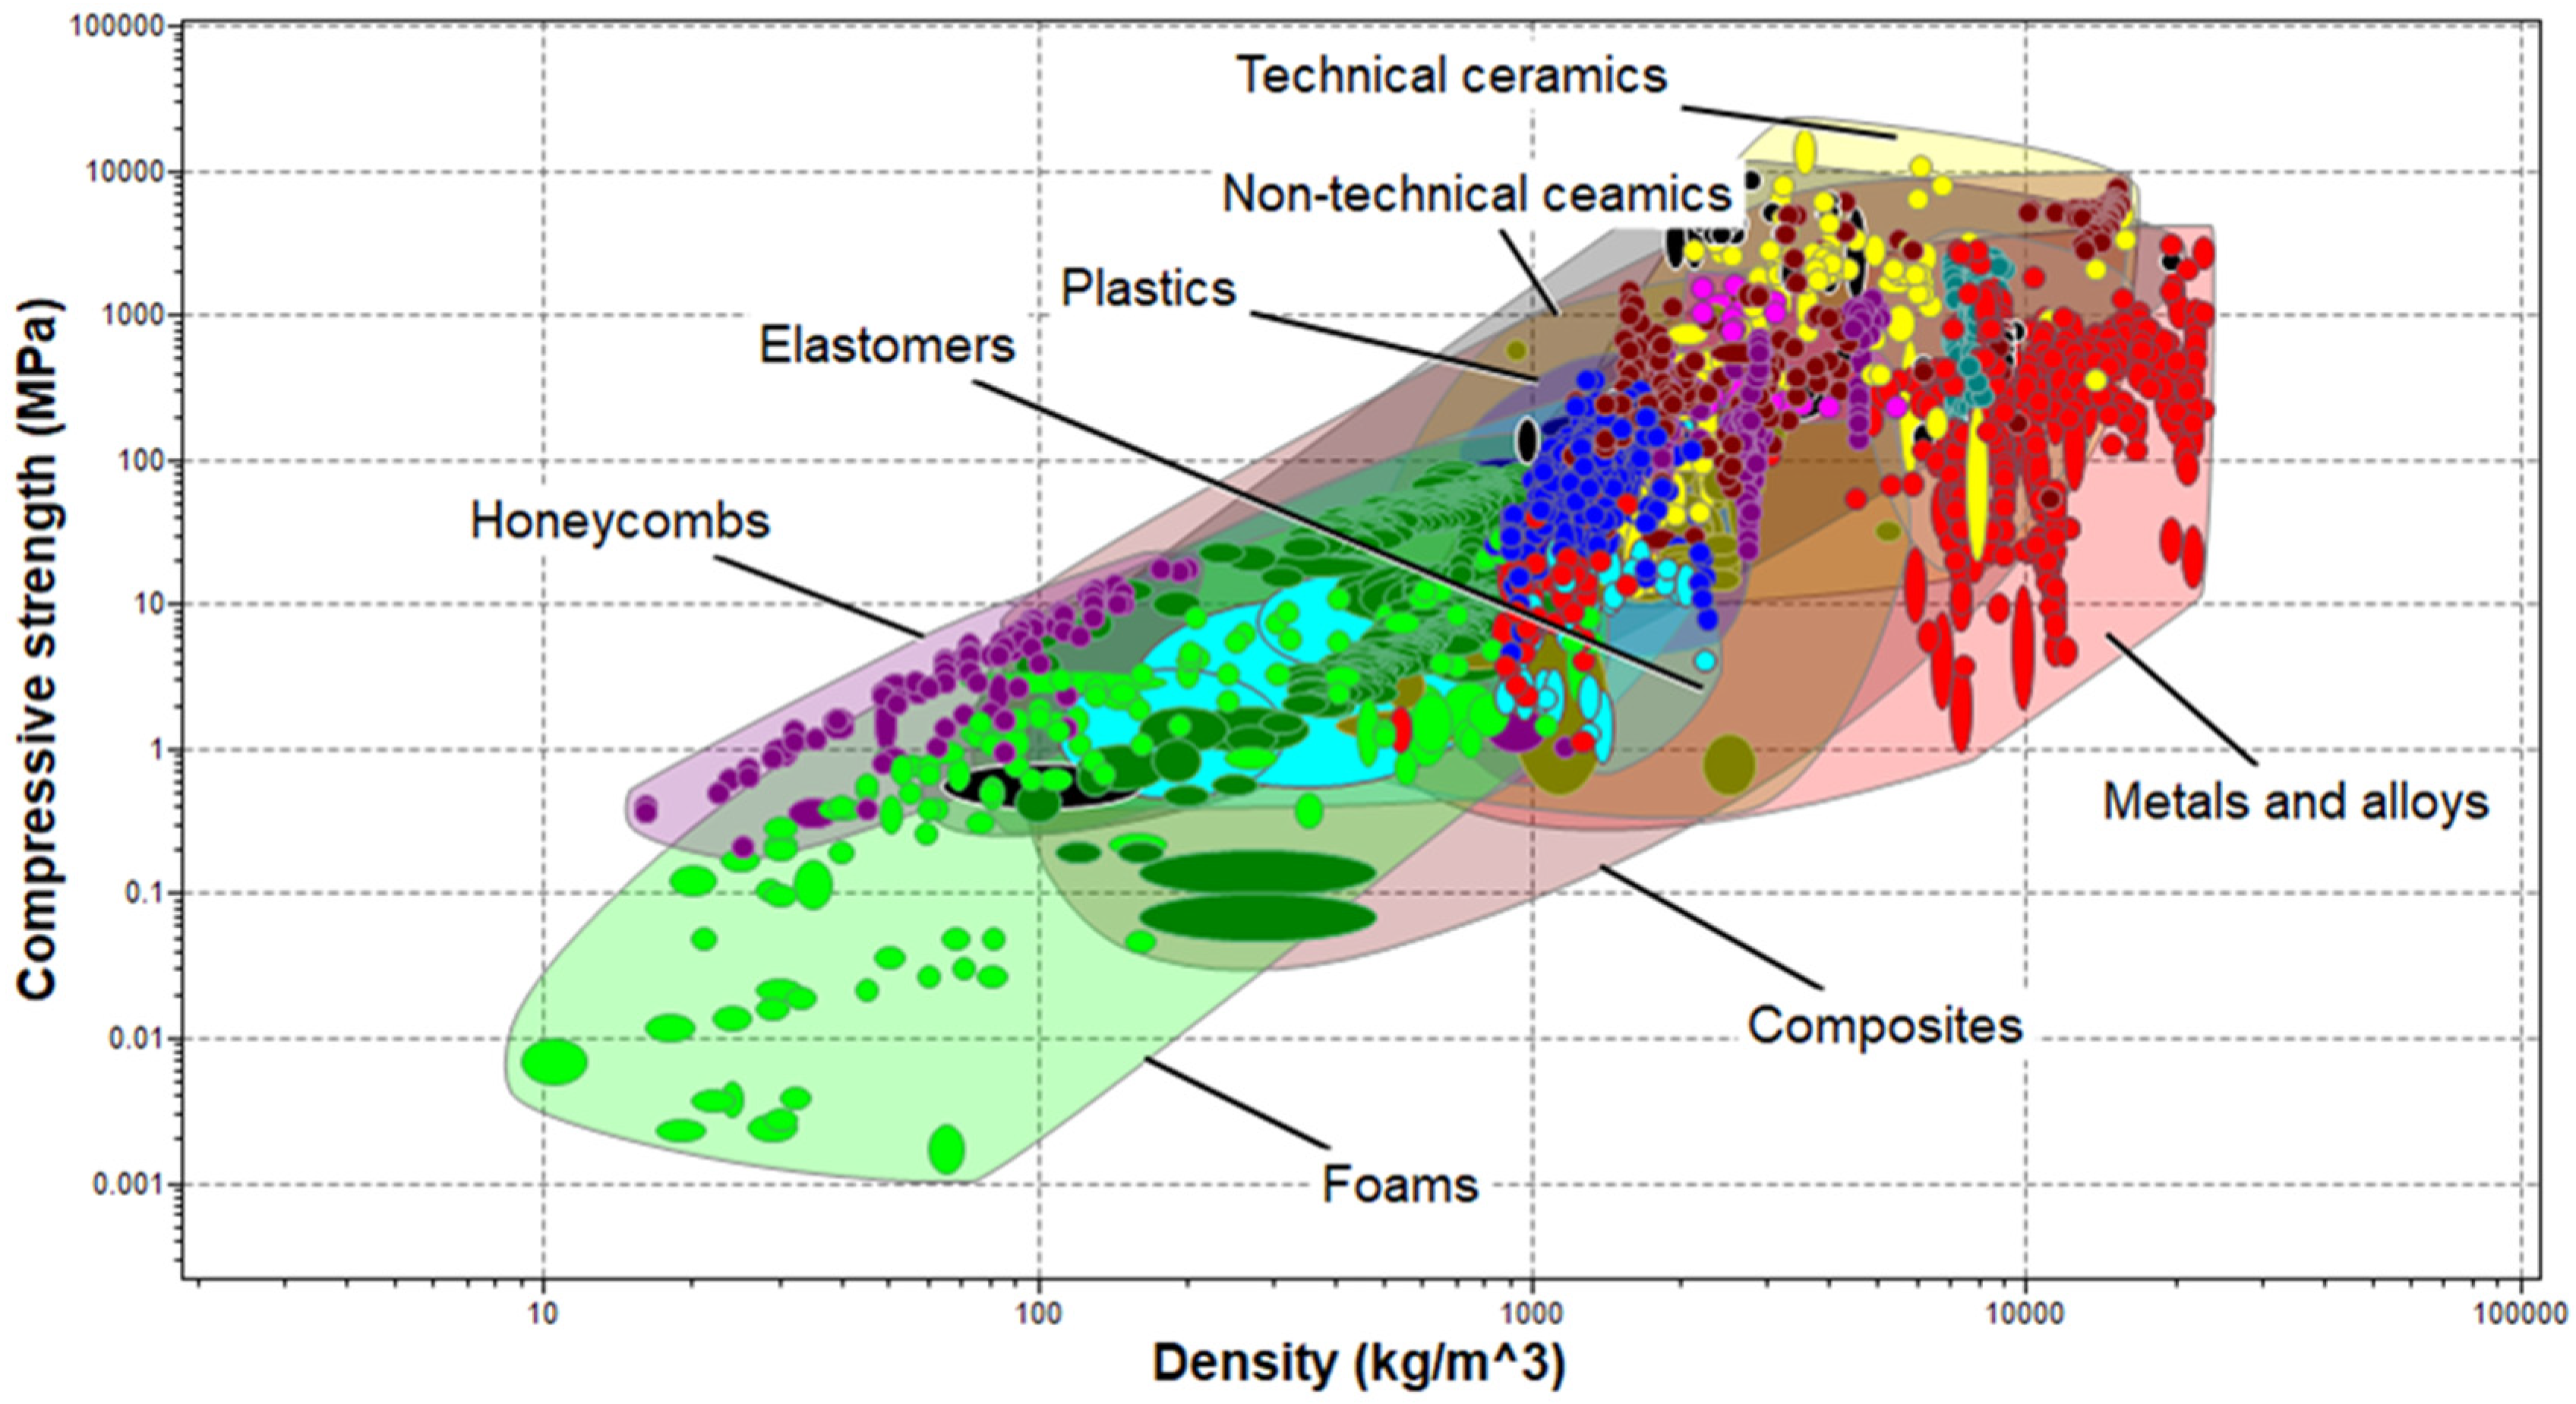
A combination of Ashby plots based on the predetermined relevant material properties and limit performance criteria inputs, as in
Table 1, applied to materials in the level-3 aerospace database of the Ansys Granta material selector were generated in the screening process. The plot shown in
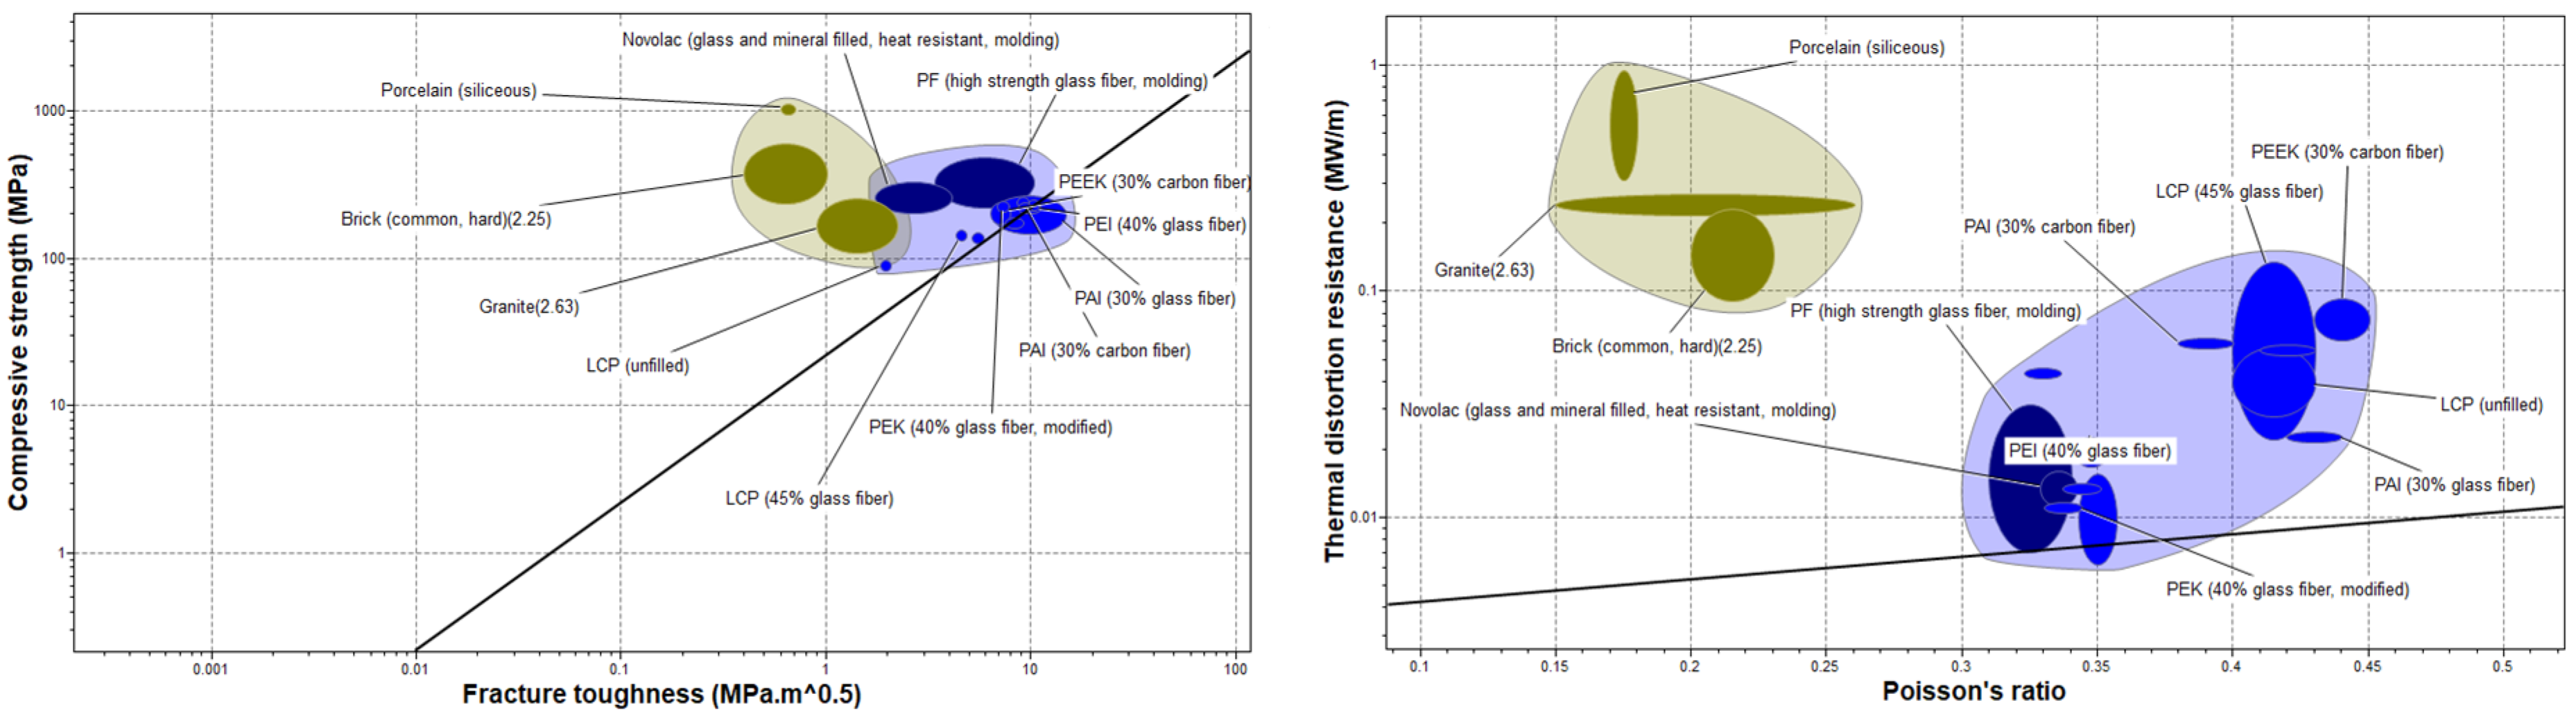
Figure 3 compares the compressive strength of the materials against their density. Material groups such as metals and alloys, technical ceramics, non-technical ceramics, etc., are identified within specific envelopes. The array of materials in
Figure 3 shows that materials with close density values could have significantly different compressive strengths. While the material density could vary at the phase transition, its value for the liquid phase of barrier materials has a direct impact on the hydrostatic pressure exerted by the material during pumping. Sufficient hydrostatic is needed for primary well control. However, extreme overbalance could lead to reservoir fracture. On the other hand, compressive strength is linked to the permeability of materials in a study by [
58], which investigated the impact of silica fumes on natural clay liners. The compressive strength of natural clay was found to increase, while its permeability and swelling pressure decreased, on the addition of silica fumes at greater than or equal to 25 percent. In a study of five barrier materials options, including an industrial class of expansive cement, a non-cement pozzolanic slurry, a rock-based geopolymer and an organic thermosetting resin, ref. [
72] found that the uniaxial compressive strength of the thermosetting polymer after seven days of curing was 130 MPa, a value three times greater than the uniaxial compressive strength of class-G Portland cement cured under same conditions for the same period. A drop in the value of the compressive strength of the organic thermosetting polymer to 80 MPa was also observed after 28 days. These reported changes require further investigation to better understand the long-term performance of barrier materials for P&A applications.
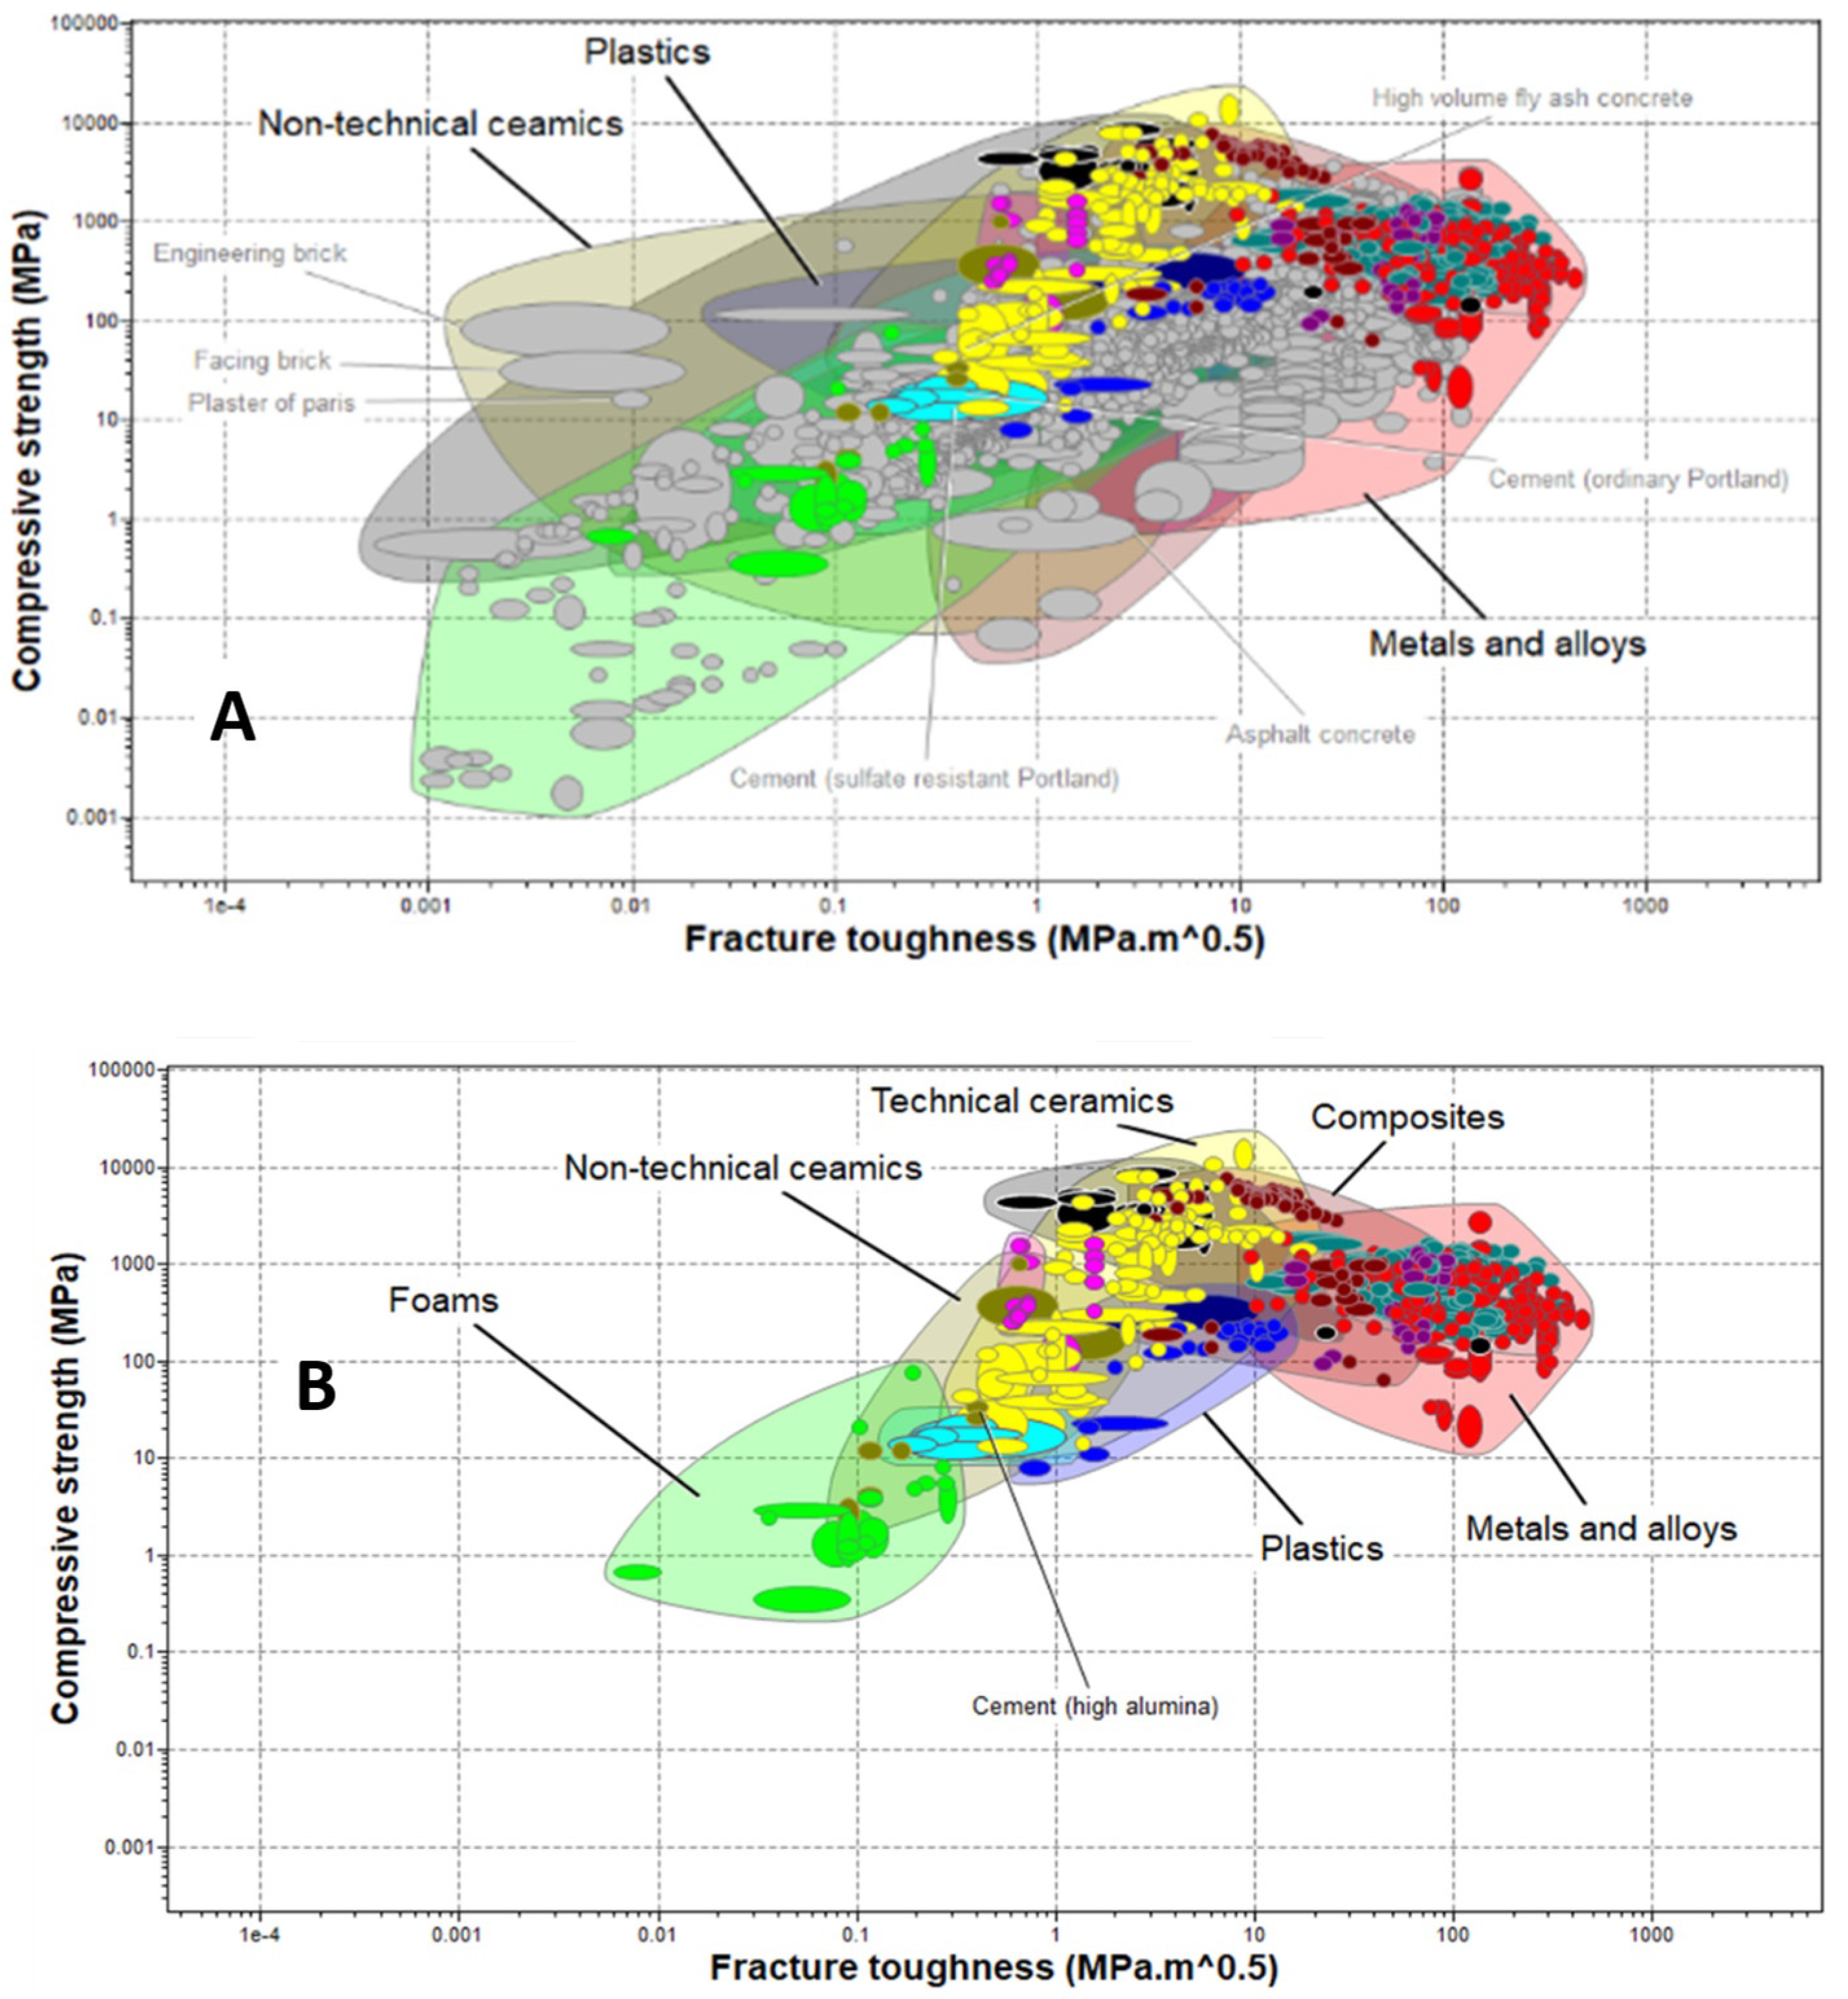
In addition to the density and compressive strength, the fracture toughness of materials, which defines their ability to resist the initiation and propagation of cracks through the material matrix, contributes to the load-bearing capacity and integrity retention of well abandonment materials.
In addition to the above selection criteria, the placeability of barrier materials in the well is a major factor in plug and abandonment. Given the level of advancements in the pumping technologies used for oil well cementing, the material universe for this research is at this stage restricted to plastics and non-technical ceramics to improve the chances of selecting materials that could be placed in wells using existing technologies. The remaining materials are further examined in an Ashby plot of the thermal distortion resistance and Poisson’s ratio, which are relevant for the long-term barrier performance and zonal isolation in HPHT wells.
Material Ranking by TOPSIS and TOPSIS-AHP Process
Nine materials shortlisted with the help of the Ashby plots are further studied alongside ordinary Portland cement and HAC using TOPSIS and a combined TOPSIS-AHP multi-criteria decision-making process, as described above.
Nine material properties shown in
Table 6 are used in the TOPSIS analytical process for ranking the materials. Numerical values are assigned to non-numerical properties such as stability in brine, stability in weak acids, etc. The choice of numbers from 1 to 4 represents the classification of materials based on their durability in each fluid. In this scenario, 1 represents unacceptable use, while 4 represents excellent use. Given that all the selected materials except Portland cement have excellent performance in water, brine and weak acids, these performances are combined into one by obtaining their arithmetic mean to reduce the number of criteria and simplify the analysis.
The equations in
Section 3 are built into an Excel spreadsheet to determine the proximity of each material to the positive ideal solution and their relative position from the negative ideal solution. This distance is then used to determine the hierarchical ranking of the alternatives.
Prior to the calculation of the distances from the ideal solution, the sum of the assigned weights of the criteria was determined. As seen in
Table 7, this value equals 1. This is a required compliance criterion in the TOPSIS MCDM analysis.
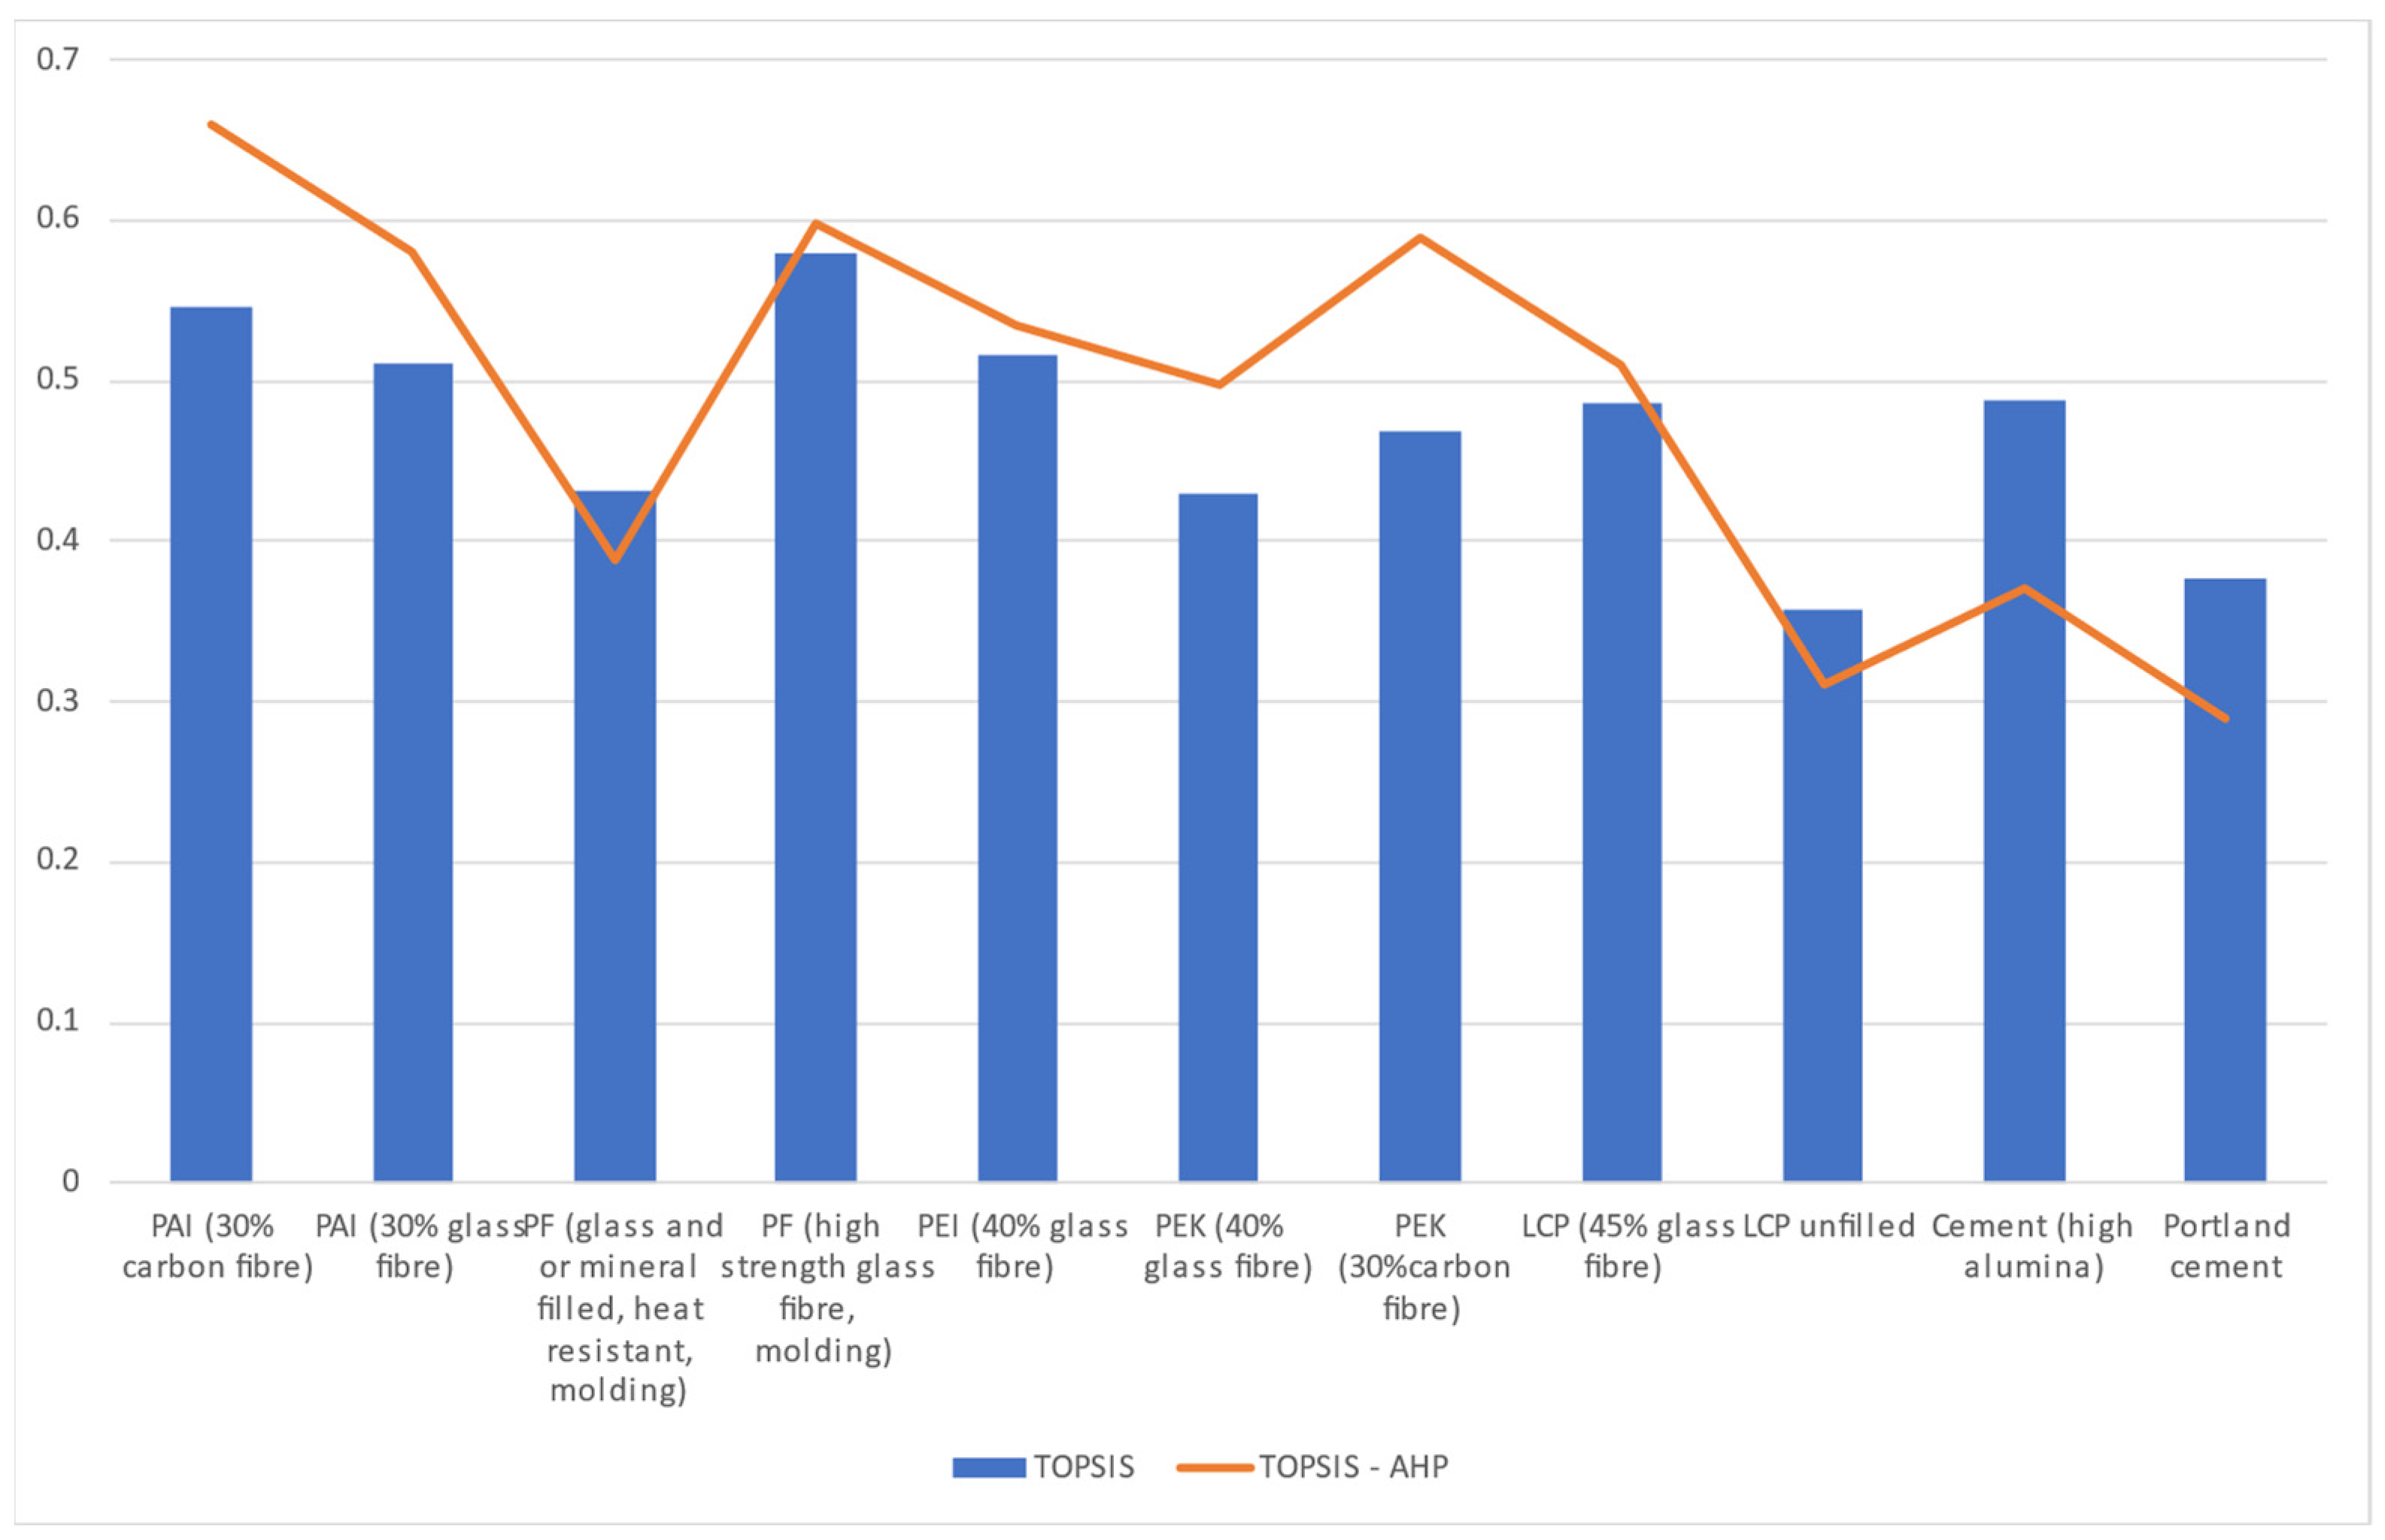
The best-ranked barrier materials from this TOPSIS ranking are from the PF (phenol formaldehyde) and PAI (polyamide–imide) groups. In comparison to Portland cement and HAC, which are ranked 10th and 5th, the PF (high-strength glass fiber, molding) and PAI (30% carbon fiber) rank 1st and 2nd, respectively, for the design application.
In the combined TOPSIS-AHP approach, the assigned weights in TOPSIS are replaced by the priority vectors calculated as discussed in
Section 3.
Table 8 presents the result of the pairwise comparison of the selection criteria. Given that the numerical values representing the performance of the shortlisted materials in water, brine, weak acids, and organic solvents are constant and all the shortlisted candidate materials meet an excellent performance criterion in terms of them, these properties are not included in the pairwise comparison carried out in this work. This reduced number of criteria improves the consistency in judgment. The consistency ratio achieved in this study is 0.033, which meets the standard requirement for accuracy in the AHP. A consistency ratio of less than or equal to 0.1 is required for any AHP study [
53].
By replacing the assigned weights in the TOPSIS analysis with the priority vectors calculated in
Table 8, a new ranking of materials is obtained. In this combined TOPSIS-AHP analysis shown in
Table 9, the top-two ranking materials from TOPSIS remain top but flip their order in the hierarchy. PF (high-strength glass fiber, molding), which ranked first in the standalone TOPSIS analysis, now occupies the second position in the combined TOPSIS-AHP, giving up the first position to PAI (30% carbon fiber). Further changes in the ranks are observed for other materials in this study. For instance, HAC, which hitherto ranked fifth in TOPSIS, ranks ninth in the combined TOPSIS-AHP.
Regardless of these variations, a comparison of the results from the two studies shows that the two best materials and the two worst materials have retained their positions as the best and worst groups, which inspires confidence in the ability of either MCDM method to help the design engineer to identify the best and worse materials for this design. The positional changes in the ranking of materials are represented in
Figure 7. Although the Novolac and PF (high-strength glass fiber, molding) materials are from the same broad phenol formaldehyde family, a significant difference in hierarchy is observed between them. This difference is attributable to the sharp variation in the respective values of their compressive strength and fracture toughness. Apart from these, both materials possess similar values for other properties that formed the selection criteria in this research.
Altering the ranked material alternatives through the addition of additives could improve their positions in the ranking order. This is achieved though improvements in material properties achieved with the addition of additives. For instance, the application of surface-modified silica nanoparticles for mechanical property improvement in reinforced epoxy resins has been studied extensively in the literature. For instance, Makeev et al. [
82] showed an increase in the modulus and strength of resins following the addition of silica nanoparticles. Similar findings are reported in [
83].
To measure the dependence of the material ranking in the TOPSIS-AHP approach on the ranking criteria and assigned weights, a sensitivity analysis is conducted through a controlled variation of the assigned weights and a replacement of the shear modulus by the tensile strength as a ranking criterion. The assigned weights are varied in pairs through an increment of 0.05 in the weight assigned to one selection criterion and a corresponding decrease of 0.05 in the weight value of the second criterion.
Figure 8 and
Table 10 below show the changes in the ranking order of the materials when the weight values of selected material properties are modified and when the shear modulus of the materials is replaced by their tensile strength. When the shear strength values of the materials are replaced by the corresponding tensile strengths, the D values for all the ranked materials increased except for cement (high alumina) and Portland cement, which decreased instead. The percentage increase ranged from 1.1909 percent for PF (high-strength glass fiber, molding) to a 5.8531 percent increase for LCP unfilled. In comparison, the percentage decrease in D was the highest for Portland cement at 14.7412 percent. While the top-four and worst-three ranked materials remain within these categories, there are internal changes in the ranking within the top-four ranked materials. PEK (30% carbon fiber) moves from third to second position in the ranking order, while PF (high-strength glass fiber, molding) moves from second to fourth position in the ranking order. PAI (30% carbon fiber) retained its number one position in the ranking order in all instances of the sensitivity analysis except in the scenario where the weight factor of the average price became dominant over the compressive strength. In this scenario, PEK (30% carbon fiber) became the best-ranked material, followed by PF (high-strength glass fiber, molding). A decrease in the weight assigned to the compressive strength leads to an increase in the D values for LCP (45% glass fiber), LCP unfilled, cement (high alumina) and Portland cement in all the tested scenarios except when a decrease in the compressive strength weightage is accompanied by a corresponding increase in the weight assigned to the tensile strength of the materials. In this circumstance, the D values of high alumina cement and Portland cement are reduced by 4.28 and 8.77 percent, respectively, from their initial values. On average, an increase of 0.05 (0.122 to 0.172) in the weight of the tensile strength with a corresponding 0.05 (0.215 to 0.165) decrease in the weight of the compressive strength generated a 3.6 increase in the absolute average percentage change in the D values across the ranked materials. However, the same variation of weights between the bulk modulus and the compressive strength results in a 6.3 increase in the absolute average percentage change in the D values of the ranked materials. This indicates that the material property values have an impact on the extent to which variations in their weights affect the hierarchical position of materials in the TOPSIS-AHP analysis.
In all the tested scenarios, a material from the thermoplastic family ranks better than the rest of the alternatives. However, it is important to note that their deployment and curing mechanisms under downhole conditions require additional investigation.
The compressive strength and average price of the materials have the most significant impact on their ranking. This agrees with the findings of [
68], namely that the stability of the ranking order when the weightage of the ranking criteria is altered is affected by the initial magnitude of the weights assigned to the materials. In addition to having the highest and lowest initial ranking weights, 0.265 and 0.058, respectively, the compressive strength and average price of the ranked materials also have higher numerical values when compared to the other ranking criteria.
A total order reversal in which an initially worse-ranked material becomes the best-ranked alternative is not observed in any of the scenarios considered.
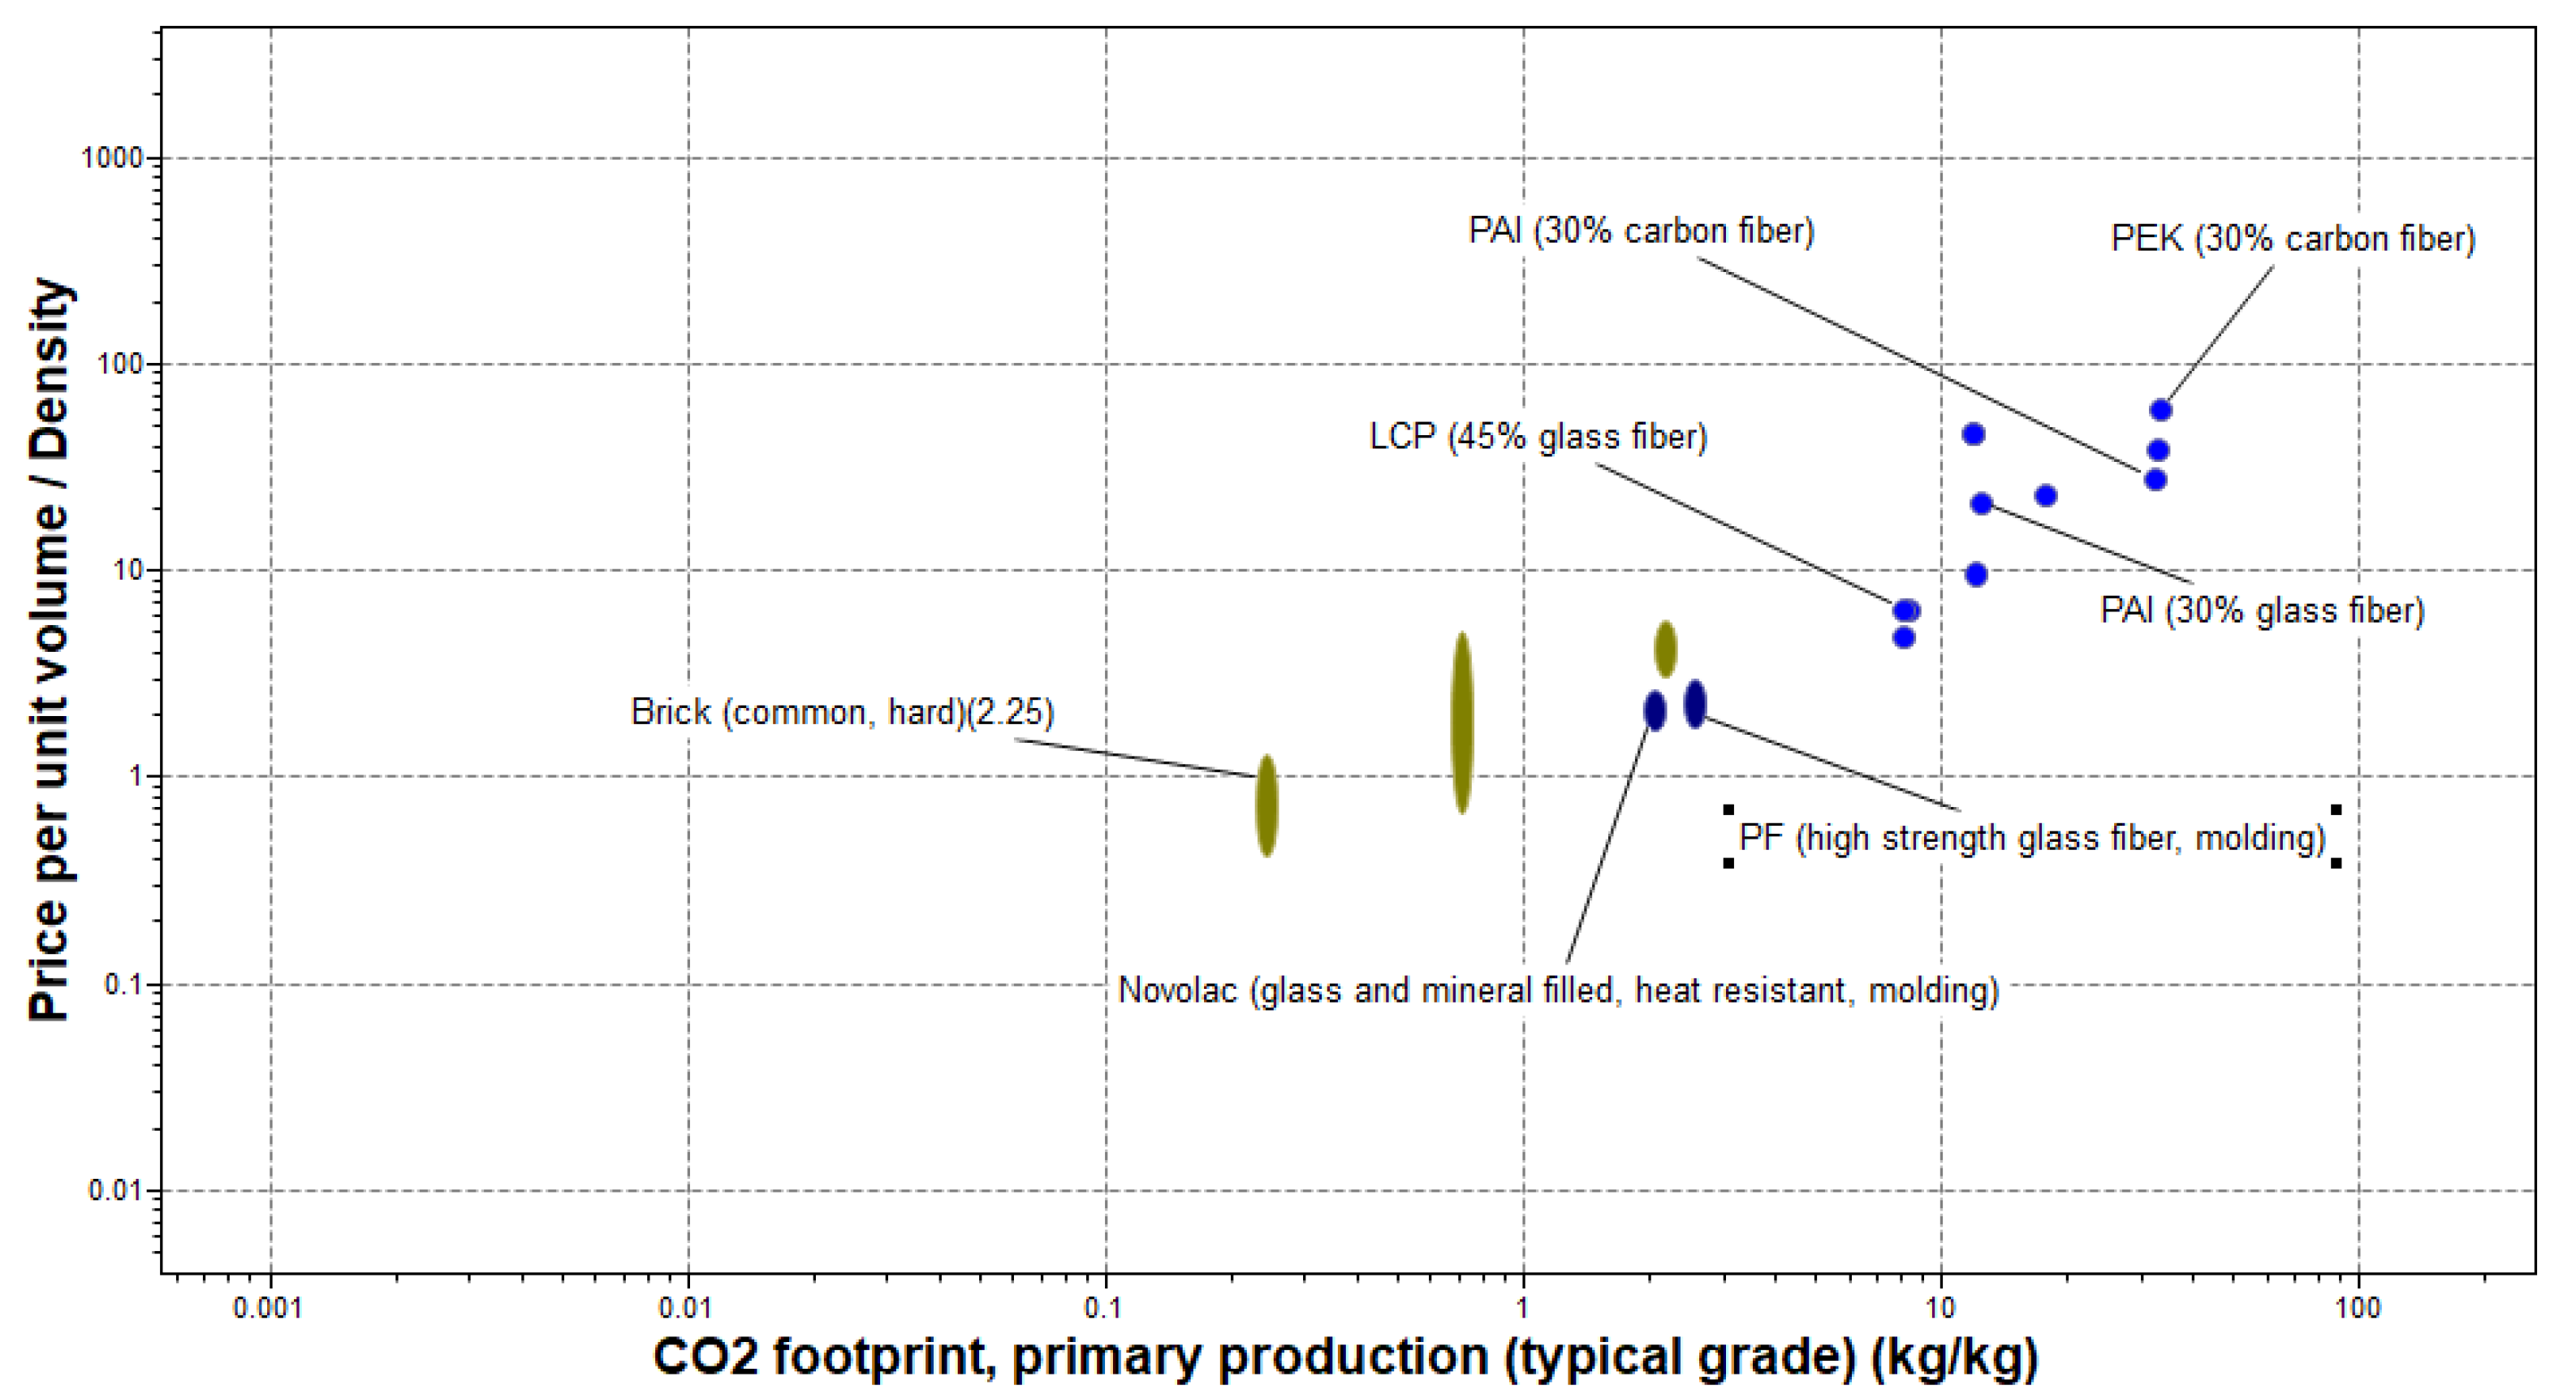
For further understanding of the suitability of the top-two materials for the plug and abandonment of HPHT wells according to this study, bubble plots of the average material cost and their primary production CO
2 emission are investigated. The CO
2 emission factor, which was not considered in the earlier stages of this material selection process, investigates the degree of compliance of well abandonment materials with the net-zero targets of oil and gas companies and regulators.
Figure 9 shows the difference in price and the production carbon footprint for PF (high-strength glass fiber, molding) and PAI (30% carbon fiber). For instance, while the average carbon footprint for the primary production of PF (high-strength glass fiber, molding) is between 2.42 and 2.67 kg/kg, it ranges from 30.5 to 33.6 for PAI (30% carbon fiber). The latter is also about 14 times more expensive than the former per unit mass.
While the primary production carbon footprint is an indicator of the environmental impact of materials, a life cycle assessment covers other aspects such as the energy consumption for production and storage, transportation-related emissions, and releases of other non-eco materials on curing, amongst others. A full-scale life cycle assessment is beyond the scope of this work. However, a cradle-to-gate life cycle assessment conducted in [
84] found that the production of 1 kg of phenol formaldehyde generates 2.88 kg of CO
2-eq of greenhouse gases. This value is 11.6 percent higher than the primary production CO
2 reported in Ansys Granta for glass-fiber-reinforced phenol formaldehyde. The study, however, includes other greenhouse gases expressed in CO
2 equivalent. In addition to this, the ozone depletion potential and human toxicity (cancer effects) of producing 1 kg of phenol formaldehyde are calculated as 2.25 × 10
−11 kg CFC 11-eq./FU and 9.88 × 10
−9 CTUh/FU, respectively, while the overall impact of producing 1 kg of phenol formaldehyde using the Eco-99 impact assessment method using a human health impact, ecosystem quality and resource depletion is 2.84 Pt.
While concerns remain over the use of phenol formaldehyde, its use in the building industry is attributed to its low free phenol and formaldehyde contents [
85].
The shortlisted materials are promising alternatives that could withstand the impact of the compressive forces arising from the horizontal components of the overburden pressure and the impact of creeping formations over extended periods in the presence of reservoir fluids under HPHT conditions. It is established in the literature that HPHT wells present peculiar challenges to the performance of Portland cement as a well barrier [
86]. Given that cement is brittle and knowing the impact of thermally induced stress on cement integrity, its strength deterioration and debonding are accelerated under HTHP conditions [
87]. In addition, high-temperature conditions are also known to accelerate the chemical degradation of Portland cement in the presence of aggressive substances such as brine and weak acids, which are often present in reservoirs [
19,
87,
88]. In contrast, an aging study conducted on phenol formaldehyde composite found that the material retained its tensile strength during accelerated aging conducted at 150 °C. Additionally, a time–temperature creep study of the material at 100 °C indicated that after a period of 50 years, the materials would still require a stress level of 89 percent of its ultimate strength to fail [
89].
Furthermore, phenol formaldehyde is identified as one of the main thermosetting resins used in the plugging of loss circulation zones during drilling of deep and ultra-deep wells. This application of phenol formaldehyde is driven by a combination of the favorable mechanical properties of the cured material, its corrosion and its wear resistance and thermal stability, which support its performance in HPHT conditions [
89,
90]. The relatively low price of the material, and the good ablative and flame retardancy properties, is the key reason for its popularity in thermal protection systems. However, its thermal properties have been challenged as insufficient for certain applications in the aircraft industry, where additives are required to improve the thermal performance of phenolic resins [
91,
92]. In high-temperature oil and gas formations where conventional gellants are not viable, phenol formaldehyde cross-linked gellant has demonstrated viability for applications in water shut-off at 140 degrees centigrade [
93]. Another study on the use of the Bakelite phenol formaldehyde in the oil and gas industry used it as an internal coating to improve the corrosion resistance of materials. The success of Bakelite-coated materials is attributed to the chemical resistance of phenolics to CO
2, oxygen and brine mixtures, hydrochloric and hydrofluoric acids. In these applications, the coatings are stable up to 204 °C [
94]. There is a scarcity of similar studies for the other shortlisted materials. Studies on the successful application of phenol formaldehyde in harsh conditions in oil and gas support the robustness of the Granta and TOPSIS-AHP material selection strategy as a tool for material selection for the abandonment of high-pressure high-temperature wells.
In normally pressured wells where the barrier materials are less likely to fracture in compression, the performance of Portland cement is often considered sufficient in the oil and gas industry even in the presence of a CO
2/brine mixture. In the presence of CO
2/brine and the absence of a continuous flow pathway, the performance of Portland cement could be enhanced through a self-healing carbonation reaction. Readers may refer to the works of [
95,
96,
97] for greater insight into the impact of carbonation on cement’s performance as a barrier.
The material selection conducted in this work is aimed at finding alternative materials with mechanical and chemical stability to withstand HPHT reservoir conditions. While these are key to material performance, the adoption of the top-ranked alternative materials could be faced by several challenges. The primary challenge to alternative barrier materials in the plug and abandonment of wells is the lack of regulatory support [
98] and insufficient support from operators to drive field trials for alternative barriers. In addition to this, the deployment of carbon- and glass-fiber-reinforced materials using conventional pumping technologies could be challenging depending on the fiber length and could require modifications to conventional pumping technology. The fibers could also create a near wellbore bridge that affects the resin injectivity. As a result, it is important to investigate the properties of the non-reinforced polymers and compare them to the properties of Portland cement. For instance, the average compressive strengths of PAI unfilled and PF unfilled are 173 and 92.85 MPa, respectively, from the ANSYS Granta materials selector. In comparison, the average compressive strength of ordinary Portland cement is 19.7 MPa. Class-G Portland cement, which is applicable in HPHT wells, is reported to have a compressive strength of 58 MPa [
7]. PAI and PF unfilled are also durable in brine, weak acids and organic solvents according to the Granta database. Solid-free resins also have an injectivity advantage over cement. The long-term performance of PF under reservoir conditions is confirmed in studies conducted by [
89,
90,
93,
94], as discussed above. For its part, PAI also has excellent mechanical properties under high temperatures and high resistance to chemical attacks [
99,
100].
The higher cost of materials, in comparison to Portland cement, is another challenge facing the adoption of alternative materials. However, the cost element of materials becomes less important when viewed from the risk of failure, overall project cost and cost of remediation perspectives. The long-term performance of cement, a relatively cheaper material, has been criticized by various authors, especially as a barrier material in HPHT wells [
101].
The availability and ease of sourcing of the selected alternatives may also vary in different countries. A recent attempt to purchase phenol formaldehyde resin in the UK revealed that most suppliers of the material have a specific minimum volume below which they would not accept a supply order. In addition to this, its transportation over long distances require cold conditions. For instance, to achieve a shelf life of over 6 months, the Hexion phenol formaldehyde resin supplied under the trade name CELLOBOND™ J2027X01 by Caleb Technical Limited, Britania Porth, United Kingdom requires a storage temperature of less than 10 degrees centigrade. While this is generally not a major concern in the winter, it has a significant impact on the storage cost and increases the risk of curing at the surface in warmer climates, especially in the situation of an equipment failure during well abandonment operations. Given that thermosets cure exothermically, it is important to quantify the impact of the heat generated during the large volume curing of phenol formaldehyde on the integrity of cement behind the casing in high-temperature wells.
Another challenge to the application of the selected materials is the need for specially trained personnel with a good understanding of polymer behavior to customize the resin solutions for each abandonment scenario based on the individual well conditions. A poor choice of hardener-to-resin ratio could result in premature or late curing downhole. These materials also require additional safety measures, especially in enclosed spaces. The manufacturers of phenol formaldehyde, for instance, recommend their handling in properly ventilated conditions. Well abandonment operations are generally conducted in open-air locations. This generally reduces the health hazards to personnel. However, personal protection equipment should be worn at every point of handling the material to protect the skin, the eyes and the respiratory tract.
Regardless of the above challenges, cement has limitations in complex well scenarios where material injection into the producing reservoir is required during abandonment. In other instances, such as parted tubing, with sustained casing pressures that require section milling, resin solutions have proven to be a cost-effective solution outcompeting cement in the total project cost even in situations where the material cost is 10 times higher than the cost of cement per unit weight. In one instance, a resin solution adopted to seal micro-channels in a sour gas well in China cost only 33 percent of the operator’s projected expenditure in a cement-based solution [
102].
In a complex project by Oceaneering for a Gulf of Mexico operator, the adoption of a resin solution delivered a permanent barrier at around 50 percent of the estimated cost of a cement-based solution [
103,
104].
As shown in
Table 11, according to the cost and risk benefit analysis of cement and resin barrier materials, the cost benefit of resin-based solutions does not come from their price per unit volume but from the operational efficiency driven by the reduced milling length in wells that require section milling, the reduced length of the barrier material required to achieve good zonal isolation and the little to zero chance of re-entry for remedial abandonment. In certain wells, the adoption of resin barrier materials also enables the implementation of rigless well abandonment. Note that the values in
Table 11 are specific to the referenced projects. The values for phenol formaldehyde are estimated to be fifteen percent more than the average values for resins in the referenced published literature. The rig rates are variable and the milling rates and material volumes also vary based on the casing size and nature. The table is provided as a guide and readers wishing to build on this should take these variations into consideration.


 ,
, 


