
Influence of Resin Grade and Mat on Low-Velocity Impact on Composite Applicable in Shipbuilding


 ,
,  ,
,  ,
,  and
and
Abstract
1. Introduction
2. Materials, Composite Fabrication, and Test Campaign
- -
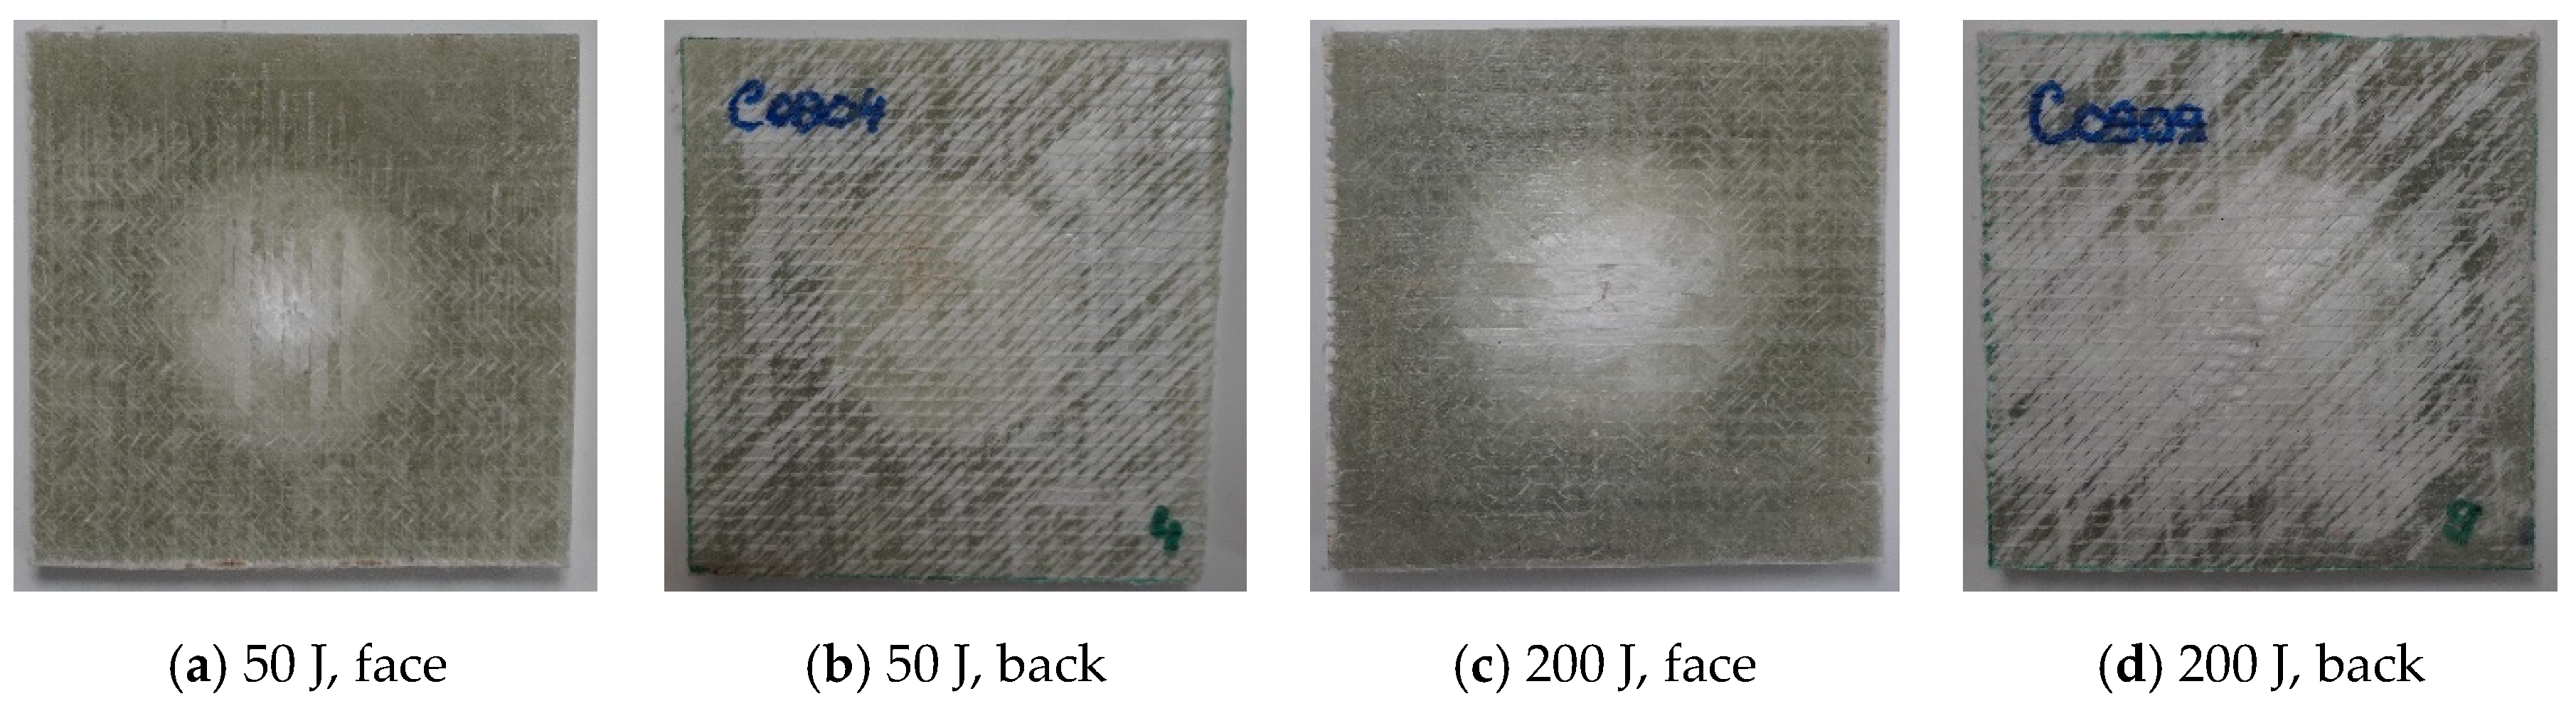
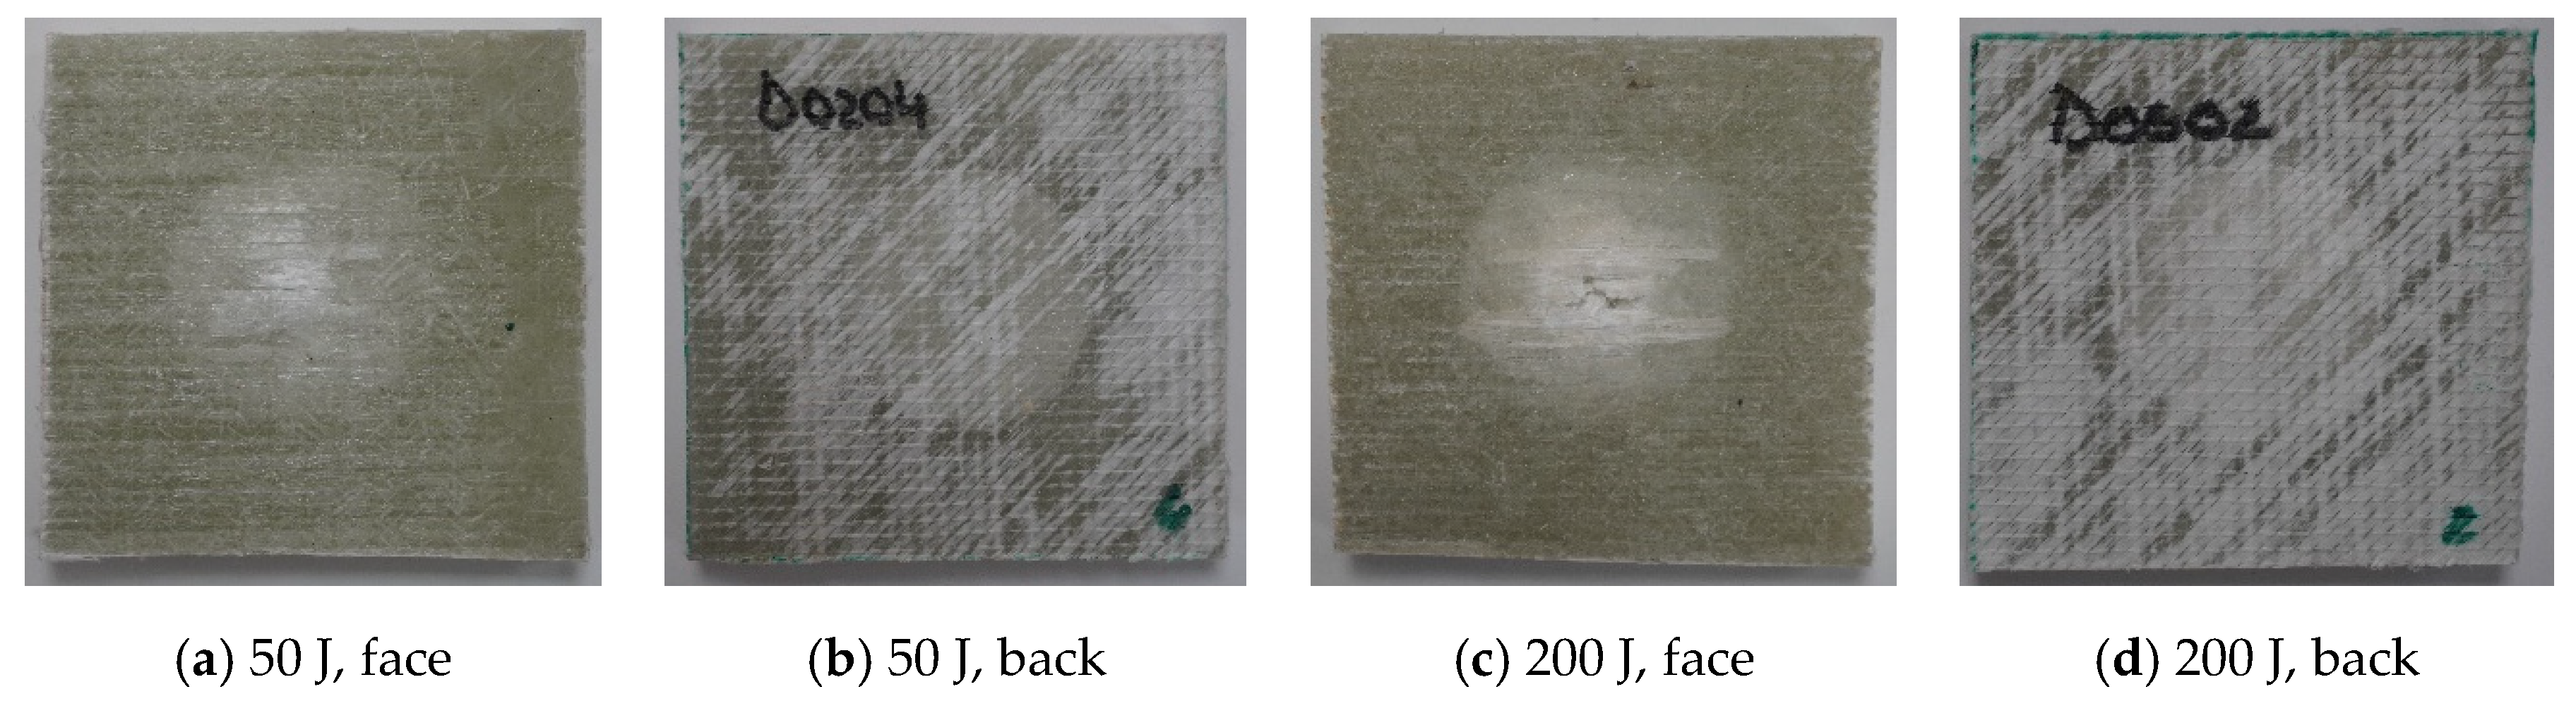
- Q-g: 8 layers of fiberglass fabric, with epoxy resin SikaBiresin® CR82 and hardener CH80-2 as matrix);
- -
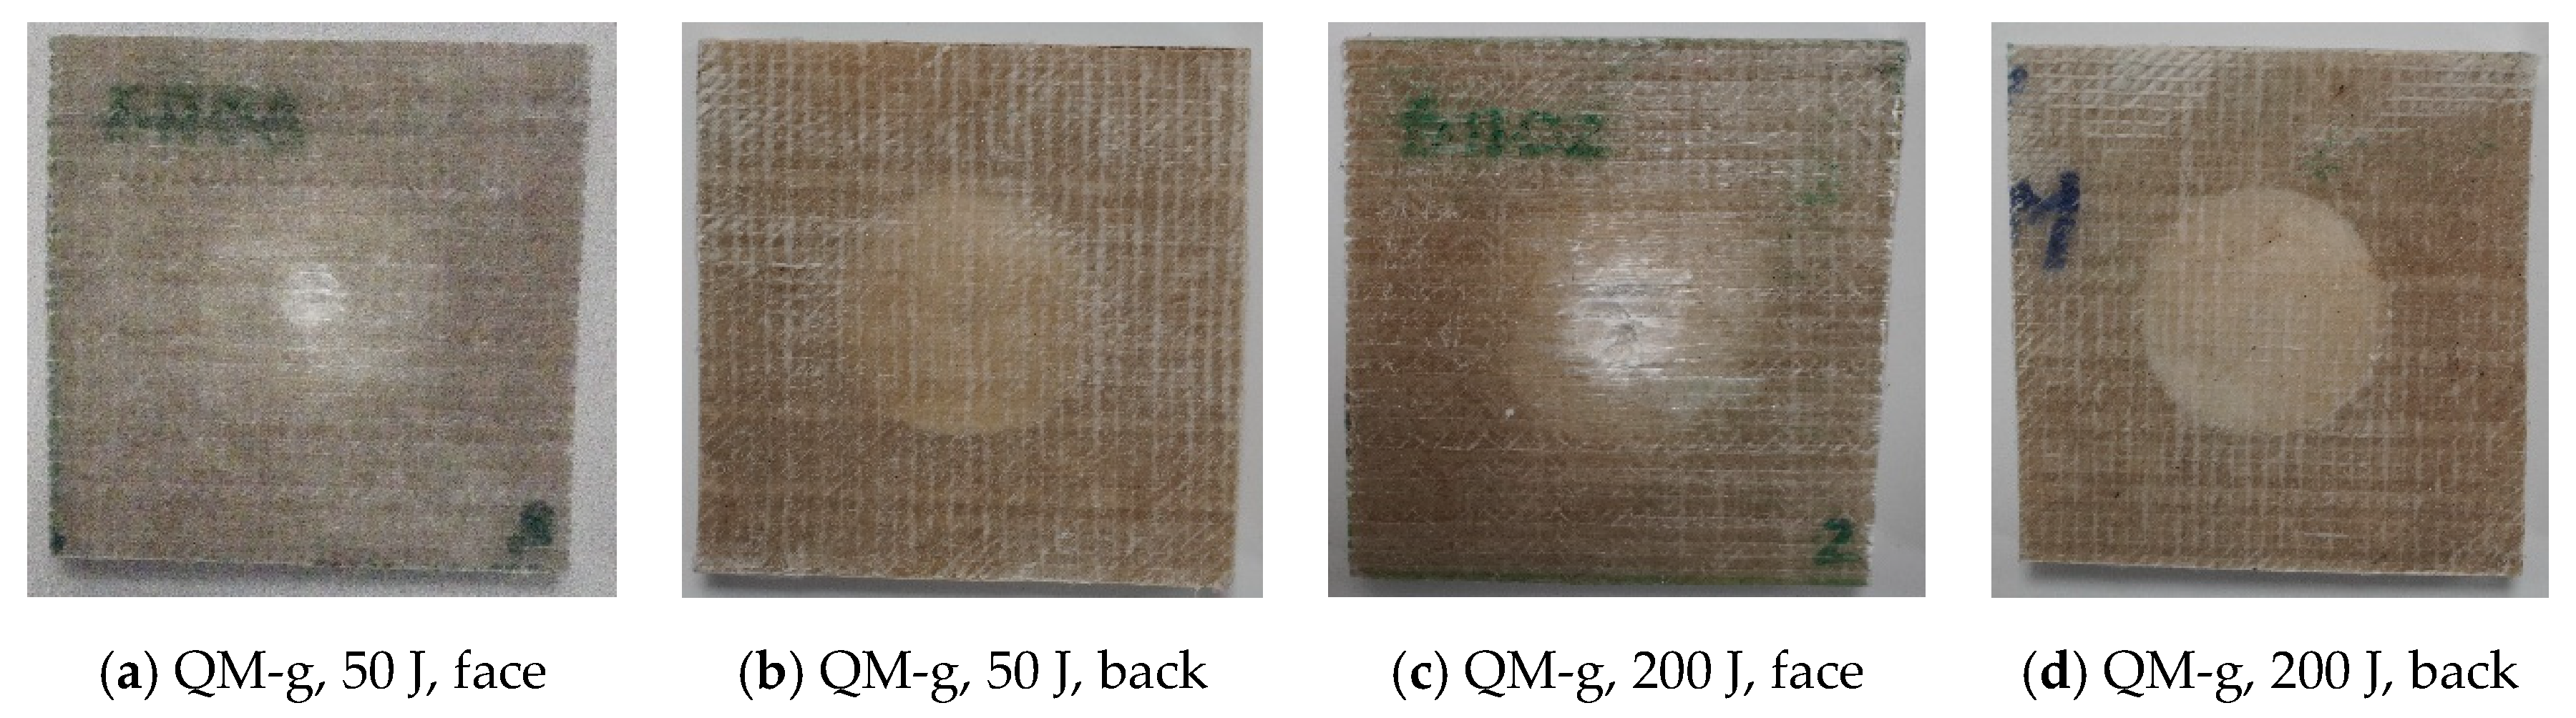
- QM-g: 4 layers of fiberglass + 1 layer of Coremat® XI 3 (in the middle) + 4 layers of fiberglass, with epoxy resin SikaBiresin® CR82 and hardener CH80-2;
- -
- Q-c: 8 layers of fiberglass with unsaturated polyester resin Enydyne H 68372 TA, with accelerator Metox-50 W;
- -
- QM-c: 4 layers of fiberglass + 1 Coremat® XI 3 layer + 4 layers of fiberglass with unsaturated polyester resin Enydyne H 68372 TA, with accelerator Metox-50 W.
- -
- for composites without mat
- -
- for composites with mat
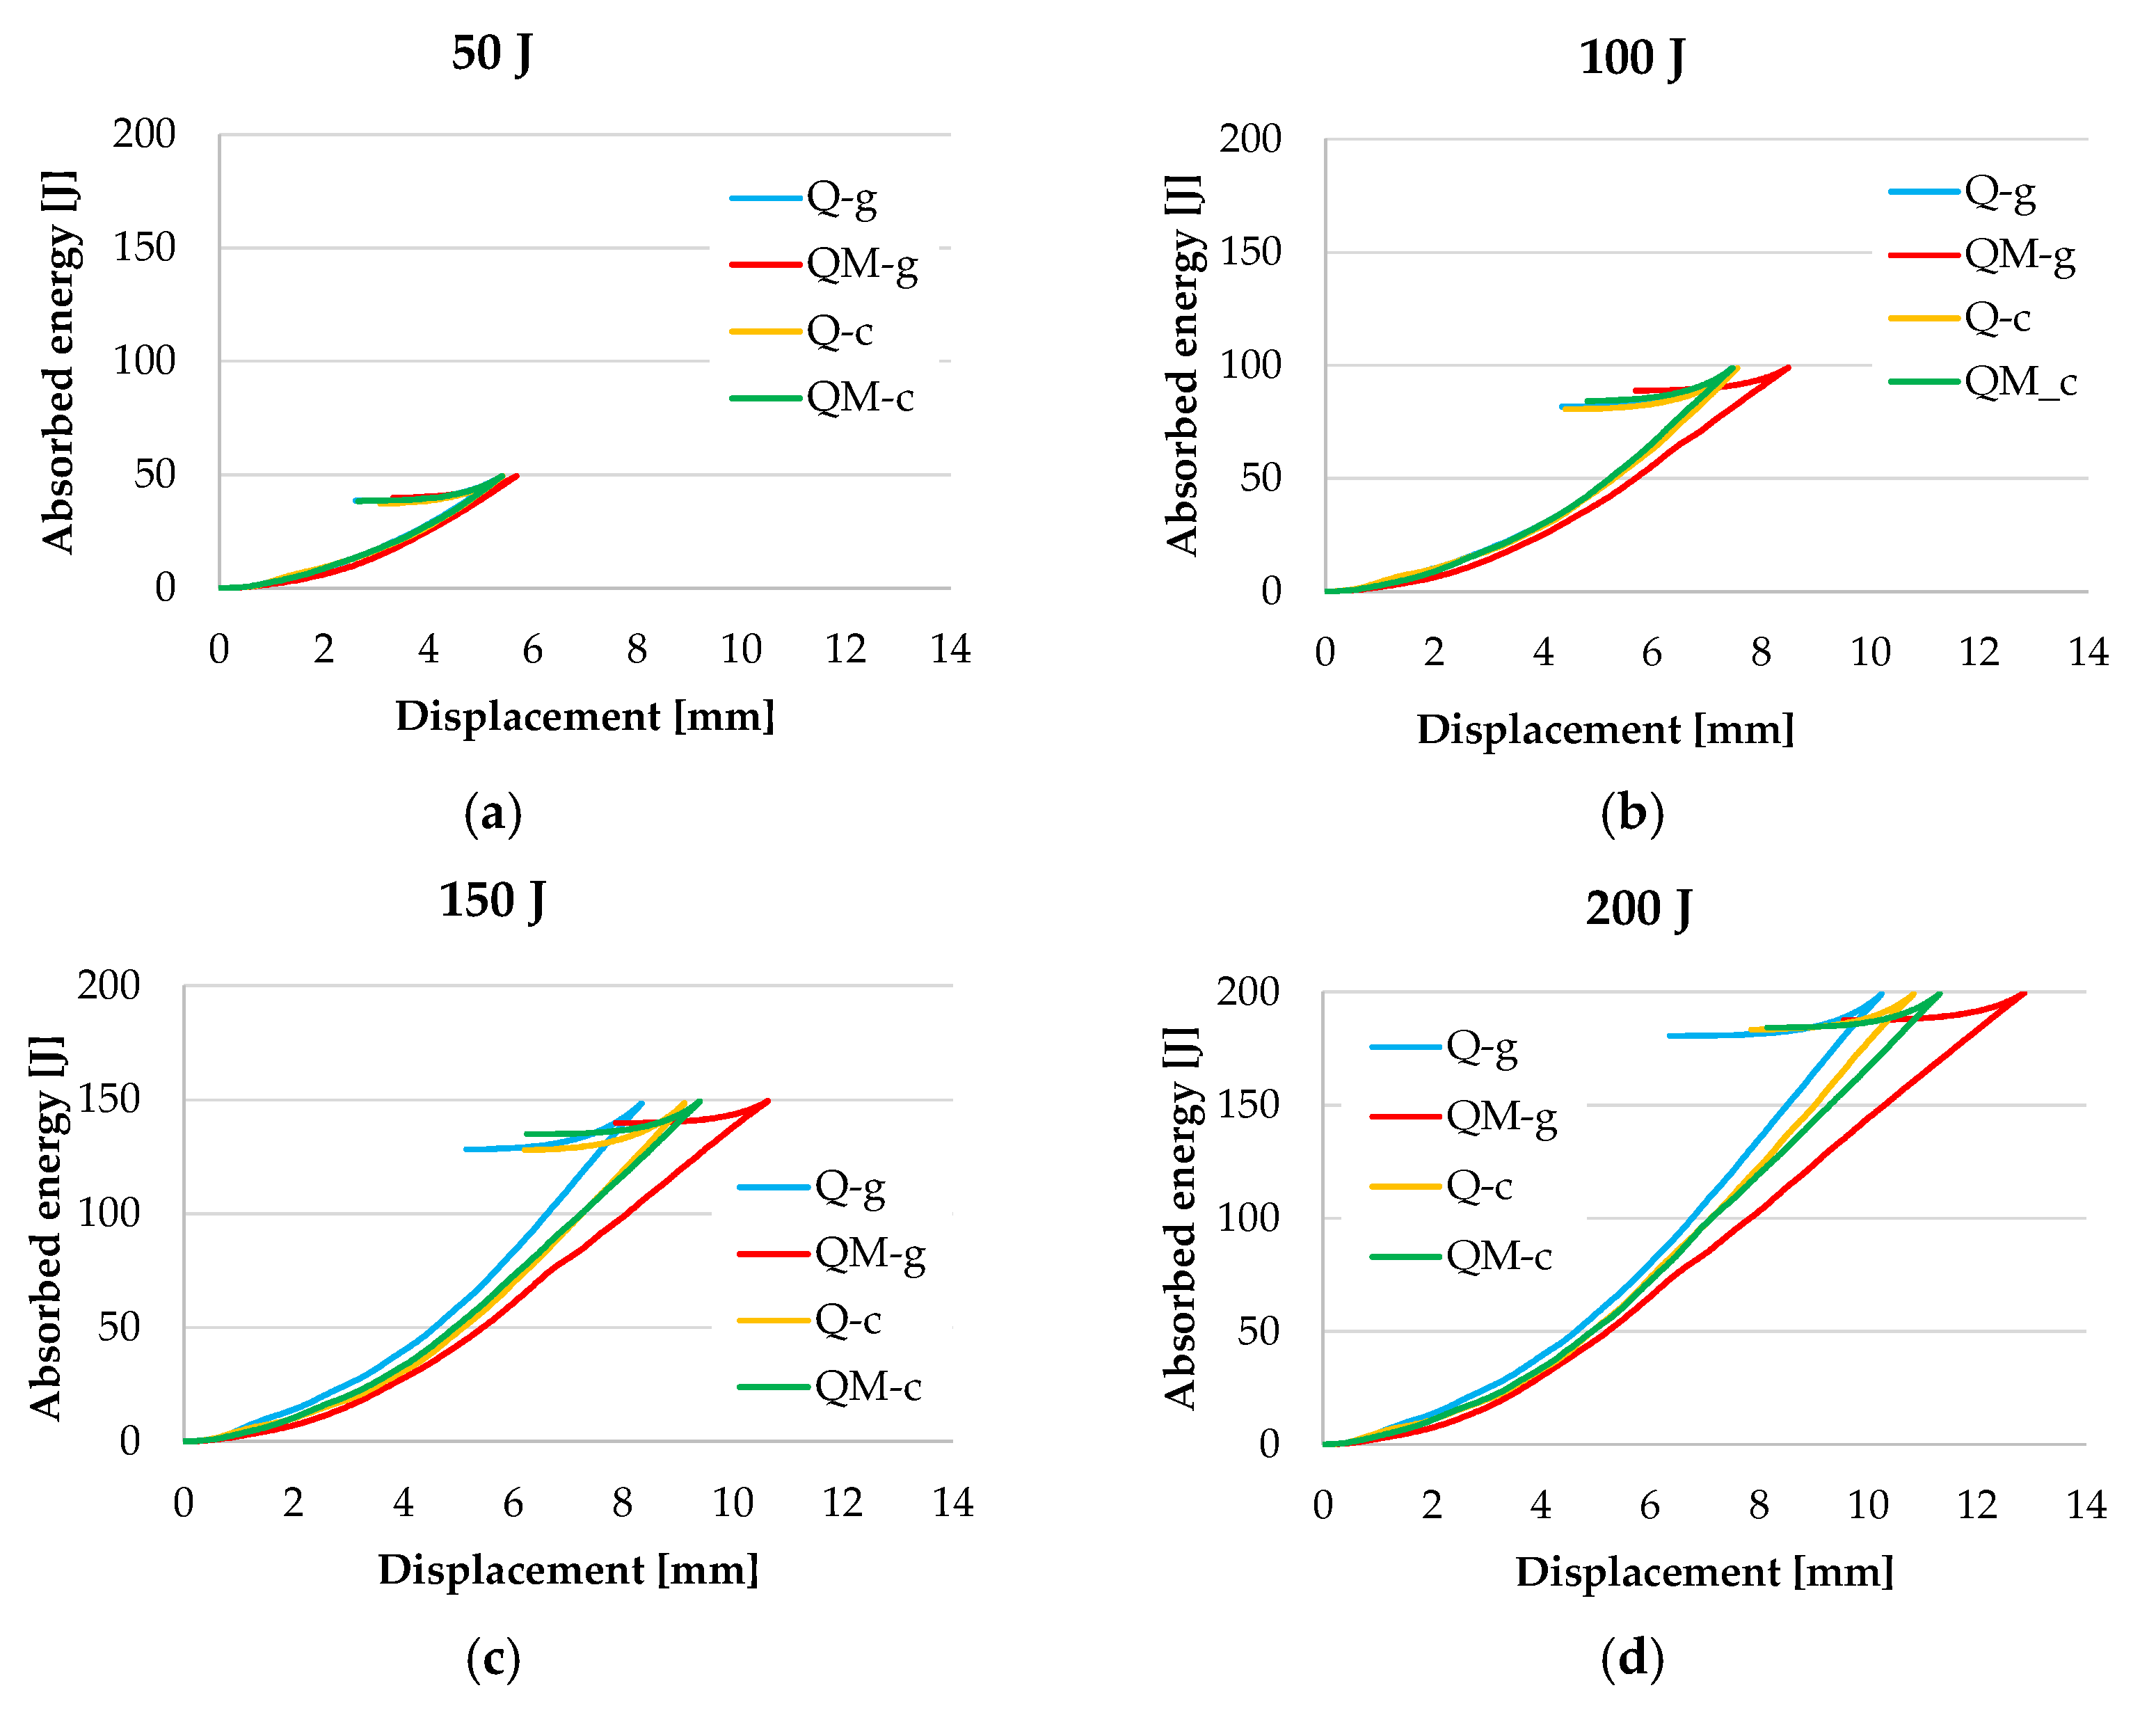
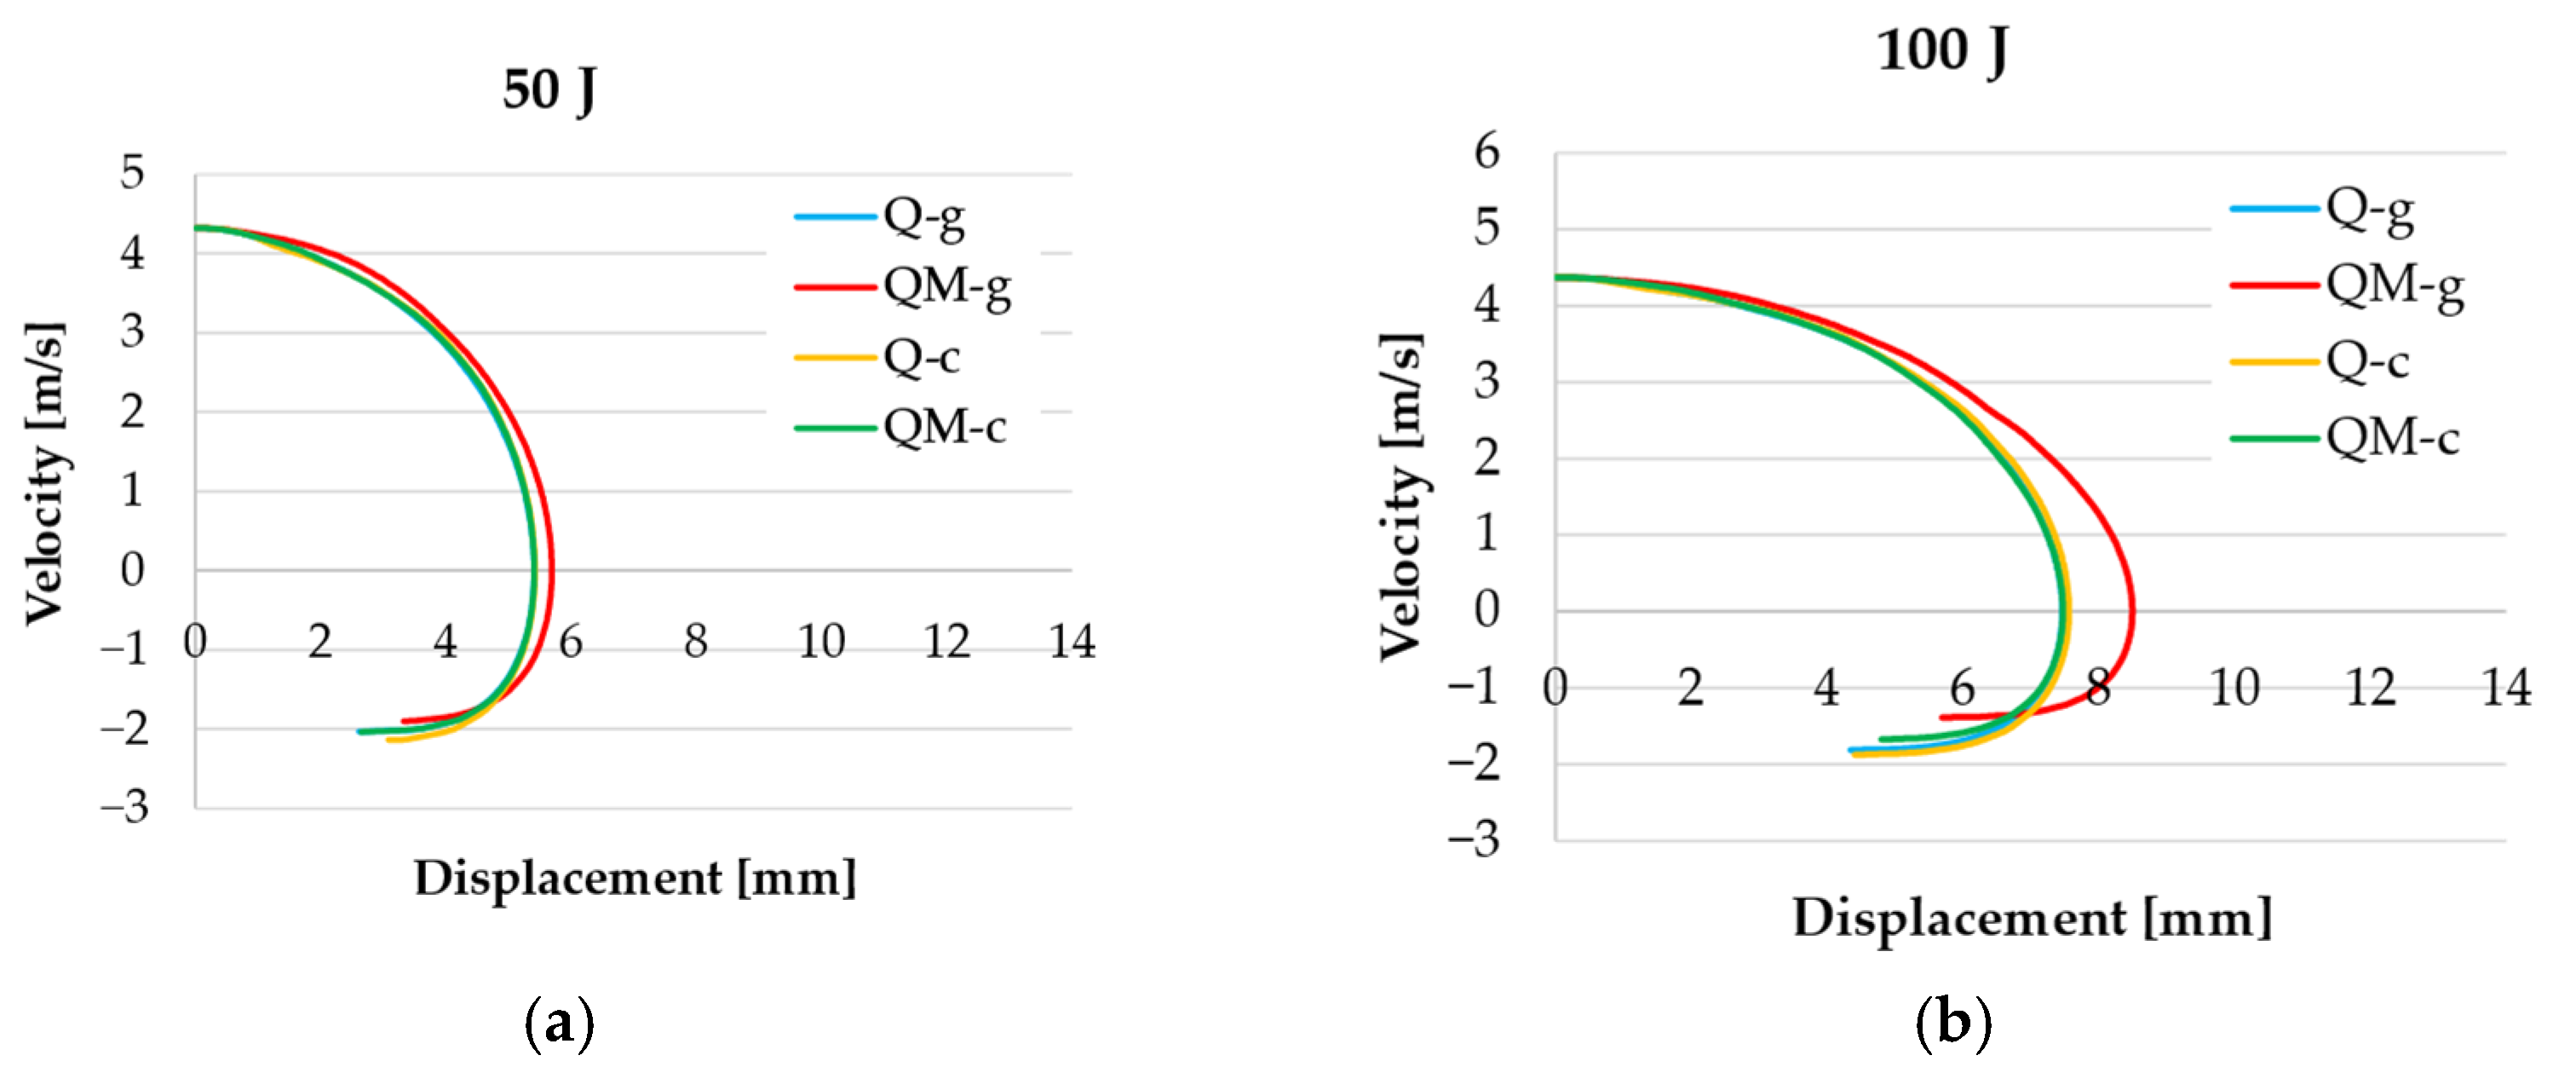
3. Results
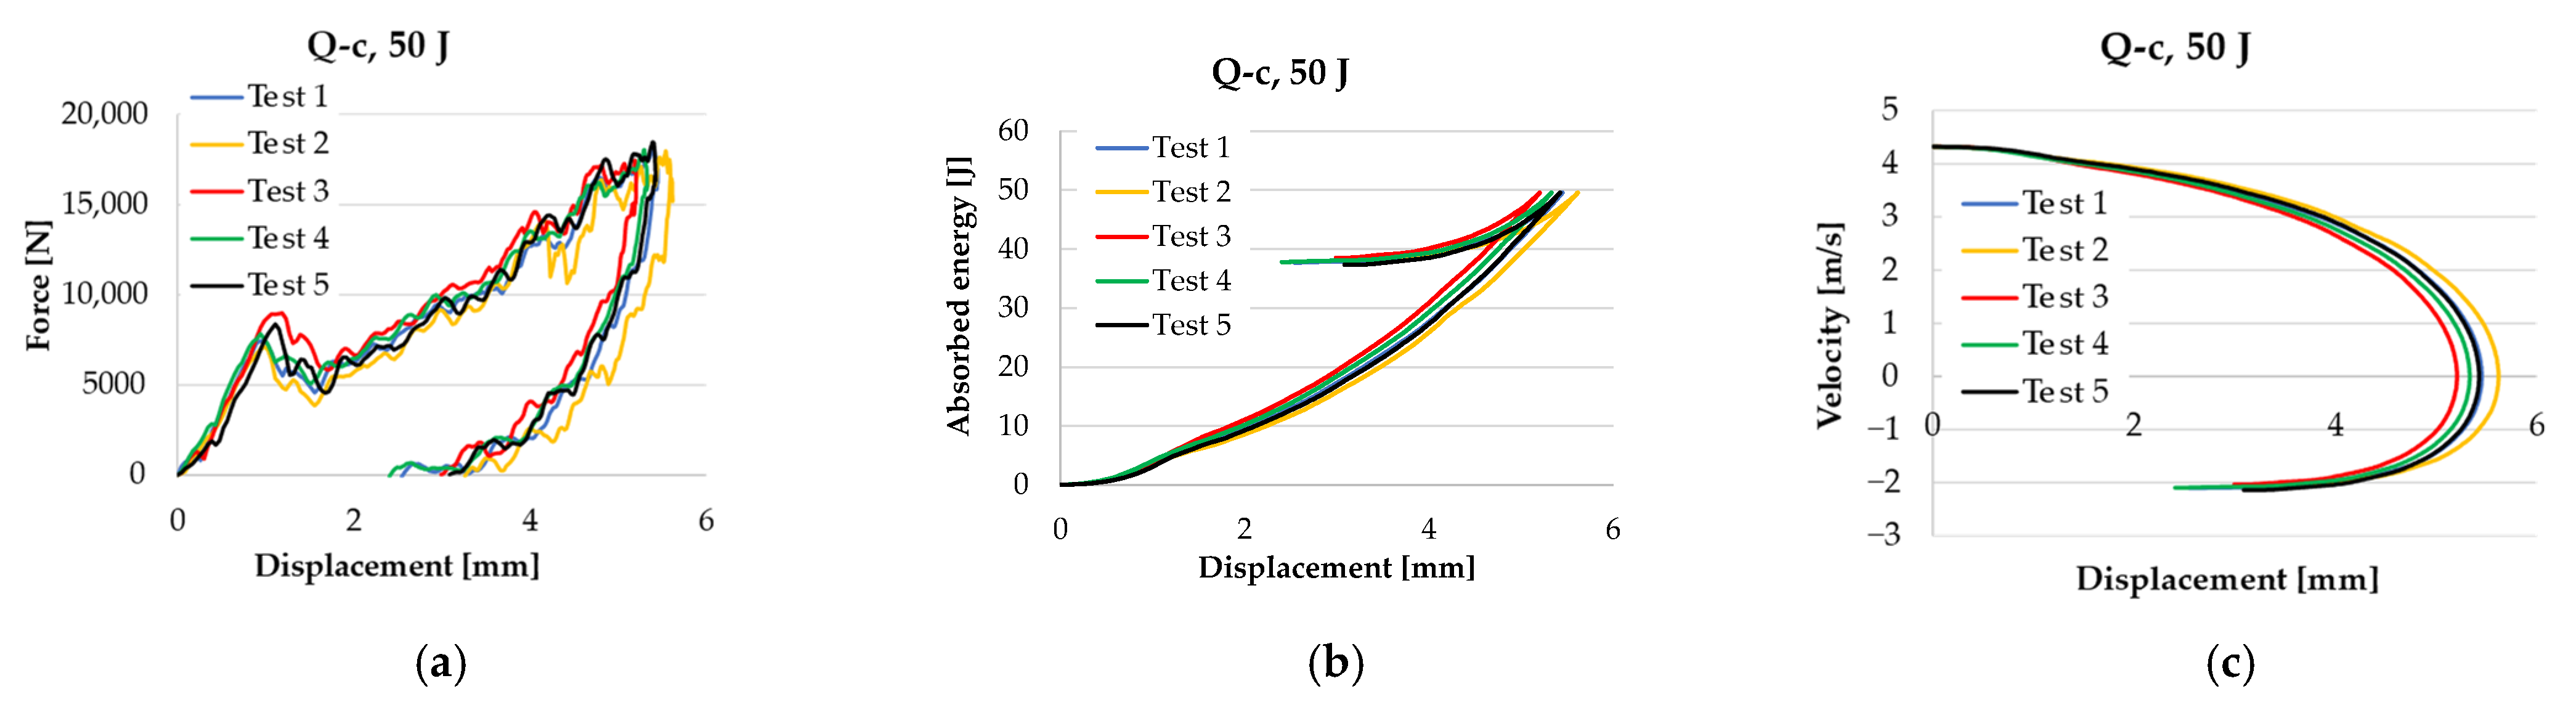
- (a)
- Fmax increases with impact energy, but this increase depends also on composite type: both composites without Coremat® Xi 3 (Q-c and Q-g) have higher values for Fmax as compared to the composites with mat (QM-c and QM-g); the dependence on impact energy is more pronounced for composites without mat; for composites with mat, the slope of this dependence is lower.
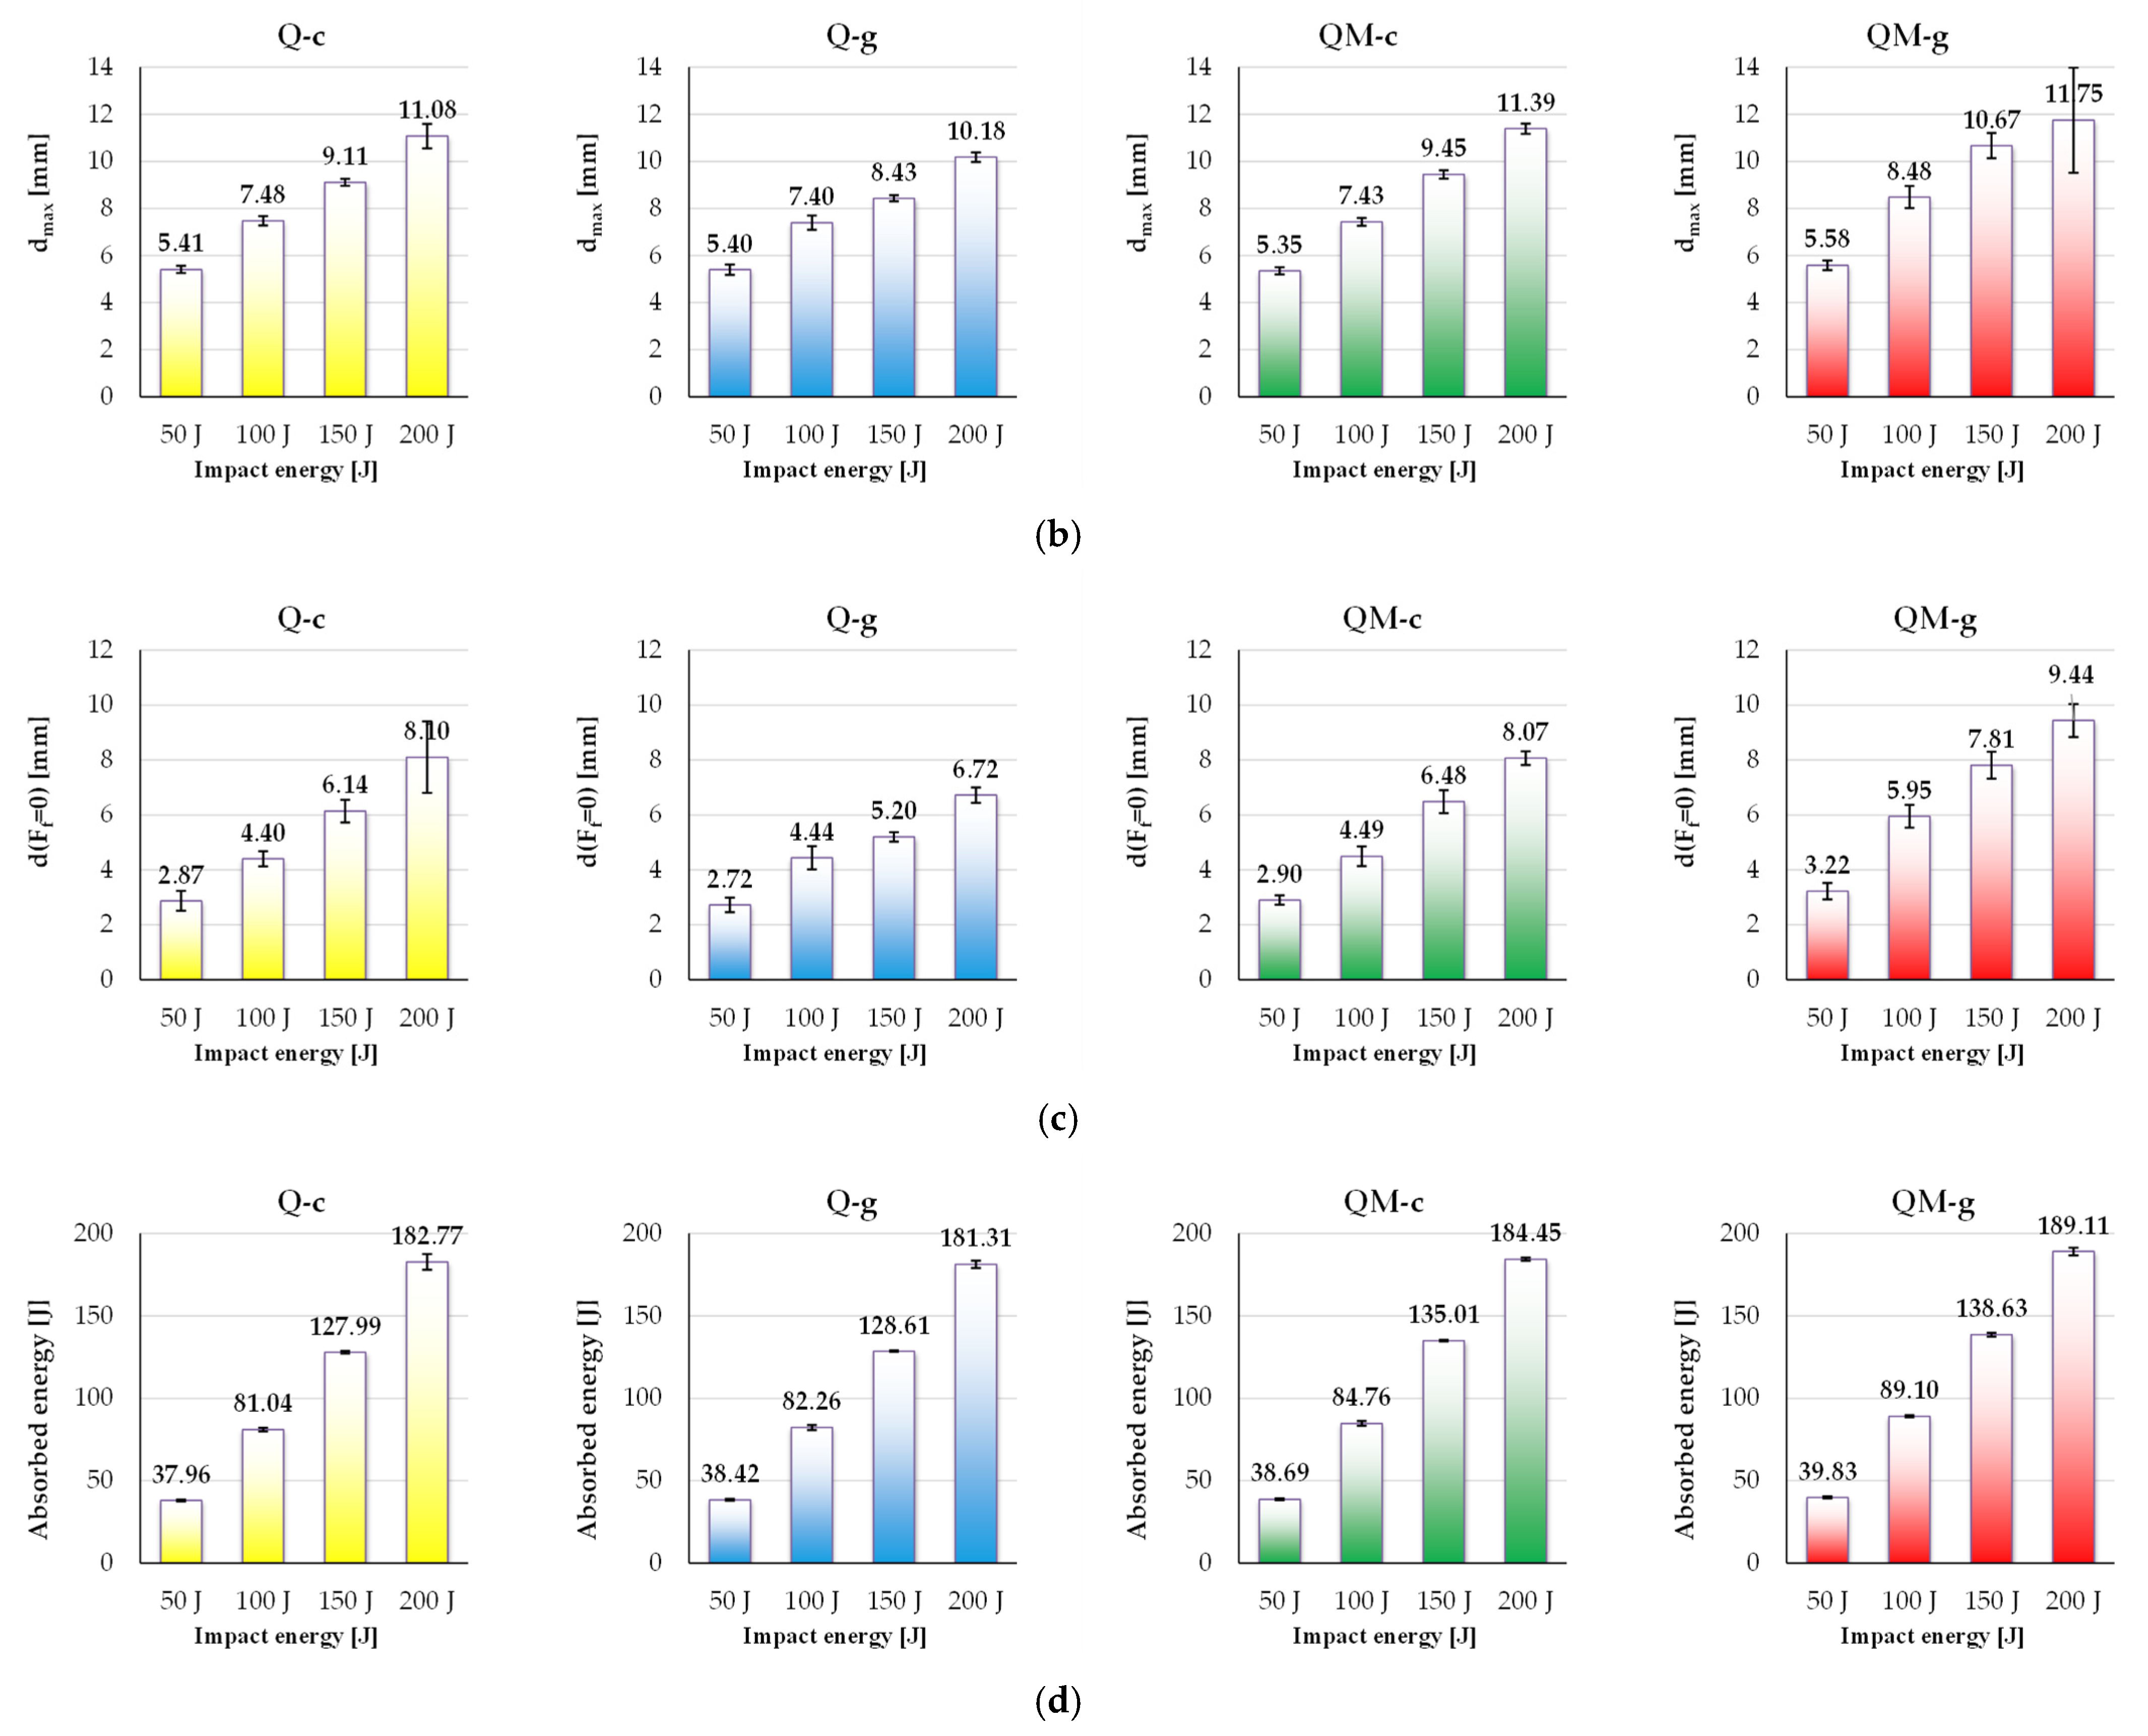
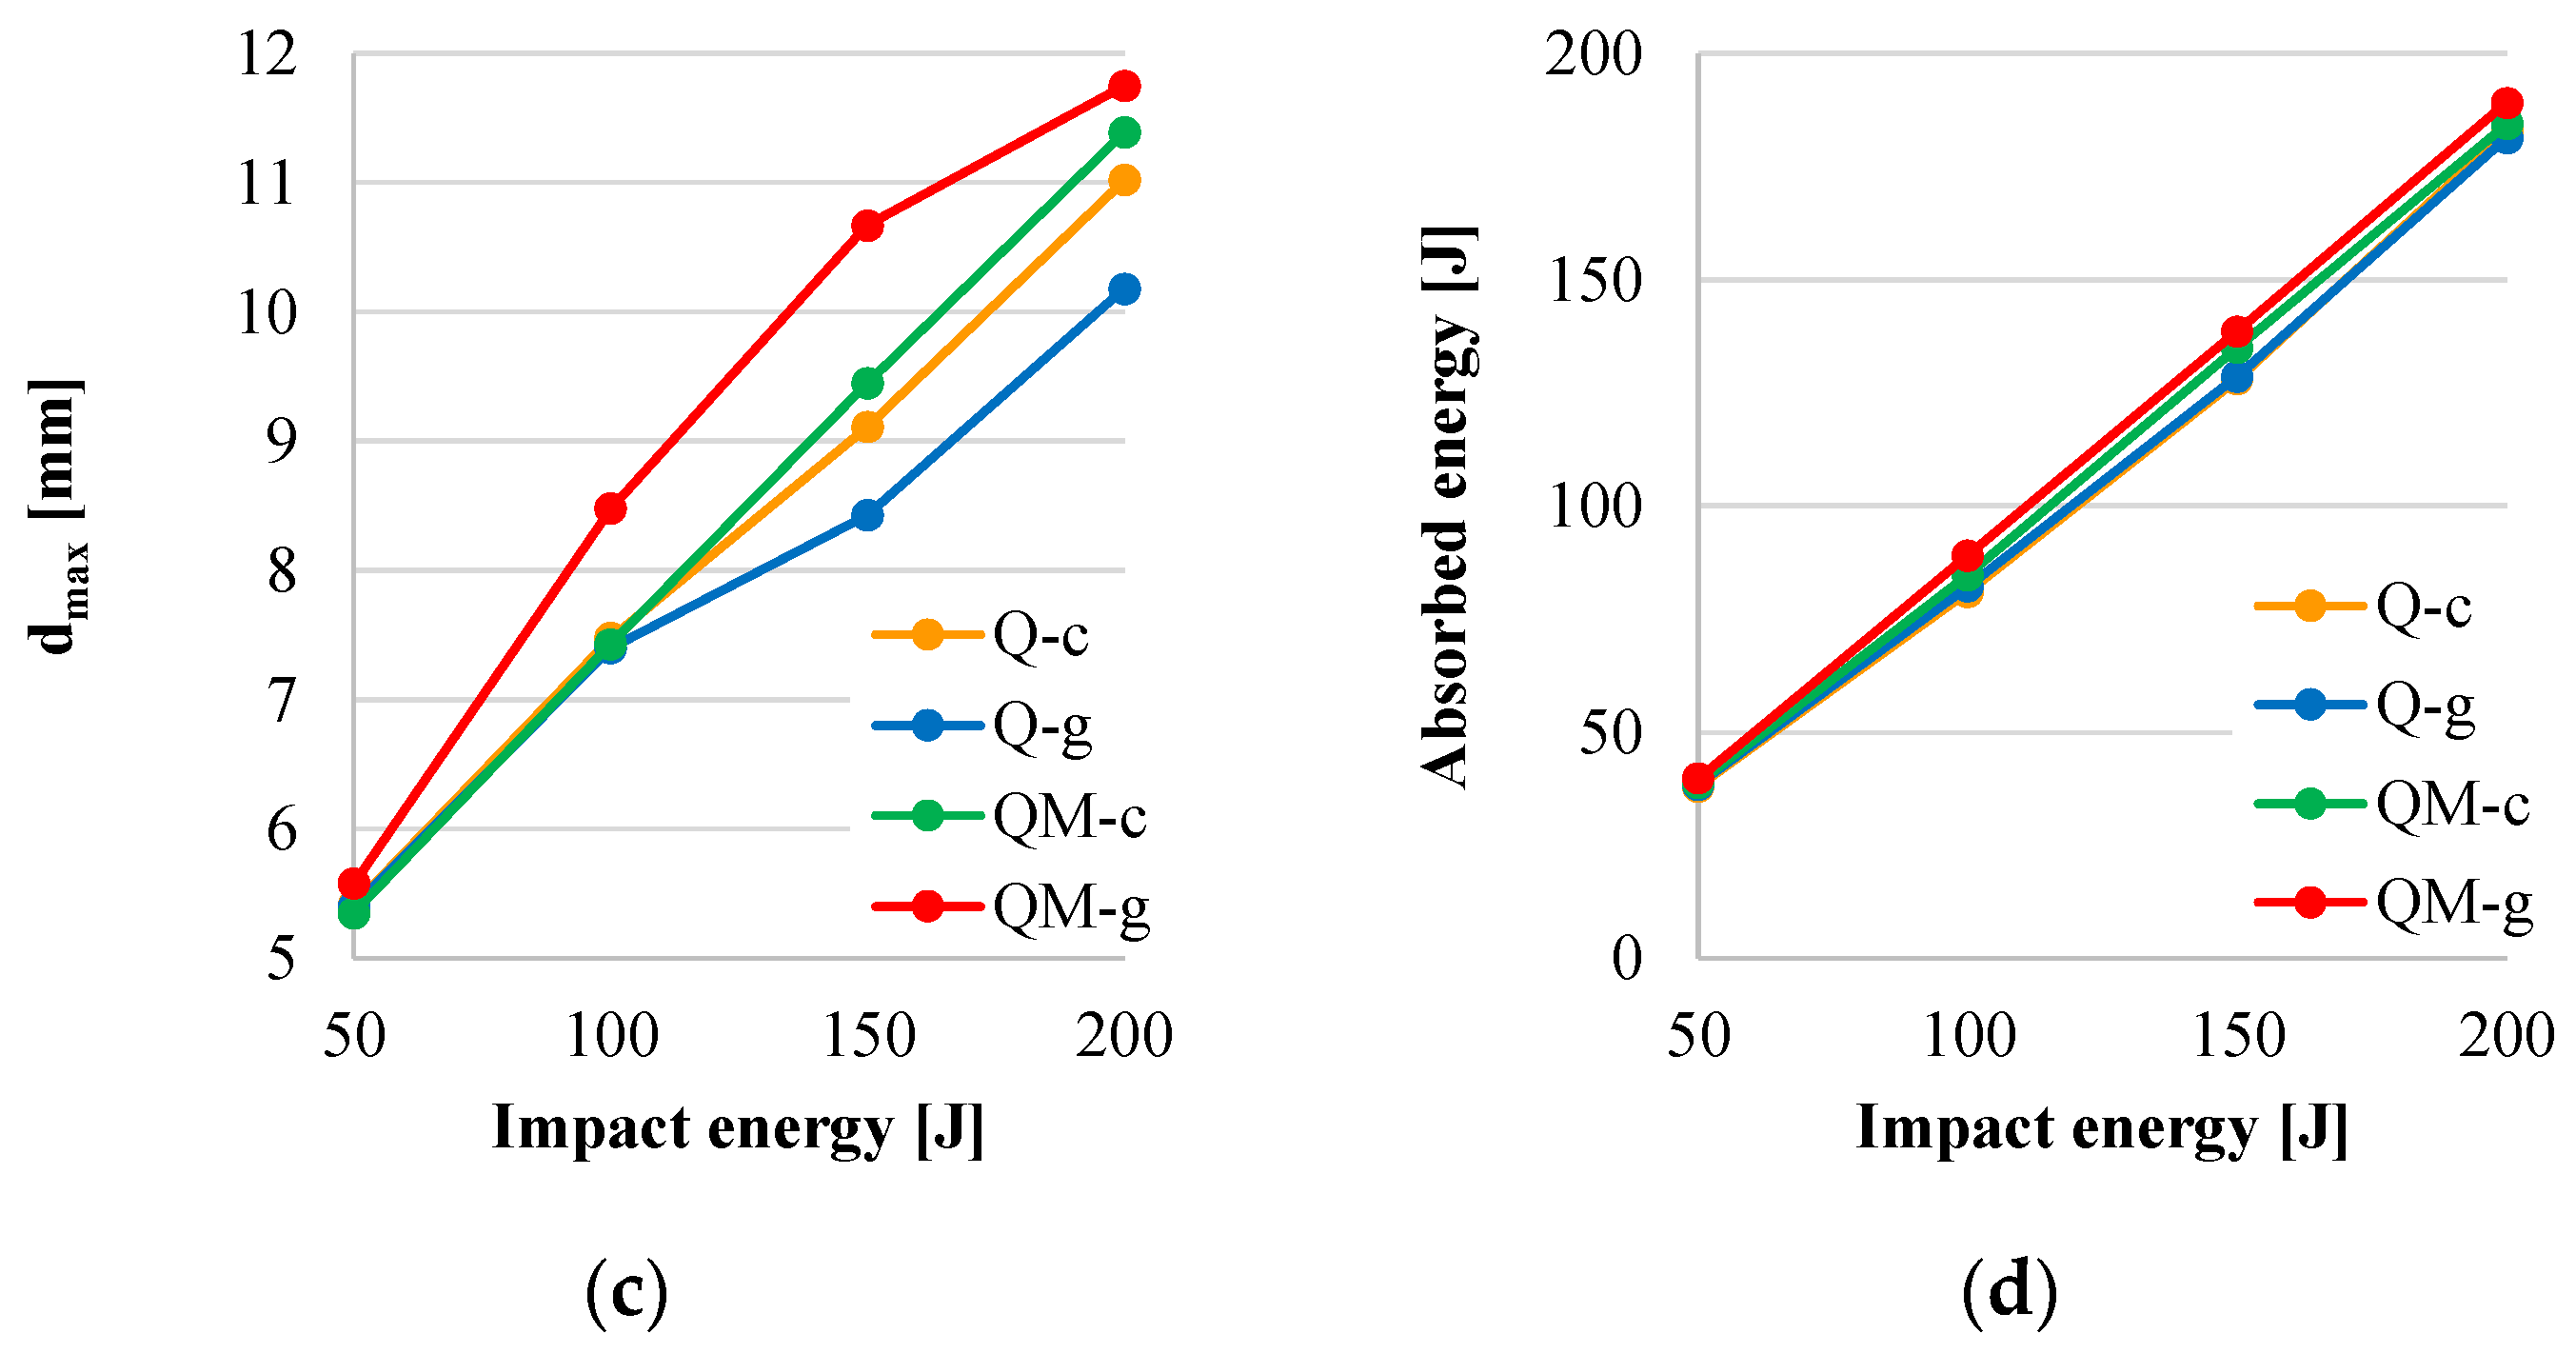
- (b)
- Maximum displacement (dmax) has average values very close for the 50 J test for all composites, but when increasing the impact energy, this parameter increases in the same manner for every impact energy level: dmax (Q-g) < dmax (Q-c) < dmax (QM-c) < dmax (QM-g).
- (c)
- Displacement at the end of the impact, when Ff = 0 after reaching the maximum value, noted as d(Ff = 0), could be ordered as d(Ff = 0)(Q-g) < d(Ff = 0)(Q-c) < d(Ff = 0)(QM-c) < d(Ff = 0) (QM-g) for all impact energy values.
- (d)
- For the energy absorption, the behavior of the composites is clearly divided into two groups: the two composites with the epoxy matrix have lower values, and those including the mat in the middle of the composites exhibited the highest values; however, differences are too small to make this parameter a well-defined influence factor.
4. Conclusions
Author Contributions
Funding
Institutional Review Board Statement
Data Availability Statement
Conflicts of Interest
References
- Sutherland, L.S.; Guedes Soares, C. Impact on Marine Laminates. In Proceedings of the RINA Conference on the Modern Yacht, Southampton, UK, 11–12 October 2007. [Google Scholar] [CrossRef]
- Dutton, S.; Baker, A.A. Aircraft Applications and Design Issues. In Composite Materials for Aircraft Structures, 2nd ed.; Baker, A.A., Dutton, S., Kelly, D., Eds.; AIAA, American Institute of Aeronautics and Astronautics, Inc.: Reston, VA, USA, 2004; pp. 435–476. [Google Scholar]
- Summerscales, J. Materials selection for marine composites. In Marine Composites; Pemberton, J., Summerscales, J., Graham-Jones, J., Eds.; Woodhead Publishing, Elsevier: Duxford, UK, 2019; pp. 3–30. [Google Scholar]
- Carr, D.J.; Crawford, C. High performance fabrics and 3D materials. In Lightweight Ballistic Composites Military and Law-Enforcement Applications, 2nd ed.; Bhatnagar, A., Ed.; Woodhead Publishing, Elsevier: Amsterdam, The Netherlands, 2016; pp. 41–54. [Google Scholar]
- Weitzenböck, J.R.; Hayman, B.; Hersvik, G.; McGeorge, D.; Noury, P.; Hill, D.M.; Echtermeyer, A. Application of Composites. In Proceedings of the Ships and Offshore—A Review and Outlook, Marine and Offshore Composites, The Royal Institution of Naval Architects, RINA HQ, London, UK, 3–4 February 2010. [Google Scholar]
- Graham-Jones, J.; Summerscales, J. Introduction, Part Two Applications of Advanced Fibre-Reinforced Composites. In Marine Structures Marine Applications of Advanced Fibre-Reinforced Composites; Graham-Jones, J., Summerscales, J., Eds.; Woodhead Publishing, Elsevier: Cambridge, UK, 2016; pp. 1–24. [Google Scholar]
- Jeong, Y.-J.; Kim, H.-T.; Kim, J.-D.; Kim, J.-H.; Kim, S.-K.; Lee, J.-M. Evaluation of mechanical properties of glass fiber-reinforced composites depending on length and structural anisotropy. Results Eng. 2023, 17, 101000. [Google Scholar] [CrossRef]
- Abrate, S. Ballistic Impacts on Composite and Sandwich Structures. In Major Accomplishments in Composite Materials and Sandwich Structures; Springer: Dordrecht, The Netherlands, 2009; pp. 465–501. [Google Scholar] [CrossRef]
- Sezgin, H.; Berkalp, O.B. Textile-Reinforced Composites for the Automotive Industry. In Composites and Advanced Materials for Industrial Applications, 1st ed.; Advances in Chemical and Materials, Engineering; Kumar, K., Paulo Davim, J., Eds.; IGI Global: Hershey, PA, USA, 2018; pp. 129–156, Chapter 7. [Google Scholar] [CrossRef]
- Marulo, F.; Guida, M.; Maio, L.; Ricci, F. Numerical simulations and experimental experiences of impact on composite structures. In Dynamic Response and Failure of Composite Materials and Structures; Lopresto, V., Langella, A., Abrate, S., Eds.; Woodhead Publishing, Elsevier Ltd.: Duxford, UK, 2017; pp. 85–125. [Google Scholar]
- Bouvet, C.; Rivallant, S. Damage tolerance of composite structures under low-velocity impact. In Dynamic Deformation, Damage and Fracture in Composite Materials and Structures, 2nd ed.; Silberschmidt, V., Ed.; Woodhead Publishing, Elsevier Ltd.: Cambridge, MA, USA, 2023; pp. 3–28. [Google Scholar] [CrossRef]
- Patil, S.; Reddy, D.M.; Reddy, M. Low velocity impact analysis on composite structures—A review. In Proceedings of the First International Conference on Design, Materials and Manufacture (ICDEM 2018), Karnataka, India, 29–31 January 2018; AIP Publishing LLC.: Karnataka, India, 2018; Volume 1943, p. 020009. [Google Scholar] [CrossRef]
- Shelly, D.; Singhal, V.; Nanda, T.; Mehta, R.; Aepuru, R.; Lee, S.-Y.; Park, S.-J. A review of the emerging approaches for developing multi-scale filler-reinforced epoxy nanocomposites with enhanced impact performance. Polym. Compos. 2024, 45, 9647–9676. [Google Scholar] [CrossRef]
- Chai, G.B.; Manikandan, P. Low velocity impact response of fibre-metal laminates—A review. Compos. Struct. 2014, 107, 363–381. [Google Scholar] [CrossRef]
- Ashby, M.; Shercliff, H.; Cebon, D. Fracture- and fatigue-limited design. In Materials: Engineering, Science, Processing and Design, 4th ed.; Butter-worth-Heinemann, Elsevier: Oxford, UK, 2019; pp. 259–276, Chapter 10. [Google Scholar]
- Ojoc, G.G.; Chiper Titire, L.; Munteniță, C.; Pîrvu, C.; Sandu, S.; Deleanu, L. Ballistic Response of a Glass Fiber Composite for Two Levels of Threat. Polymers 2023, 15, 1039. [Google Scholar] [CrossRef] [PubMed]
- Zhang, S. The Mechanics of Ship Collision. Ph.D. Thesis, Technical University of Denmark, Lyngby, Denmark, 1999. [Google Scholar]
- Zhu, Z.; Li, X.; Chen, Q.; Cai, Y.; Xiong, Y. Simulations and Tests of Composite Marine Structures Under Low-Velocity Impact. Pol. Marit. Res. 2021, 281, 59–71. [Google Scholar] [CrossRef]
- Ni, K.; Chen, Q.; Wen, J.; Cai, Y.; Zhu, Z.; Li, X. Low-velocity impact and post-impact compression properties of carbon/glass hybrid yacht composite materials. Ocean Eng. 2024, 292, 116448. [Google Scholar] [CrossRef]
- Long, B.; Yang, N.; Cao, X. Low-velocity impact damages of filamentwound composite overwrapped pressure vessel (COPV). J. Eng. Fibers Fabr. 2022, 17, 1–16. [Google Scholar] [CrossRef]
- Lin, H.; Han, C.; Yang, L.; Karampour, H.; Luan, H.; Han, P.; Xu, H.; Zhang, S. Dynamic Performance and Crashworthiness Assessment of Honeycomb Reinforced Tubular Pipe in the Jacket Platform under Ship Collision. J. Mar. Sci. Eng. 2022, 10, 1194. [Google Scholar] [CrossRef]
- Kim, S.J.; Taimuri, G.; Kujala, P.; Conti, F.; Le Sourne, H.; Pineau, J.-P.; Looten, T.; Bae, H.; Mujeeb-Ahmed, M.P.; Vassalos, D.; et al. Comparison of numerical approaches for structural response analysis of passenger ships in collisions and groundings. Mar. Struct. 2022, 81, 103125. [Google Scholar] [CrossRef]
- Clyne, T.W.; Hull, D. An Introduction to Composite Materials; Cambridge University Press: Cambridge, UK, 2019. [Google Scholar]
- Lowe, J. Aerospace Applications. In Design and Manufacture of Textile Composites; Long, A.C., Ed.; Woodhead Publishing Ltd., Elsevier: Cambridge, UK, 2005; pp. 405–423. [Google Scholar]
- Esp, B. Practical Analysis of Aircraft Composites; Grand Oak Publishing: New York, NY, USA, 2017. [Google Scholar]
- Wahrhaftig, A.; Ribeiro, H.; Nogueira, A. A structural composite for marine boat constructions. In Marine Composites. Design and Performance; Pemberton, R., Summerscales, J., Graham-Jones, J., Eds.; Woodhead Publishing, Elsevier: Duxford, UK, 2019; pp. 301–314. [Google Scholar]
- Thomas, G.A. Non-woven fabrics for military applications. In Military Textiles; Wilusz, E., Ed.; Woodhead Publishing Ltd.: Cambridge, UK, 2008; pp. 17–49. [Google Scholar]
- Lu, C.; Pilla, S. Srikanth Pilla Design of Automotive Composites; SAE International: Warrendale, PA, USA, 2014. [Google Scholar]
- Greene, J.P. Automotive Plastics and Composites; William Andrew Publishing: Norwich, NY, USA, 2021; pp. 301–324. [Google Scholar] [CrossRef]
- Zhang, L. The application of composite fiber materials in sports equipment. In Proceedings of the 5th International Conference on Education, Management, Information and Medicine (EMIM 2015), Shenyang, China, 24–26 April 2015. [Google Scholar] [CrossRef]
- Fan, Q.; Duan, H.; Xing, X. A review of composite materials for enhancing support, flexibility and strength in exercise. Alex. Eng. J. 2024, 94, 90–103. [Google Scholar] [CrossRef]
- Komus, A.; Beley, N. 3.15 Composite Applications for Ground Transportation. In Comprehensive Composite Materials II; Beaumont, P.W.R., Zweben, C.H., Eds.; Elsevier: Amsterdam, The Netherlands, 2018; pp. 420–438. [Google Scholar] [CrossRef]
- Denton, D.L. Land Transportation Applications. In Handbook of Composites; Peters, S.T., Ed.; Springer: Boston, MA, USA, 1998. [Google Scholar] [CrossRef]
- Hao, X.-K.; Zhu, Q.-Y.; Zhong, L.-F.; Zhan, Z.-T.; Feng, Q.; Zheng, J.-J. Axial Stress–Strain Model of LRS-FRP–Confined Rectangular Concrete Prisms Allowing for the Size Effect and Its Application in Flexural Analysis of Beams. J. Compos. Constr. 2025, 29, 04025002. [Google Scholar] [CrossRef]
- Olsson, R.; Sicomp, S. Low- and medium-velocity impact as a cause of failure in polymer matrix composites. In Failure Mechanisms in Polymer Matrix Composites; Robinson, P., Greenhalgh, E., Pinho, S., Eds.; Woodhead Publishing Limited: Cambridge, UK, 2012; pp. 53–78. [Google Scholar]
- Carlsson, L.A.; Adams, D.F.; Pipes, R.B. Experimental Characterization of Advanced Composite Materials; CRC Press: Boca Raton, FL, USA, 2014. [Google Scholar]
- Chawla, K.K. Composite Materials: Science and Engineering; Springer Science & Business Media: Berlin, Germany, 2012. [Google Scholar]
- Yang, K.; Wu, S.; Guan, J.; Shao, Z.; Ritchie, R.O. Enhancing the Mechanical Toughness of Epoxy-Resin Composites Using Natural Silk Reinforcements. Sci. Rep. 2017, 7, 11939. [Google Scholar] [CrossRef] [PubMed]
- Santulli, C. Impact properties of glass/plant fibre hybrid laminates. J. Mater. Sci. 2007, 42, 3699–3707. [Google Scholar] [CrossRef]
- Luan, C.; Movva, S.; Wang, K.; Yao, X.; Zhang, C.; Wang, B. Towards next-generation fiber-reinforced polymer composites: A perspective on multifunctionality. Funct. Compos. Struct. 2019, 1, 042002. [Google Scholar] [CrossRef]
- Khan, Z.; Naik, M.K.; Al-Sulaiman, F.; Merah, N. Low velocity impact of filament-wound glass-fiber reinforced composite pipes. J. Mater. Sci. 2016, 5, 1000253. [Google Scholar] [CrossRef]
- Reyes, G.; Sharma, U. Modeling and damage repair of woven thermoplastic composites subjected to low velocity impact. Compos. Struct. 2010, 92, 523–531. [Google Scholar] [CrossRef]
- Mars, J.; Chebbi, E.; Wali, M.; Dammak, F. Numerical and experimental investigations of low velocity impact on glass fiber-reinforced polyamide. Compos. B Eng. 2018, 146, 116–123. [Google Scholar] [CrossRef]
- Venkategowda, C.; Rajanna, S.; Udupa, N.G.S.; Keshavamurthy, R. Experimental investigation of glass-carbon/epoxy hybrid composites subjected to low velocity impact test. FME Trans. 2018, 46, 595–602. [Google Scholar] [CrossRef]
- Kalamkarov, A.L.; Kolpakov, A.G. Analysis, Design and Optimization of Composite Structures; Wiley: New York, NY, USA, 1997; Volume 1. [Google Scholar]
- Barbero, E.J. Introduction to Composite Materials Design; Fabric Reinforced Composites; CRC Press: Boca Raton, FL, USA, 2010. [Google Scholar] [CrossRef]
- Hojo, M.; Ando, T.; Tanaka, M.; Adachi, T.; Ochiai, S.; Endo, Y. Modes I and II interlaminar fracture toughness and fatigue delamination of CF/epoxy laminates with self-same epoxy interleaf. Int. J. Fatigue 2006, 28, 1154–1165. [Google Scholar] [CrossRef]
- Kinvi-Dossou, G.; Matadi Boumbimba, R.; Bonfoh, N.; Garzon-Hernandez, S.; Garcia-Gonzalez, D.; Gerard, P.; Arias, A. Innovative acrylic thermoplastic composites versus conventional composites: Improving the impact performances. Compos. Struct. 2019, 217, 1–13. [Google Scholar] [CrossRef]
- Vescovini, A.; Cruz, J.A.; Ma, D.; Colombo, C.; Salerno, A.; Bianchi, O.; Amico, S.C.; Manes, A. Experimental investigation on low-velocity impact behavior of glass, Kevlar, and hybrid composites with an elastomeric polyurethane matrix. Compos. Part C 2024, 13, 100426. [Google Scholar] [CrossRef]
- AlOmari, A.S.; Al-Athel, K.S.; Arif, A.F.M.; Al-Sulaiman, F.A. Experimental and Computational Analysis of Low-Velocity Impact on Carbon-, Glass- and Mixed-Fiber Composite Plates. J. Compos. Sci. 2020, 4, 148. [Google Scholar] [CrossRef]
- Al-Azzawi, A.S.M.; Featherston, C.A.; Lupton, C.; Jiang, C.; Barouni, A.; Koklu, U.; Giasin, K. Impact characteristics of S2-glass fibre/FM94-epoxy composites under high and cryogenic temperatures: Experimental and numerical investigation. Compos. B Eng. 2024, 287, 111786. [Google Scholar] [CrossRef]
- Păduraru, I.; Ojoc, G.G.; Petrescu, H.; Graur, I.; Pîrvu, C.; Deleanu, L. The Behavior of Glass Fiber Composites under Low Velocity Impacts. Polymers 2023, 15, 4549. [Google Scholar] [CrossRef]
- Reddy, T.S.; Reddy, P.R.; Madhu, V. Low velocity impact studies of E-glass/epoxy composite laminates at different thicknesses and temperatures. Def. Technol. 2019, 15, 897–904. [Google Scholar] [CrossRef]
- Sutherland, L.S.; Amado, C.; Guedes Soares, C. Statistical experimental design techniques to investigate the strength of adhesively bonded T-joints. Compos. Struct. 2017, 159, 445–454. [Google Scholar] [CrossRef]
- Singha, M.; Singha, K. Applications of Textiles in Marine Products. Mar. Sci. 2012, 2, 110–119. [Google Scholar] [CrossRef]
- Johannsen Thomas, J. One-Off Airex Fiberglass Sandwich Construction; Chemacryl Inc.: Buffalo, NY, USA, 1973. [Google Scholar]
- 1200 g/m2 Quadriaxial Stitched Glass Fabric (0°/+45°/90°/−45°), 127 cm Wide. Available online: https://www.castrocompositesshop.com/en/fibre-reinforcements/1204-1200-gm2-quadriaxial-stitched-glass-fabric-0%C2%BA45%C2%BA90%C2%BA-45%C2%BA-127-cm-wide.html (accessed on 12 January 2022).
- Ojoc, G.G. A Theoretical and Experimental Study of Ballistic Protection Packages Made of Glass Fibers. Ph.D. Thesis, “Dunarea de Jos” University, Galati, Romania, 2022. [Google Scholar]
- Coremat Xi 3 mm. Available online: https://www.nedform.com/DOC/EN/EN%20-%20Product%20Information%20Coremat%20Xi%203.pdf (accessed on 12 September 2024).
- Lantor 3 mm Xi Coremat (50 mts). Available online: https://grpukltd.com/product/lantor-3mm-xi-coremat-50mts/ (accessed on 3 December 2024).
- Composites. Datasheet Coremat® Xi. Available online: https://grpukltd.com/wp-content/uploads/2016/10/Xi.pdf (accessed on 3 December 2024).
- Materiale Ranforsare. Available online: https://www.rompolimer.ro/produse/materiale-ranforsare/ (accessed on 3 September 2024).
- Ultimare Glassfiber and Resin Guidebook. Available online: https://fiberglasswarehouse.com/blogs/news/ultimate-fiberglass-and-resin-guidebook-for-beginners (accessed on 3 September 2024).
- Guide to Composites. Available online: https://www.gurit.com/wp-content/uploads/2022/12/guide-to-composites-1.pdf (accessed on 3 December 2024).
- ASTM D790-17; Standard Test Methods for Flexural Properties of Unreinforced and Reinforced Plastics and Electrical Insulating Materials. ASTM International: West Conshohocken, PA, USA, 2017.
- ASTM C297-94; Standard Test Method for Flatwise Tensile Strength of Sandwich Constructions. ASTM International: West Conshohocken, PA, USA, 1999.
- ISO 844:2021; Rigid Cellular Plastics—Determination of Compression Properties. ISO: Geneva, Switzerland, 2021.
- ASTM C273-61; Standard Test Method For Shear Properties in Flatwise Plane of Flat Sandwich Constructions or Sandwich Cores. ASTM International: West Conshohocken, PA, USA, 1988.
- Jubsilp, C.; Mora, P.; Bielawski, C.W.; Lu, Z.; Rimdusit, S. Thermosetting matrix based glass and carbon fiber composites. In Fiber Reinforced Composites, Compatibility, Perspectives, and Applications; Joseph, K., Oksman, K., George, G., Wilson, R., Appukuttan, S., Eds.; Woodhead Publishing: Cambridge, UK, 2021; pp. 341–403, Chapter 13. [Google Scholar] [CrossRef]
- Enydyne H 68372 TA Răşină Poliesterică Nesaturată. Available online: https://www.rompolimer.ro/fise_tehnice/_TDS_ENYDYNE_H_68372_TA.RO.pdf (accessed on 5 April 2024).
- Resins Fire Retardant. Available online: https://www.polynt.com/wp-content/uploads/2020/09/Brochure-Polynt-Reichhold-Composites-Fire-Retardant.pdf (accessed on 22 January 2025).
- Gama Completa de Rasini. Available online: https://www.rompolimer.ro/produse/rasini/ (accessed on 5 April 2024).
- TDS METOX-50W.EN. Available online: https://www.grs.ie/wp-content/uploads/2021/02/metox-50we-tds.pdf (accessed on 5 April 2024).
- ISO 527-1:2019; Plastics—Determination of Tensile Properties Part 1: General Principles. ISO: Geneva, Switzerland, 2019.
- ISO 178:2019; Plastics—Determination of Flexural Properties. ISO: Geneva, Switzerland, 2019.
- ISO 75-2; Plastics—Determination of Temperature of Deflection Under Load Part 2: Plastics and Ebonite. ISO: Geneva, Switzerland, 2013.
- SikaBiresin® CR82 (Formerly Biresin® CR82). Available online: https://industry.sika.com/en/home/advanced-resins/sports-and-leisure/composite-resin-systems/composite-systemsforwetlay-up/sikabiresin-cr82.html (accessed on 5 April 2024).
- Advanced Composites Solutions. High Performance Epoxy and Polyurethane Systems. Available online: https://automotive.sika.com/dam/dms/global-industry/m/advanced-compositessolutions.pdf (accessed on 4 October 2024).
- ISO 604:2002; Plastics—Determination of Compressive Properties. ISO: Geneva, Switzerland, 2022.
- ISO 1183-1:2019; Plastics—Methods for Determining the Density of Non-Cellular Plastics Part 1: Immersion Method, Liquid Pycnometer Method and Titration Method. ISO: Geneva, Switzerland, 2019.
- ISO 868:2003; Plastics and Ebonite—Determination of Indentation Hardness by Means of a Durometer (Shore Hardness). ISO: Geneva, Switzerland, 2003.
- ISO 179-2:2020; Plastics—Determination of Charpy Impact Properties Part 2: Instrumented Impact Test. ISO: Geneva, Switzerland, 2020.
- ISO 11357-1:2023; Plastics—Differential Scanning Calorimetry (DSC)—Part 1: General Principles. ISO: Geneva, Switzerland, 2023.
- ISO 75-1:2020; Plastics—Determination of Temperature of Deflection Under Load Part 1: General Test Method. ISO: Geneva, Switzerland, 2020.
- Hoa, S.V. Principles of the Manufacturing of Composite Materials, 2nd ed.; Destech Publications Inc.: Lancaster, PA, USA, 2017; pp. 3–5. [Google Scholar]
- Demulanti/Agenti de Lustruire. Available online: https://www.rompolimer.ro/produse/demulanti-agenti-lustruire/ (accessed on 4 October 2024).
- 86. CEAST 9300 Series. Droptower Impact Systems, WB1268C, 2009, Illinois Tool Works Inc., USA. Available online: https://www.instron.com/-/media/literature-library/products/2010/02/ceast-9300-series.pdf (accessed on 4 October 2024).
- Sutherland, L.S.; Shenoi, R.A.; Lewis, S.M. Size and scale effects in composites: II. Unidirectional laminates. Compos. Sci. Technol. 1999, 59, 221–233. [Google Scholar] [CrossRef]
- Sutherland, L.S.; Guedes Soares, C. Scaling of impact on low fibre-volume glass–polyester laminates. Compos. A Appl. Sci. Manuf. 2007, 38, 307–317. [Google Scholar] [CrossRef]
- Maloy Smith, G. Impact Testing Explained: Methods, Applications, and Benefits. 2024. Available online: https://dewesoft.com/blog/impact-testing-explained (accessed on 28 December 2024).
- ISO 6603-2:2023; Plastics—Determination of Puncture Impact Behaviour of Rigid Plastics—Part 2: Instrumented Impact Testing. ISO: Geneva, Switzerland, 2023.
- Data Acquisition and Analysis. Available online: https://www.instron.com/-/media/literature-library/products/2013/09/ceast-data-acquisition-and-analysis.pdf (accessed on 22 January 2025).
- Asmare, S.; Yoseph, B.; Jamir, T.M. Investigating the impact resistance of E-glass/Polyester composite materials in variable fiber-to-matrix weight ratio composition. Cogent Eng. 2023, 10, 2178110. [Google Scholar] [CrossRef]
- Gong, J.; Saeed, N.; Huang, X.; Tian, W.; Li, L.; Song, J. Influences of Fiber Volume Content on the Mechanical Properties of 2D Plain Carbon-Fiber Woven Composite Materials. Polymers 2024, 16, 108. [Google Scholar] [CrossRef] [PubMed]
- Larco, C.; Pahonie, R.; Edu, I. The Effects of Fibre Volume Fraction on a Glass-Epoxy Composite Material. INCAS Bull. 2015, 7, 113–119. [Google Scholar] [CrossRef]
- Gibson, R. Principles of Composite Material Mechanics, 2nd ed.; CRC Press: Boca Raton, FL, USA, 2007. [Google Scholar]
- Mortensen, U.A.; Rasmussen, S.; Mikkelsen, L.P.; Fraisse, A.; Andersen, T.L. The impact of the fiber volume fraction on the fatigue performance of glass fiber composites. Compos. A Appl. Sci. Manuf. 2023, 169, 107493. [Google Scholar] [CrossRef]
- Qiao, Y.; Ko, S.; Ramos, J.L.; Nickerson, E.K.; Denny, A.C.; Schuler, G.M.; Brown, N.L.; Guzman, A.; Moriel, C.E.; Pallaka, M.R.; et al. Effects of processing temperature, pressure, and fiber volume fraction on mechanical and morphological behaviors of fully-recyclable uni-directional thermoplastic polymer-fiber-reinforced polymers. Compos. Part C 2024, 14, 100497. [Google Scholar] [CrossRef]
- Johnson, A.F.; Toso-Pentecôte, N. Determination of delamination damage in composites under impact loads. In Delamination Behaviour of Composites; Sridharan, S., Ed.; Woodhead Publishing and Maney Publishing: Cambridge, UK, 2008; pp. 560–617, Chapter 19. [Google Scholar] [CrossRef]
- Ge, X.; Zhang, P.; Zhao, F.; Liu, M.; Liu, J.; Cheng, Y. Experimental and numerical investigations on the dynamic response of woven carbon fiber reinforced thick composite laminates under low-velocity impact. Compos. Struct. 2022, 279, 114792. [Google Scholar] [CrossRef]
- Asaee, Z.; Taheri, F. Enhancement of performance of three-dimensional fiber metal laminates under low velocity impact—A coupled numerical and experimental investigation. J. Sandw. Struct. Mater. 2017, 109963621774038. [Google Scholar] [CrossRef]


| Sublayer | Layer Orientation | Fiber Type [Tex] | Area Density [g/m2] |
|---|---|---|---|
| 1. | 0 °C | 600 | 283 |
| 2. | 45 °C | 300 + 600 | 300 |
| 3. | 90 °C | 600 | 307 |
| 4. | −45 °C | 300 + 600 | 300 |
| Auxilliary yarn | 76 DTex | 10 | |
| Total: 1200 g/m2 (±%3) | |||
| Property | Value | Standard/Test |
|---|---|---|
| Thickness, mm | 3.0 | - |
| Area density (dry), g/m2 | 80 | - |
| Flexural strength, MPa | 11 | ASTM D790 [65] |
| Flexural modulus MPa | 1100 | ASTM D790 [65] |
| Tensile limit between layers, MPa | 4 | ASTM C297 [66] |
| Compression limit (at 10% strain), MPa | 10 | ISO 844 [67] |
| Shear strength, MPa | 5 | ASTM C273-61 [68] |
| Shear modulus, MPa | 35 | ASTM C273-61 [68] |
| Characteristic | Value |
|---|---|
| Density (at 20 °C) | 1.10 g/cm3 |
| Resin content | 57–63% |
| Brookfield viscosity RVT (at 23 °C) | 4–6 dPa.s |
| Working method | R 151 |
| Working temperature | 23 °C |
| Catalytic system | 1.5% PMEC, 50% |
| Tested mass resin | 100 g |
| Maximum temperature at peak reaction | <135 °C |
| Tensile strength (ISO 527) [74] | 45 MPa |
| Strain at break | 1.5% |
| Flexural strength (ISO 178 [75]) | 65 MPa |
| Flexural modulus | 3300 MPa |
| Heat deflection temperature (HDT ISO 75-2 A [76]) | 70 °C |
| Hardener | Gel Time [min] | Peak Temperature [°C] | Time to Peak Temperature [min] |
|---|---|---|---|
| Metox-50 W | 27–28 | 145.0–149.4 | 46–48 |
| Characteristic | Value |
|---|---|
| Active oxygen, % | 8.5–8.9 |
| Density, g/cm3 | 1.170–1.176 |
| Peroxides, % | 30–35 |
| Self-accelerating decomposition temperature (SADT), °C | 60 |
| Gel time, min | 28–29 |
| Storage temperature, °C | 0–25 |
| Time till maximum temperature, min | 40–42 |
| Water content, approx., % | approx. 2.0 |
| Characteristic | Measurement Unit | Resin SikaBiresin® CR82 | Hardener Biresin® CH80-2 |
|---|---|---|---|
| Mixing ratio | massic | 100 | 27 |
| Viscosity, at 25 °C | mPa.s | ~1600 | |
| Density, 25 °C | g/mL | 1.11 | 0.99 |
| Potlife, 100 g/RT, approx. min | 80 | ||
| Viscosity of the mix, mPa.s 25 °C (approx.) | 600 | ||
| Property | Method | Value |
|---|---|---|
| Tensile strength, MPa | ISO 527 [74] | 90 |
| Young modulus, MPa | ISO 527 [74] | 3000 |
| Strain at break, % | ISO 527 [74] | 5.6 |
| Flexural strength, MPa | ISO 178 [75] | 130 |
| Flexural modulus, MPa | ISO 178 [75] | 3200 |
| Compression strength, MPa | ISO 604 [79] | 105 |
| Density, g/cm3 | ISO 1183 [80] | 1.14 |
| Shore hardness, D | ISO 868 [81] | 85 |
| Impact resistance, kJ/m2 | ISO 179-2 [82] | 66 |
| Glass transition temperature by DSC, °C | ISO 11357-1 [83] | 89 |
| Heat deflection temperature, °C | ISO 75-1 [84] | 83 |
| EN [J] | himpact [m] | mimpactor [kg] | Ecalculated [J] | EN − Ecalculated [J] | ΔE(%) [%] | hsample max [mm] | ΔE(hsample) [J] | ΔE%(hsample) [%] |
|---|---|---|---|---|---|---|---|---|
| 50 | 0.966 | 5.277 | 49.990 | 0.010 | 0.019 | 12.049 | 0.624 | 1.25 |
| 100 | 0.992 | 10.277 | 99.977 | 0.023 | 0.023 | 11.901 | 1.199 | 1.20 |
| 150 | 1.001 | 15.277 | 149.966 | 0.034 | 0.022 | 11.234 | 1.683 | 1.12 |
| 200 | 1.006 | 20.277 | 200.043 | −0.043 | −0.021 | 11.563 | 2.299 | 1.15 |
| Plate | Fabric Mass, mf (g) | Composite Plate Mass (g) | Resin Mass * (g) | Mass Fiber Ratio (mf/mcomposite) | Surface Density (mcomposite/Acomposite) (kg/m2) | Vf/Vcomposite | h1 (mm) | h2 (mm) | h3 (mm) | h4 (mm) | haverage (mm) |
|---|---|---|---|---|---|---|---|---|---|---|---|
| 0 | 1 | 2 | 3 | 4 | 5 | 6 | 7 | 8 | 9 | 10 | 11 |
| Q-c-08 | 839.5 | 1417.5 | 578 | 0.592 | 15.75 | 0.409 | 8.75 | 9.1 | 8.9 | 9.2 | 8.988 |
| Q-c-09 | 861 | 1347 | 486 | 0.639 | 14.967 | 0.467 | 8.2 | 7.95 | 7.8 | 8.3 | 8.063 |
| Q-c-12 | 834.5 | 1372.5 | 538 | 0.608 | 15.25 | 0.426 | 8.65 | 8.4 | 8.7 | 8.55 | 8.575 |
| Average Q-c | 845 | 1379 | 534 | 0.613 | 15.322 | 0.434 | 8.5 | 8.5 | 8.5 | 8.7 | 8.542 |
| Q-g-11 | 855.00 | 1254.5 | 399.5 | 0.682 | 13.939 | 0.447 | 8.4 | 8.45 | 8.35 | 8.25 | 8.363 |
| Q-g-12 | 844.50 | 1351.5 | 507 | 0.625 | 15.017 | 0.428 | 8.65 | 8.7 | 8.6 | 8.55 | 8.625 |
| Q-g-14 | 846.50 | 1300 | 453.5 | 0.651 | 14.444 | 0.429 | 8.6 | 8.55 | 8.65 | 8.75 | 8.638 |
| Average Q-g | 848.67 | 1302.00 | 453.33 | 0.65 | 14.47 | 0.435 | 8.55 | 8.57 | 8.53 | 8.52 | 8.54 |
| QM-c-02 | 843.00 | 1555 | 704.00 | 0.547 | 17.278 | 0.321 | 11.65 | 11.2 | 11.4 | 11.7 | 11.488 |
| QM-c-05 | 848.00 | 1534 | 678.00 | 0.558 | 17.044 | 0.336 | 10.9 | 11.1 | 10.75 | 11.45 | 11.05 |
| QM-c-06 | 844.00 | 1543 | 691.00 | 0.552 | 17.144 | 0.329 | 10.9 | 11.45 | 11.25 | 11.25 | 11.213 |
| Average QM-c | 845.00 | 1544.00 | 691.00 | 0.55 | 17.16 | 0.329 | 11.15 | 11.25 | 11.13 | 11.47 | 11.25 |
| QM-g-02 | 831.00 | 1361 | 521.50 | 0.617 | 15.122 | 0.331 | 11.25 | 11.55 | 10.35 | 10.8 | 10.988 |
| QM-g-05 | 858.00 | 1362.5 | 497.50 | 0.635 | 15.139 | 0.342 | 11.2 | 10.7 | 11.25 | 10.75 | 10.975 |
| QM-g-06 | 860.00 | 1353 | 485.00 | 0.642 | 15.033 | 0.340 | 11.2 | 11.1 | 10.9 | 11.1 | 11.075 |
| Average QM-g | 849.67 | 1358.83 | 501.33 | 0.631 | 15.10 | 0.338 | 11.22 | 11.12 | 10.83 | 10.88 | 11.01 |
| Reference | Composite | Sample Dimensions | Test Machine, Steel Impactor Size, Shape, Mass, Repeated Tests | Impact Energy, Velocity, Temperature |
|---|---|---|---|---|
| 2019 [48] | Glass fibers with different matrix: epoxy, polyester, Elium-acrylic, Elium-acrylic + 10 wt% of Nanostreh tri-block copolymers) and (Elium-acrylic + 10 wt% ABS | 100 mm × 150 mm, 2 mm thickness | Hemispherical striker, diameter 16 mm, and mass of 0.1255 kg, 3 tests | 10–60 J |
| 2019 [53] | Epoxy resin, hardener (LY556, HY5200), E-glass plain woven roving [0/90], 0.25 mm thickness, 360 g/m2 | 5 mm, 7 mm, and 10 mm thickness, | Hemispherical steel impactor of 16 mm diameter | 50–150 J, 4.34–7.51 m/s −20 °C, 25 °C, 100 °C |
| 2024 [51] | Unidirectional S2-glass fibre/FM94-epoxy resin prepreg | 4.2 mm thickness, 70 mm square | Impactor with a 20 mm spherical diameter | 75 J, 150 J, 225 J 25–100 °C,−25–55 °C |
| 2024 [49] | 8-Harness Satin S2-Glass Fabrics (302 g/m2, 0.24 mm)–elastomer polyurethane resin | Thickness 2.48–6.39 mm | Hemispherical impactor 16 mm, one test! | 48.8 ± 0.4 J, 86.2 ± 0.4 J, 115.3 ± 0.9 J |
| 2020 [50] | Carbon fibers, glass fibers, hybrid com-posites, resin: epoxy, phenolic, polyesther | 3,3 mm, 4.9 mm, 7.4 mm | Instron Dynatup 9250 G, 25.4 mm hemispherical impactor | 20 J 2.06 m/s |
| 2023 [52] | Quadriaxial glass fiber fabric 2, 4 and 6 layers of fabrics Epoxy resin | 60 mm × 60 mm 1.65–5.35 mm, 3 times | 10 and 20 mm hemispherical impactors | v0 = 2 m/s, 3 m/s, and 4 m/s 11 J, 16 J, 45 J |
| 2017 [101] | Hybrid composite: Magnesium metal sheets, 3D fiberglass fabric, epoxy resin, and polyurethane foam | No information on thickness | Modified Charpy striker | 3 J, 11 J, 25 J, 45 J, 70 J, 100 J |
| 2022 [100] | Woven carbon (T300-3 K) fabrics twilled 2 × 2, 387 g/m2. 60 plies of fabrics, [(0/90)30]S, 0.22 mm. Vinyl ester 430 LV resin | ~13 mm 150 mm × 100 mm | Instron 9350, hemispheric impactor of 16 mm, total weight of impactor 5.5 kg | From 16–283 J 3 times each test |
| 2022 [20] | Filament-wound composite, sequence [90°2/±28°]3, T700 carbon fibers and epoxy resin | 150 mm × 100 mm 2.1 mm | Instron Dynatup 9250 HV, hemispherical impactor of 12.7 mm, mass 6.5 kg. | 5 J, 10 J, 15 J, 20 J 1.24–3.28 m/s |
| 2024 [19] | Yacht bow floor, composites with chop strand and different carbon fibers fabric | Impactor mass of 5.7 kg and diameter of 20 mm | 5 J, 10 J, 15 J, 20 J, 25 J, and 30 J |
Disclaimer/Publisher’s Note: The statements, opinions and data contained in all publications are solely those of the individual author(s) and contributor(s) and not of MDPI and/or the editor(s). MDPI and/or the editor(s) disclaim responsibility for any injury to people or property resulting from any ideas, methods, instructions or products referred to in the content. |
© 2025 by the authors. Licensee MDPI, Basel, Switzerland. This article is an open access article distributed under the terms and conditions of the Creative Commons Attribution (CC BY) license (https://creativecommons.org/licenses/by/4.0/).
Share and Cite
Cristea, G.C.; Deleanu, L.; Chiracu, I.G.; Boțan, M.; Ojoc, G.G.; Vasiliu, A.V.; Cantaragiu Ceoromila, A. Influence of Resin Grade and Mat on Low-Velocity Impact on Composite Applicable in Shipbuilding. Polymers 2025, 17, 355. https://doi.org/10.3390/polym17030355
Cristea GC, Deleanu L, Chiracu IG, Boțan M, Ojoc GG, Vasiliu AV, Cantaragiu Ceoromila A. Influence of Resin Grade and Mat on Low-Velocity Impact on Composite Applicable in Shipbuilding. Polymers. 2025; 17(3):355. https://doi.org/10.3390/polym17030355
Chicago/Turabian StyleCristea, George Cătălin, Lorena Deleanu, Ioana Gabriela Chiracu, Mihail Boțan, George Ghiocel Ojoc, Alexandru Viorel Vasiliu, and Alina Cantaragiu Ceoromila. 2025. "Influence of Resin Grade and Mat on Low-Velocity Impact on Composite Applicable in Shipbuilding" Polymers 17, no. 3: 355. https://doi.org/10.3390/polym17030355
APA StyleCristea, G. C., Deleanu, L., Chiracu, I. G., Boțan, M., Ojoc, G. G., Vasiliu, A. V., & Cantaragiu Ceoromila, A. (2025). Influence of Resin Grade and Mat on Low-Velocity Impact on Composite Applicable in Shipbuilding. Polymers, 17(3), 355. https://doi.org/10.3390/polym17030355