Analysis of the Similarity between Injection Molding Simulation and Experiment
Abstract
1. Introduction
1.1. Simulation of the Injection Molding Process Based on Computational Fluid Dynamics (CFD)
- Laminar flow of a Newtonian fluid;
- Neglect of inertia and gravity effects;
- Filling of the cavity is considered as a 2D problem, assuming symmetry at the midplane;
- Neglect of wall slip;
- In-plane heat conduction is negligible compared to heat conduction in thickness direction;
- Neglect of heat convection in thickness direction;
- Neglect of heat losses at the edges of the triangular elements.
- Flow according to the Navier–Stokes equations;
- Calculation of pressure, temperature and the three velocity components at each node;
- Consideration of heat conduction in each direction;
- Optional: consideration of inertia and/or gravity effects.
1.2. Comparison of Simulation and Experiment
1.3. Objective of the Investigations
2. Materials and Methods
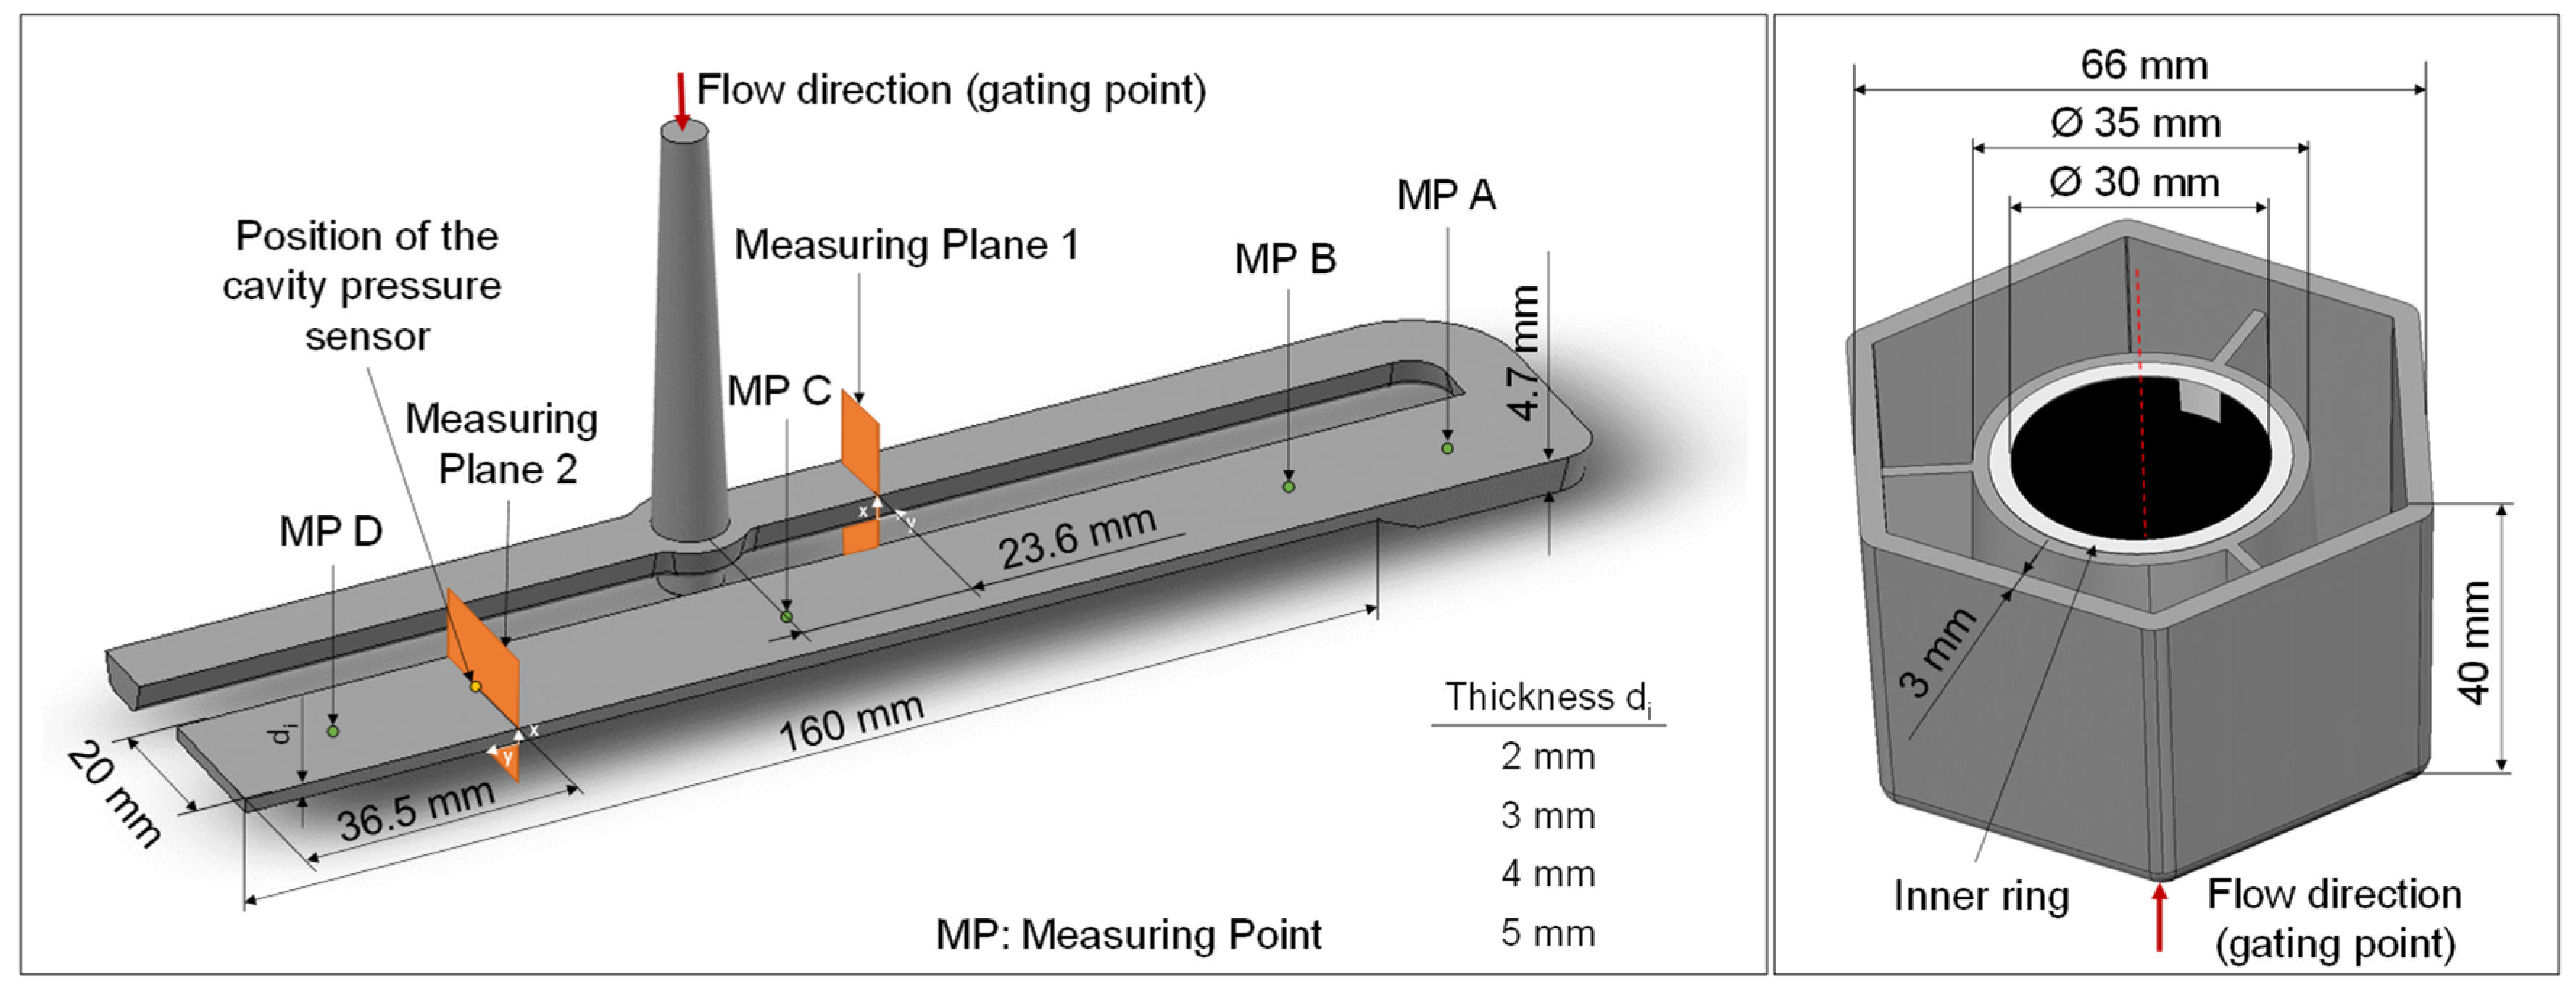
2.1. Description of the Experiments Using the Flat Bar (Use Case 1)
2.2. Description of the Experiments Using the Hexagonal Shaped Part (Use Case 2)
2.3. Acquisition of Part Characteristics and Process Parameters during the Experiments
2.4. Simulation of the Injection Molding Processes
3. Results and Discussion
3.1. Comparison of the Part Masses and Dimensions
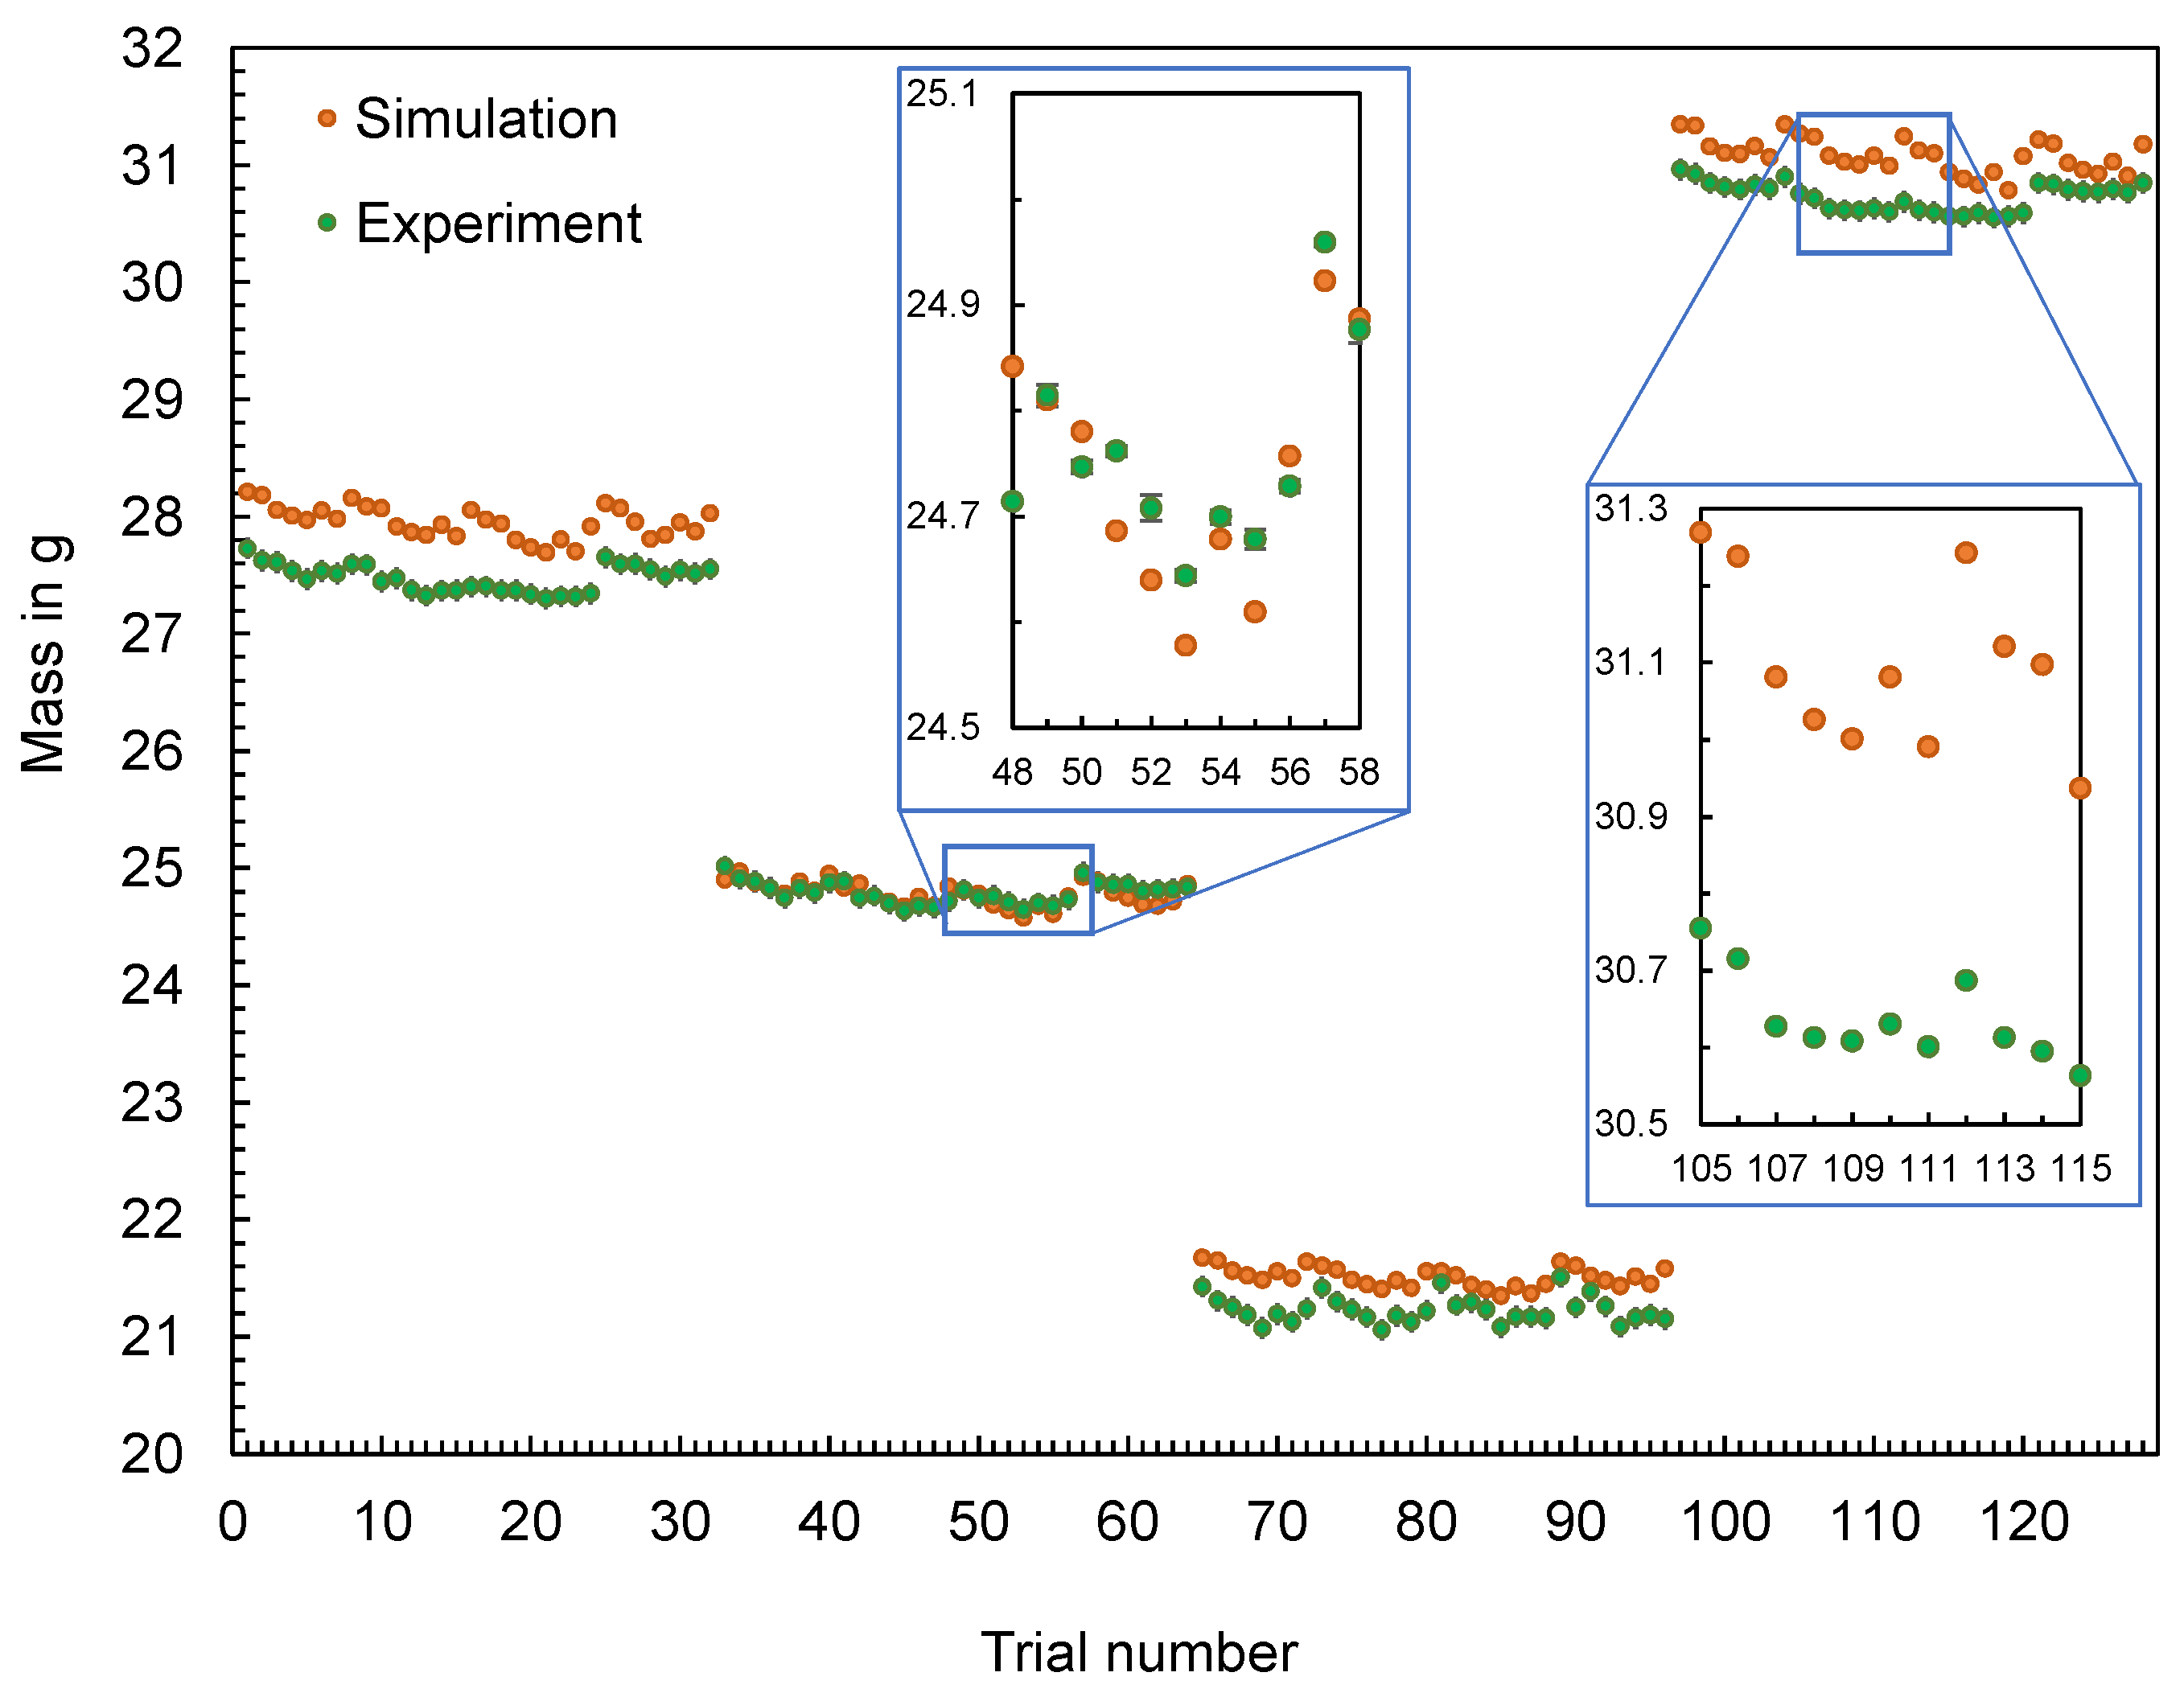
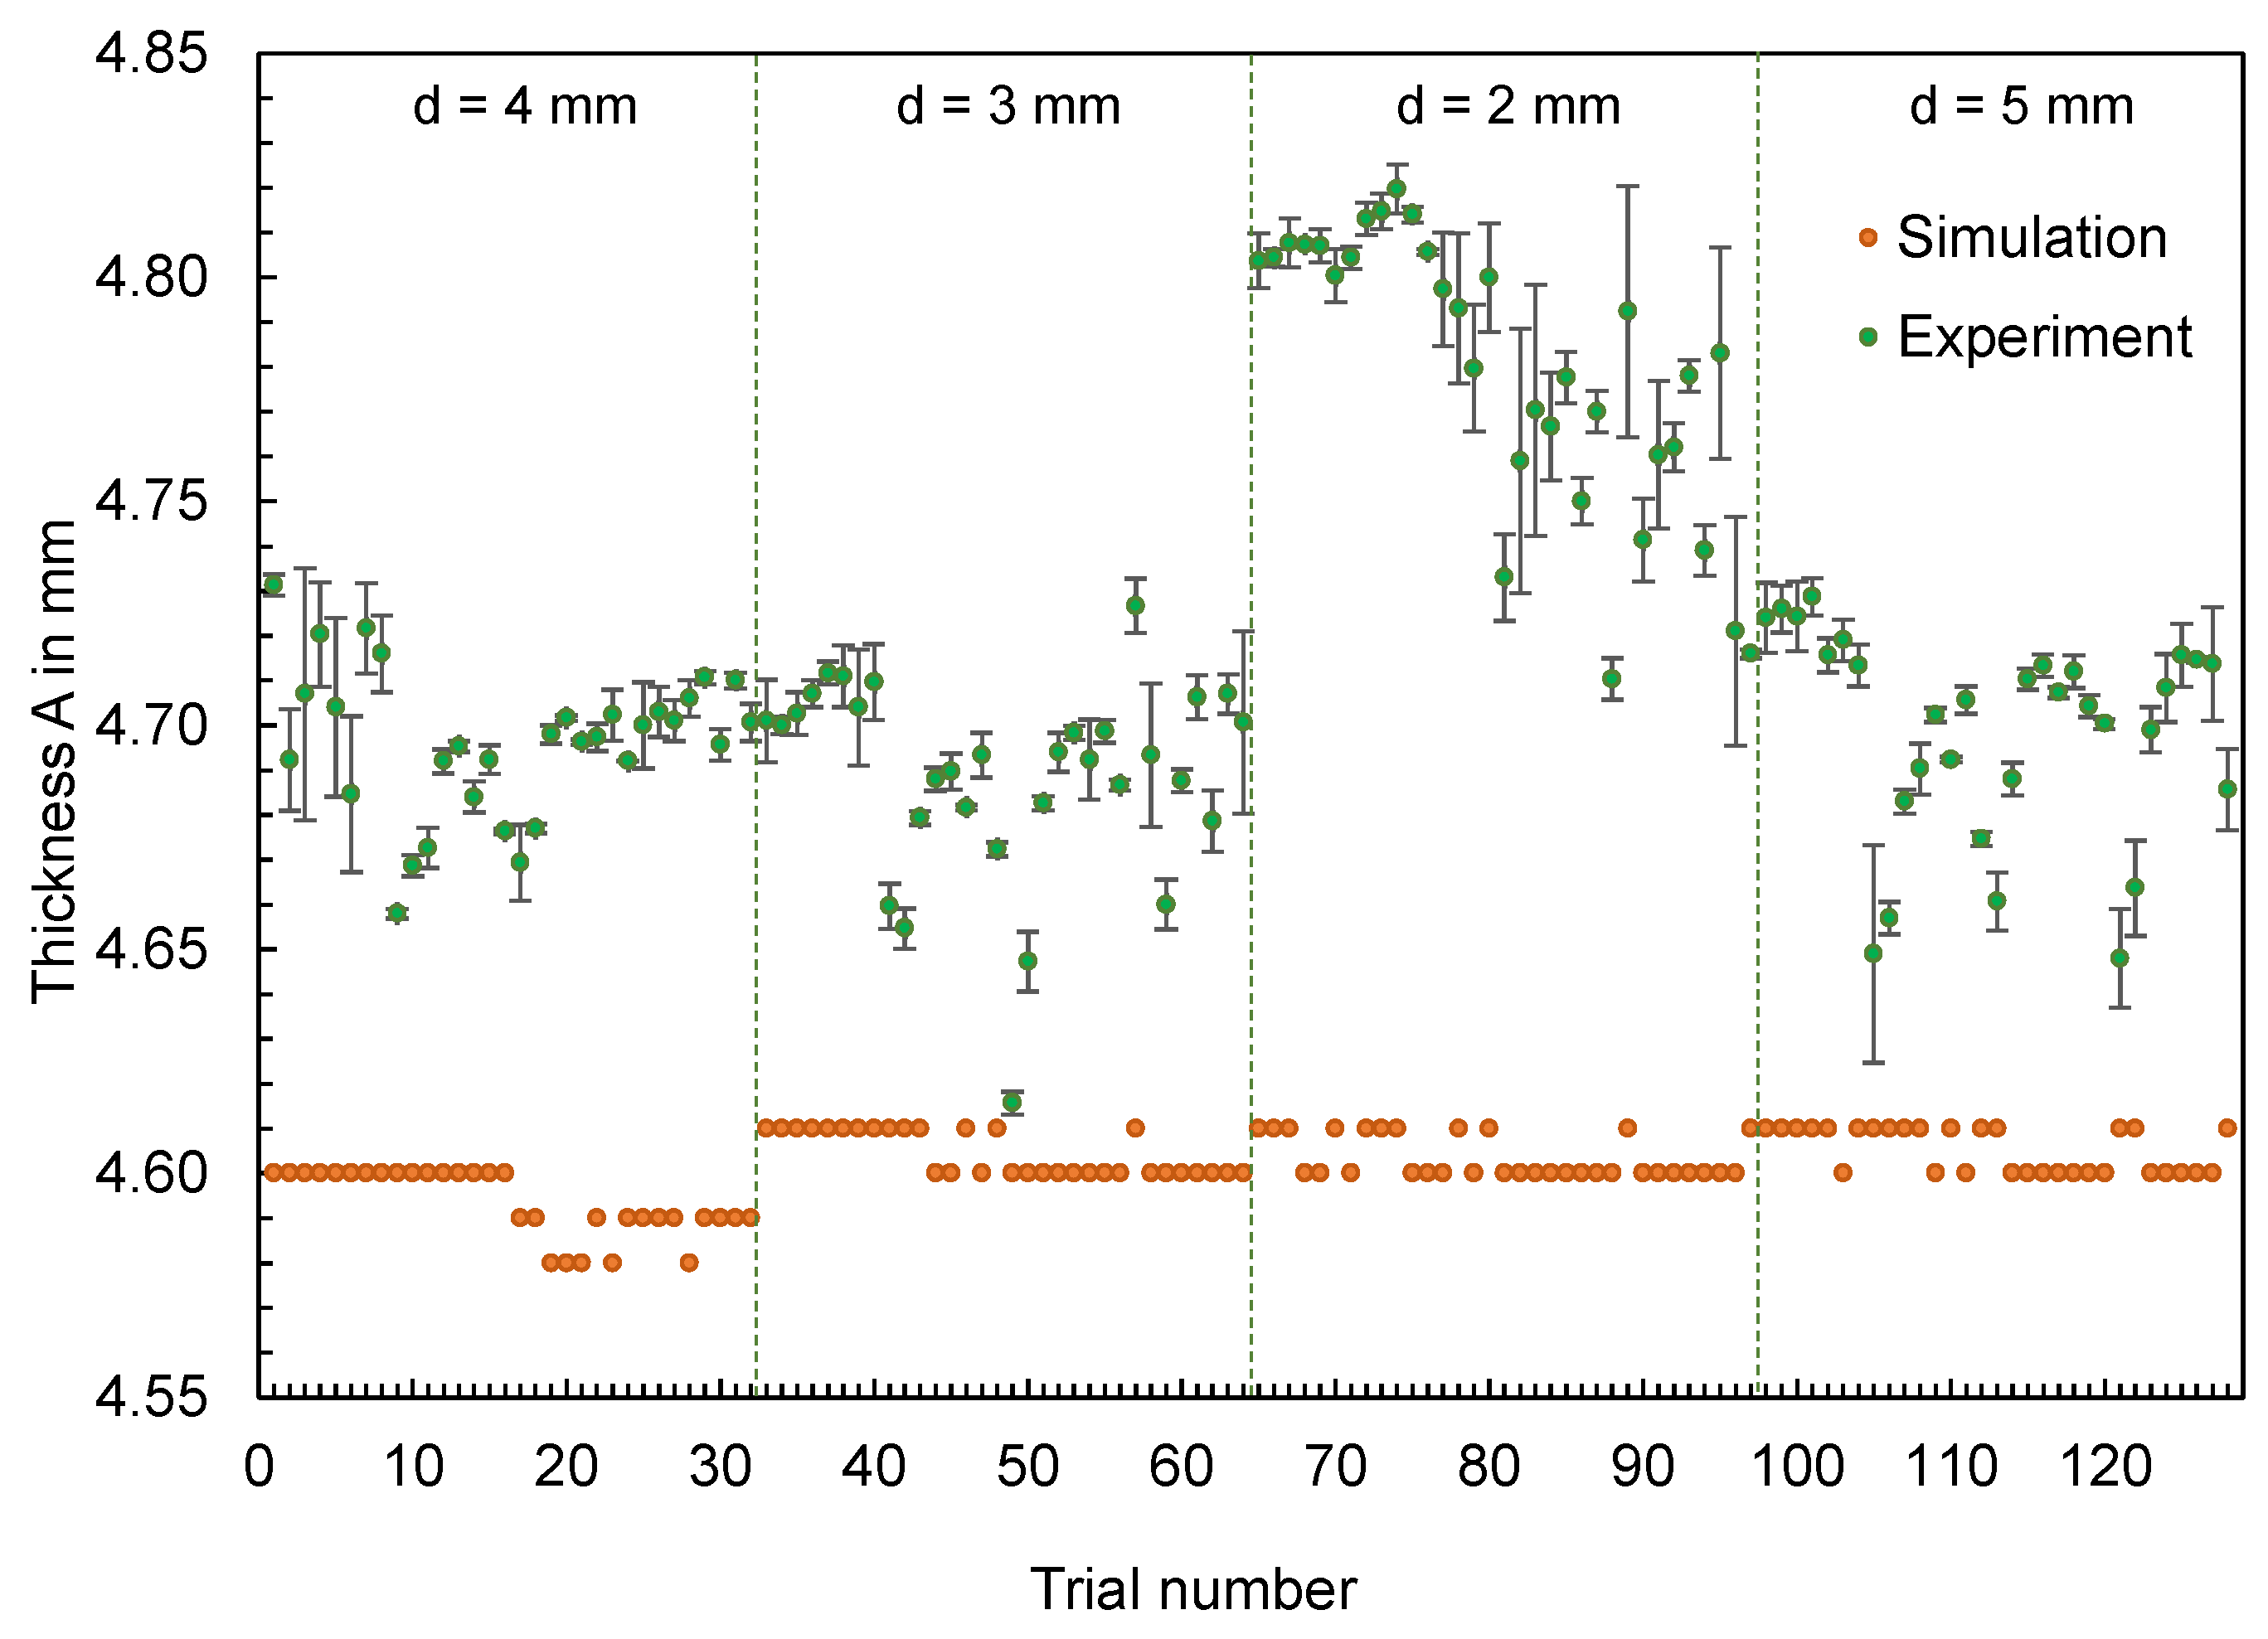
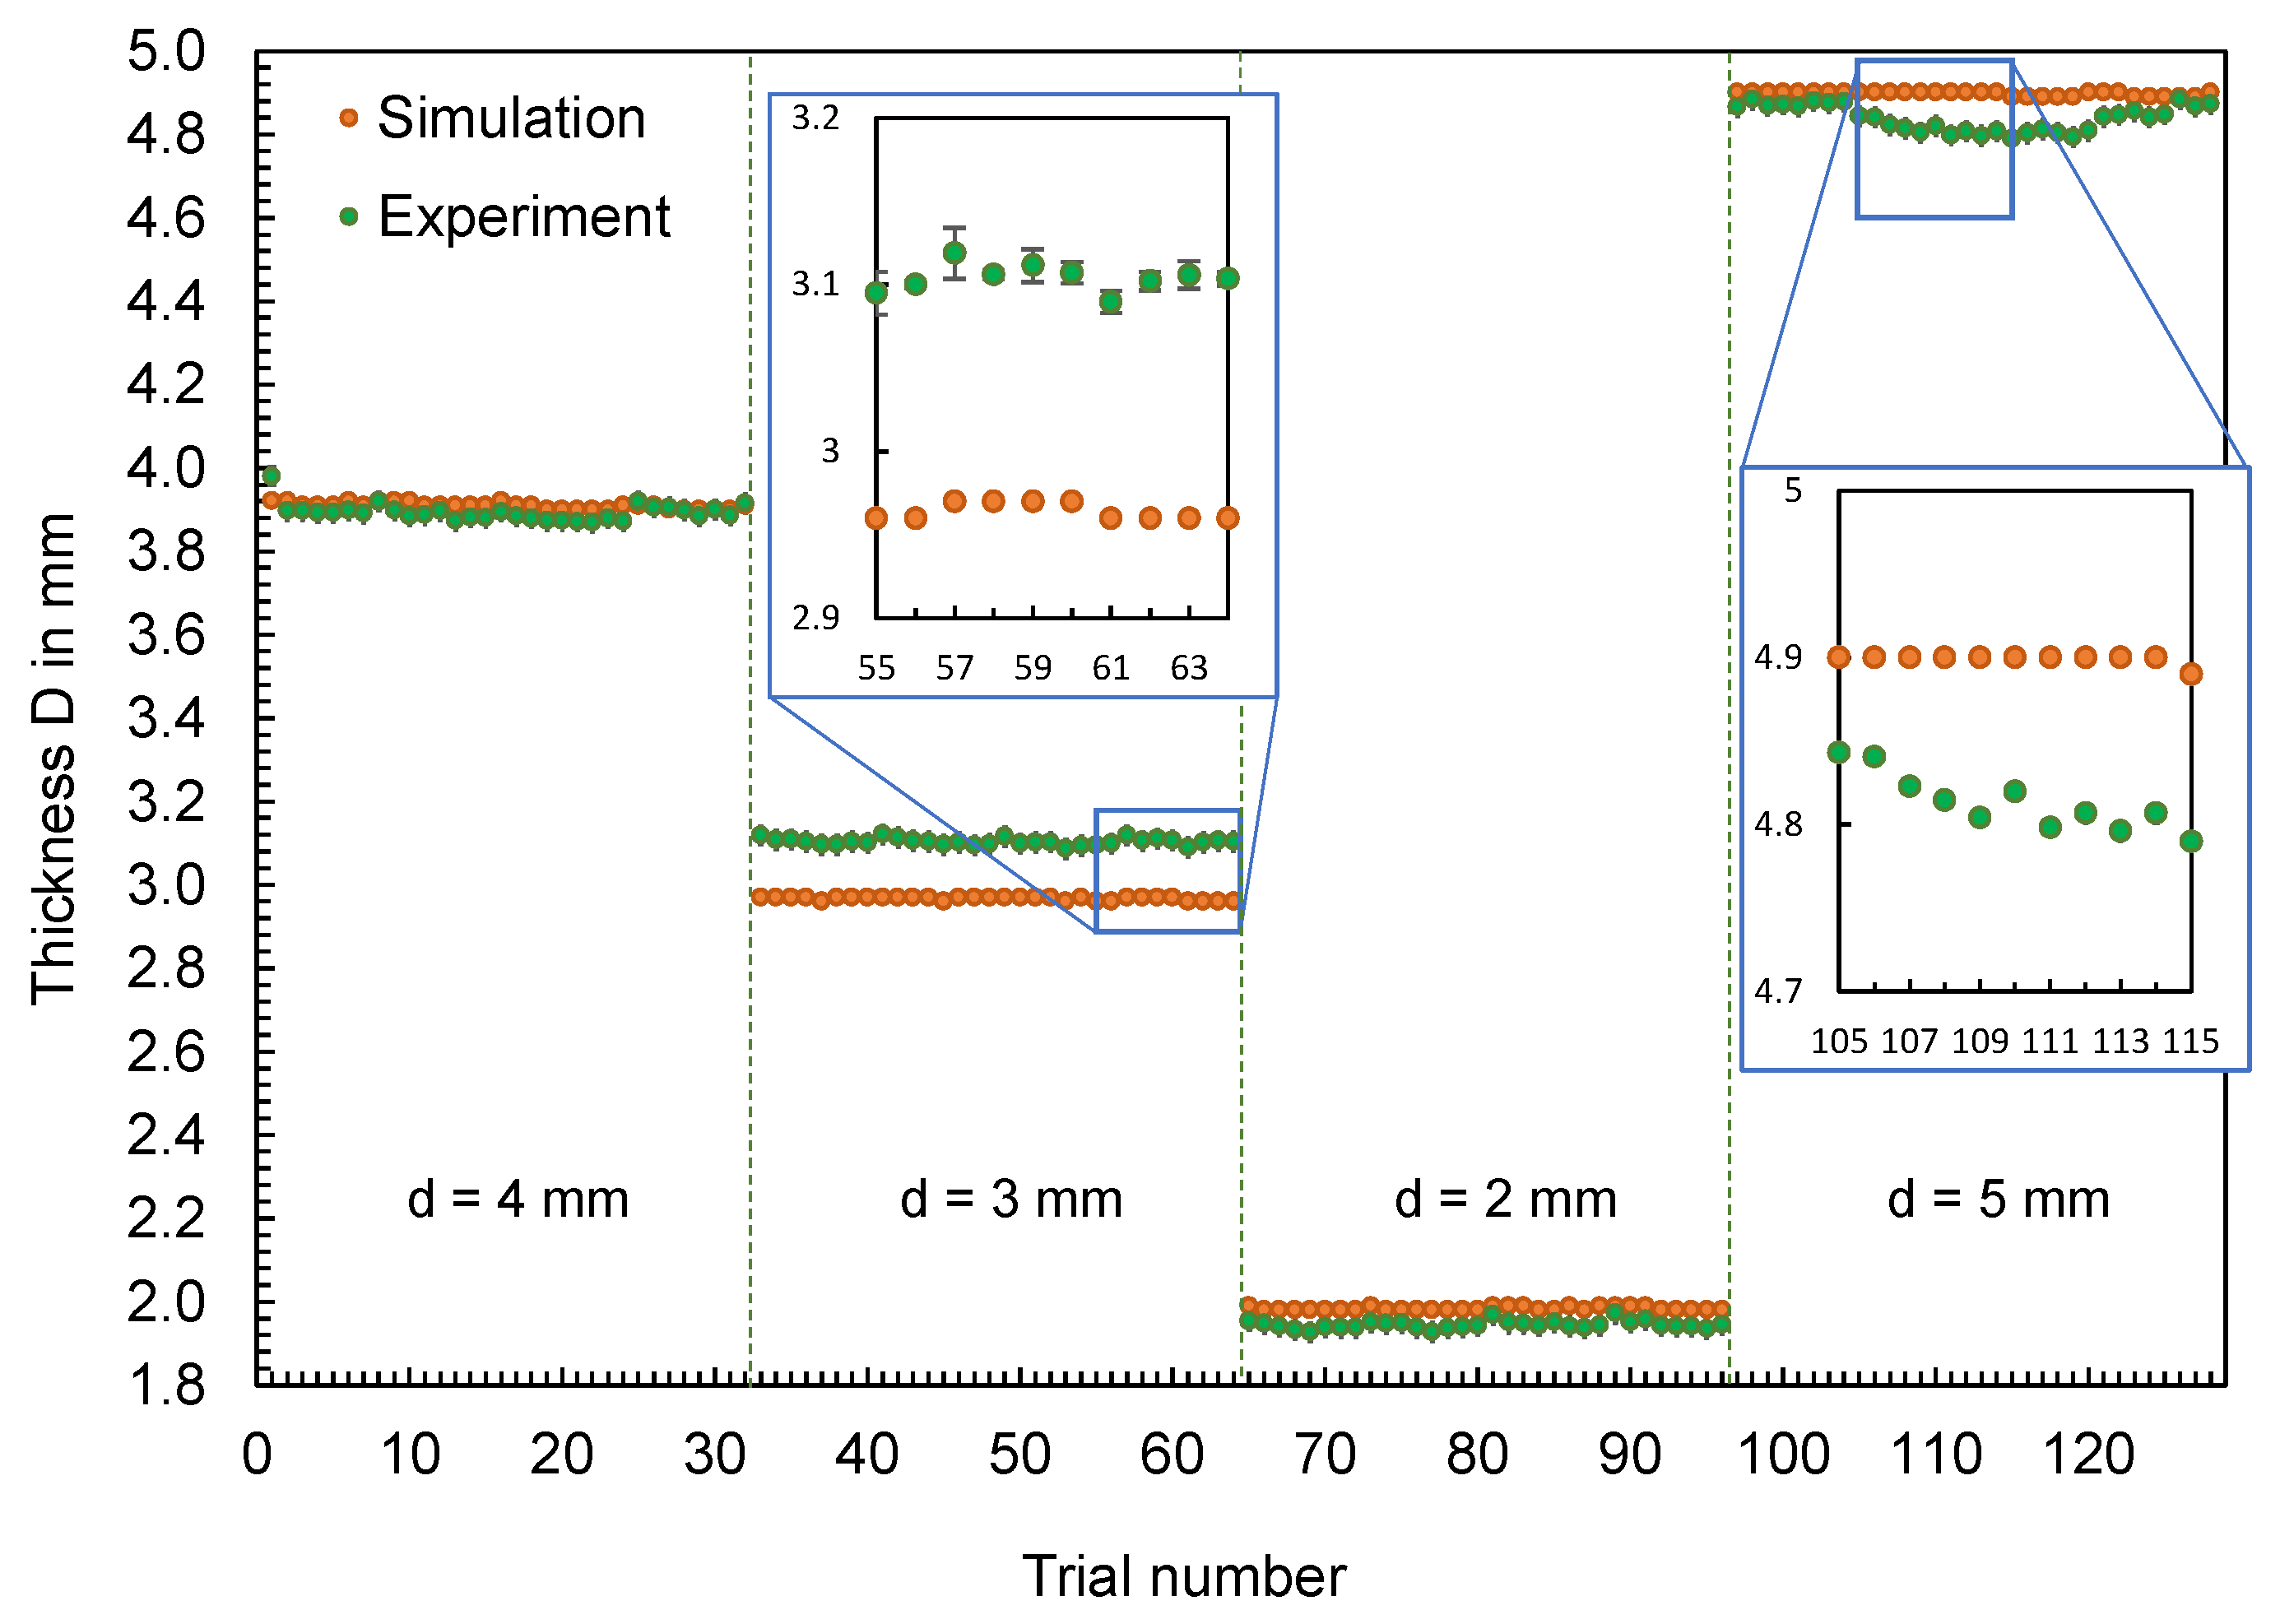
3.1.1. Use Case 1: Flat Bar
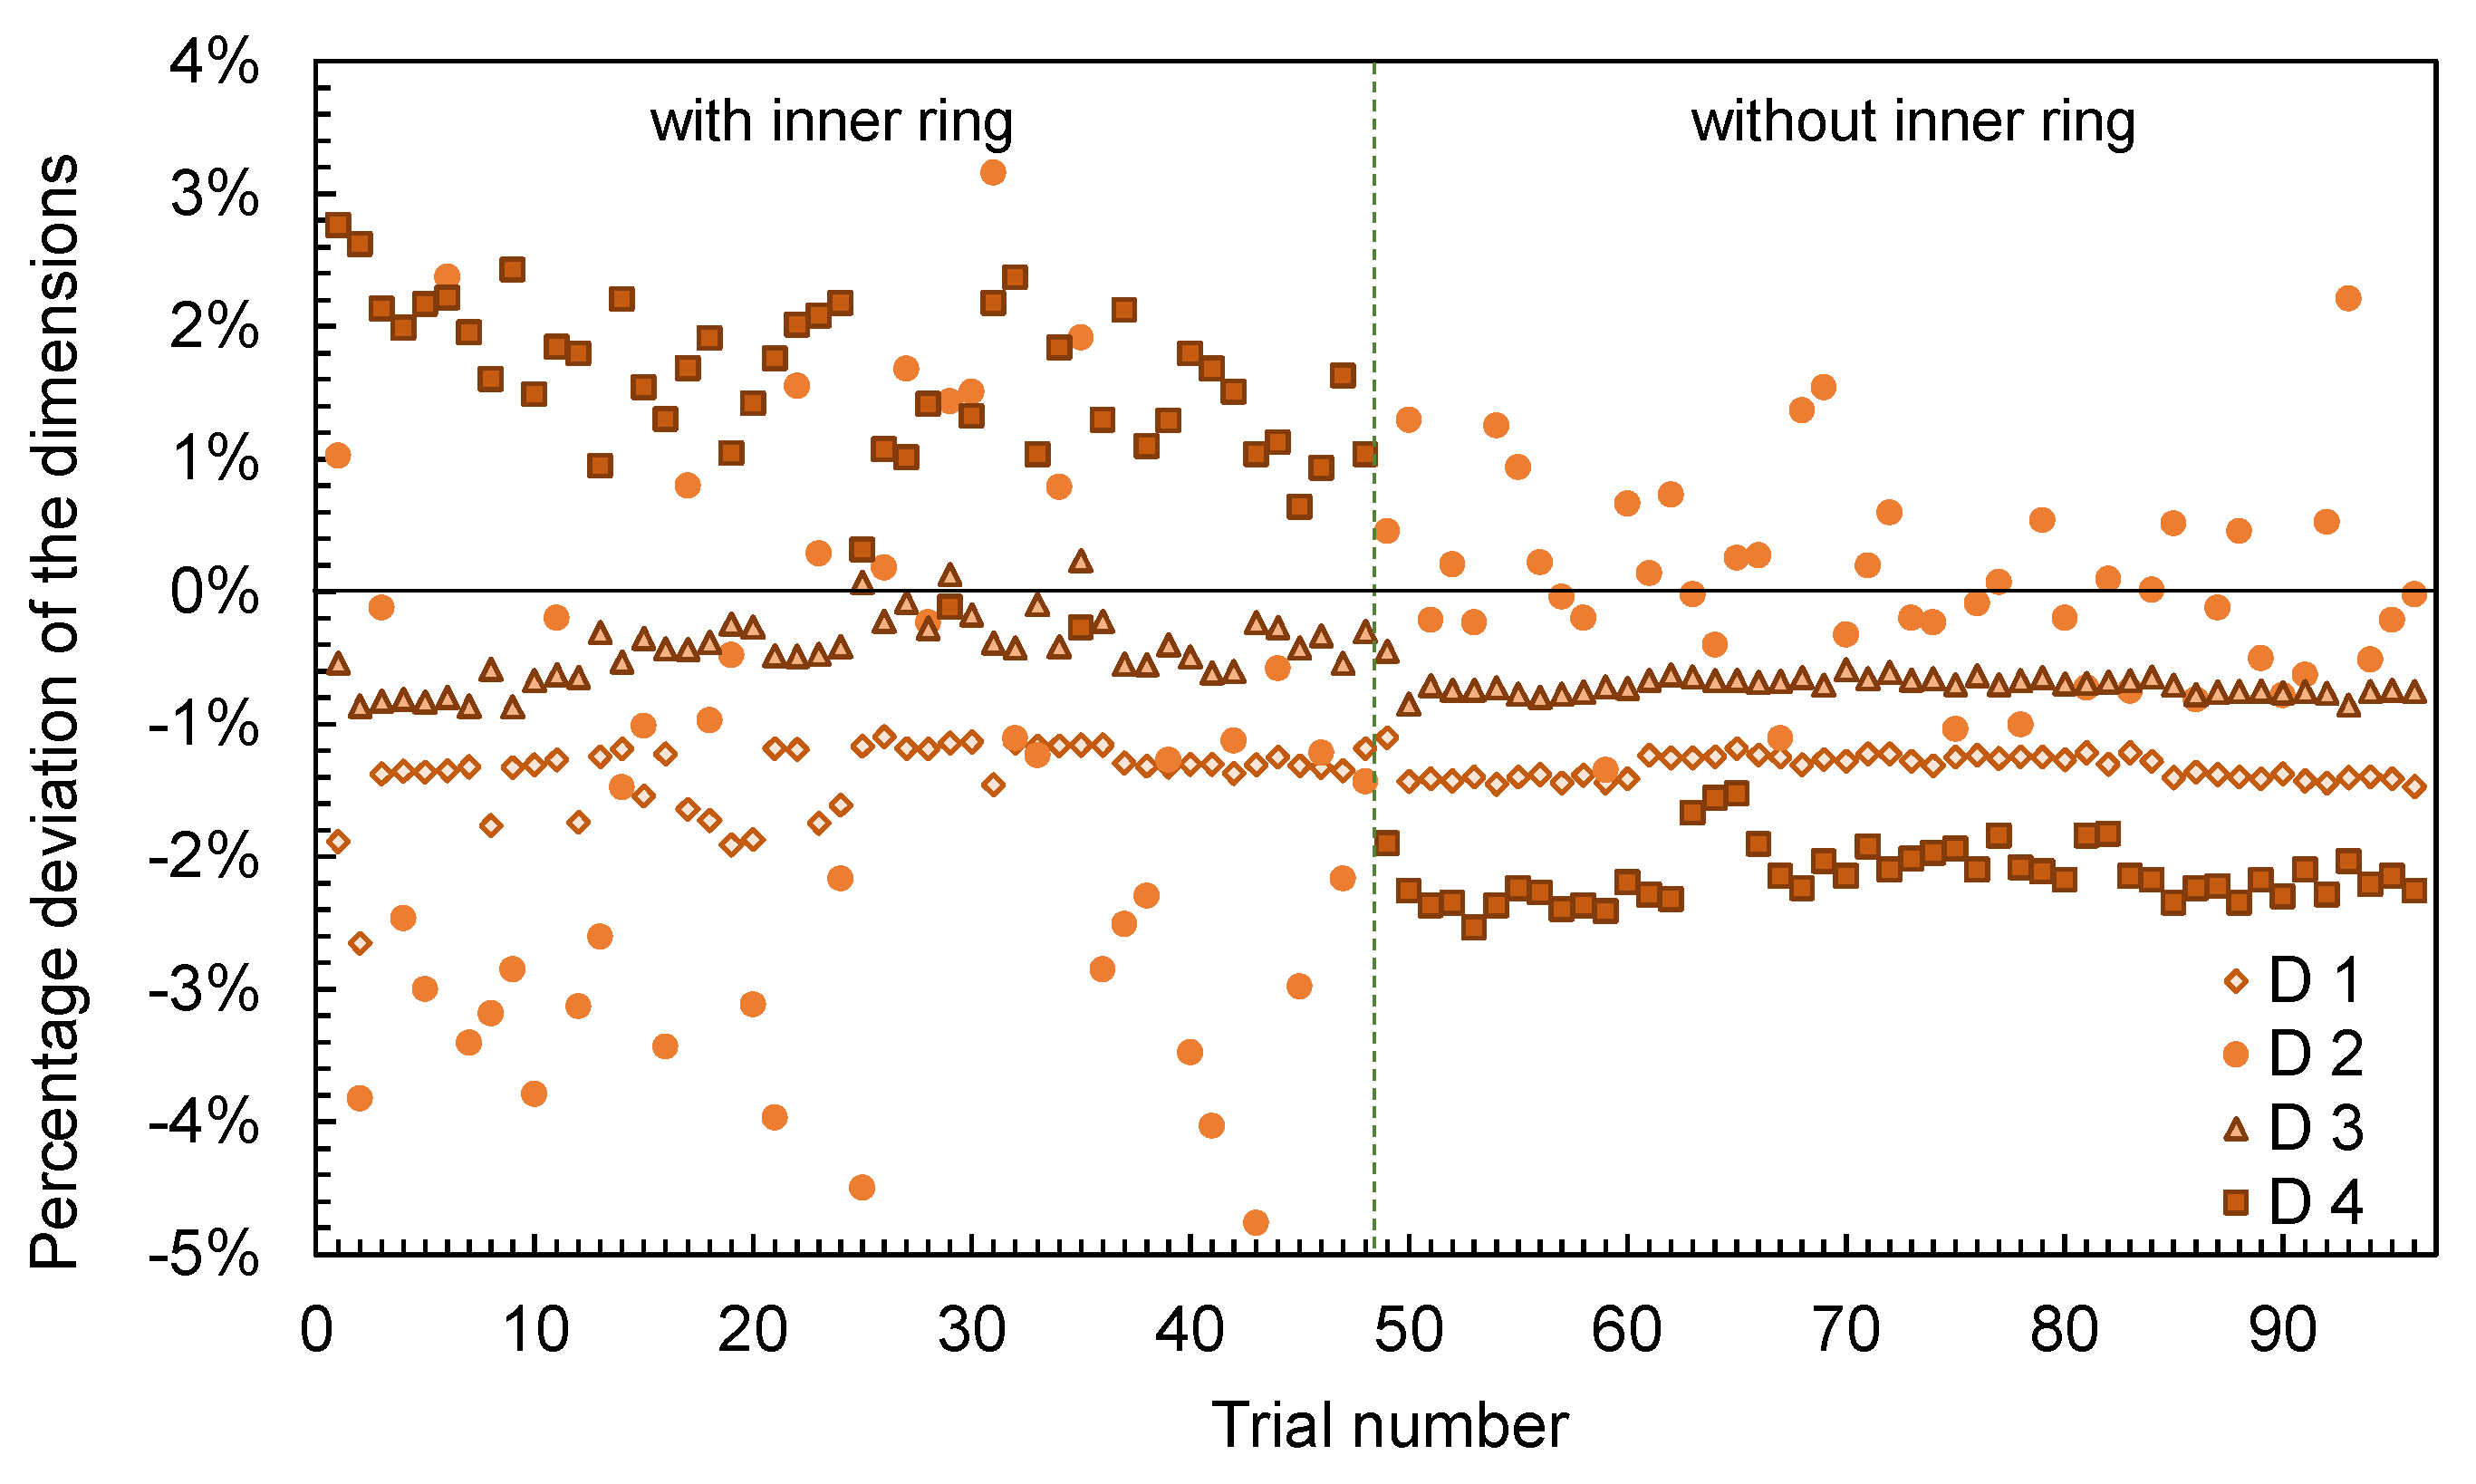
3.1.2. Use Case 2: Hexagonal Shaped Parts
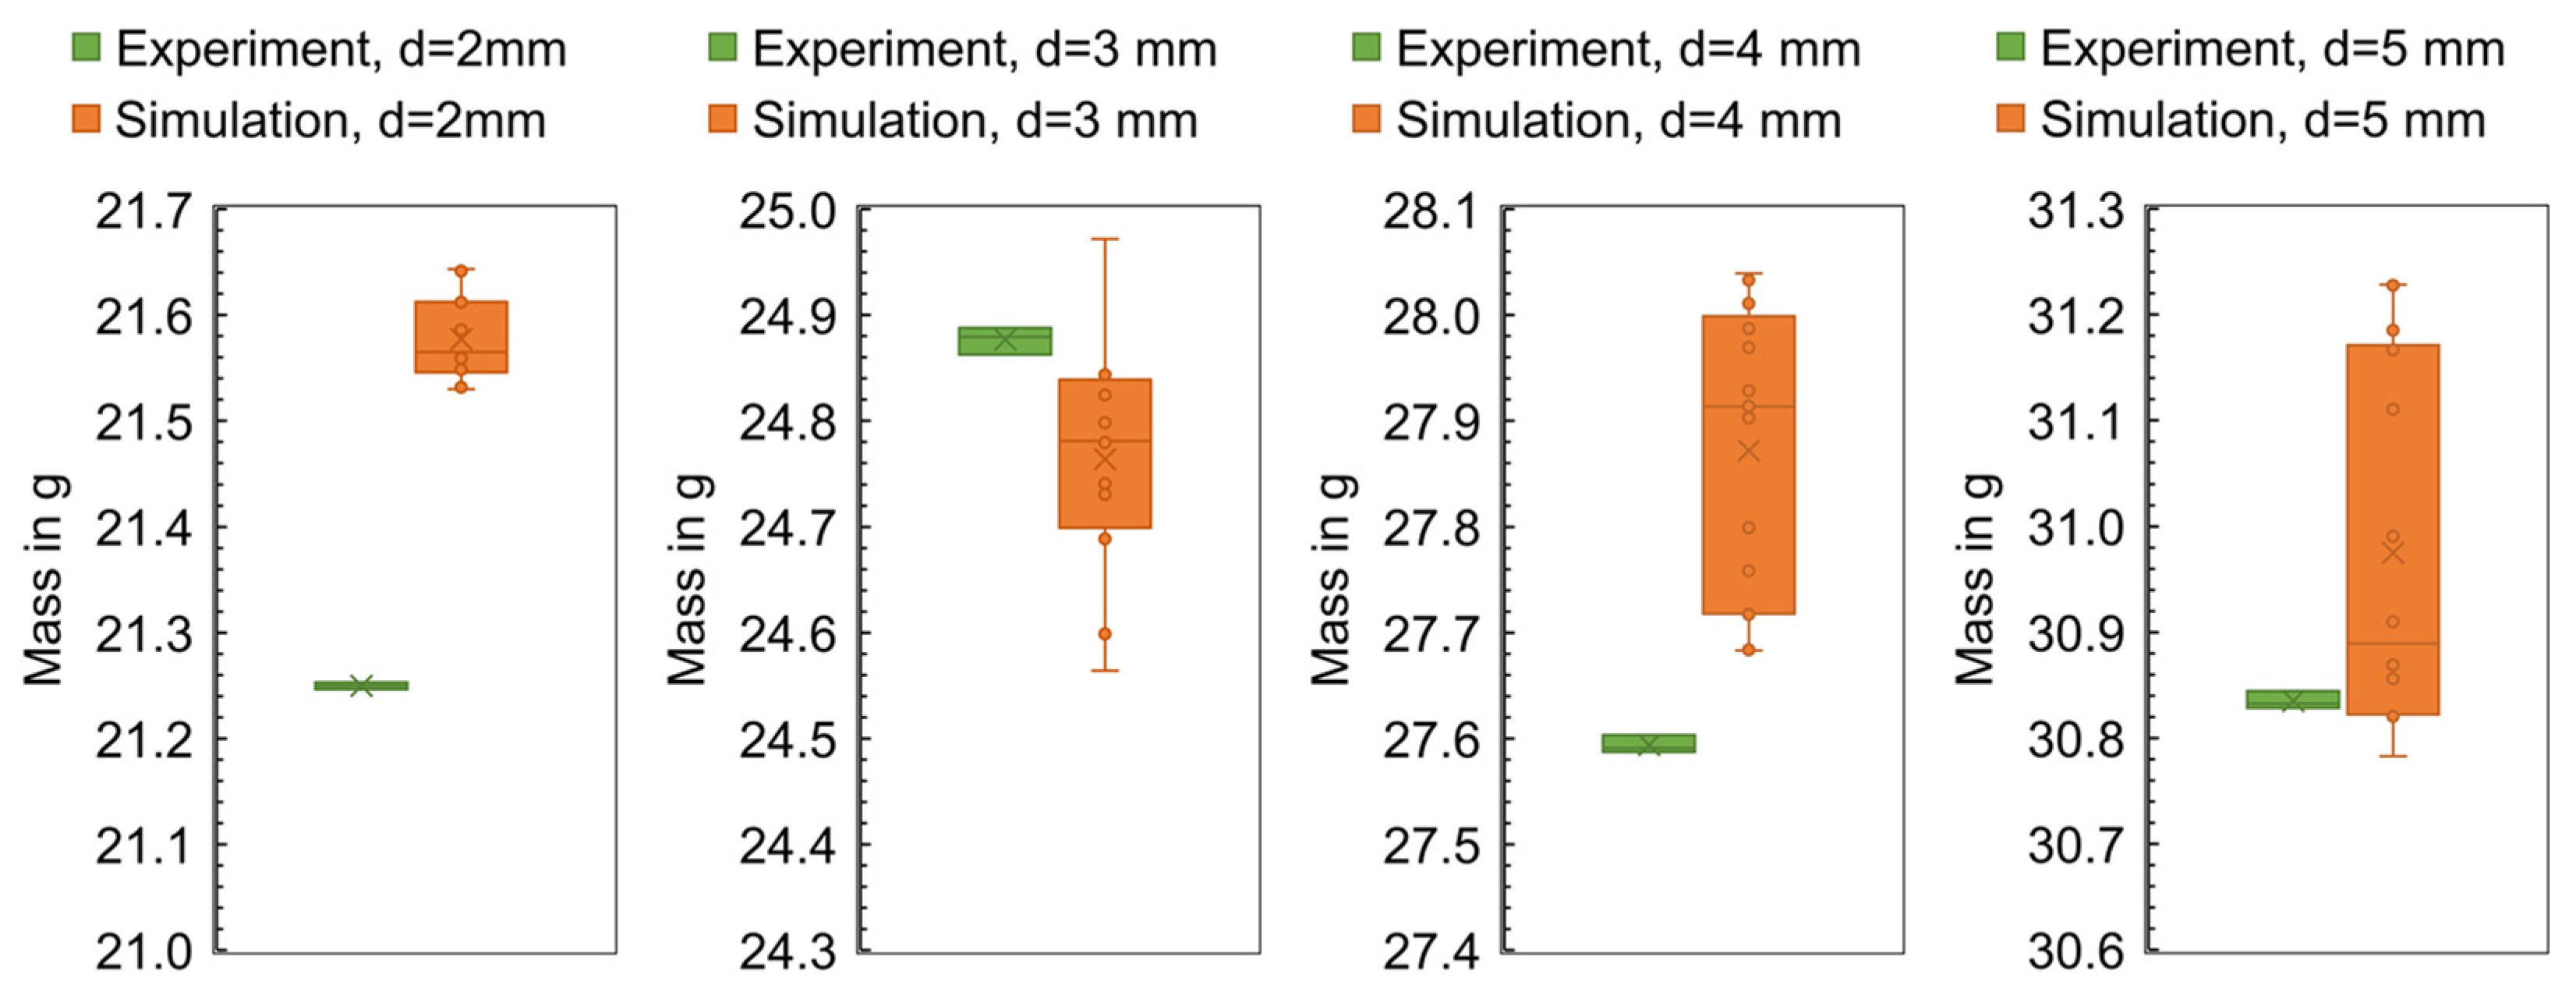
3.1.3. Discussion of the Comparisons of the Calculated and Measured Part Characteristics (Use Case 1 and 2)
- Lack of representation of plasticization and disturbance variables in the simulation: The simulation software is not capable of modeling the plasticization of the material and only maps the process once the melt has entered the hot runner or mold. As already shown in [37], the back pressure and the screw rotational speed can influence the melt properties and consequently the part weight. A neglect of these machine settings in the simulation can therefore be one of the causes that result in a deviation between the calculation results and the experimental data. In addition to plasticizing, disturbance variables and their effects on the process are not simulated. Initial approaches to the integration of disturbance variables in the simulation have already been presented in [38]. The integration of such approaches in commercial simulation programs does not yet exist. In summary, the deviation between simulation and experiment depends on the extent to which the plasticization and disturbance variables in the experiment influence the material properties and the process and the degree to which these properties and process states deviate from the properties and states assumed in the simulation.
- Influence of the specific behavior of the injection molding machine during the experiment, which cannot be reproduced by the simulation: The specific behavior of the injection molding machine, which results in a specific process dynamic, can differ from the process behavior assumed in simulation. To investigate the machine-specific behavior and its influence on the process, additional studies were carried out, which are already published in [39]. It was shown that the injection molding machine can have a specific behavior depending on its type and operating point. To compare the extent to which this behavior of the machine deviates from the calculated process behavior, the calculated and measured time series of the process parameters are compared in Section 3.2.
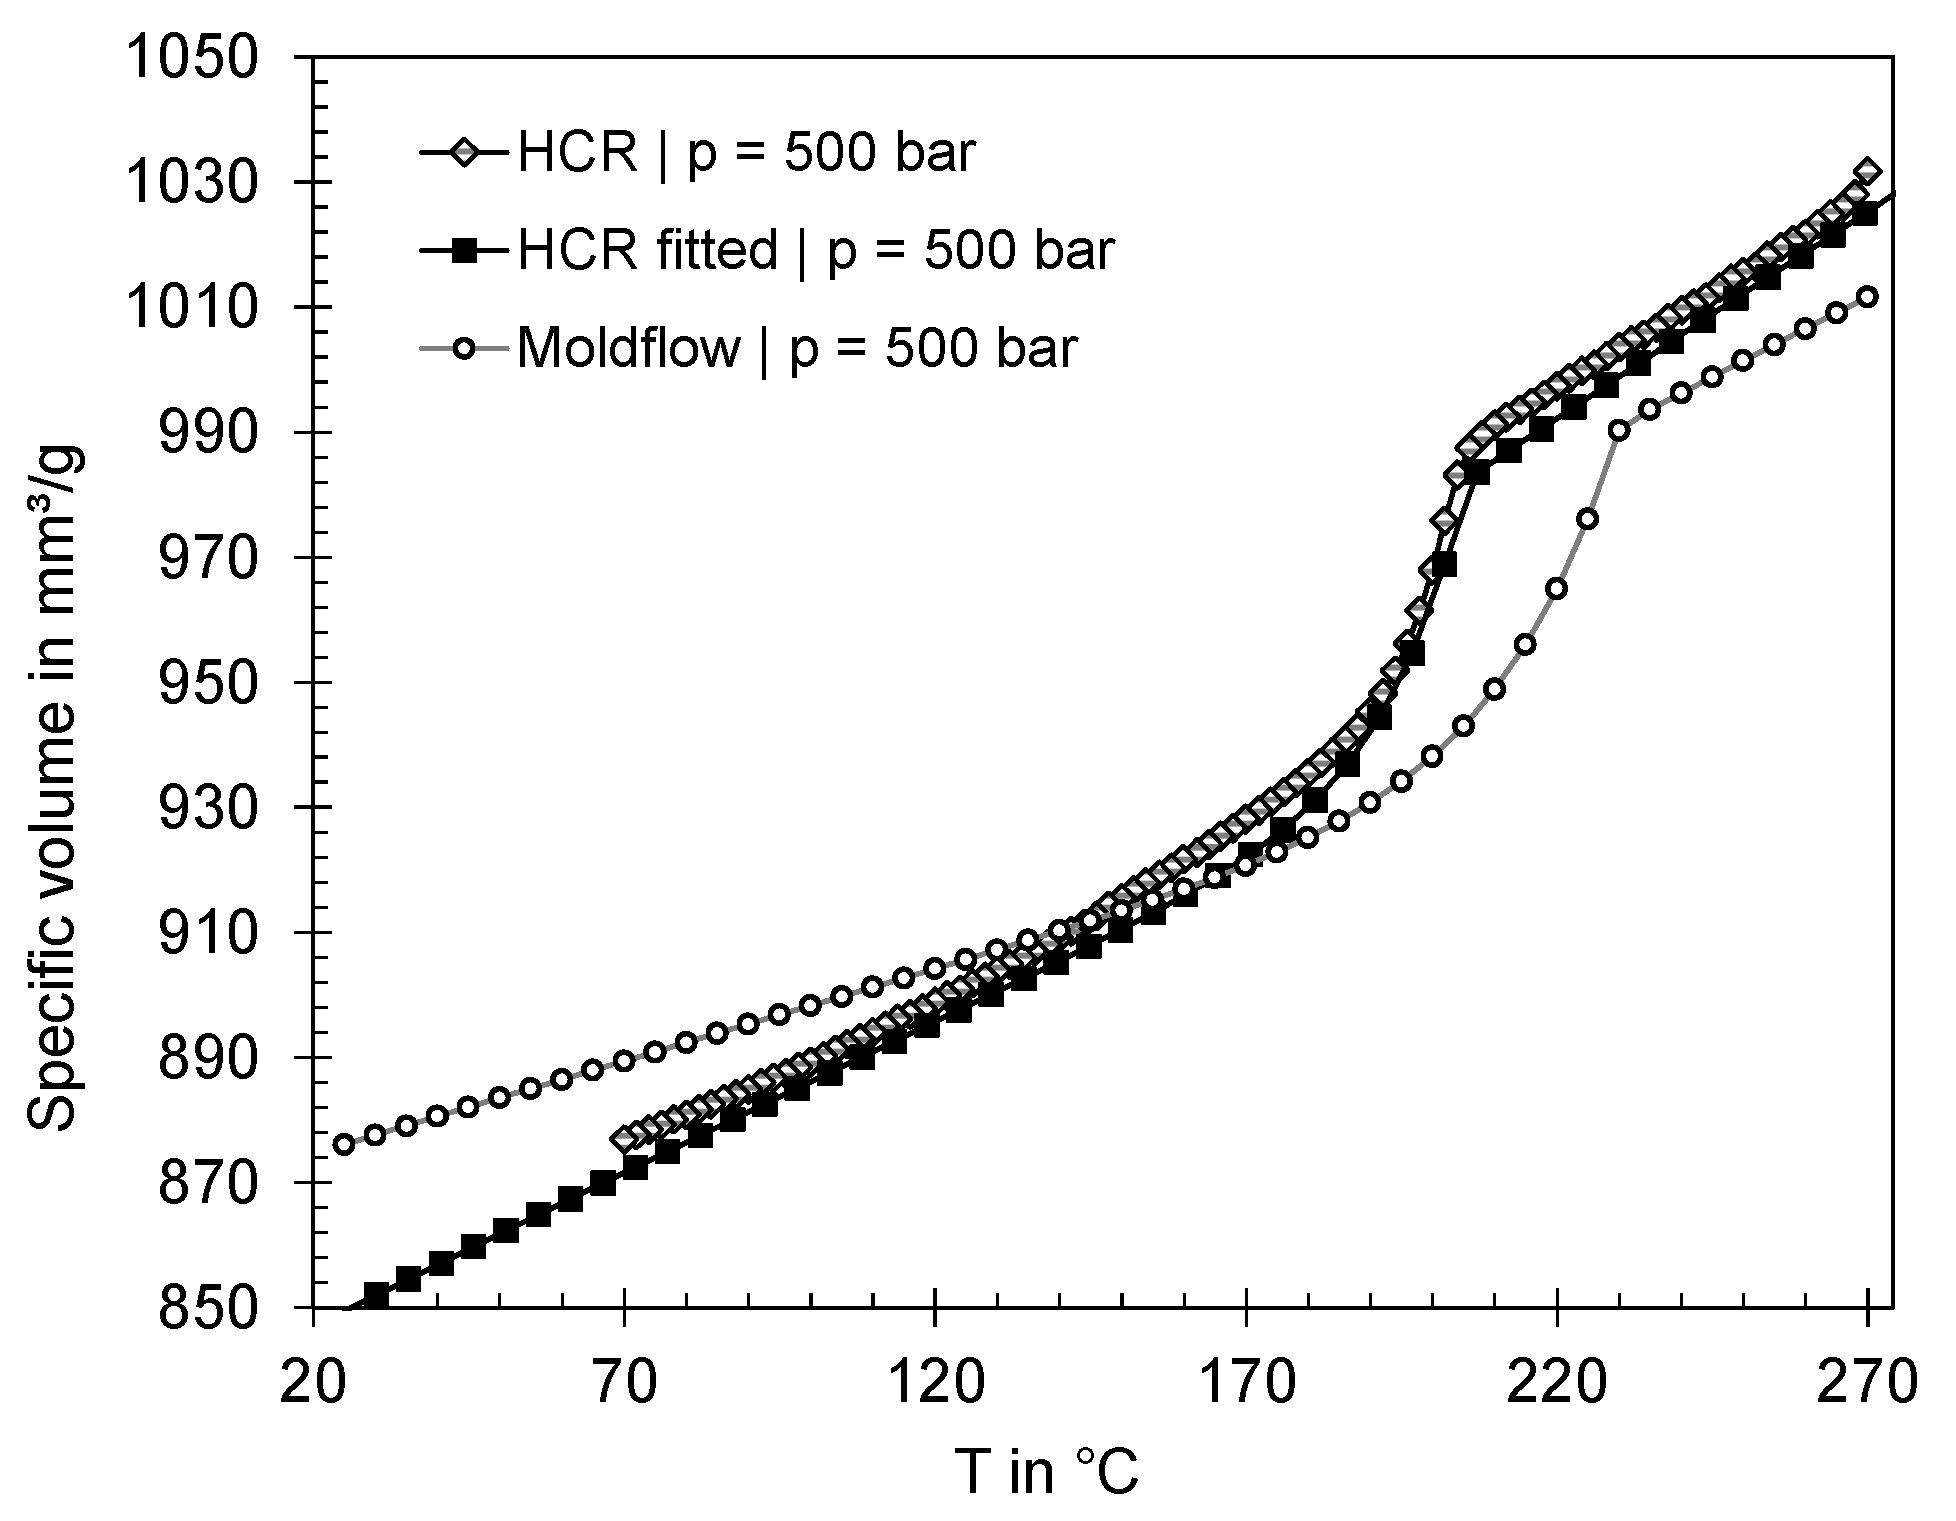
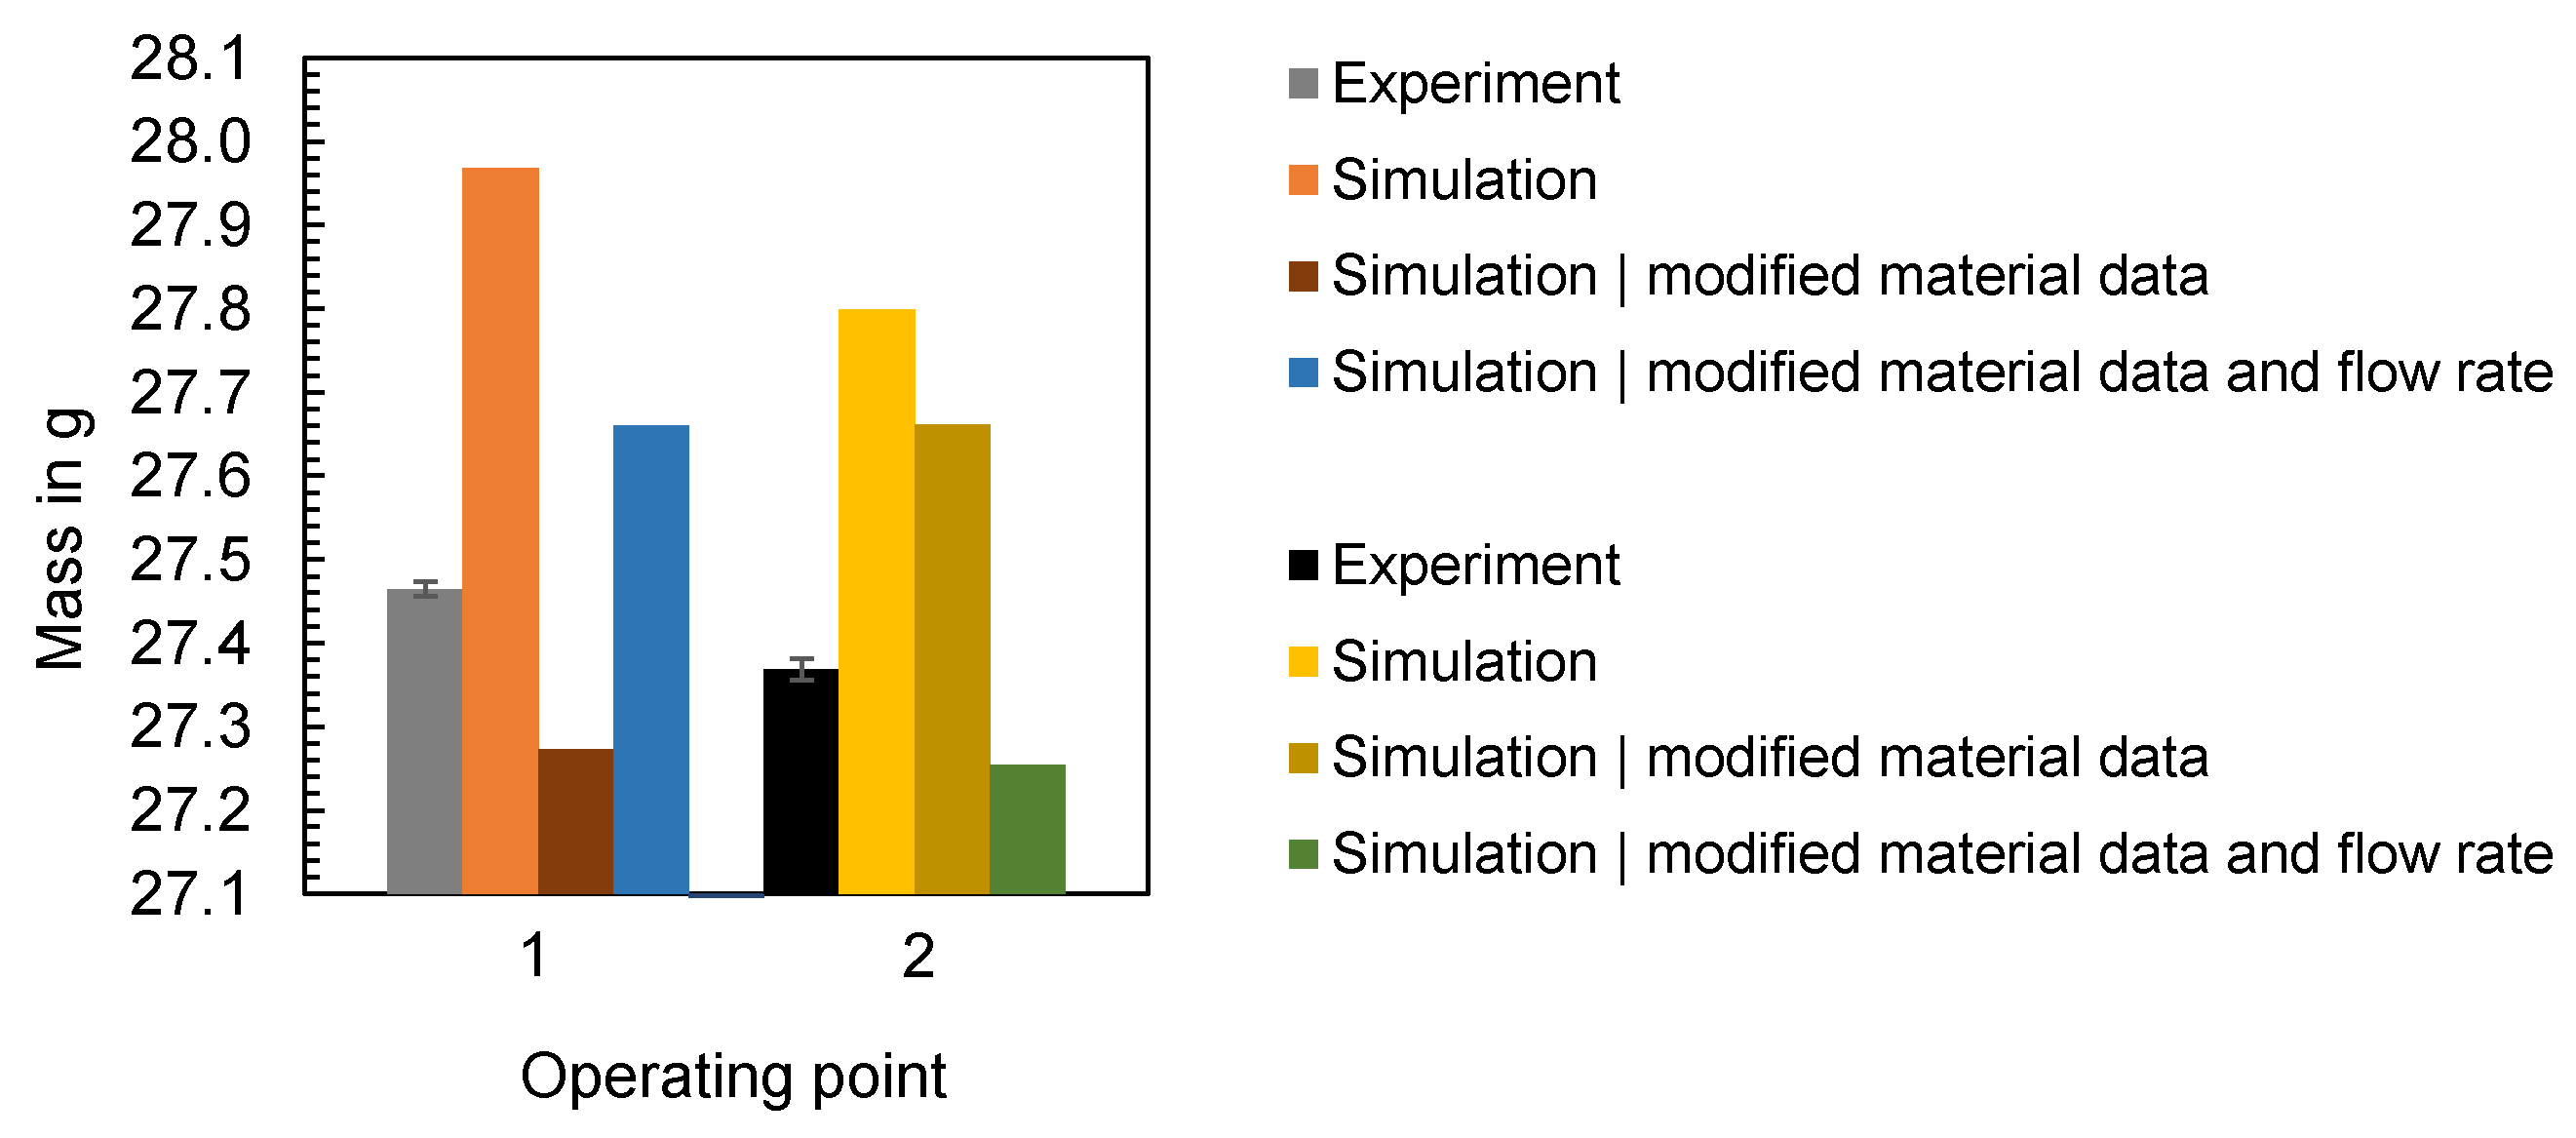
- Deviation of the characterized material properties used for simulation from the material properties during processing: The pvT behavior of polymers is one of the most important factors with an influence on the shrinkage and warpage of the final products [40]. To check how well the material data used for numerical simulation fits to the actual material properties, the material used was analyzed. The results are presented in Section 3.3.
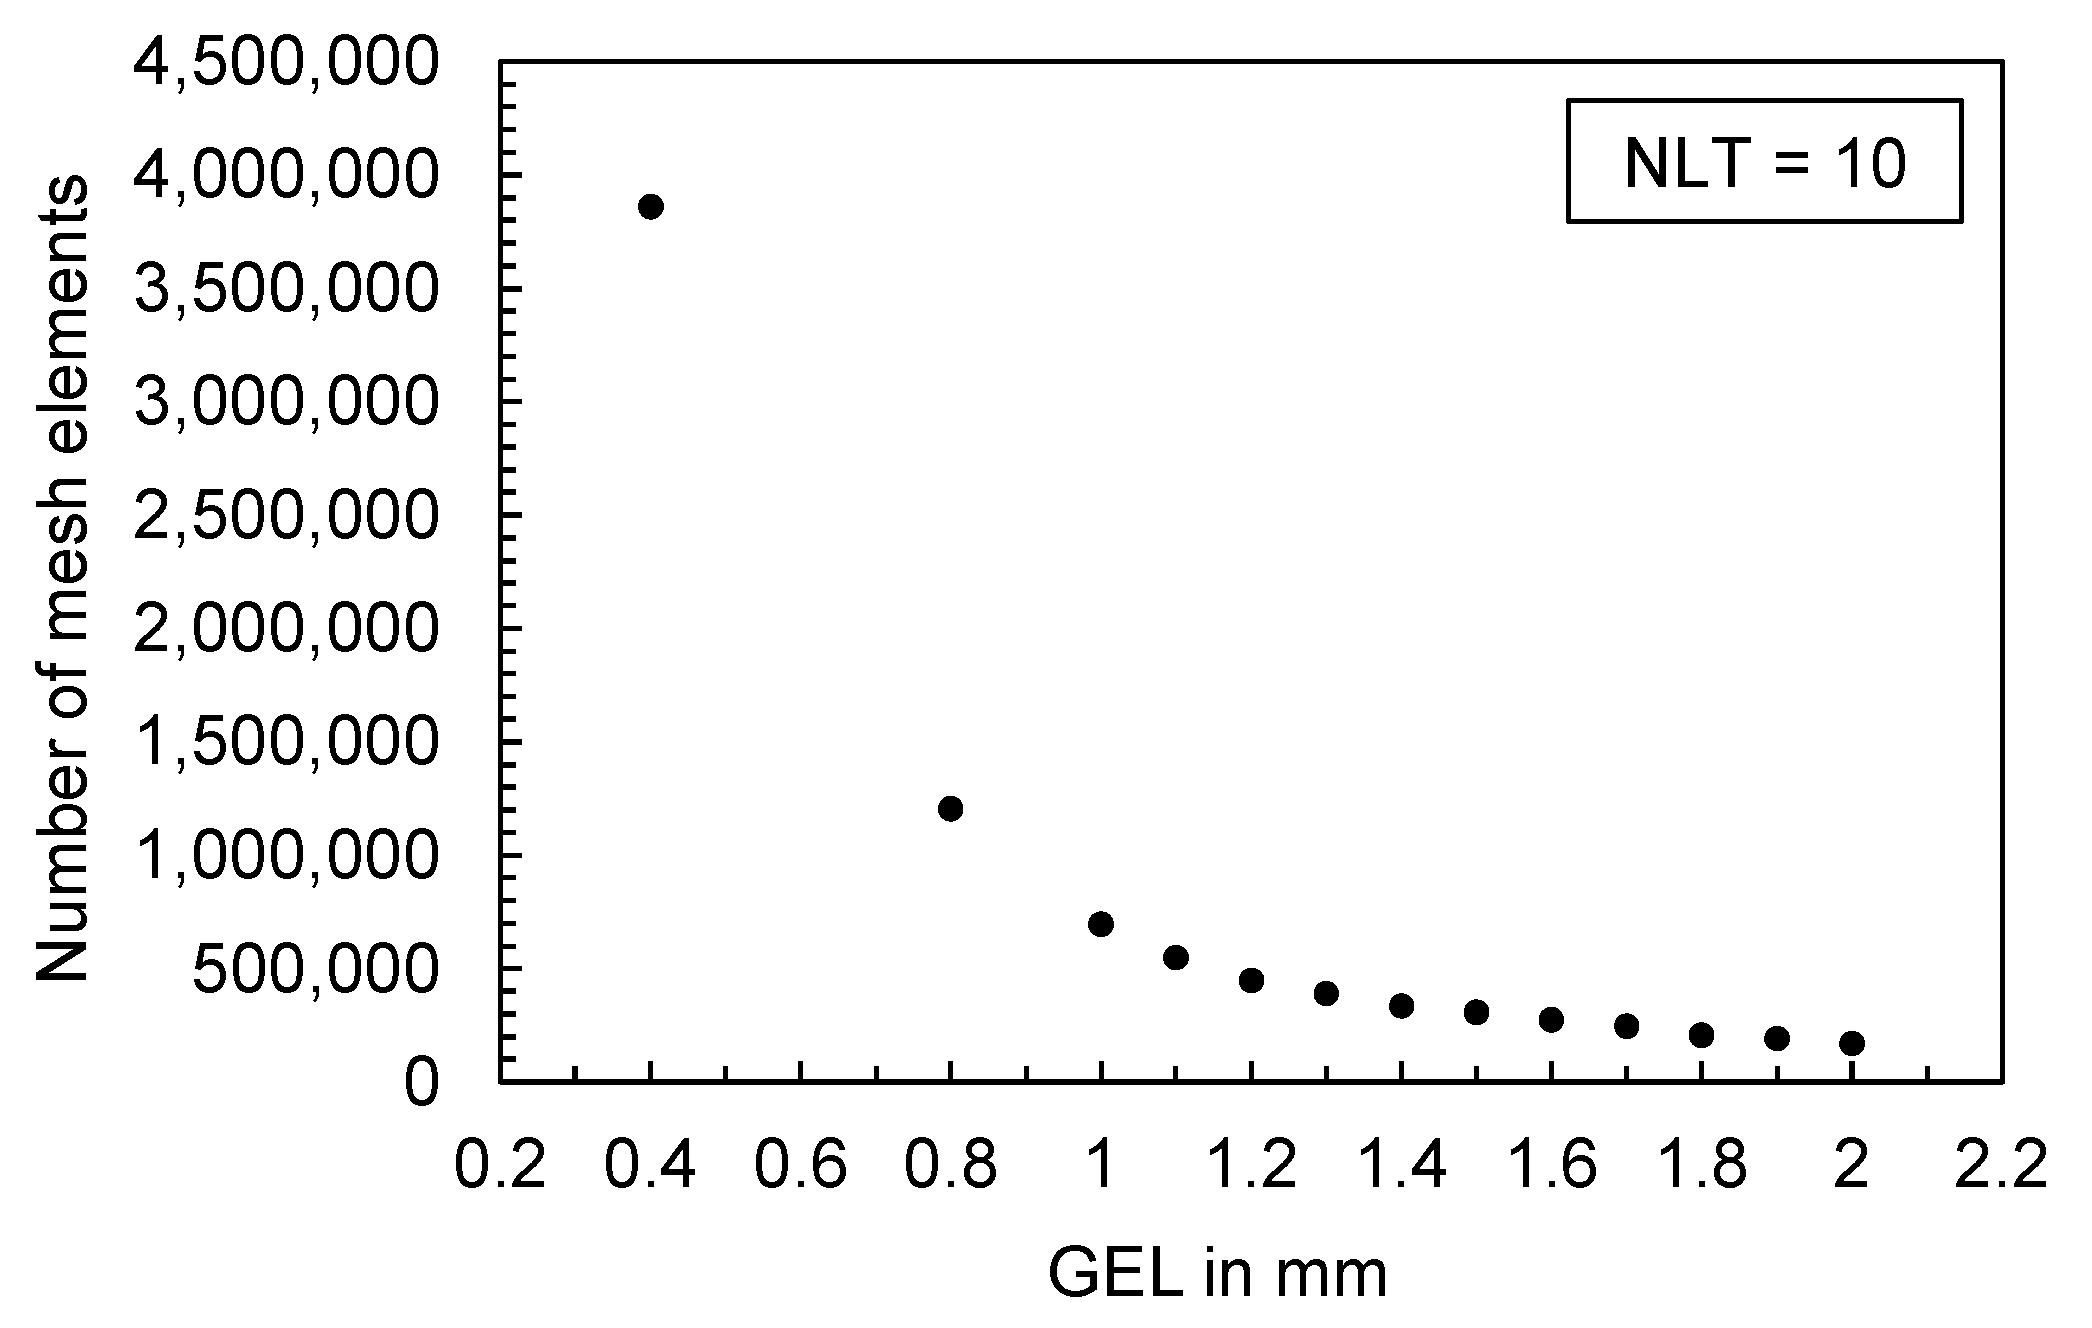
- Influence of simulation parameters for discretizing the part geometry and for solving the equations on the calculation result: The mesh and solver parameter can have an influence on the simulation result. An analysis of the extent of this influence and a comparison to experimental data are presented in Section 3.4.
3.2. Comparison of the Calculated and Measured Time Series
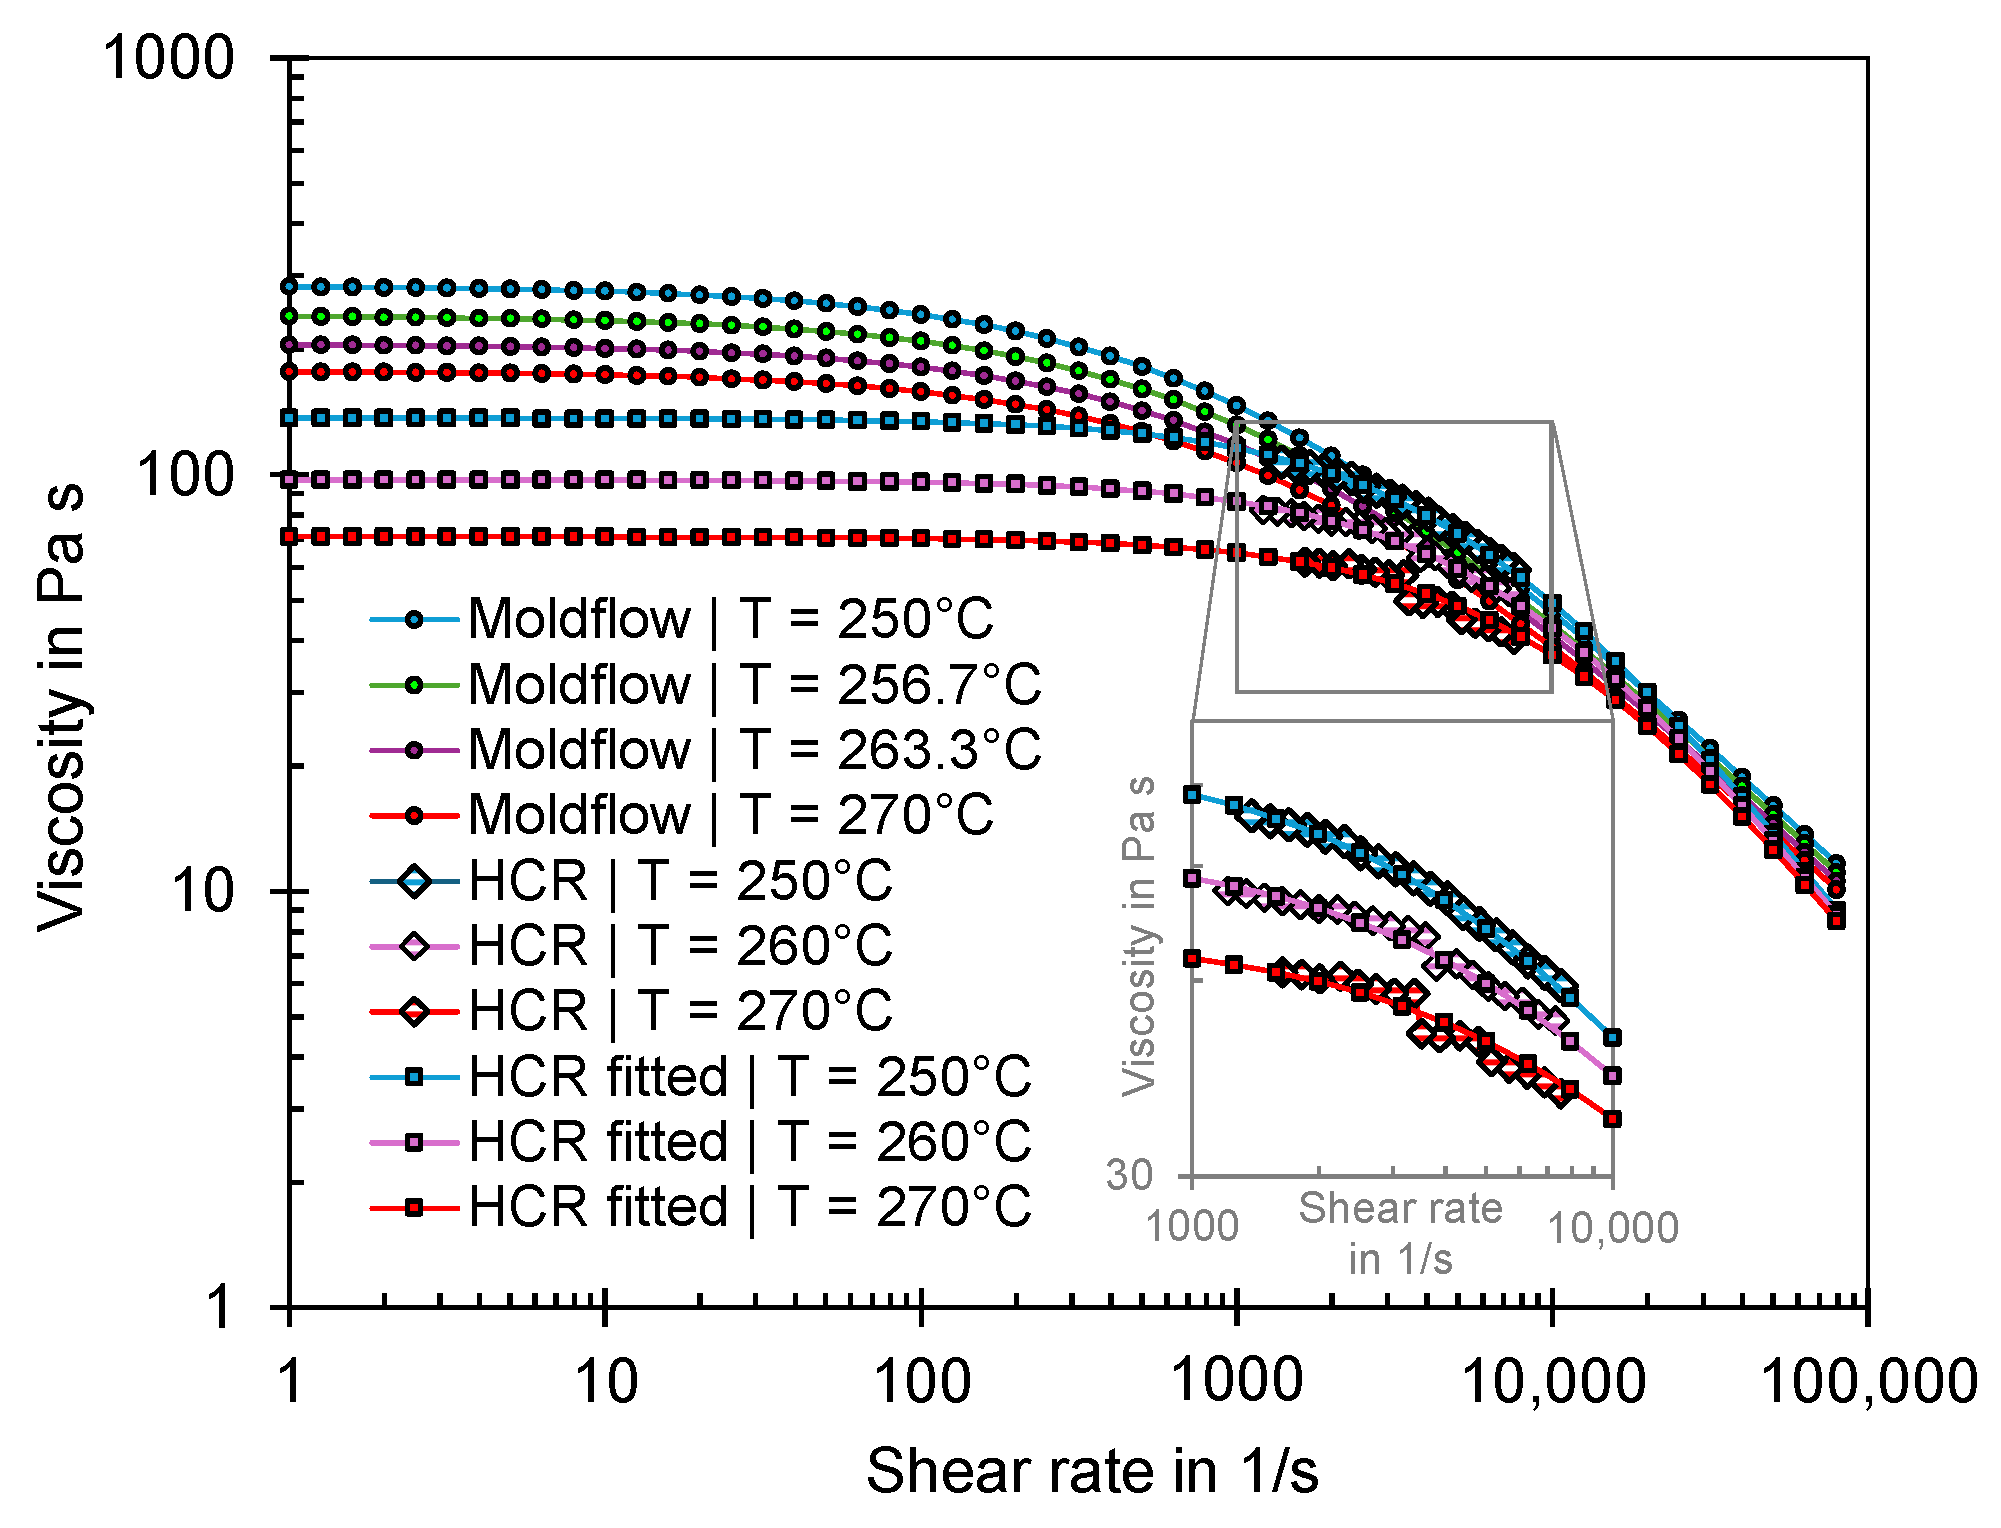
3.3. Comparison of the Actual Material Data and the Material Data Used for Simulation
3.4. Influence of the Mesh Density on the Simulation Result Using the Flat Bar as an Example
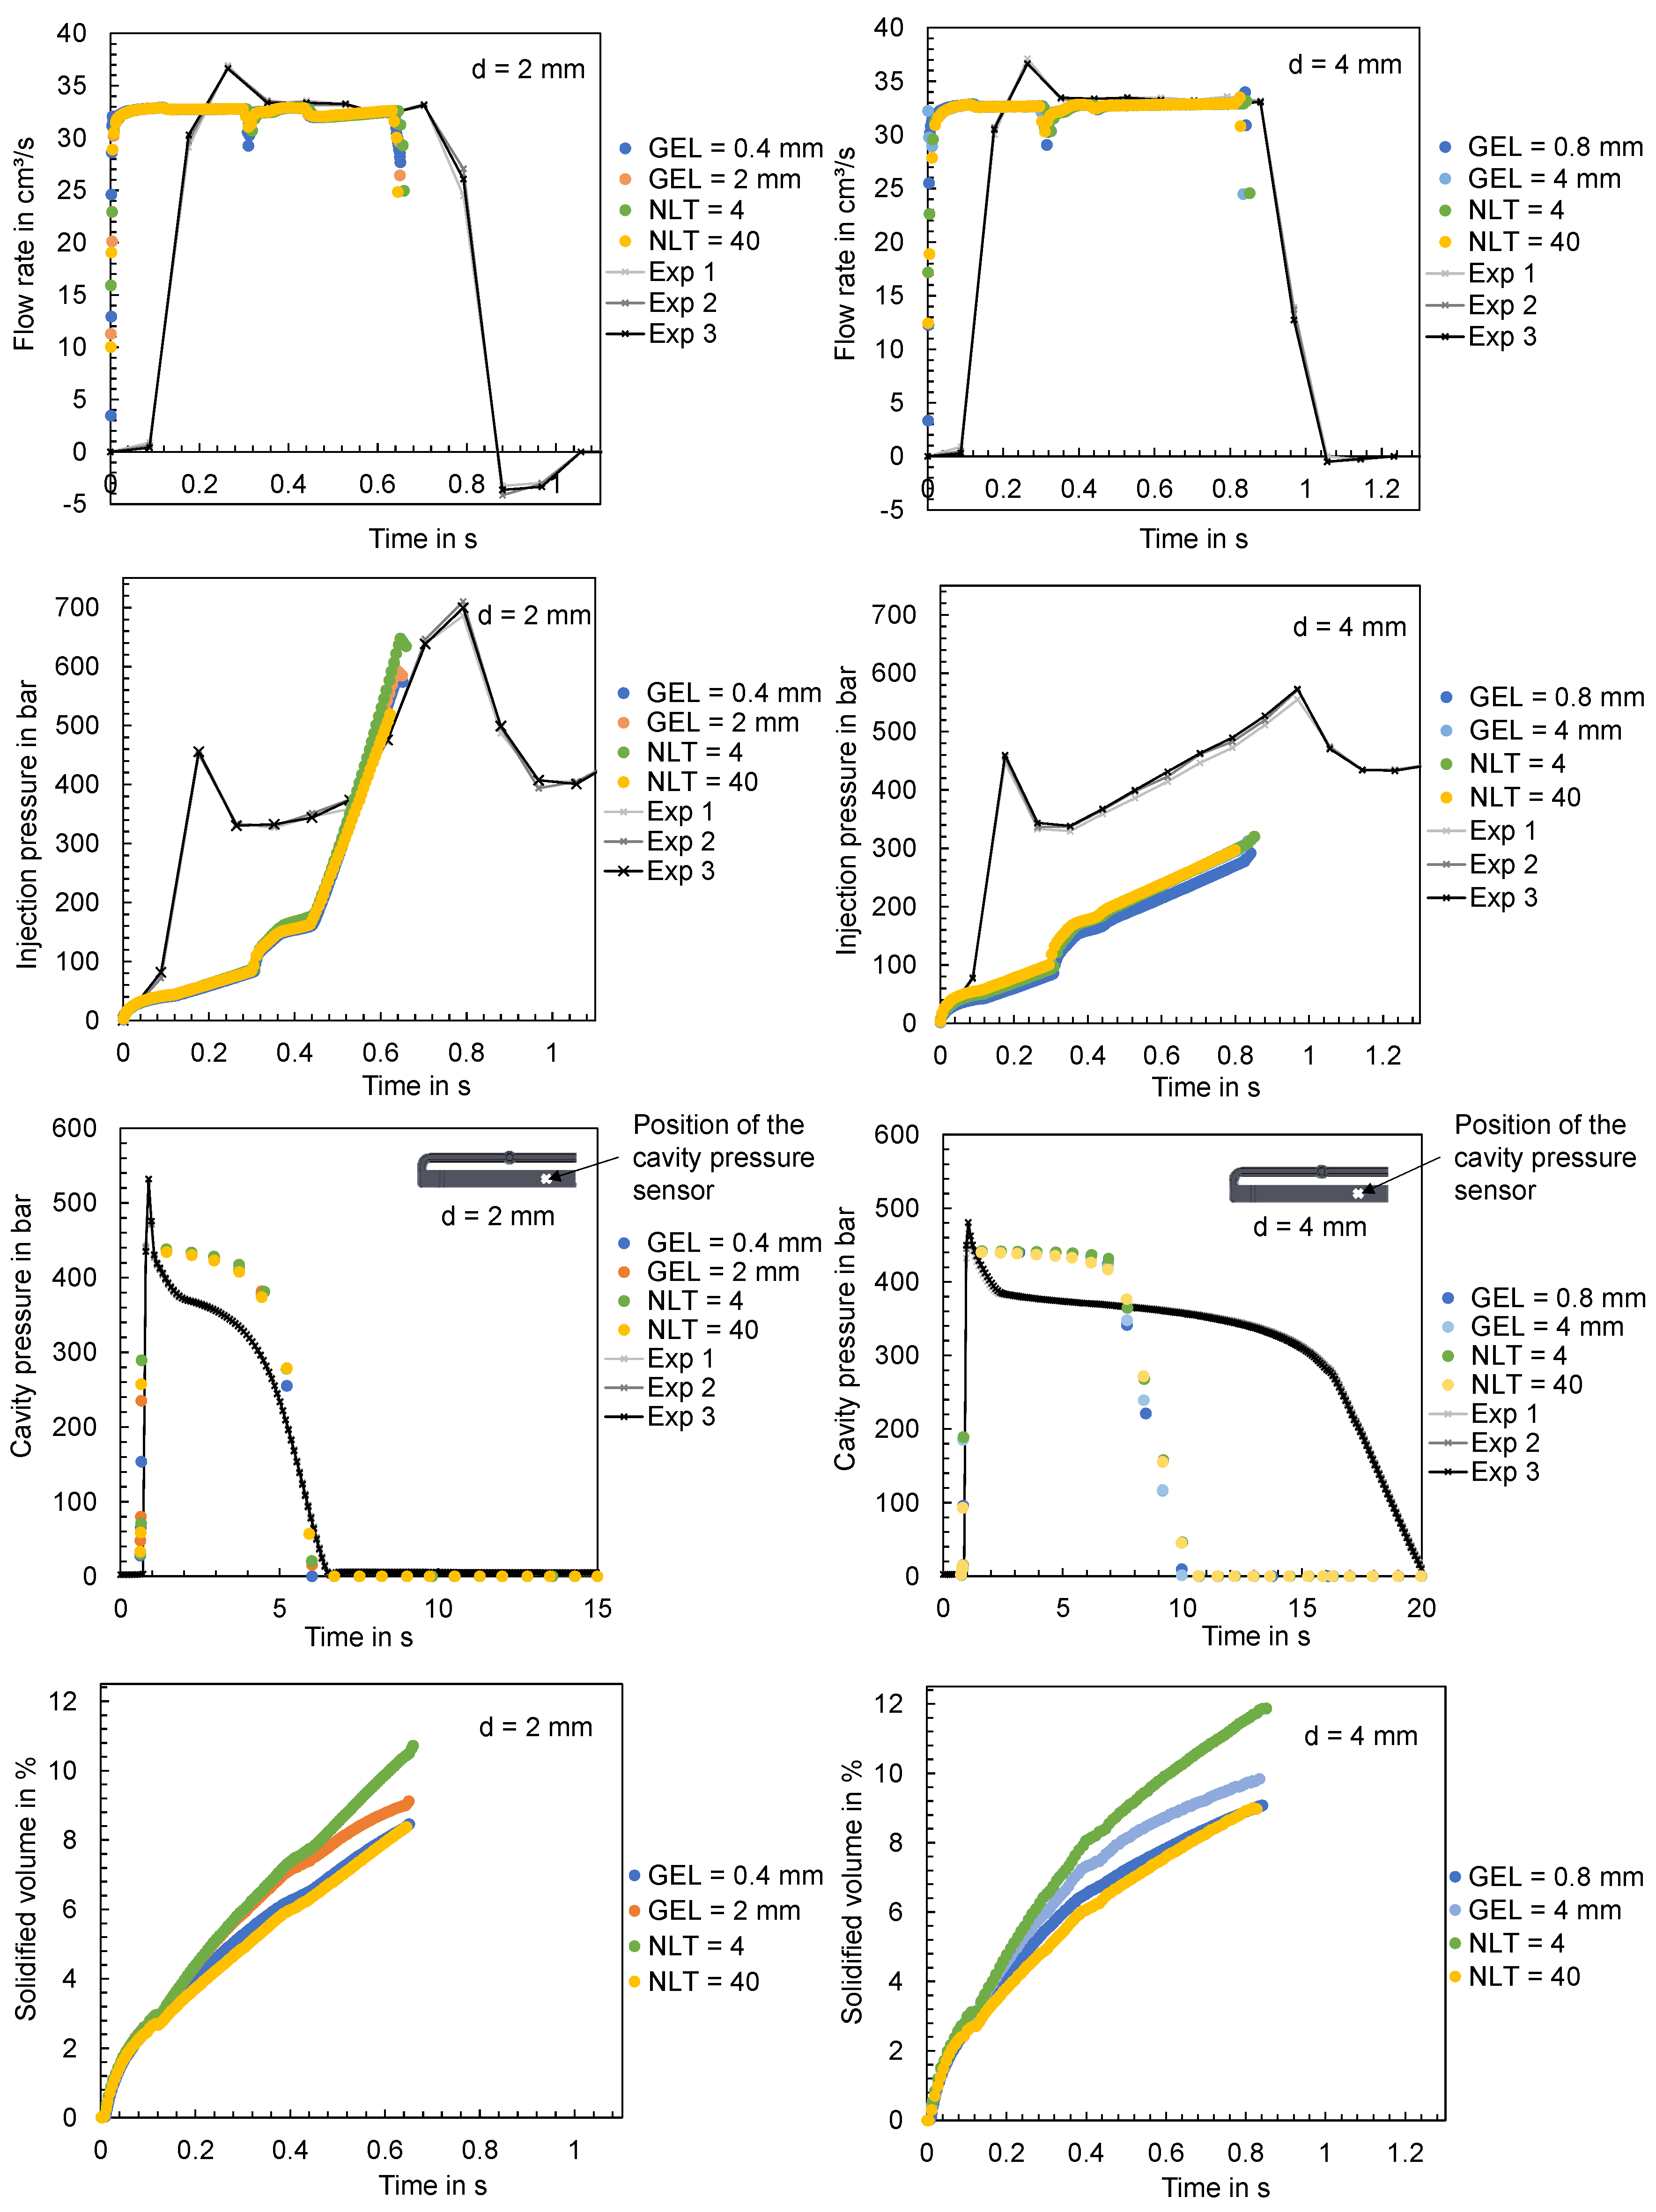
3.4.1. Influence of the GEL and NLT on the Computed Time Series of the Process Parameters and Comparison with Experimentally Measured Data
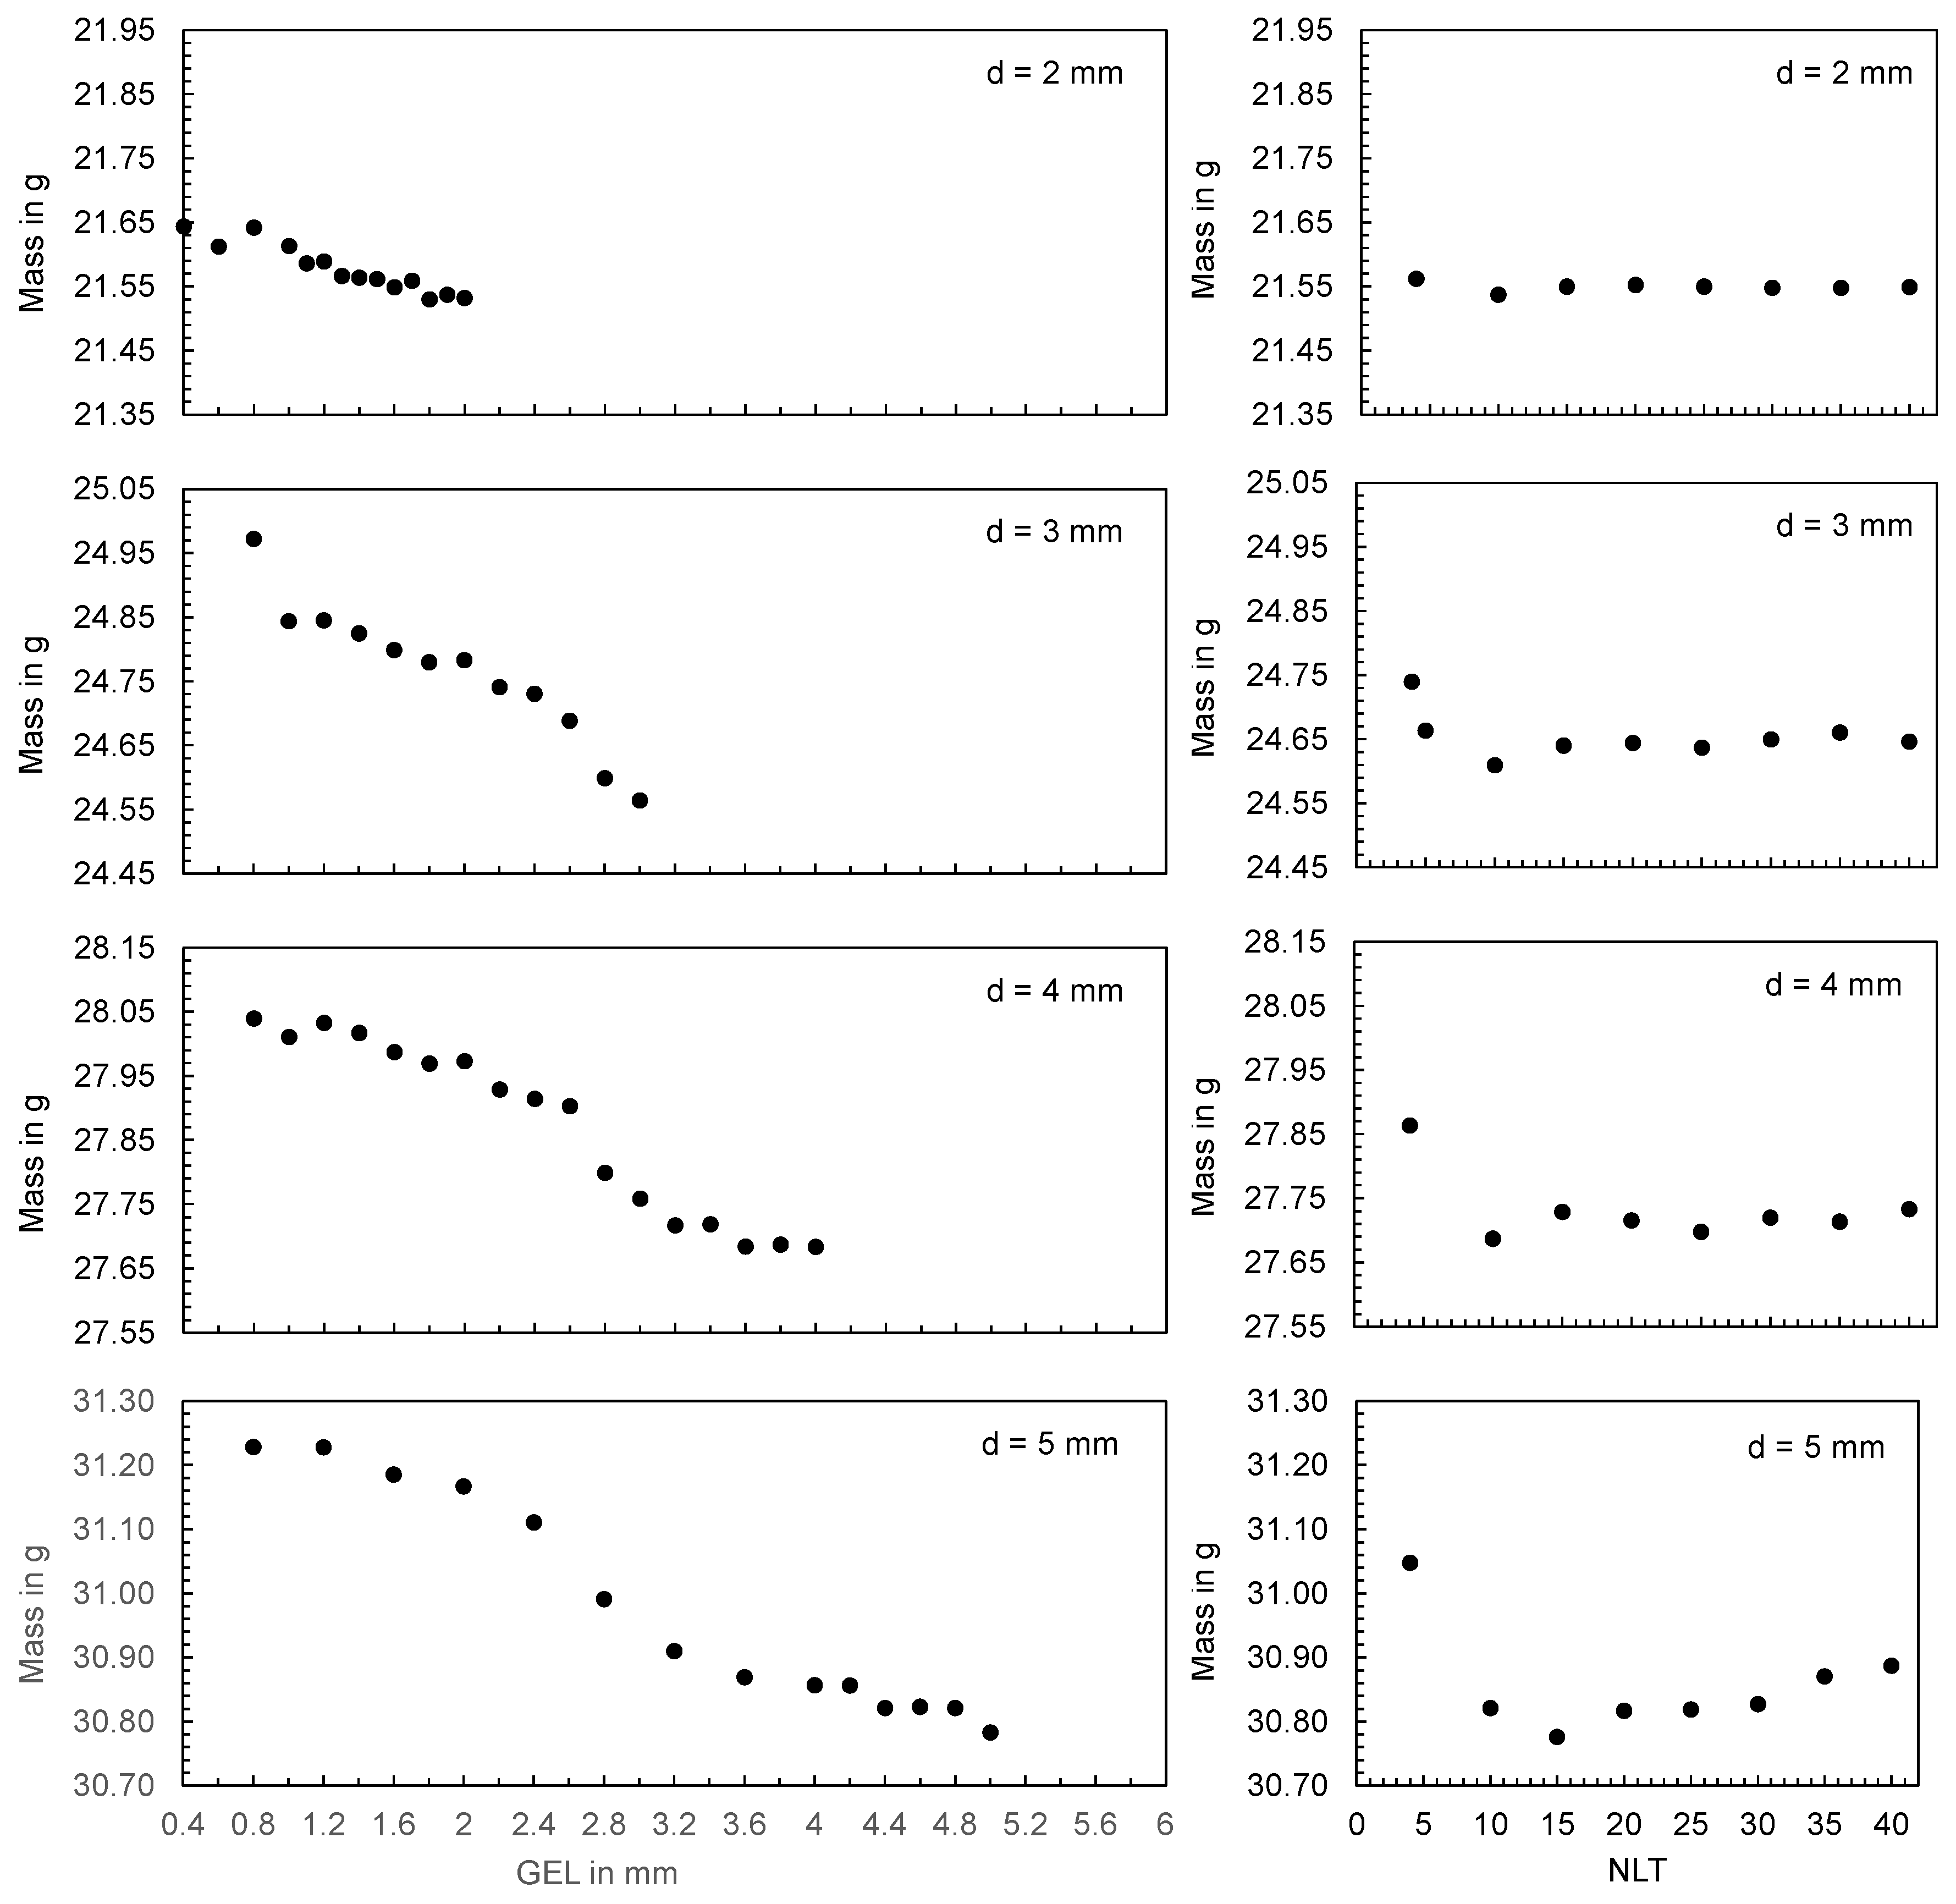
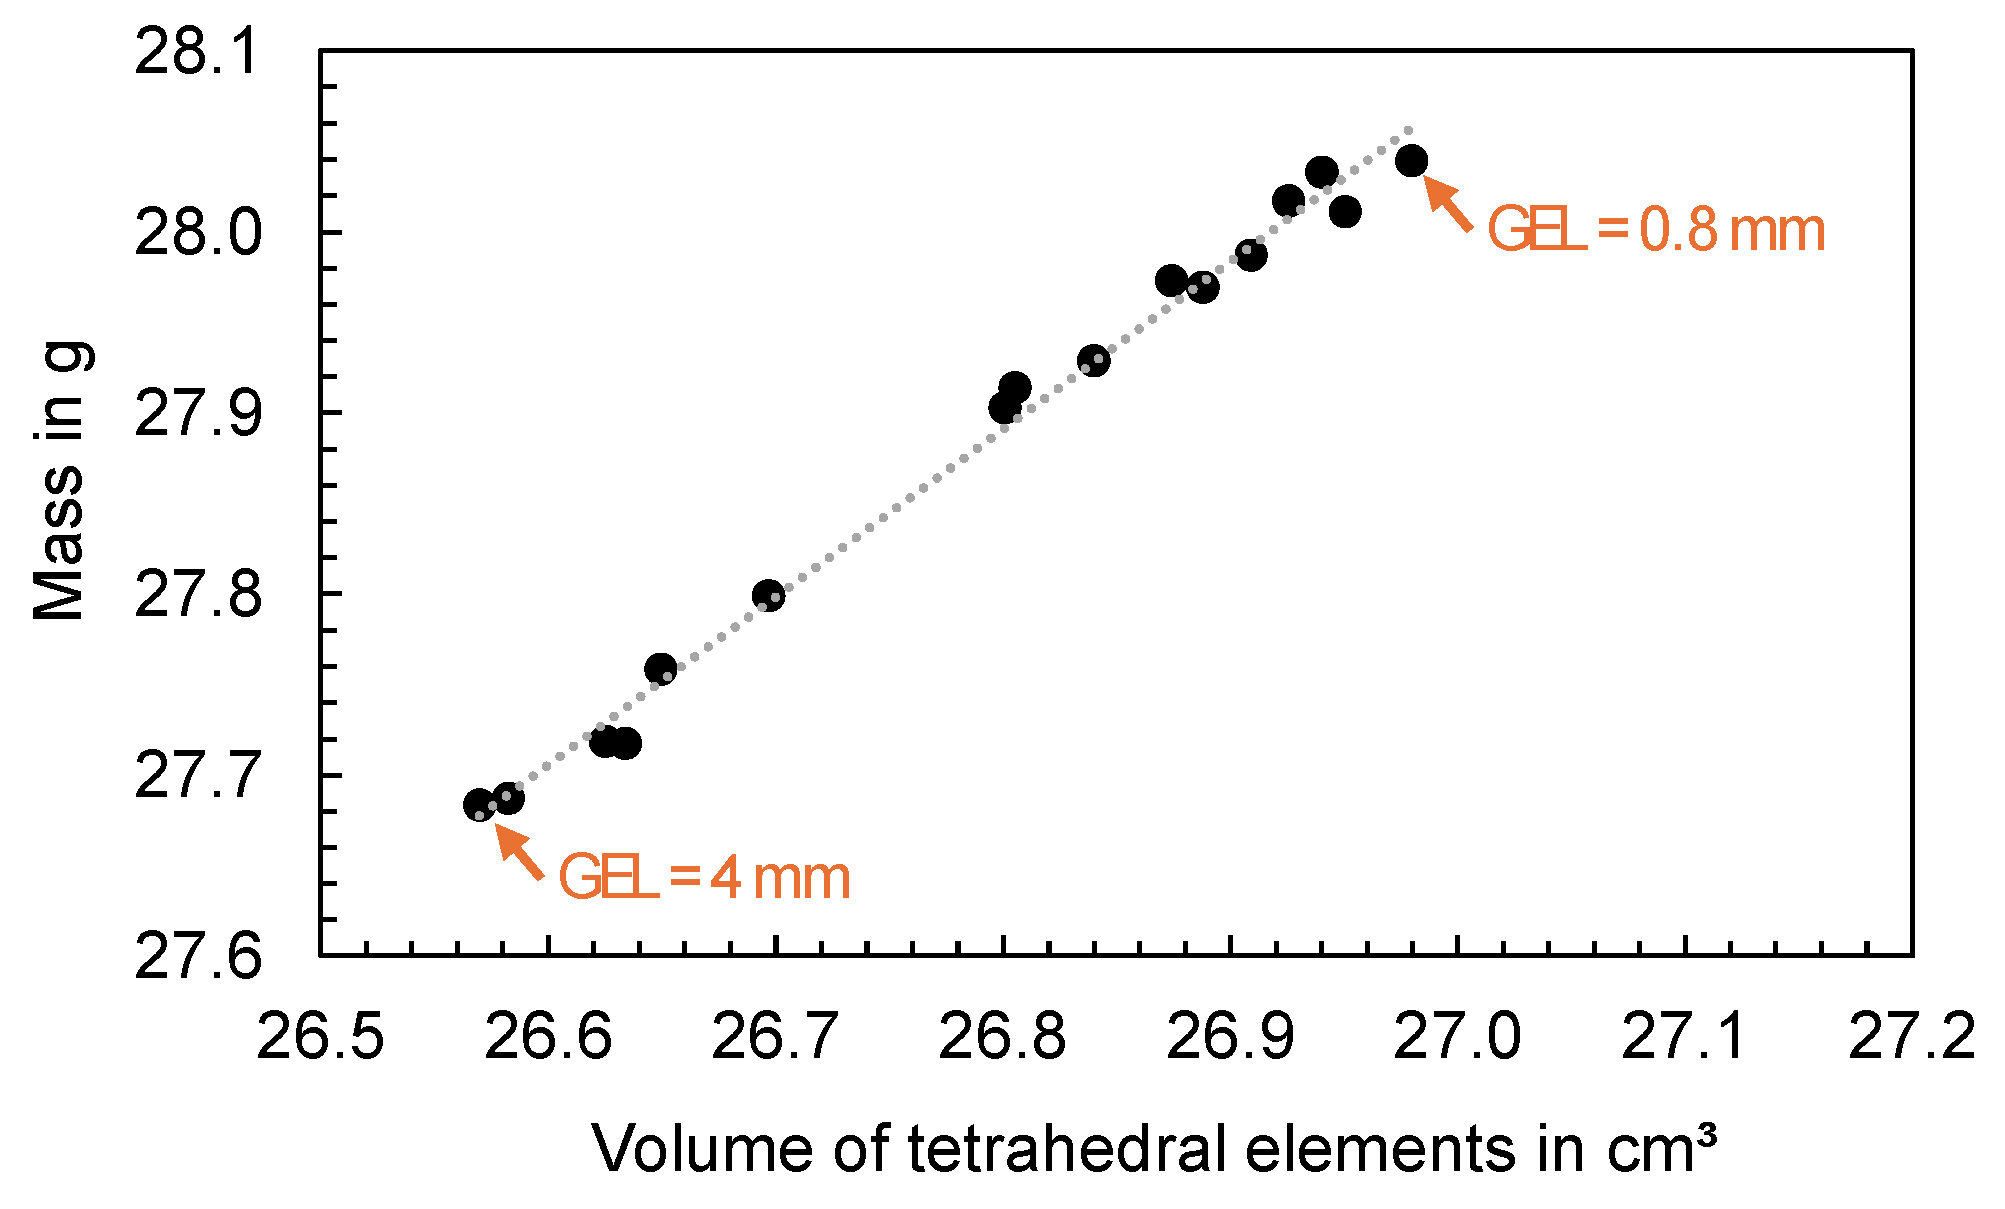
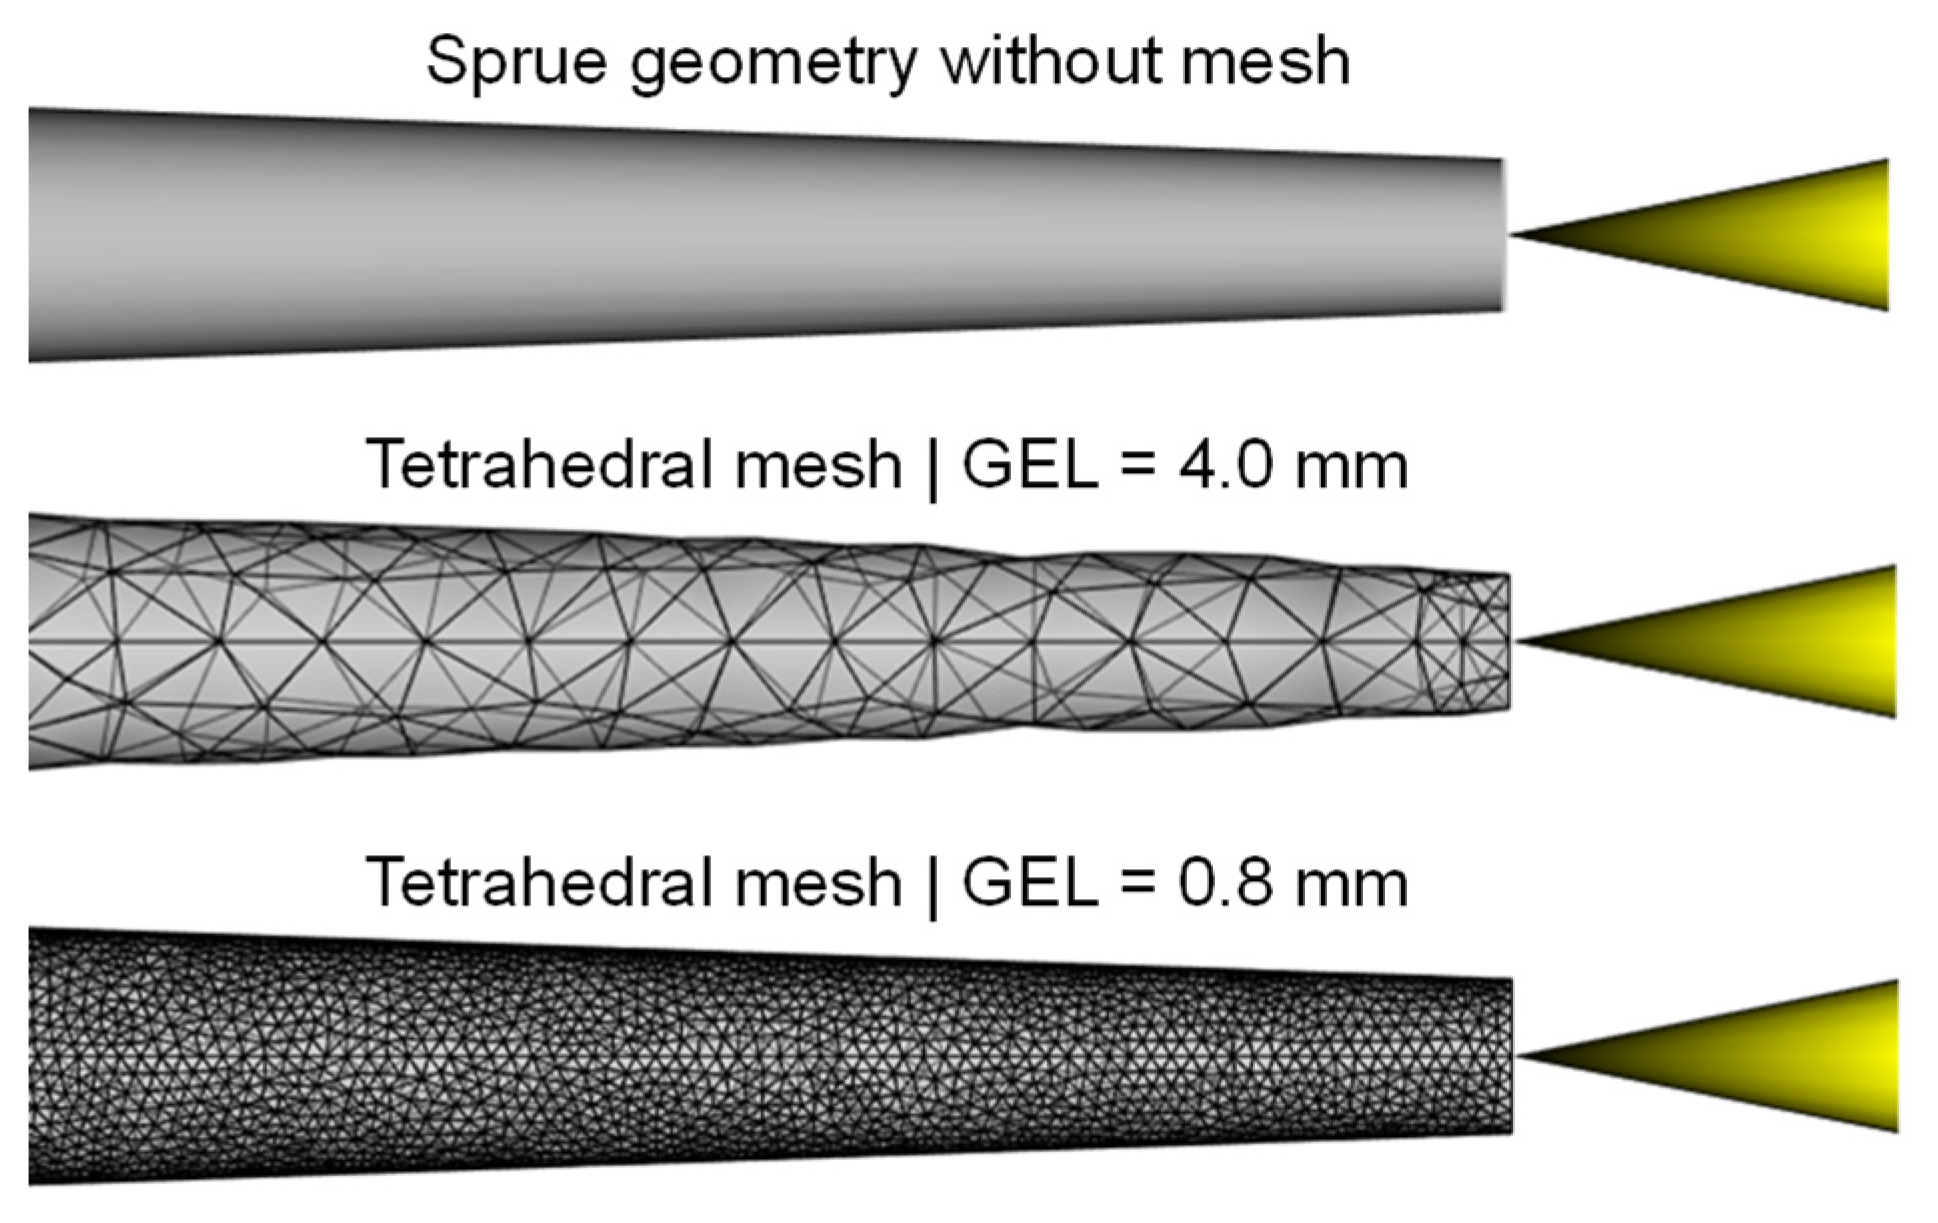
3.4.2. Influence of the GEL and NLT on the Computed Mass Using the Flat Bar as an Example
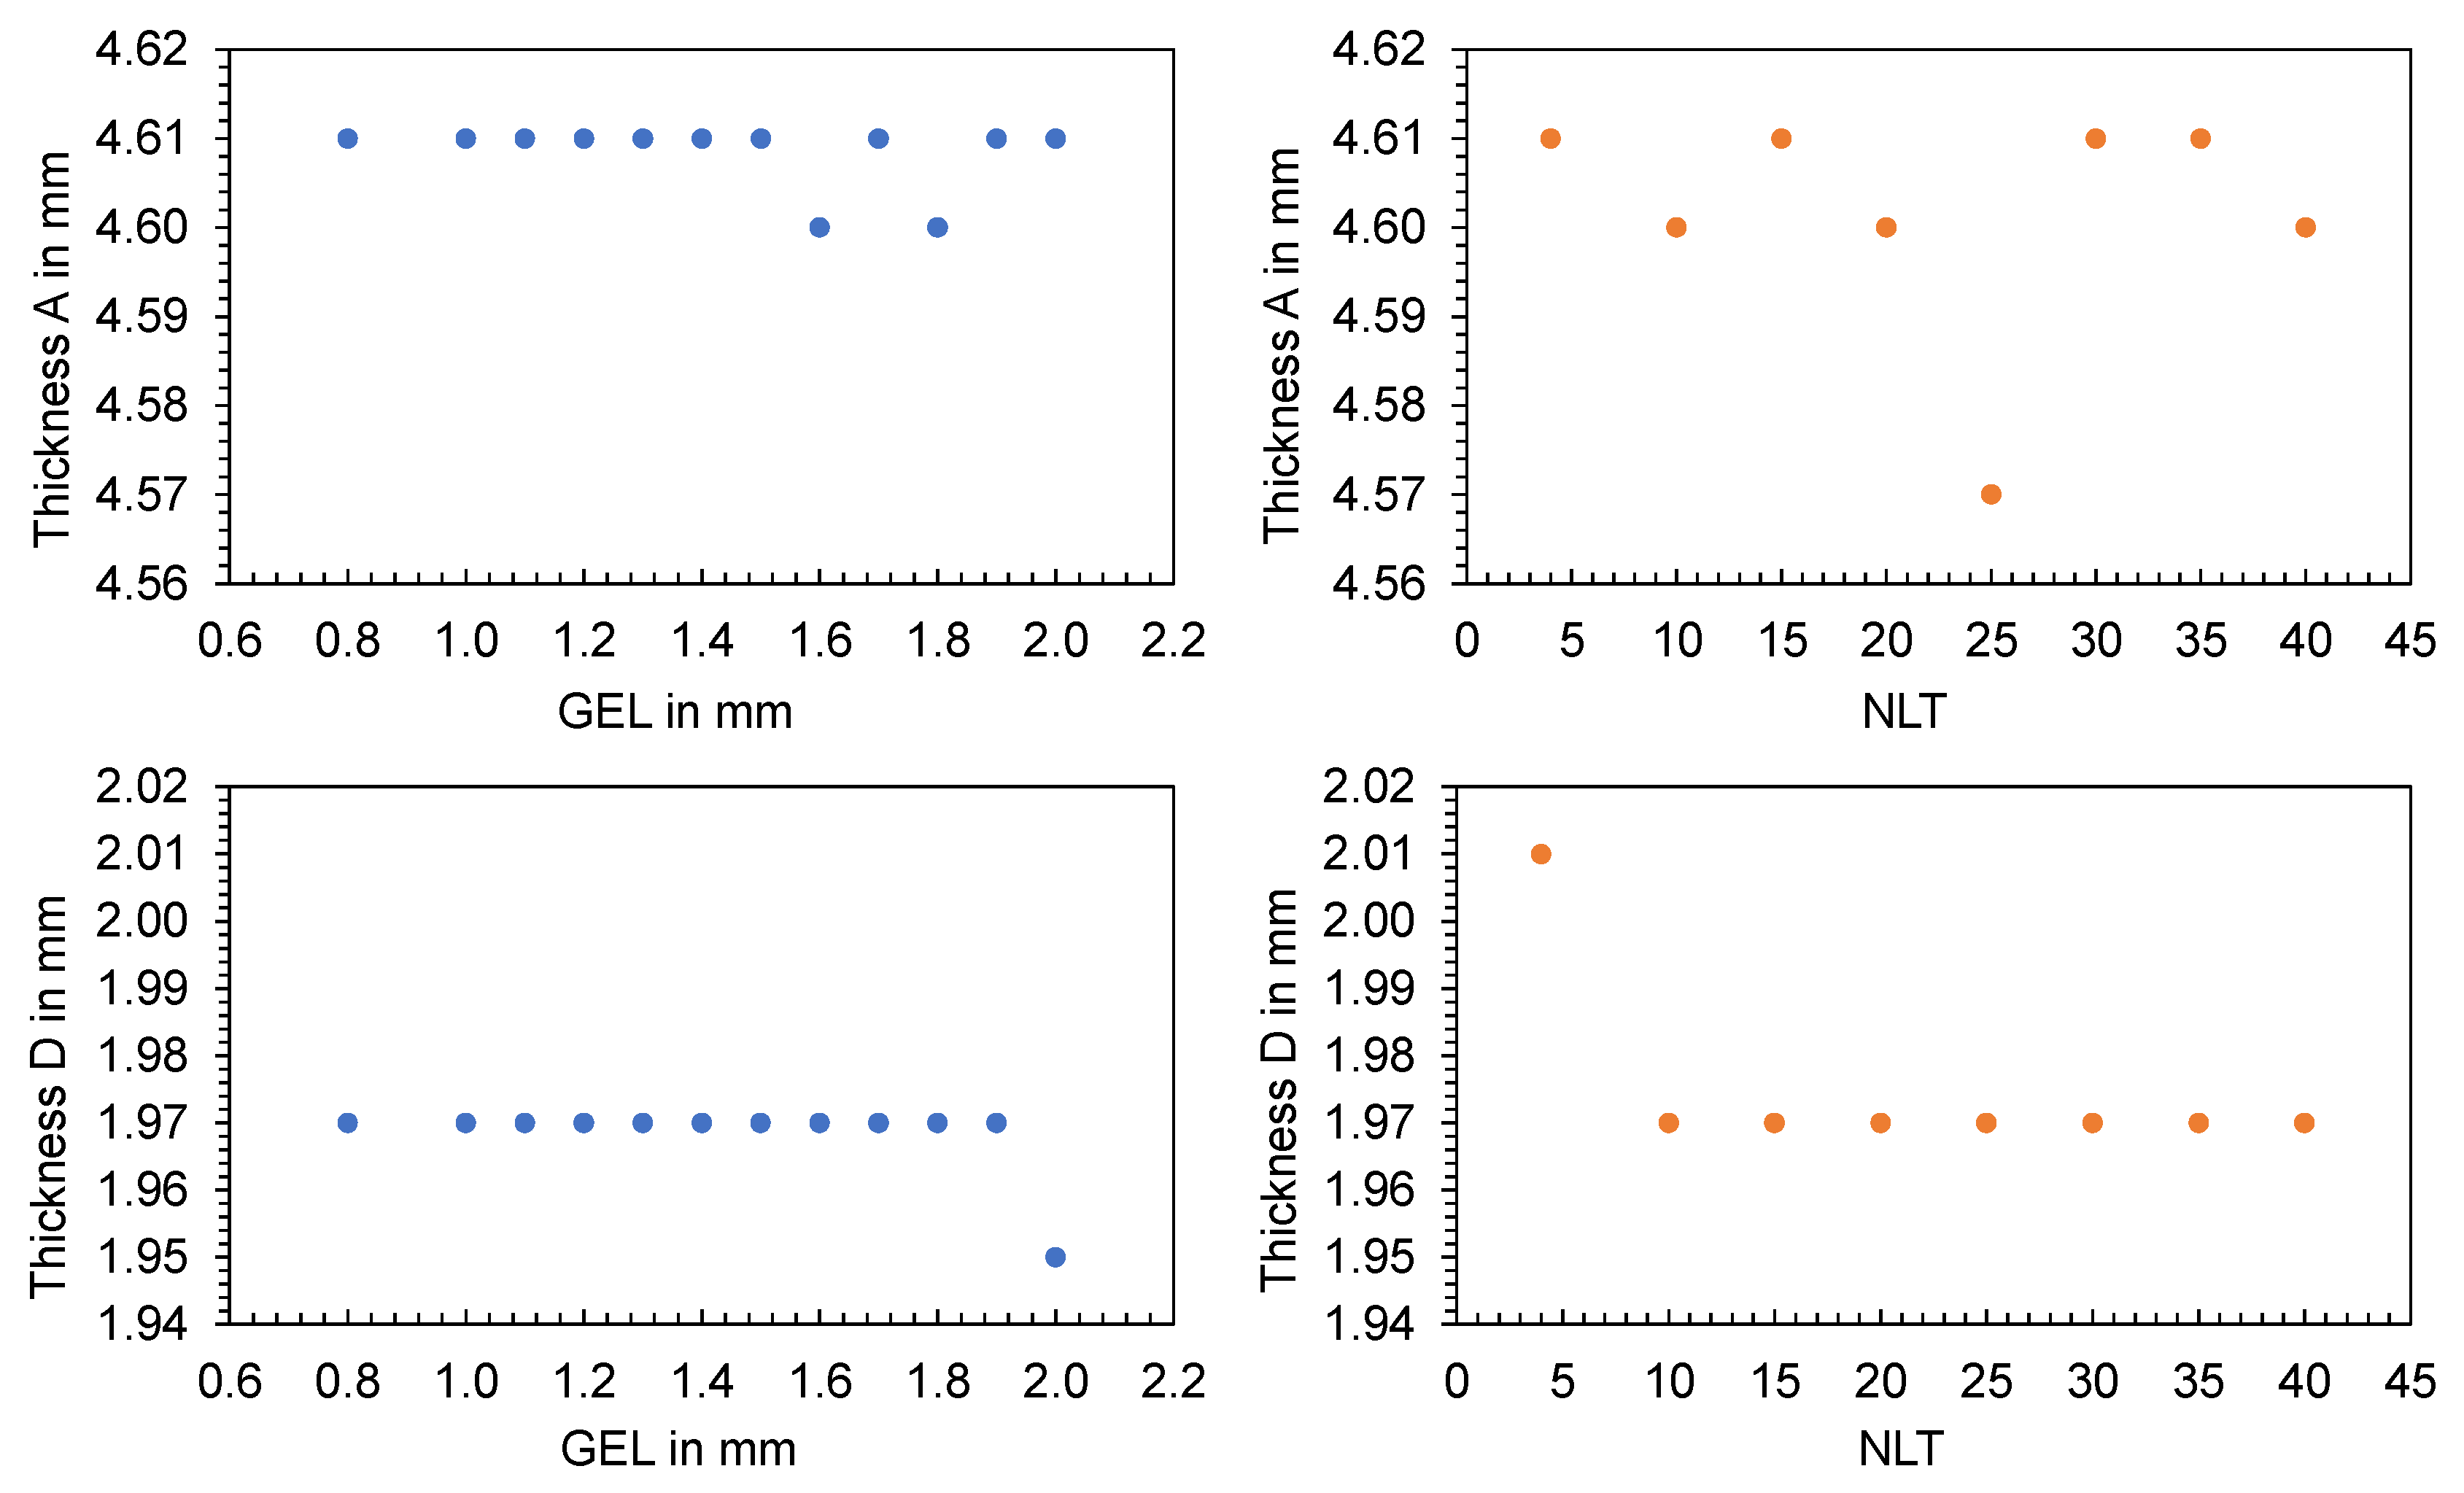
3.4.3. Influence of the GEL and NLT on the Computed Part Dimensions
3.4.4. Influence of the Solver Parameters on the Computed Time Series
3.5. Simulation of the Material and Machine-Specific Behavior
4. Conclusions
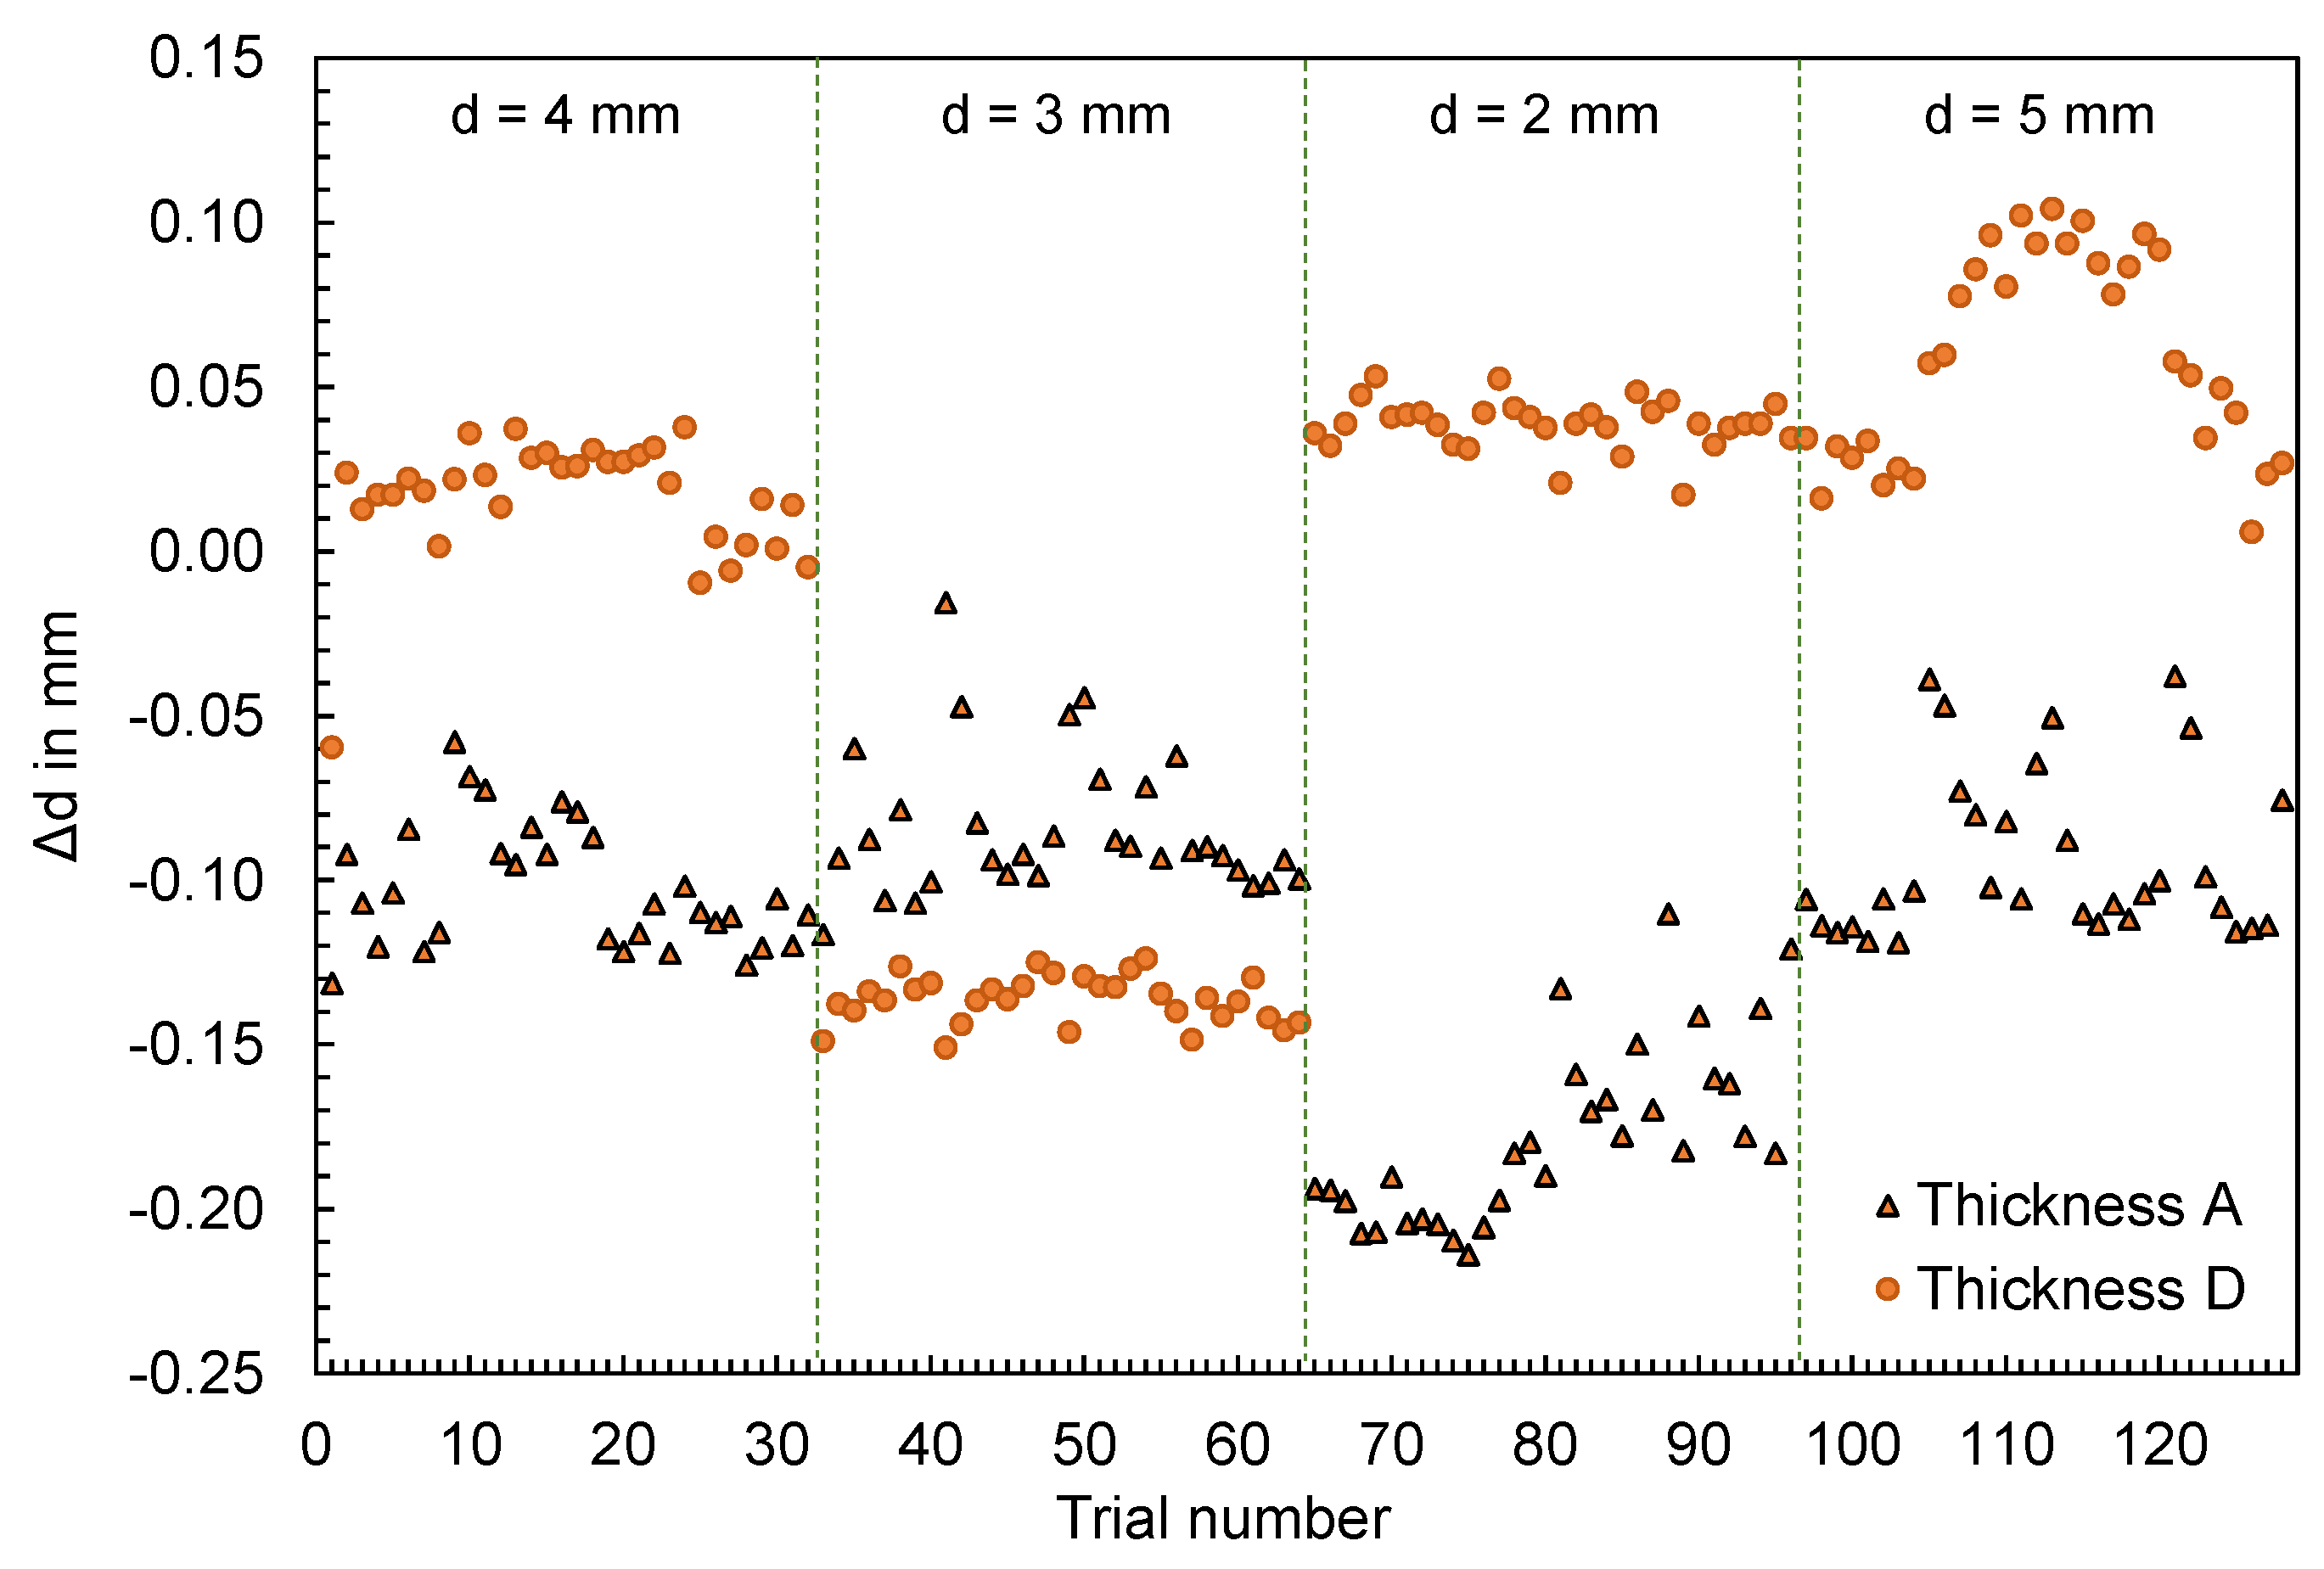
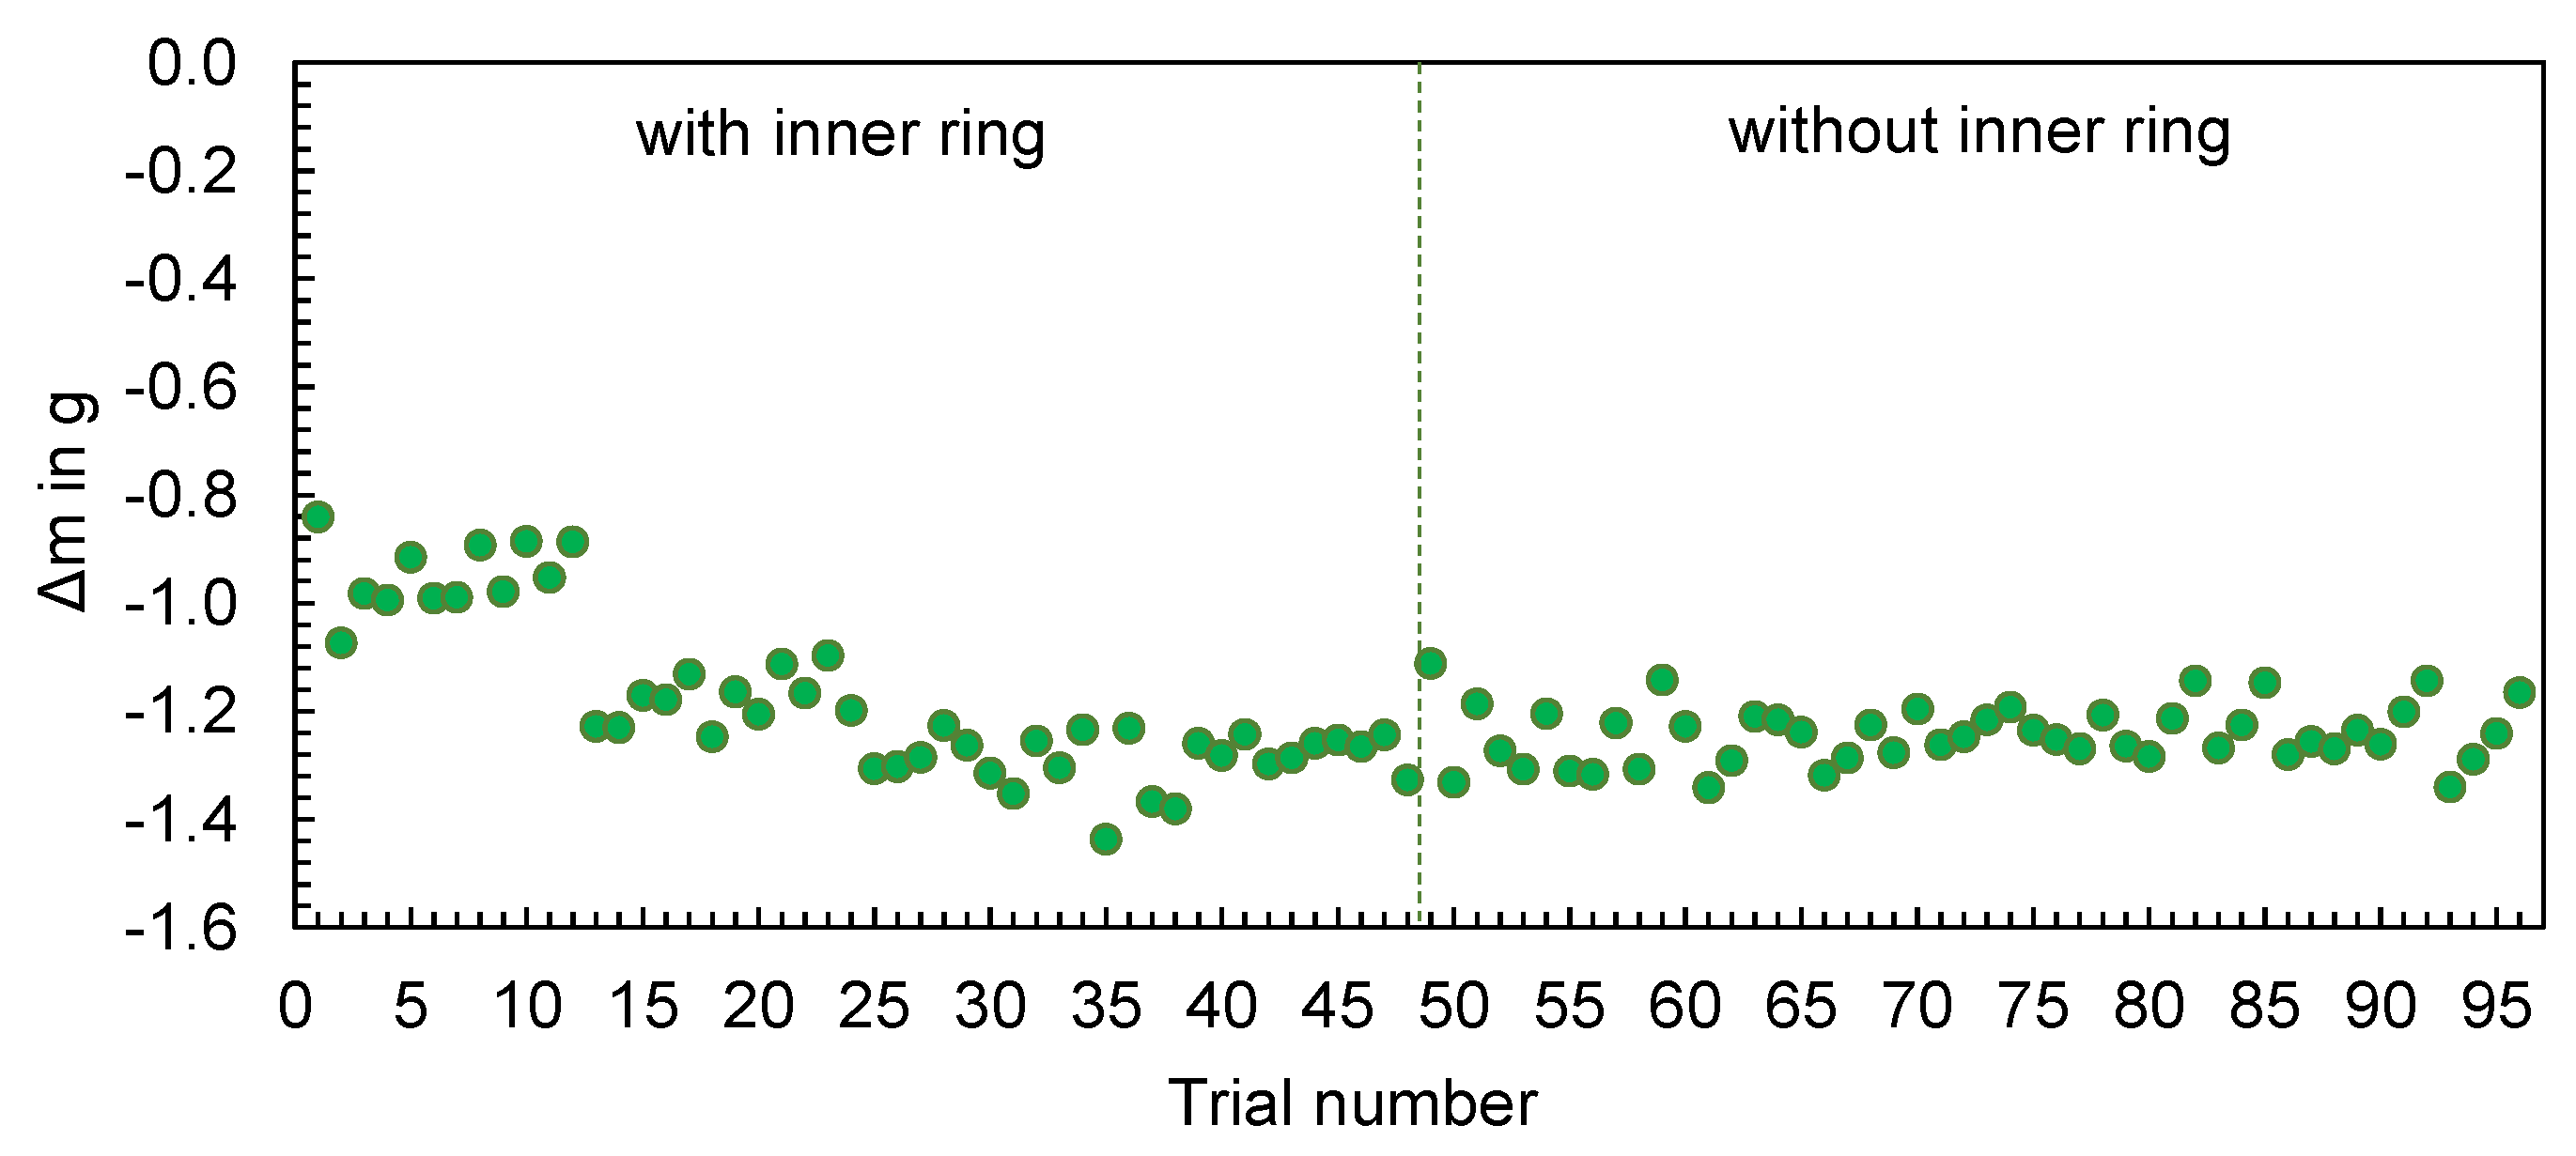
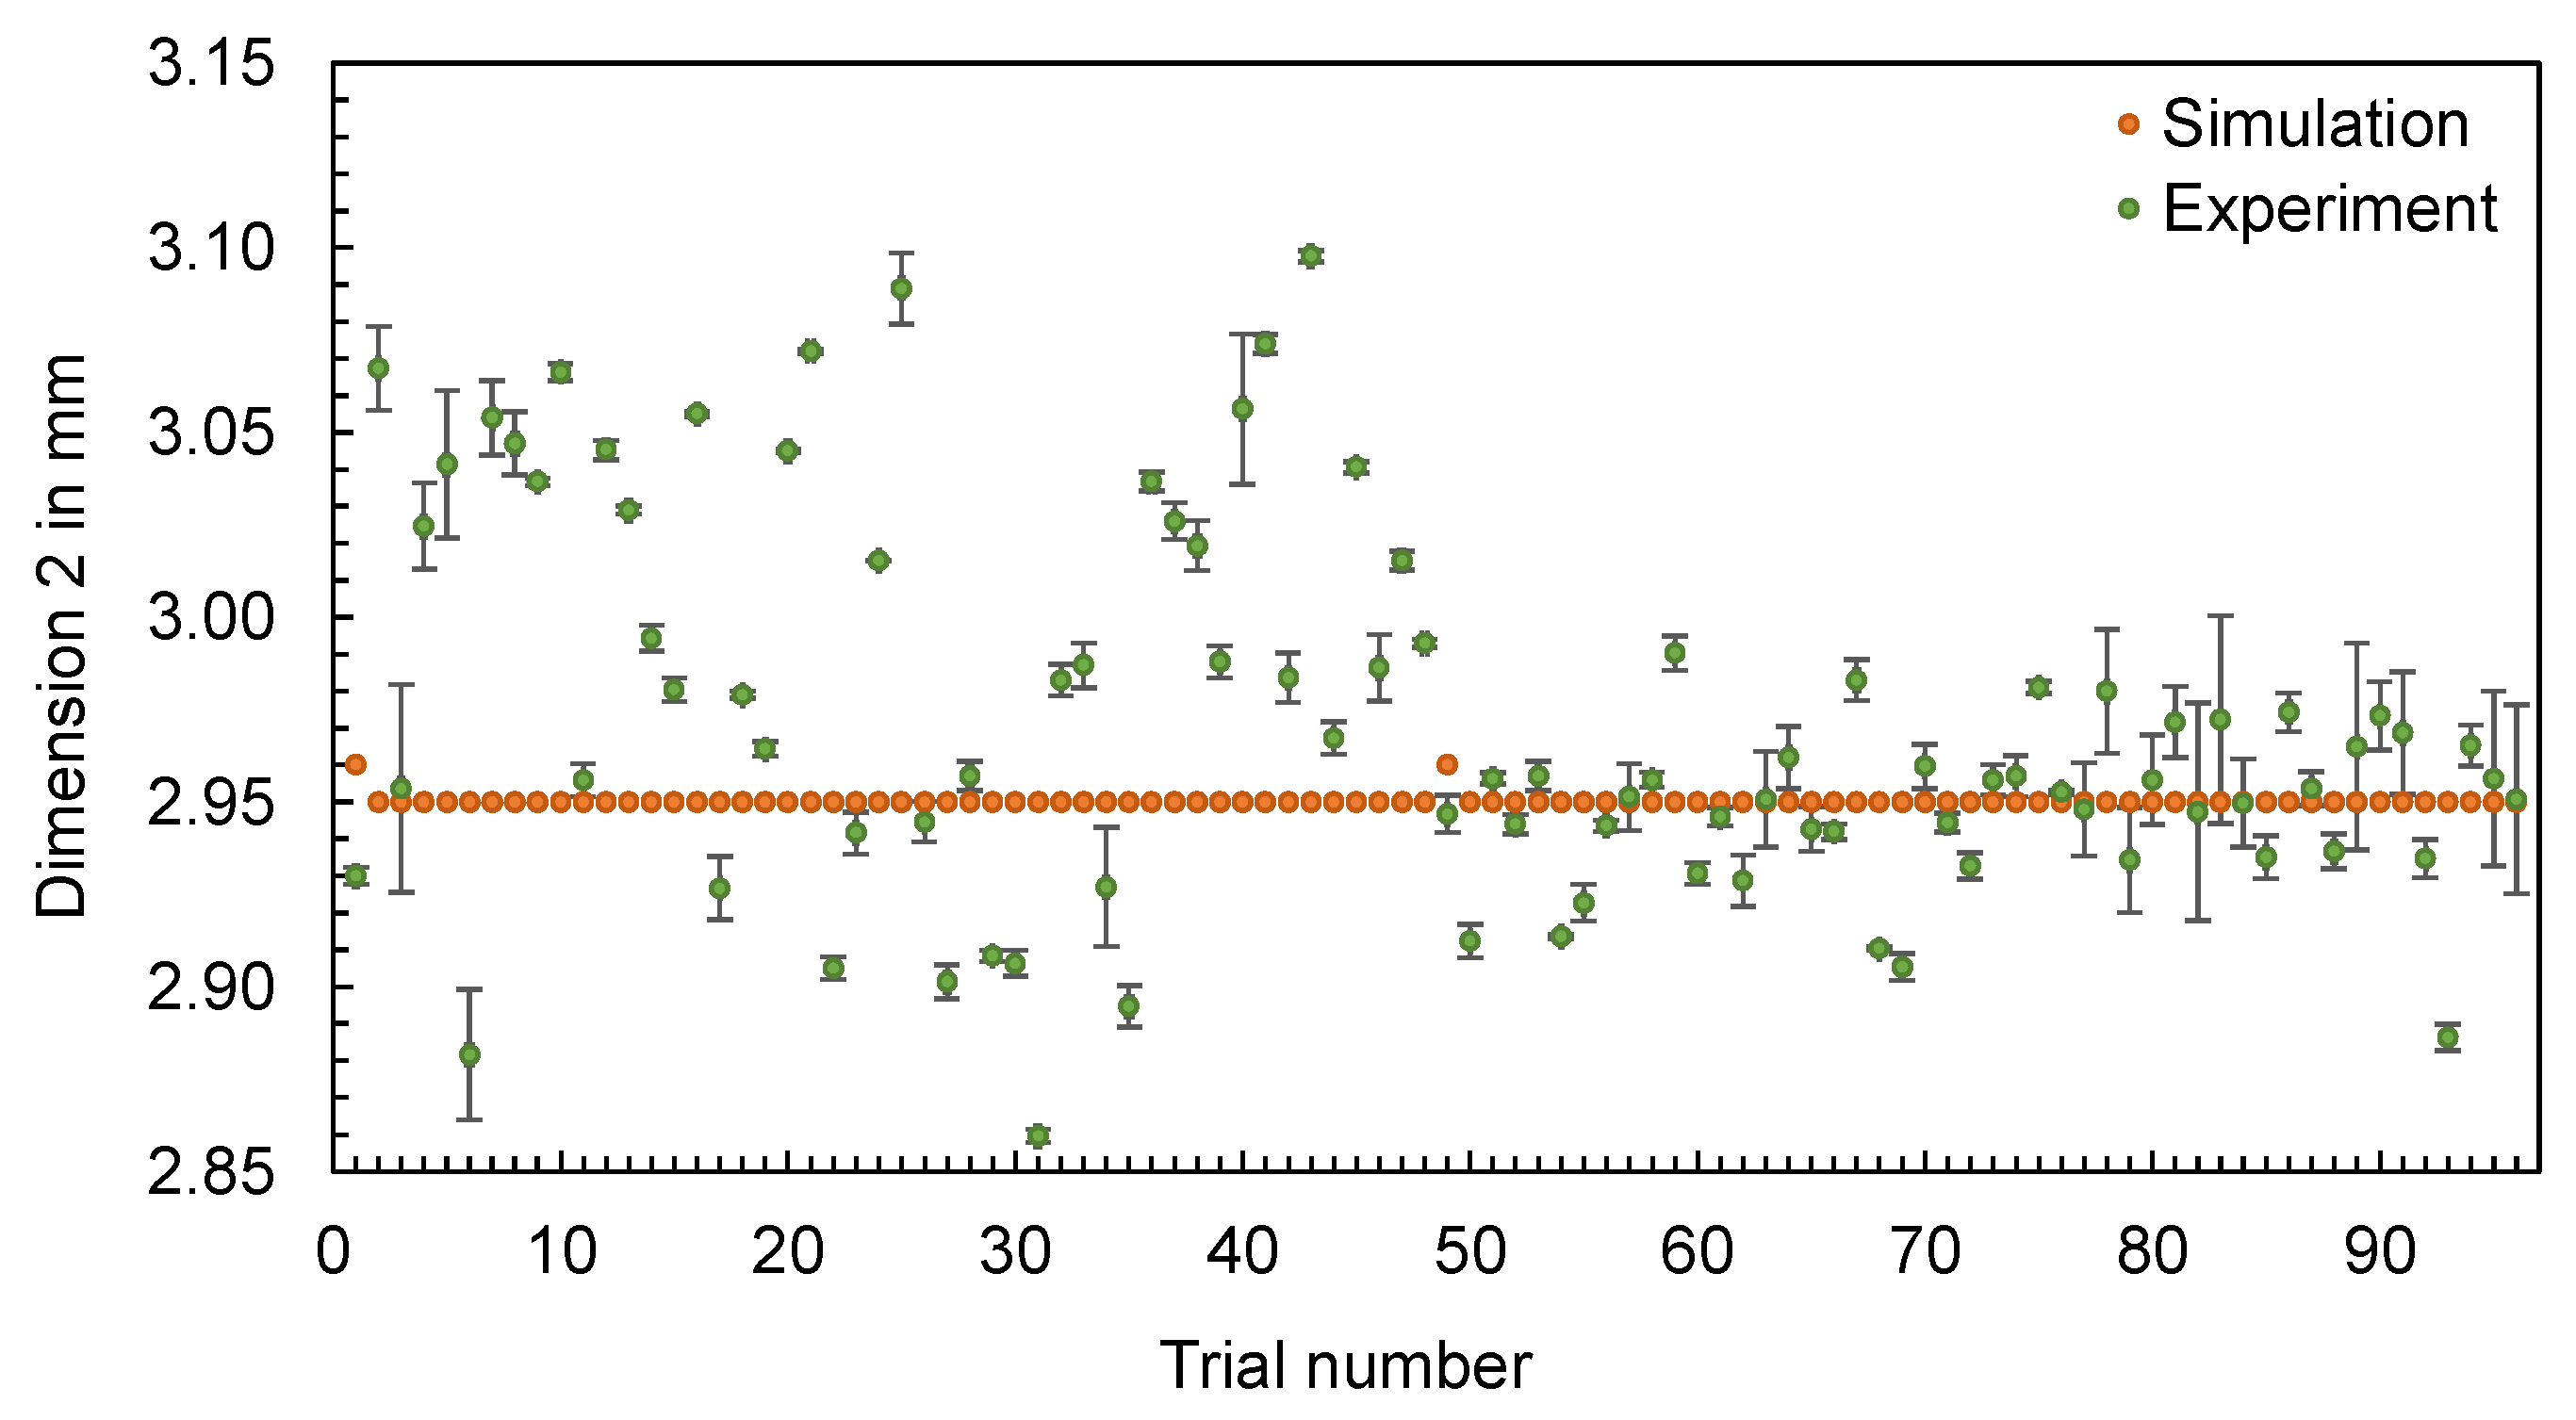
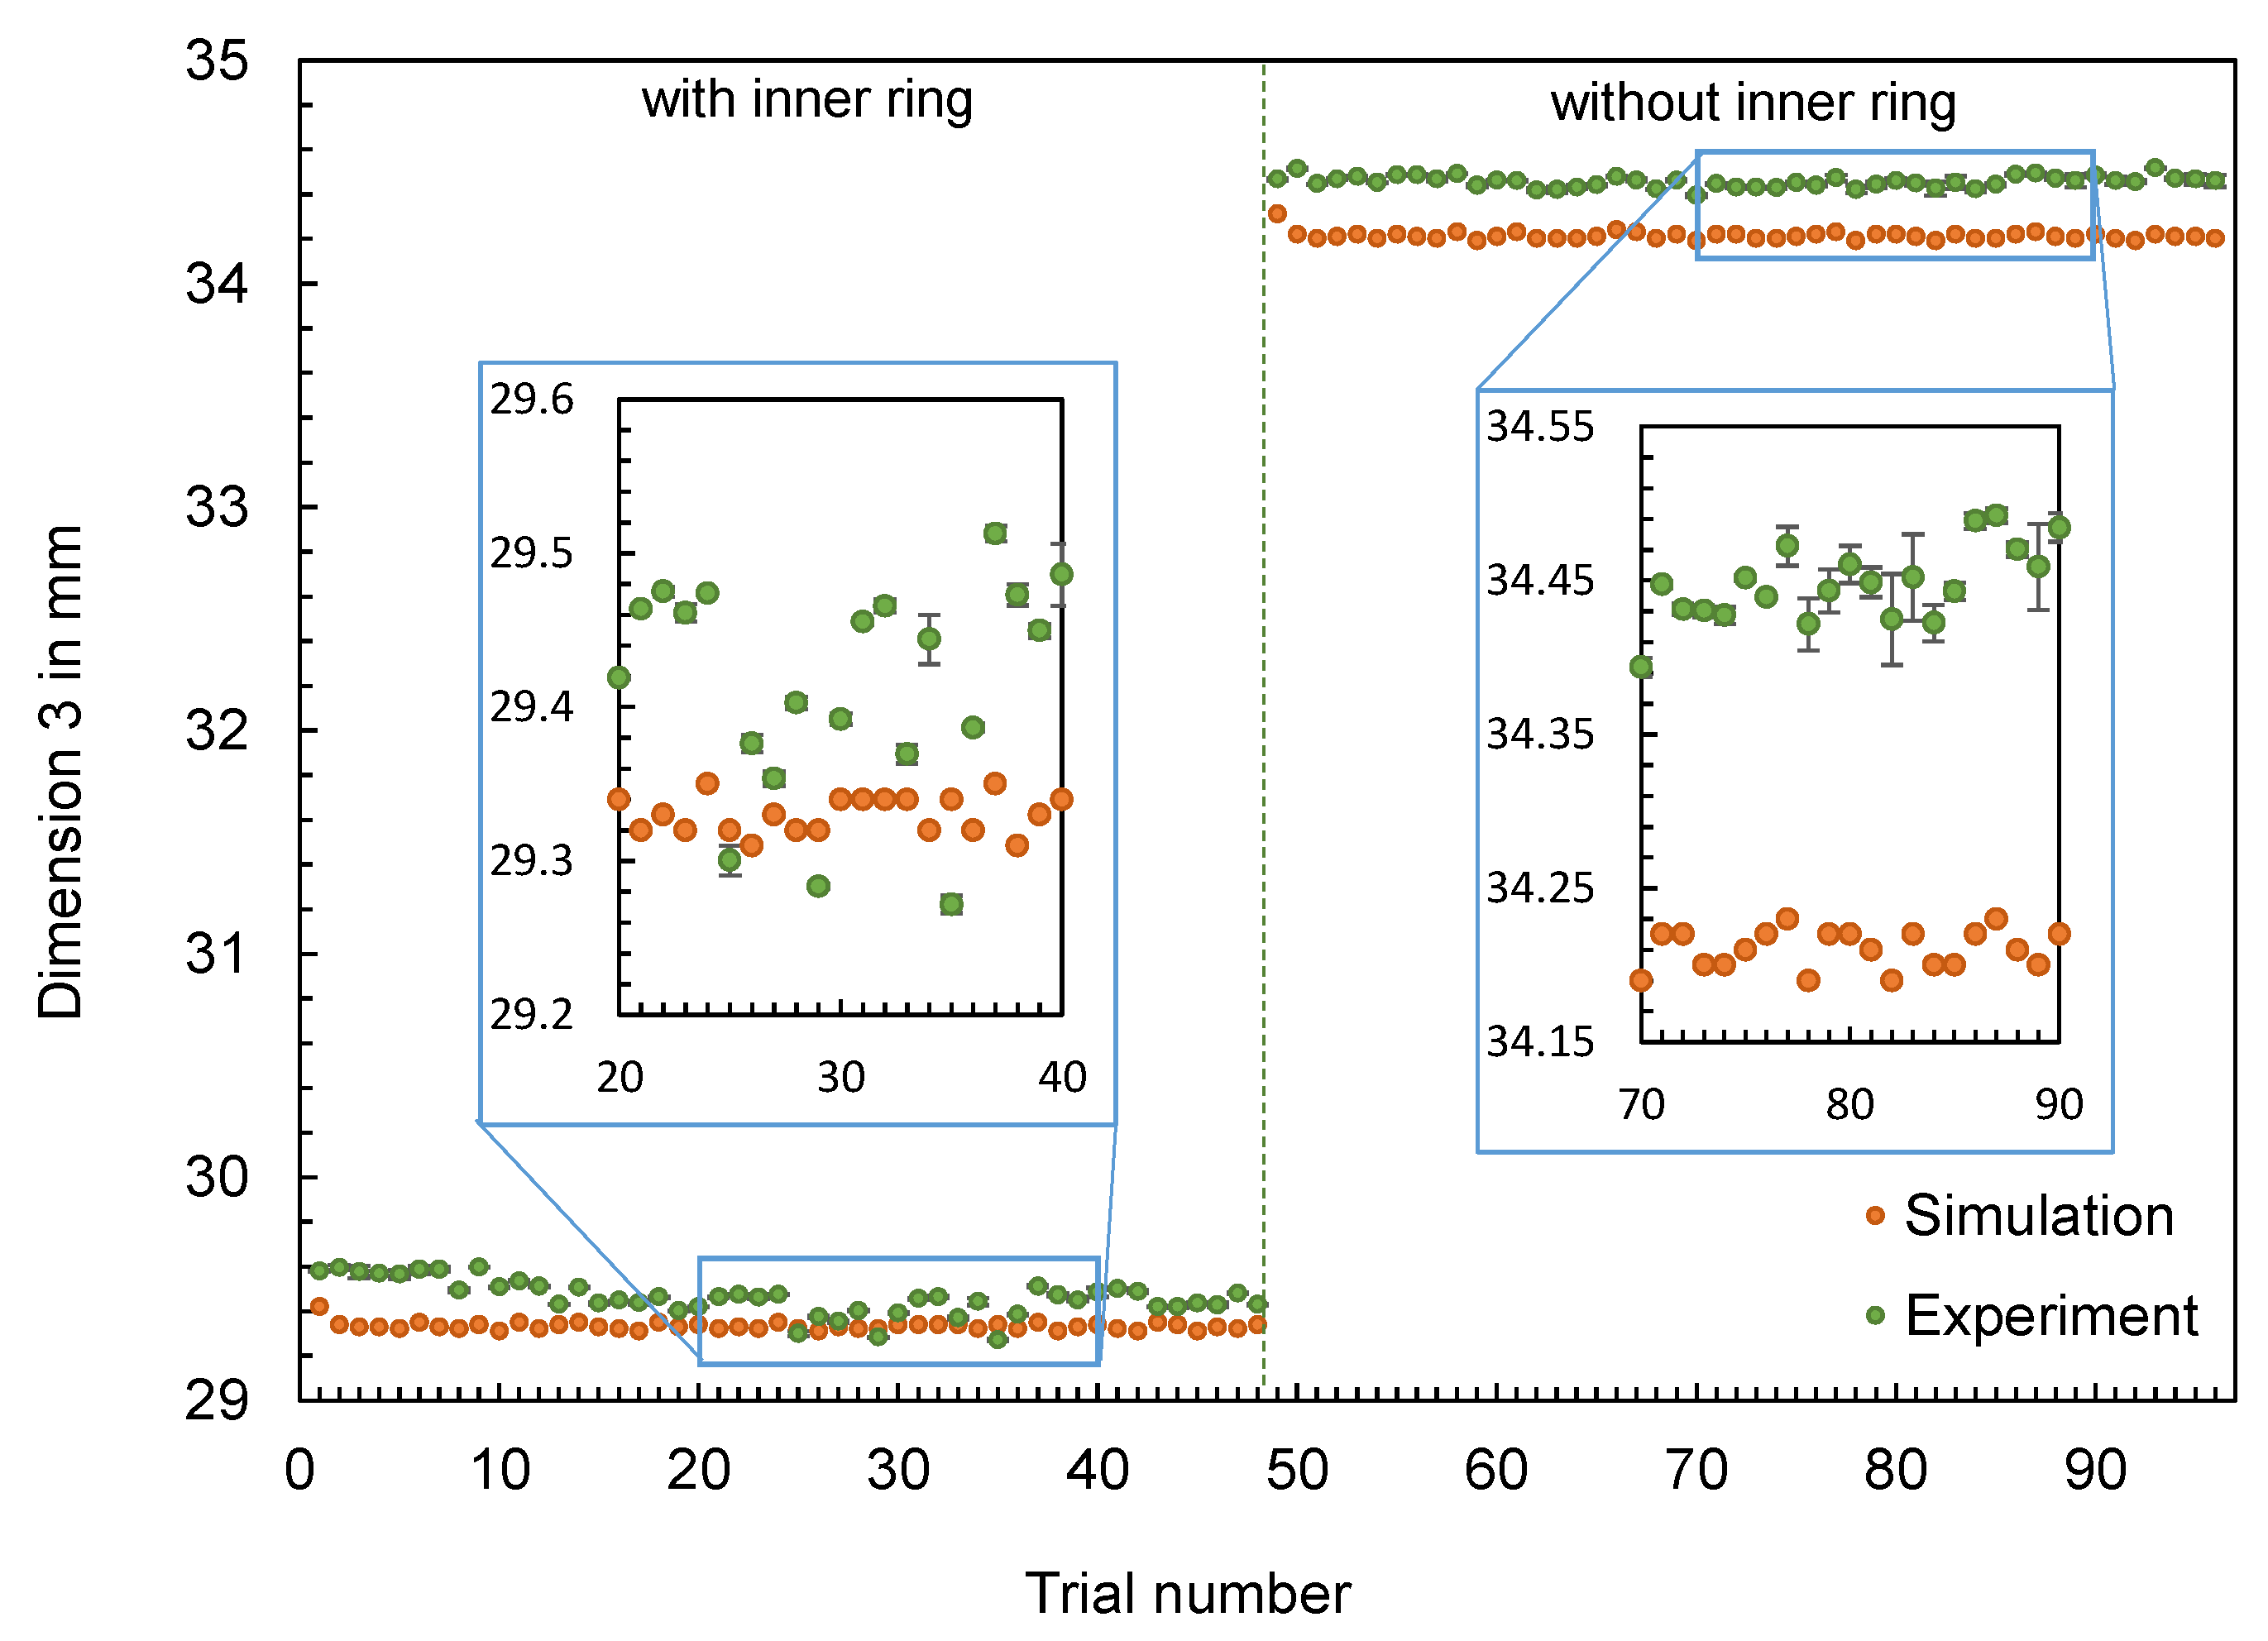
- When comparing the computed and experimentally measured characteristics of different injection molded parts, it was found that the congruence depends strongly on the respective characteristics under consideration. The comparison of the part masses showed a congruence of the values in some cases and a certain offset in others. Depending on the geometry considered, a different offset was found. In particular, the effect of changes in the operating point on the part mass was well reproduced by the simulation, although the magnitude of the change varied in comparison with the experiment. This was different when comparing various thicknesses of the flat bars or dimensions of the hexagonal shaped parts. In the experiment, changes in dimensions and thicknesses were identified, whereas the simulation showed partly constant or slightly scattered values. Thus, the effects of operating point variations during the experiments on the measured dimensions of the parts cannot be adequately computed by using the simulation model applied.
- In addition to the part characteristics, the time series of the process parameters injection pressure, flow rate, and cavity pressure measured in the experiment and computed by the simulation were compared. It was found that the simulation partly shows significant deviations from the time series measured during the process. The measured flow rates showed a time delay and an over-shooting in contrast to the time series computed. As a result of the offset, the injection times also differed. In addition, the injection pressure and cavity pressure showed significant deviations from the calculated time series. The potential causes are the negligence of the machine-specific behavior, the viscoelastic behavior, or disturbance variables occurring in the process. Further investigations with regard to the machine-specific behavior were carried out and are published in [39]. It was shown that the process, in particular the process dynamics, is essentially influenced by the specific and operating point dependent behavior of the injection molding machine. Neglecting these dynamics in the simulation consequently means that the calculated time series of the process parameters in particular show insufficient correspondence with the data measured in the experiment.
- The comparison of the pvT, viscosity, thermal conductivity, and MFR data measured with the material data used as an input for the simulation showed that deviations from the actual material properties can exist when using the material data from the database. This can be due to batch variations, changes in material production or differences in measurement procedure, among other things. Consequently, the material data itself can be responsible for a discrepancy between simulation and experiment.
- When analyzing the influence of the mesh parameters on the simulation result, it was shown that the computation of the part mass depends significantly on the selected GEL and the resulting volume of the tetrahedral elements. Likewise, a dependence on the NLT was shown, especially at low values. In contrast, when analyzing the influence of the mesh parameters on individual dimensions, no unambiguous dependence on the mesh parameters was shown. The partly random variations in the thickness as a result of mesh parameter variations suggest that the quality of the mesh in particular influences the quality of the dimension calculation. The influence of the mesh quality on the computed part characteristics should be investigated in more detail in further studies. For this purpose, GEL-NLT-pairs should be used that result in similar aspect ratios to investigate the influence of the mesh fineness on the computational result while maintaining the same mesh quality.
- A variation in the mesh parameters has no significant influence on the time series of the process parameters, especially compared to the experimentally measured data, which showed a large deviation from them. Consequently, the mesh parameters cannot be responsible for the discrepancy of the process parameters.
- The solver parameters have an influence on the number of calculated data points, but no influence on the course of the time series. Here it is recommended to choose the solver parameters in favor of the calculation time.
Author Contributions
Funding
Institutional Review Board Statement
Data Availability Statement
Conflicts of Interest
Appendix A
| Tc, °C | Heating Zones, °C |
|---|---|
| 250 | 250; 250; 245; 240; 235; 50 |
| 270 | 270; 270; 265; 260; 255; 50 |
| Trial Number | Tc, °C | Tm, °C | Qinj, cm3/s | ppack, Bar |
|---|---|---|---|---|
| 1 + j | 250 | 50 | 49 | 496 |
| 2 + j | 250 | 50 | 33 | 443 |
| 3 + j | 250 | 50 | 57 | 354 |
| 4 + j | 250 | 50 | 50 | 302 |
| 5 + j | 250 | 50 | 27 | 229 |
| 6 + j | 250 | 50 | 37 | 334 |
| 7 + j | 250 | 50 | 44 | 266 |
| 8 + j | 250 | 50 | 23 | 406 |
| 9 + j | 250 | 80 | 49 | 496 |
| 10 + j | 250 | 80 | 33 | 443 |
| 11 + j | 250 | 80 | 57 | 354 |
| 12 + j | 250 | 80 | 50 | 302 |
| 13 + j | 250 | 80 | 27 | 229 |
| 14 + j | 250 | 80 | 37 | 334 |
| 15 + j | 250 | 80 | 44 | 266 |
| 16 + j | 250 | 80 | 23 | 406 |
| 17 + j | 270 | 80 | 49 | 496 |
| 18 + j | 270 | 80 | 33 | 443 |
| 19 + j | 270 | 80 | 57 | 354 |
| 20 + j | 270 | 80 | 50 | 302 |
| 21 + j | 270 | 80 | 27 | 229 |
| 22 + j | 270 | 80 | 37 | 334 |
| 23 + j | 270 | 80 | 44 | 266 |
| 24 + j | 270 | 80 | 23 | 406 |
| 25 + j | 270 | 50 | 49 | 496 |
| 26 + j | 270 | 50 | 33 | 443 |
| 27 + j | 270 | 50 | 57 | 354 |
| 28 + j | 270 | 50 | 50 | 302 |
| 29 + j | 270 | 50 | 27 | 229 |
| 30 + j | 270 | 50 | 37 | 334 |
| 31 + j | 270 | 50 | 44 | 266 |
| 32 + j | 270 | 50 | 23 | 406 |
| Thickness di in mm | j |
|---|---|
| 4 | 0 |
| 3 | 32 |
| 2 | 64 |
| 5 | 96 |
| Trial Number | Core | Tc, °C | Tm, °C | Qinj, cm3/s | ppack, Bar |
|---|---|---|---|---|---|
| 1 | 0 | 250 | 50 | 53 | 377 |
| 2 | 0 | 250 | 50 | 24 | 445 |
| 3 | 0 | 250 | 50 | 48 | 353 |
| 4 | 0 | 250 | 50 | 28 | 361 |
| 5 | 0 | 250 | 50 | 54 | 302 |
| 6 | 0 | 250 | 50 | 32 | 494 |
| 7 | 0 | 250 | 50 | 21 | 403 |
| 8 | 0 | 250 | 50 | 44 | 291 |
| 9 | 0 | 250 | 50 | 38 | 437 |
| 10 | 0 | 250 | 50 | 26 | 255 |
| 11 | 0 | 250 | 50 | 45 | 469 |
| 12 | 0 | 250 | 50 | 35 | 319 |
| 13 | 0 | 250 | 70 | 21 | 412 |
| 14 | 0 | 250 | 70 | 50 | 472 |
| 15 | 0 | 250 | 70 | 53 | 348 |
| 16 | 0 | 250 | 70 | 27 | 329 |
| 17 | 0 | 250 | 70 | 32 | 269 |
| 18 | 0 | 250 | 70 | 35 | 486 |
| 19 | 0 | 250 | 70 | 24 | 362 |
| 20 | 0 | 250 | 70 | 30 | 419 |
| 21 | 0 | 250 | 70 | 47 | 304 |
| 22 | 0 | 250 | 70 | 40 | 376 |
| 23 | 0 | 250 | 70 | 42 | 281 |
| 24 | 0 | 250 | 70 | 55 | 449 |
| 25 | 0 | 270 | 70 | 26 | 382 |
| 26 | 0 | 270 | 70 | 39 | 262 |
| 27 | 0 | 270 | 70 | 34 | 362 |
| 28 | 0 | 270 | 70 | 42 | 301 |
| 29 | 0 | 270 | 70 | 22 | 331 |
| 30 | 0 | 270 | 70 | 34 | 466 |
| 31 | 0 | 270 | 70 | 53 | 427 |
| 32 | 0 | 270 | 70 | 56 | 412 |
| 33 | 0 | 270 | 70 | 30 | 446 |
| 34 | 0 | 270 | 70 | 48 | 346 |
| 35 | 0 | 270 | 70 | 18 | 497 |
| 36 | 0 | 270 | 70 | 44 | 291 |
| 37 | 0 | 270 | 50 | 57 | 496 |
| 38 | 0 | 270 | 50 | 28 | 287 |
| 39 | 0 | 270 | 50 | 35 | 377 |
| 40 | 0 | 270 | 50 | 44 | 427 |
| 41 | 0 | 270 | 50 | 47 | 314 |
| 42 | 0 | 270 | 50 | 39 | 261 |
| 43 | 0 | 270 | 50 | 49 | 468 |
| 44 | 0 | 270 | 50 | 52 | 414 |
| 45 | 0 | 270 | 50 | 25 | 299 |
| 46 | 0 | 270 | 50 | 22 | 357 |
| 47 | 0 | 270 | 50 | 33 | 336 |
| 48 | 0 | 270 | 50 | 20 | 453 |
| 49 | 1 | 270 | 50 | 46 | 373 |
| 50 | 1 | 270 | 50 | 23 | 482 |
| 51 | 1 | 270 | 50 | 33 | 291 |
| 52 | 1 | 270 | 50 | 39 | 384 |
| 53 | 1 | 270 | 50 | 51 | 441 |
| 54 | 1 | 270 | 50 | 37 | 303 |
| 55 | 1 | 270 | 50 | 27 | 414 |
| 56 | 1 | 270 | 50 | 20 | 432 |
| 57 | 1 | 270 | 50 | 42 | 329 |
| 58 | 1 | 270 | 50 | 56 | 472 |
| 59 | 1 | 270 | 50 | 29 | 264 |
| 60 | 1 | 270 | 50 | 48 | 351 |
| 61 | 1 | 270 | 70 | 22 | 476 |
| 62 | 1 | 270 | 70 | 19 | 361 |
| 63 | 1 | 270 | 70 | 56 | 285 |
| 64 | 1 | 270 | 70 | 52 | 303 |
| 65 | 1 | 270 | 70 | 44 | 339 |
| 66 | 1 | 270 | 70 | 32 | 497 |
| 67 | 1 | 270 | 70 | 36 | 454 |
| 68 | 1 | 270 | 70 | 47 | 326 |
| 69 | 1 | 270 | 70 | 44 | 434 |
| 70 | 1 | 270 | 70 | 26 | 268 |
| 71 | 1 | 270 | 70 | 39 | 411 |
| 72 | 1 | 270 | 70 | 30 | 392 |
| 73 | 1 | 250 | 70 | 38 | 317 |
| 74 | 1 | 250 | 70 | 46 | 290 |
| 75 | 1 | 250 | 70 | 48 | 379 |
| 76 | 1 | 250 | 70 | 37 | 400 |
| 77 | 1 | 250 | 70 | 41 | 459 |
| 78 | 1 | 250 | 70 | 26 | 302 |
| 79 | 1 | 250 | 70 | 31 | 428 |
| 80 | 1 | 250 | 70 | 24 | 481 |
| 81 | 1 | 250 | 70 | 55 | 370 |
| 82 | 1 | 250 | 70 | 52 | 259 |
| 83 | 1 | 250 | 70 | 28 | 448 |
| 84 | 1 | 250 | 70 | 20 | 343 |
| 85 | 1 | 250 | 50 | 38 | 297 |
| 86 | 1 | 250 | 50 | 30 | 473 |
| 87 | 1 | 250 | 50 | 51 | 453 |
| 88 | 1 | 250 | 50 | 33 | 408 |
| 89 | 1 | 250 | 50 | 23 | 343 |
| 90 | 1 | 250 | 50 | 54 | 425 |
| 91 | 1 | 250 | 50 | 48 | 320 |
| 92 | 1 | 250 | 50 | 35 | 269 |
| 93 | 1 | 250 | 50 | 25 | 496 |
| 94 | 1 | 250 | 50 | 21 | 395 |
| 95 | 1 | 250 | 50 | 42 | 357 |
| 96 | 1 | 250 | 50 | 47 | 286 |
| Study | GEL in mm | NLT | Mesh Elements | Study | GEL in mm | NLT | Mesh Elements | ||
|---|---|---|---|---|---|---|---|---|---|
| GEL = 0.4 mm | 0.4 | 10 | 3 857 649 | • | GEL = 0.8 mm | 0.8 | 10 | 1 301 581 | • |
| GEL = 2 mm | 2 | 10 | 169 822 | • | GEL = 4 mm | 4 | 10 | 47 834 | • |
| NLT = 4 | 1.9 | 4 | 107 424 | • | NLT = 4 | 3.8 | 4 | 22 334 | • |
| NLT = 40 | 1.9 | 40 | 708 698 | • | NLT = 40 | 3.8 | 40 | 196 992 | • |
References
- Kennedy, P.; Zheng, R. Flow Analysis of Injection Molds, 2nd ed.; Hanser Publishers: Munich, Germany; Cincinnati, OH, USA, 2013; ISBN 978-1-56990-512-8. [Google Scholar]
- Bhat, H.A.; Subramaniam, S.; Pillai, A.K.; Krishnan, L.E.; Elangovan, M. Analysis and design of mold for plastic side release buckle using Moldflow software. Int. J. Res. Eng. Technol. 2014, 3, 366–372. [Google Scholar]
- Gunawan, H.; Anggono, W. Improving quality of injection mold using Moldflow software simulation: Case study: New design plastic cup. In Proceedings of the International Seminar on Product Design and Development, Salzburg, Austria, 7–8 September 2006. [Google Scholar]
- Longzhi, Z.; Binghui, C.; Min, Y.; Shangbing, Z. Application of Moldflow software in design of injection mold. In Proceedings of the 2010 International Conference on Mechanic Automation and Control Engineering (MACE), Wuhan, China, 26–28 June 2010; pp. 243–245, ISBN 978-1-4244-7737-1. [Google Scholar]
- Cardozo, D. Three Models of the 3D Filling Simulation for Injection Molding: A Brief Review. J. Reinf. Plast. Compos. 2008, 27, 1963–1974. [Google Scholar] [CrossRef]
- Shoemaker, J. Moldflow Design Guide: A Resource for Plastics Engineers; Hanser: München, Germany, 2006; ISBN 9783446418547. [Google Scholar]
- Kamal, M.R.; Isayev, A.I.; Liu, S.-J. Injection Molding: Technology and Fundamentals; Hanser: München, Germany, 2009; ISBN 9783446416857. [Google Scholar]
- Kennedy, P.; Zheng, R. Polymer Injection Molding: Moldflow. In Encyclopedia of Materials: Science and Technology; Elsevier: Amsterdam, The Netherlands, 2001; pp. 7375–7378. ISBN 9780080431529. [Google Scholar]
- Laurien, E.; Oertel, H. Numerische Strömungsmechanik, 6th ed.; Springer Vieweg: Wiesbaden, Germany, 2018; ISBN 978-3-658-21059-5. [Google Scholar]
- Lecheler, S. Numerische Strömungsberechnung: Schneller Einstieg Durch Anschauliche Beispiele, 2nd ed.; Vieweg+Teubner: Wiesbaden, Germany, 2011; ISBN 9783834815682. [Google Scholar]
- Turek, S. A comparative study of time-stepping techniques for the incompressible Navier-Stokes equations: From fully implicit non-linear schemes to semi-implicit projection methods. Int. J. Numer. Methods Fluids 1996, 22, 987–1011. [Google Scholar]
- Turek, S. Efficient Solvers for Incompressible Flow Problems: An Algorithmic and Computational Approach; Springer: Berlin/Heidelberg, Germany, 1999; ISBN 978-3-642-63573-1. [Google Scholar]
- Park, K. A Study on Flow Simulation and Deformation Analysis for Injection-Molded Plastic Parts Using Three-Dimensional Solid Elements. Polym.-Plast. Technol. Eng. 2005, 43, 1569–1585. [Google Scholar] [CrossRef]
- Cross, M.M. Rheology of non-Newtonian fluids: A new flow equation for pseudoplastic systems. J. Colloid Sci. 1965, 20, 417–437. [Google Scholar] [CrossRef]
- Williams, M.L.; Landel, R.F.; Ferry, J.D. The Temperature Dependence of Relaxation Mechanisms in Amorphous Polymers and Other Glass-forming Liquids. J. Am. Chem. Soc. 1955, 77, 3701–3707. [Google Scholar] [CrossRef]
- Ferry, J.D. Viscoelastic Properties of Polymers, 3rd ed.; Wiley: New York, NY, USA, 1980; ISBN 0471048941. [Google Scholar]
- Autodesk Inc. Cross-WLF Viscosity Model: Autodesk Moldflow Insight 2023. Available online: https://help.autodesk.com/view/MFIA/2023/ENU/?guid=MoldflowInsight_CLC_Ref_Materials_sim_math_models_Cross_WLF_viscosity_model_html (accessed on 13 April 2024).
- Autodesk Inc. 2-Domain Tait pvT Model. Available online: https://help.autodesk.com/view/MFIA/2023/ENU/?guid=MoldflowInsight_CLC_Ref_Materials_sim_math_models_2_domain_Tait_pvT_model_html (accessed on 13 April 2024).
- Chang, R.Y.; Chen, C.H.; Su, K.S. Modifying the tait equation with cooling-rate effects to predict the pressure–volume–temperature behaviors of amorphous polymers: Modeling and experiments. Polym. Eng. Sci. 1996, 36, 1789–1795. [Google Scholar] [CrossRef]
- Ali, M.A.; Salmah, S.; Abdullah, Z.; Liew, P.J.; Muhamad, M.R.; Izamshah, R.; Hadzley, M.; Abdullah, A.; Marjom, Z. Effect of Different Coolant Medium on Warpage Deflection Using Moldflow Insight Analysis. AMM 2015, 761, 42–46. [Google Scholar] [CrossRef]
- Amran, M.A.M.; Idayu, N.; Faizal, K.M.; Sanusi, M.; Izamshah, R.; Shahir, M. Part weight verification between simulation and experiment of plastic part in injection moulding process. IOP Conf. Ser. Mater. Sci. Eng. 2016, 160, 12016. [Google Scholar] [CrossRef]
- Divekar, M.; Gaval, V.R.; Wonisch, A. Improvement of warpage prediction through integrative simulation approach for thermoplastic material. J. Thermoplast. Compos. Mater. 2022, 35, 1231–1248. [Google Scholar] [CrossRef]
- Marin, F.; Souza, A.F.d.; Pabst, R.G.; Ahrens, C.H. Influences of the mesh in the CAE simulation for plastic injection molding. Polímeros 2019, 29, 654. [Google Scholar] [CrossRef]
- Fischer, K. Expertensystem für die Entwicklung Spritzgegossener Formteile aus Polymeren Werkstoffen. Ph.D. Thesis, Montanuniversität Leoben, Leoben, Austria, 2007. [Google Scholar]
- Guerrier, P.; Tosello, G.; Hattel, J.H. Flow visualization and simulation of the filling process during injection molding. CIRP J. Manuf. Sci. Technol. 2017, 16, 12–20. [Google Scholar] [CrossRef]
- Heinisch, J. Einsatz von Maschinellen Lernverfahren zur Einrichtung von Spritzgießprozessen. Ph.D. Thesis, RWTH Aachen, Aachen, Germany, 2021. [Google Scholar]
- Tercan, H.; Guajardo, A.; Heinisch, J.; Thiele, T.; Hopmann, C.; Meisen, T. Transfer-Learning: Bridging the Gap between Real and Simulation Data for Machine Learning in Injection Molding. Procedia CIRP 2018, 72, 185–190. [Google Scholar] [CrossRef]
- Loaldi, D.; Regi, F.; Baruffi, F.; Calaon, M.; Quagliotti, D.; Zhang, Y.; Tosello, G. Experimental Validation of Injection Molding Simulations of 3D Microparts and Microstructured Components Using Virtual Design of Experiments and Multi-Scale Modeling. Micromachines 2020, 11, 614. [Google Scholar] [CrossRef] [PubMed]
- Żurawik, R.; Volke, J.; Zarges, J.-C.; Heim, H.-P. Comparison of Real and Simulated Fiber Orientations in Injection Molded Short Glass Fiber Reinforced Polyamide by X-ray Microtomography. Polymers 2021, 14, 29. [Google Scholar] [CrossRef] [PubMed]
- Köhler, D.; Gröger, B.; Kupfer, R.; Hornig, A.; Gude, M. Experimental and Numerical Studies on the Deformation of a Flexible Wire in an Injection Moulding Process. Procedia Manuf. 2020, 47, 940–947. [Google Scholar] [CrossRef]
- Oikonomou, D.; Heim, H.-P. Analysis and Validation of Varied Simulation Parameters in the Context of Thermoplastic Foams and Special Injection Molding Processes. Polymers 2023, 15, 2119. [Google Scholar] [CrossRef] [PubMed]
- Shi, F.; Lou, Z.L.; Zhang, Y.Q. Optimisation of Plastic Injection Moulding Process with Soft Computing. Int. J. Adv. Manuf. Technol. 2003, 21, 656–661. [Google Scholar] [CrossRef]
- BASF SE. Processing Data Sheet Ultramid B3S. Available online: https://download.basf.com/p1/8a8082587fd4b608017fd65d6e0d5a4d/en/ULTRAMID%3Csup%3E%C2%AE%3Csup%3E_B3S (accessed on 10 October 2023).
- Keyence Corporation. Digitaler Messprojektor: Modell IM-7020. Available online: https://www.keyence.de/products/measure-sys/image-measure/im-7000/models/im-7020/ (accessed on 28 April 2023).
- Bogedale, L.; Doerfel, S.; Schrodt, A.; Heim, H.-P. Online Prediction of Molded Part Quality in the Injection Molding Process Using High-Resolution Time Series. Polymers 2023, 15, 978. [Google Scholar] [CrossRef]
- Autodesk, Inc. Moldflow: Simulation für Spritzguss und Spritzprägen von Kunststoffteilen für die Konstruktion und Fertigung. Available online: https://www.autodesk.de/products/moldflow/overview (accessed on 29 April 2023).
- Chen, J.-Y.; Tseng, C.-C.; Huang, M.-S. Quality Indexes Design for Online Monitoring Polymer Injection Molding. Adv. Polym. Technol. 2019, 2019, 3720127. [Google Scholar] [CrossRef]
- Hopmann, C.; Grüner, B. Vorhersage robuster Prozesse während der Produktentwicklung. IKV-Fachtag. Kunststoffverarbeitung 2015. [Google Scholar]
- Knoll, J.; Heim, H.-P. Analysis of the machine-specific behavior of injection molding machines. Polymers 2024, 16, 54. [Google Scholar] [CrossRef] [PubMed]
- Freytag, R.; Pérez Gil, J.A.; Forstner, R. pvT-Behavior of Polymers under Processing Conditions and Implementation in the Process Simulation. MSF 2015, 825–826, 677–684. [Google Scholar] [CrossRef]
- Vietri, U.; Sorrentino, A.; Speranza, V.; Pantani, R. Improving the predictions of injection molding simulation software. Polym. Eng. Sci. 2011, 51, 2542–2551. [Google Scholar] [CrossRef]
- Dawson, A.; Rides, M.; Urquhart, J.; Brown, C.S. Thermal conductivity of polymer melts and implications of uncertainties in data for process simulation. Cerca con Google 2000, 1–17. [Google Scholar]
- Finkeldey, F.; Volke, J.; Zarges, J.-C.; Heim, H.-P.; Wiederkehr, P. Learning quality characteristics for plastic injection molding processes using a combination of simulated and measured data. J. Manuf. Process. 2020, 60, 134–143. [Google Scholar] [CrossRef]
- Wang, J.; Xie, P.; Ding, Y.; Yang, W. On-line testing equipment of P–V–T properties of polymers based on an injection molding machine. Polym. Test. 2009, 28, 228–234. [Google Scholar] [CrossRef]
- Wang, J.; Hopmann, C.; Kahve, C.; Hohlweck, T.; Alms, J. Measurement of specific volume of polymers under simulated injection molding processes. Mater. Des. 2020, 196, 109136. [Google Scholar] [CrossRef]
- Autodesk Inc. Autodesk Moldflow Data Fitting 2024. Available online: https://www.autodesk.de/support/technical/article/caas/tsarticles/tsarticles/DEU/ts/1WgxFaOkbZzVyHh1akqqfx.html (accessed on 12 April 2024).
- Wang, J. Some Critical Issues for Injection Molding: PVT Properties of Polymers for Injection Molding; IntechOpen: London, UK, 2012; ISBN 978-953-51-0297-7. [Google Scholar]
- ASTM D 5930; Standard Test Method for Thermal Conductivity of Plastics by Means of a Transient Line-Source Technique. 2017. Available online: https://www.dinmedia.de/de/norm/astm-d-5930/279278120 (accessed on 21 April 2024).
- BASF SE. Product Information Ultramid B3S. Available online: https://download.basf.com/p1/8a8081c57fd4b609017fd636717a3e69/en/ULTRAMID%3Csup%3E%C2%AE%3Csup%3E_B3S_Product_Data_Sheet_Asia_PacificEurope_English.pdf?view (accessed on 21 April 2024).
- Chan, W.L.; Daver, F.; Friedl, C. Transient Polymer Flow Rate in Injection Mold Filling. Int. Polym. Process. 2000, 15, 304–312. [Google Scholar] [CrossRef]
- Autodesk Inc. Autodesk Moldflow Insight 2023: Flow Rate Result, Shown in the Analysis Log. Available online: https://help.autodesk.com/view/MFIA/2023/ENU/?guid=MoldflowInsight_CLC_Results_Fill_or_flow_results_Flow_rate_result_shown_in_the_html (accessed on 25 April 2024).
- Autodesk Inc. Autodesk Moldflow Insight 2023: Flow Rate in Analysis Log Does Not Match Specified Flow Rate in Moldflow. Available online: https://help.autodesk.com/view/MFIA/2023/ENU/?caas=caas/sfdcarticles/sfdcarticles/Flow-rate-in-analysis-log-does-not-match-specified-flow-rate-in-Moldflow.html (accessed on 25 April 2024).
- Zarges, J.-C.; Sälzer, P.; Feldmann, M.; Heim, H.-P. Determining Viscosity Directly in the Injection Molding Process: In-line Rheometer for Natural-Fiber-Reinforced Plastics. Kunststoffe Int. 2016, 10, 106–109. [Google Scholar]
- Selvasankar, R.K. Rheological Characterisation of Polymer Melts on an Injection Moulding Machine Using a New Slit Die Measurement System. Master’s Thesis, Montanuniversitaet Leoben, Leoben, Austria, 2008. [Google Scholar]















| A | B | |
|---|---|---|
| Test specimen (assembled mold) | Flat bar | Hexagonal shaped parts |
| Clamping force, kN | 500 | 1100 |
| Max. injection flow rate, cm3/s | 66 | 136 |
| Screw diameter, mm | 25 | 30 |
| Nozzle diameter, mm | 4 | 3 |
| Max. injection pressure, bar | 2500 | 2000 |
| Calculated stroke volume, cm3 | 59 | 85 |
| Effective screw length (length/diameter), - | 24 | 20 |
| Drive | hydromechanic | |
| Parameter | Flat Bar | Hexagonal Shaped Part |
|---|---|---|
| Mesh type | 3D Tetrahedra | 3D Tetrahedra |
| Global edge length, mm | 1 | 0.75 |
| Number of layers | 16 | 20 |
| Solver | Coupled 3D | Coupled 3D |
| Solution type | Stokes | Stokes |
| Viscosity model | Cross-WLF | Cross-WLF |
| Hot runner | no | yes |
| Gate diameter at injection locations | 3 mm | 2 mm |
| Mold dimensions | 300 mm × 140 mm × 160 mm | - |
| Velocity/pressure switch-over control | By % volume filled | By % volume filled |
| Switch-over, Percentage volume of the part | 98% | 99% |
| Maximum % volume to fill per time step | 1% | 1% |
| Maximum iterations per time step (filling and packing) | 50 | 50 |
| Maximum time step packing | 0.088 s | 0.088 s |
| Operating Point | Tc, °C | Tm, °C | Qinj, cm3/s | ppack, Bar |
|---|---|---|---|---|
| 1 | 250 | 50 | 27 | 229 |
| 2 | 270 | 80 | 57 | 354 |
| Study | MVFTS = 0.1% | MVFTS = 100% | IRF = 0 | IRF = 100 | |
|---|---|---|---|---|---|
| Solver Parameter | |||||
| Filling parameters | |||||
| Maximum % volume to fill per time step (MVFTS) | 0.1 | 100 | 1 | 1 | |
| Maximum iterations per time step | 50 | 50 | 50 | 50 | |
| Convergence tolerance (scaling factor) | 1 | 1 | 1 | 1 | |
| Packing parameters | |||||
| Maximum time step | 0.088 s | 0.088 s | 0.088 s | 0.088 s | |
| Maximum iterations per time step | 50 | 50 | 50 | 50 | |
| Convergence tolerance (scaling factor) | 1 | 1 | 1 | 1 | |
| Intermediate results | |||||
| Number of intermediate results in filling phase (IRF) | 20 | 20 | 0 | 100 | |
| Number of intermediate results in packing phase | 20 | 20 | 20 | 20 | |
| Number of intermediate results in cooling phase | 20 | 20 | 20 | 20 | |
Disclaimer/Publisher’s Note: The statements, opinions and data contained in all publications are solely those of the individual author(s) and contributor(s) and not of MDPI and/or the editor(s). MDPI and/or the editor(s) disclaim responsibility for any injury to people or property resulting from any ideas, methods, instructions or products referred to in the content. |
© 2024 by the authors. Licensee MDPI, Basel, Switzerland. This article is an open access article distributed under the terms and conditions of the Creative Commons Attribution (CC BY) license (https://creativecommons.org/licenses/by/4.0/).
Share and Cite
Knoll, J.; Heim, H.-P. Analysis of the Similarity between Injection Molding Simulation and Experiment. Polymers 2024, 16, 1265. https://doi.org/10.3390/polym16091265
Knoll J, Heim H-P. Analysis of the Similarity between Injection Molding Simulation and Experiment. Polymers. 2024; 16(9):1265. https://doi.org/10.3390/polym16091265
Chicago/Turabian StyleKnoll, Julia, and Hans-Peter Heim. 2024. "Analysis of the Similarity between Injection Molding Simulation and Experiment" Polymers 16, no. 9: 1265. https://doi.org/10.3390/polym16091265
APA StyleKnoll, J., & Heim, H.-P. (2024). Analysis of the Similarity between Injection Molding Simulation and Experiment. Polymers, 16(9), 1265. https://doi.org/10.3390/polym16091265


