
Study on the Low-Velocity Impact Response and Damage Mechanisms of Thermoplastic Composites

 , ,
, , 
Abstract
1. Introduction
2. Experiments
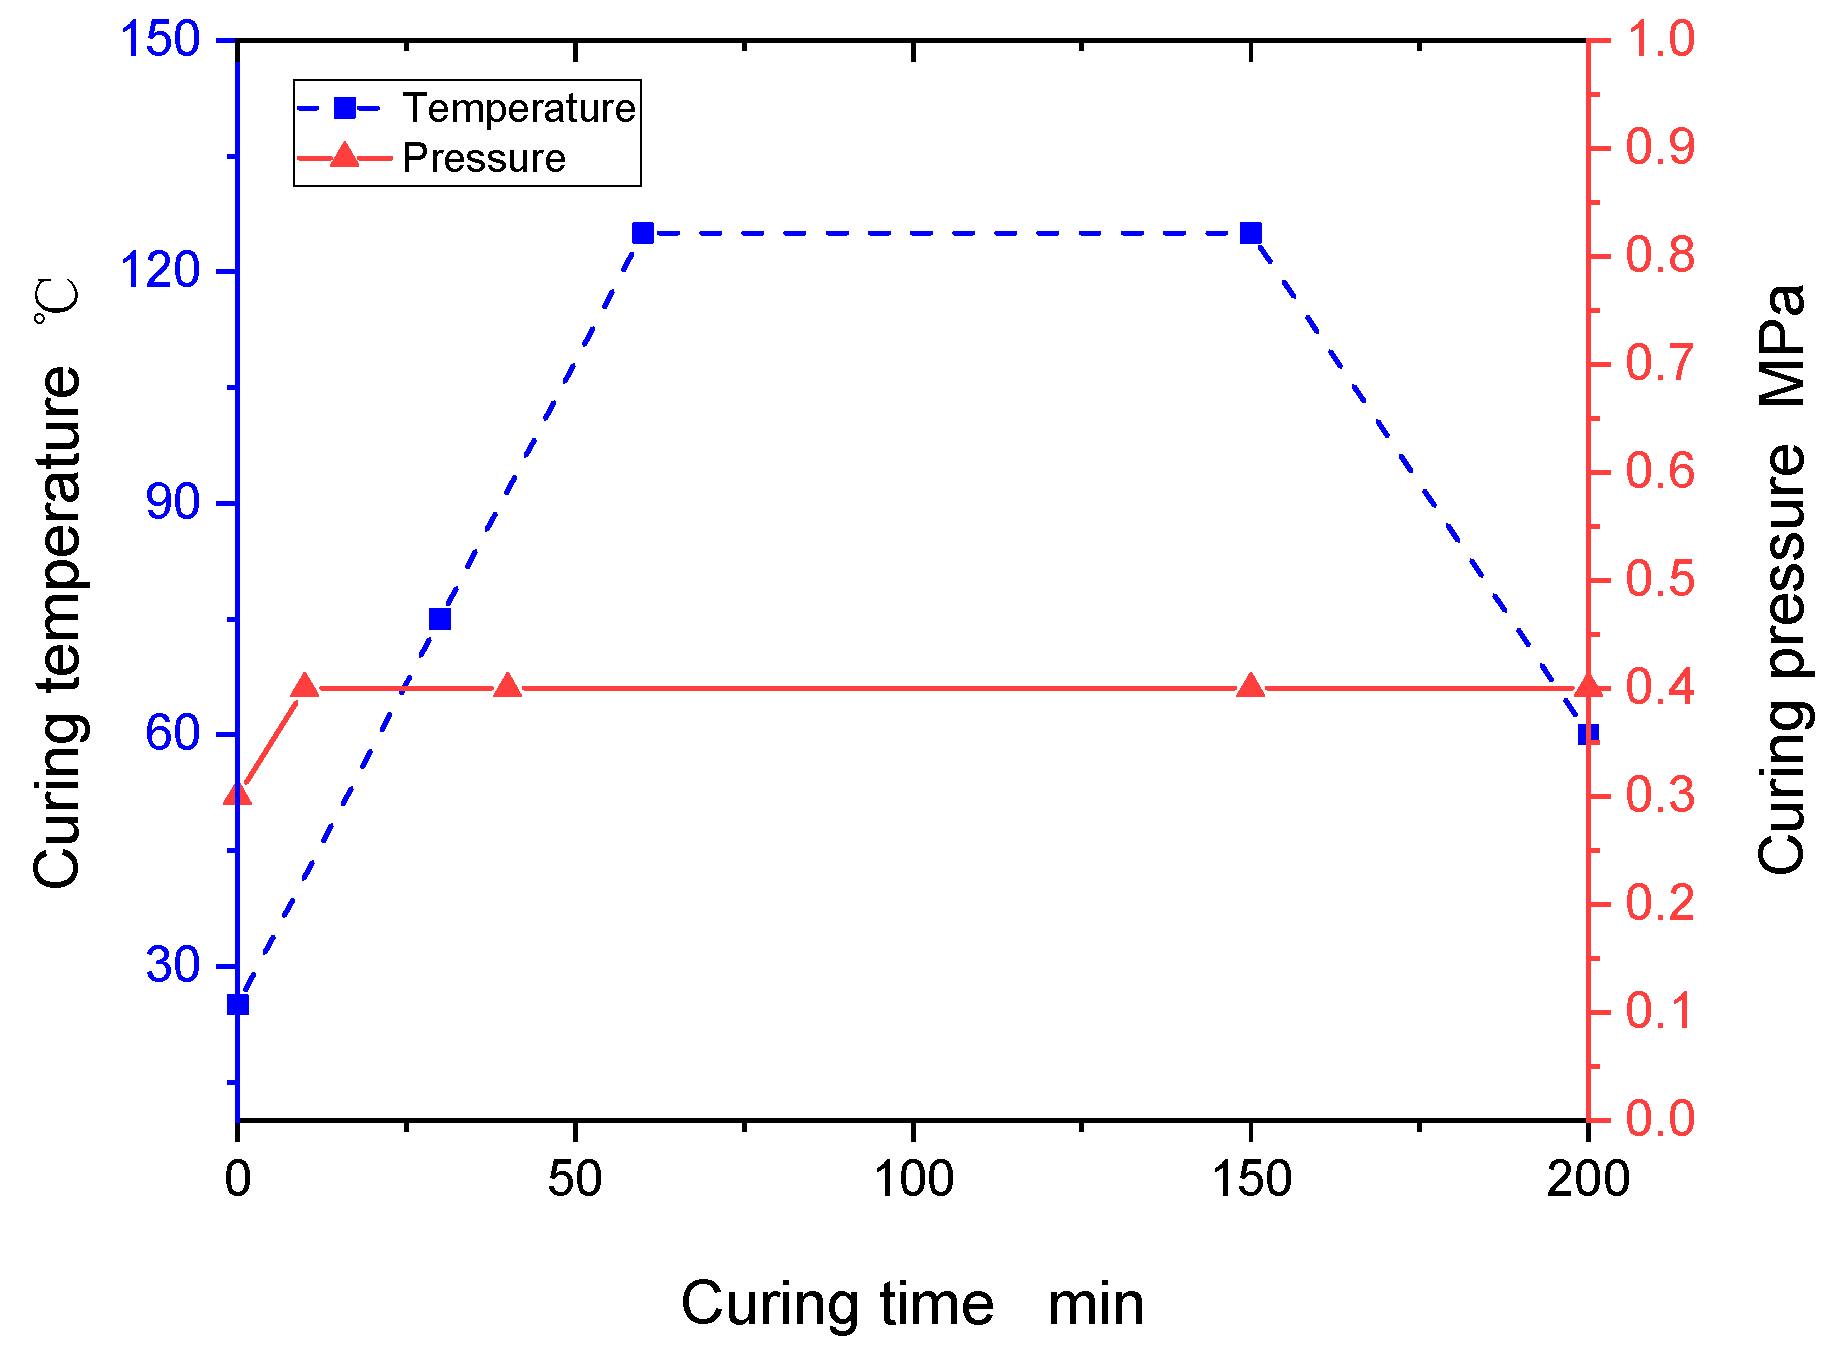
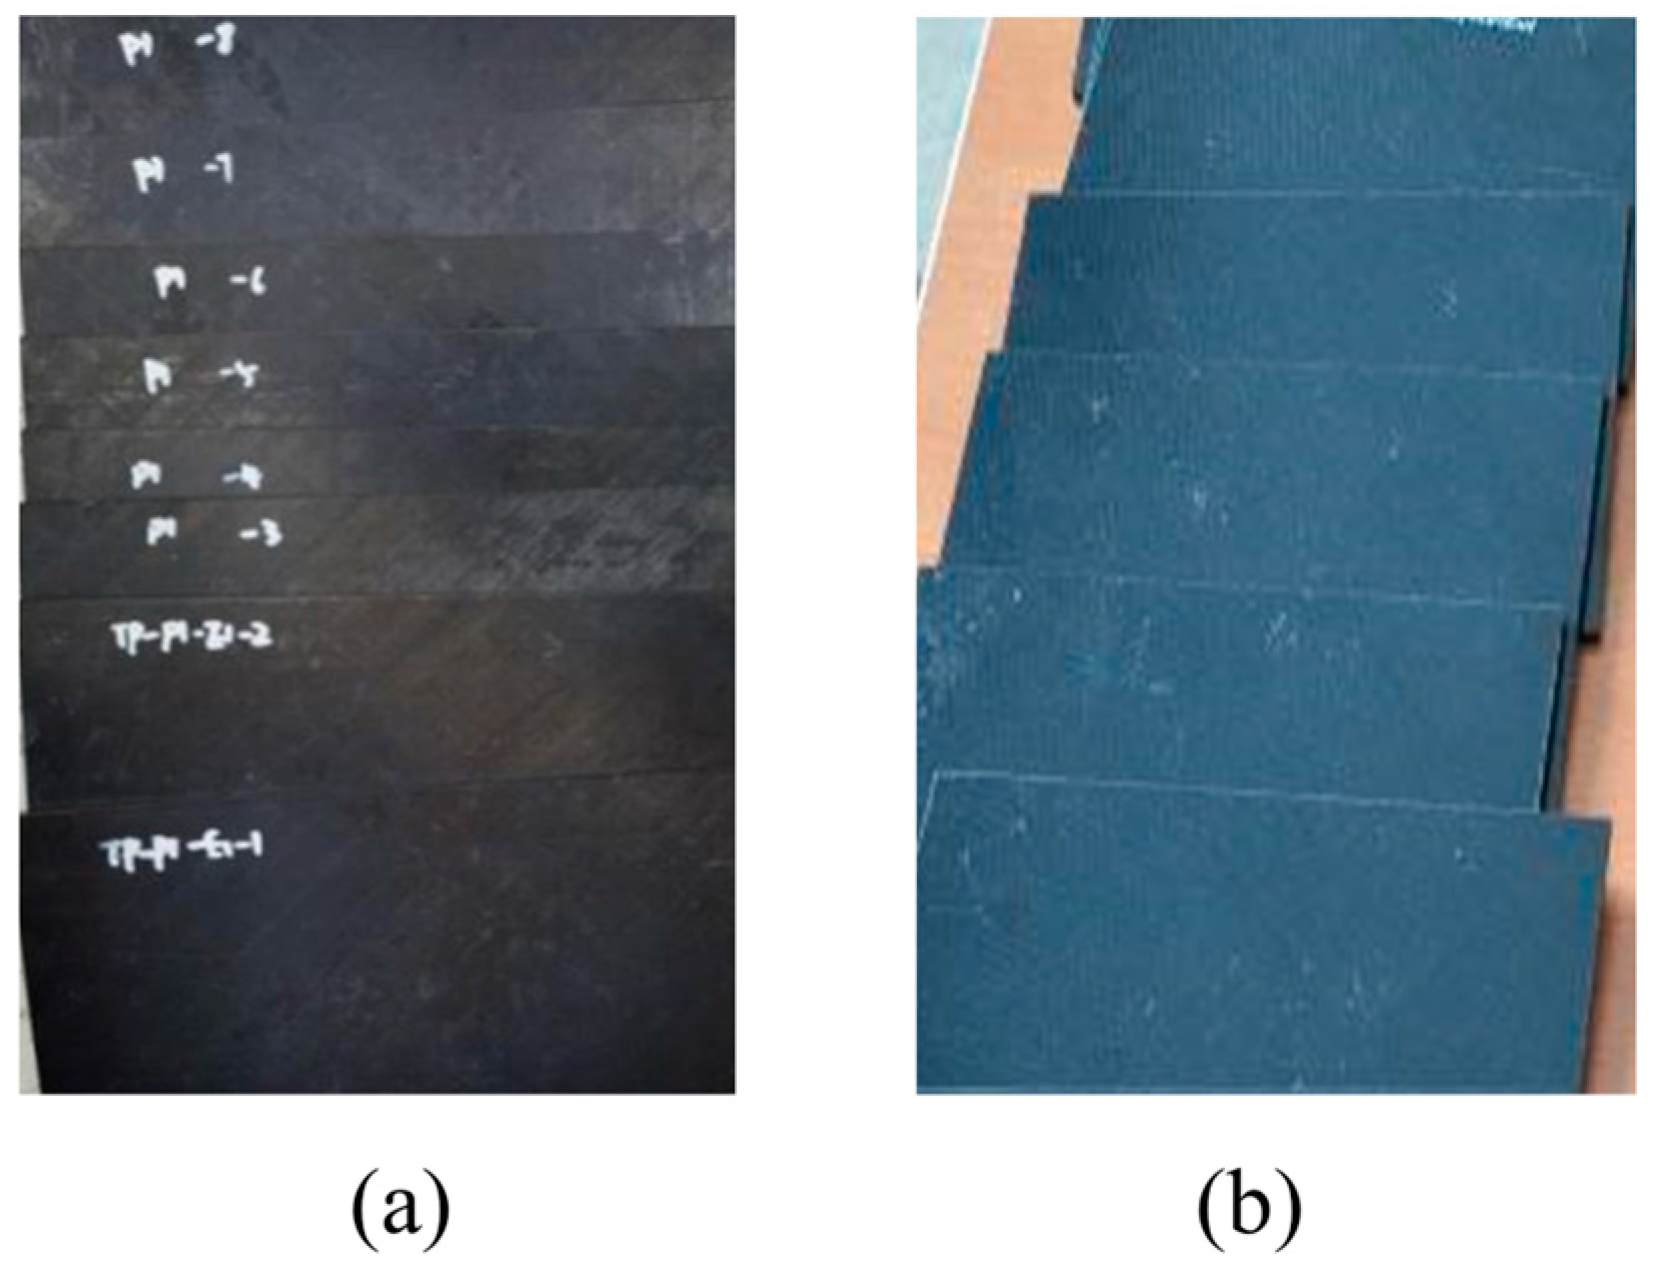
2.1. Materials
2.2. Method
2.3. Experimental Procedure
3. Impact Damage of Composite Laminates
3.1. Influence of Materials and Layers on Damage Morphology
3.2. Influence of Materials and Layers on Impact Force
3.3. Influence of Materials and Layers on Energy Absorption
3.4. Influence of Material and Stacking Sequence on Indentation Depth
3.5. Influence of Materials and Layers on the Damaged Area
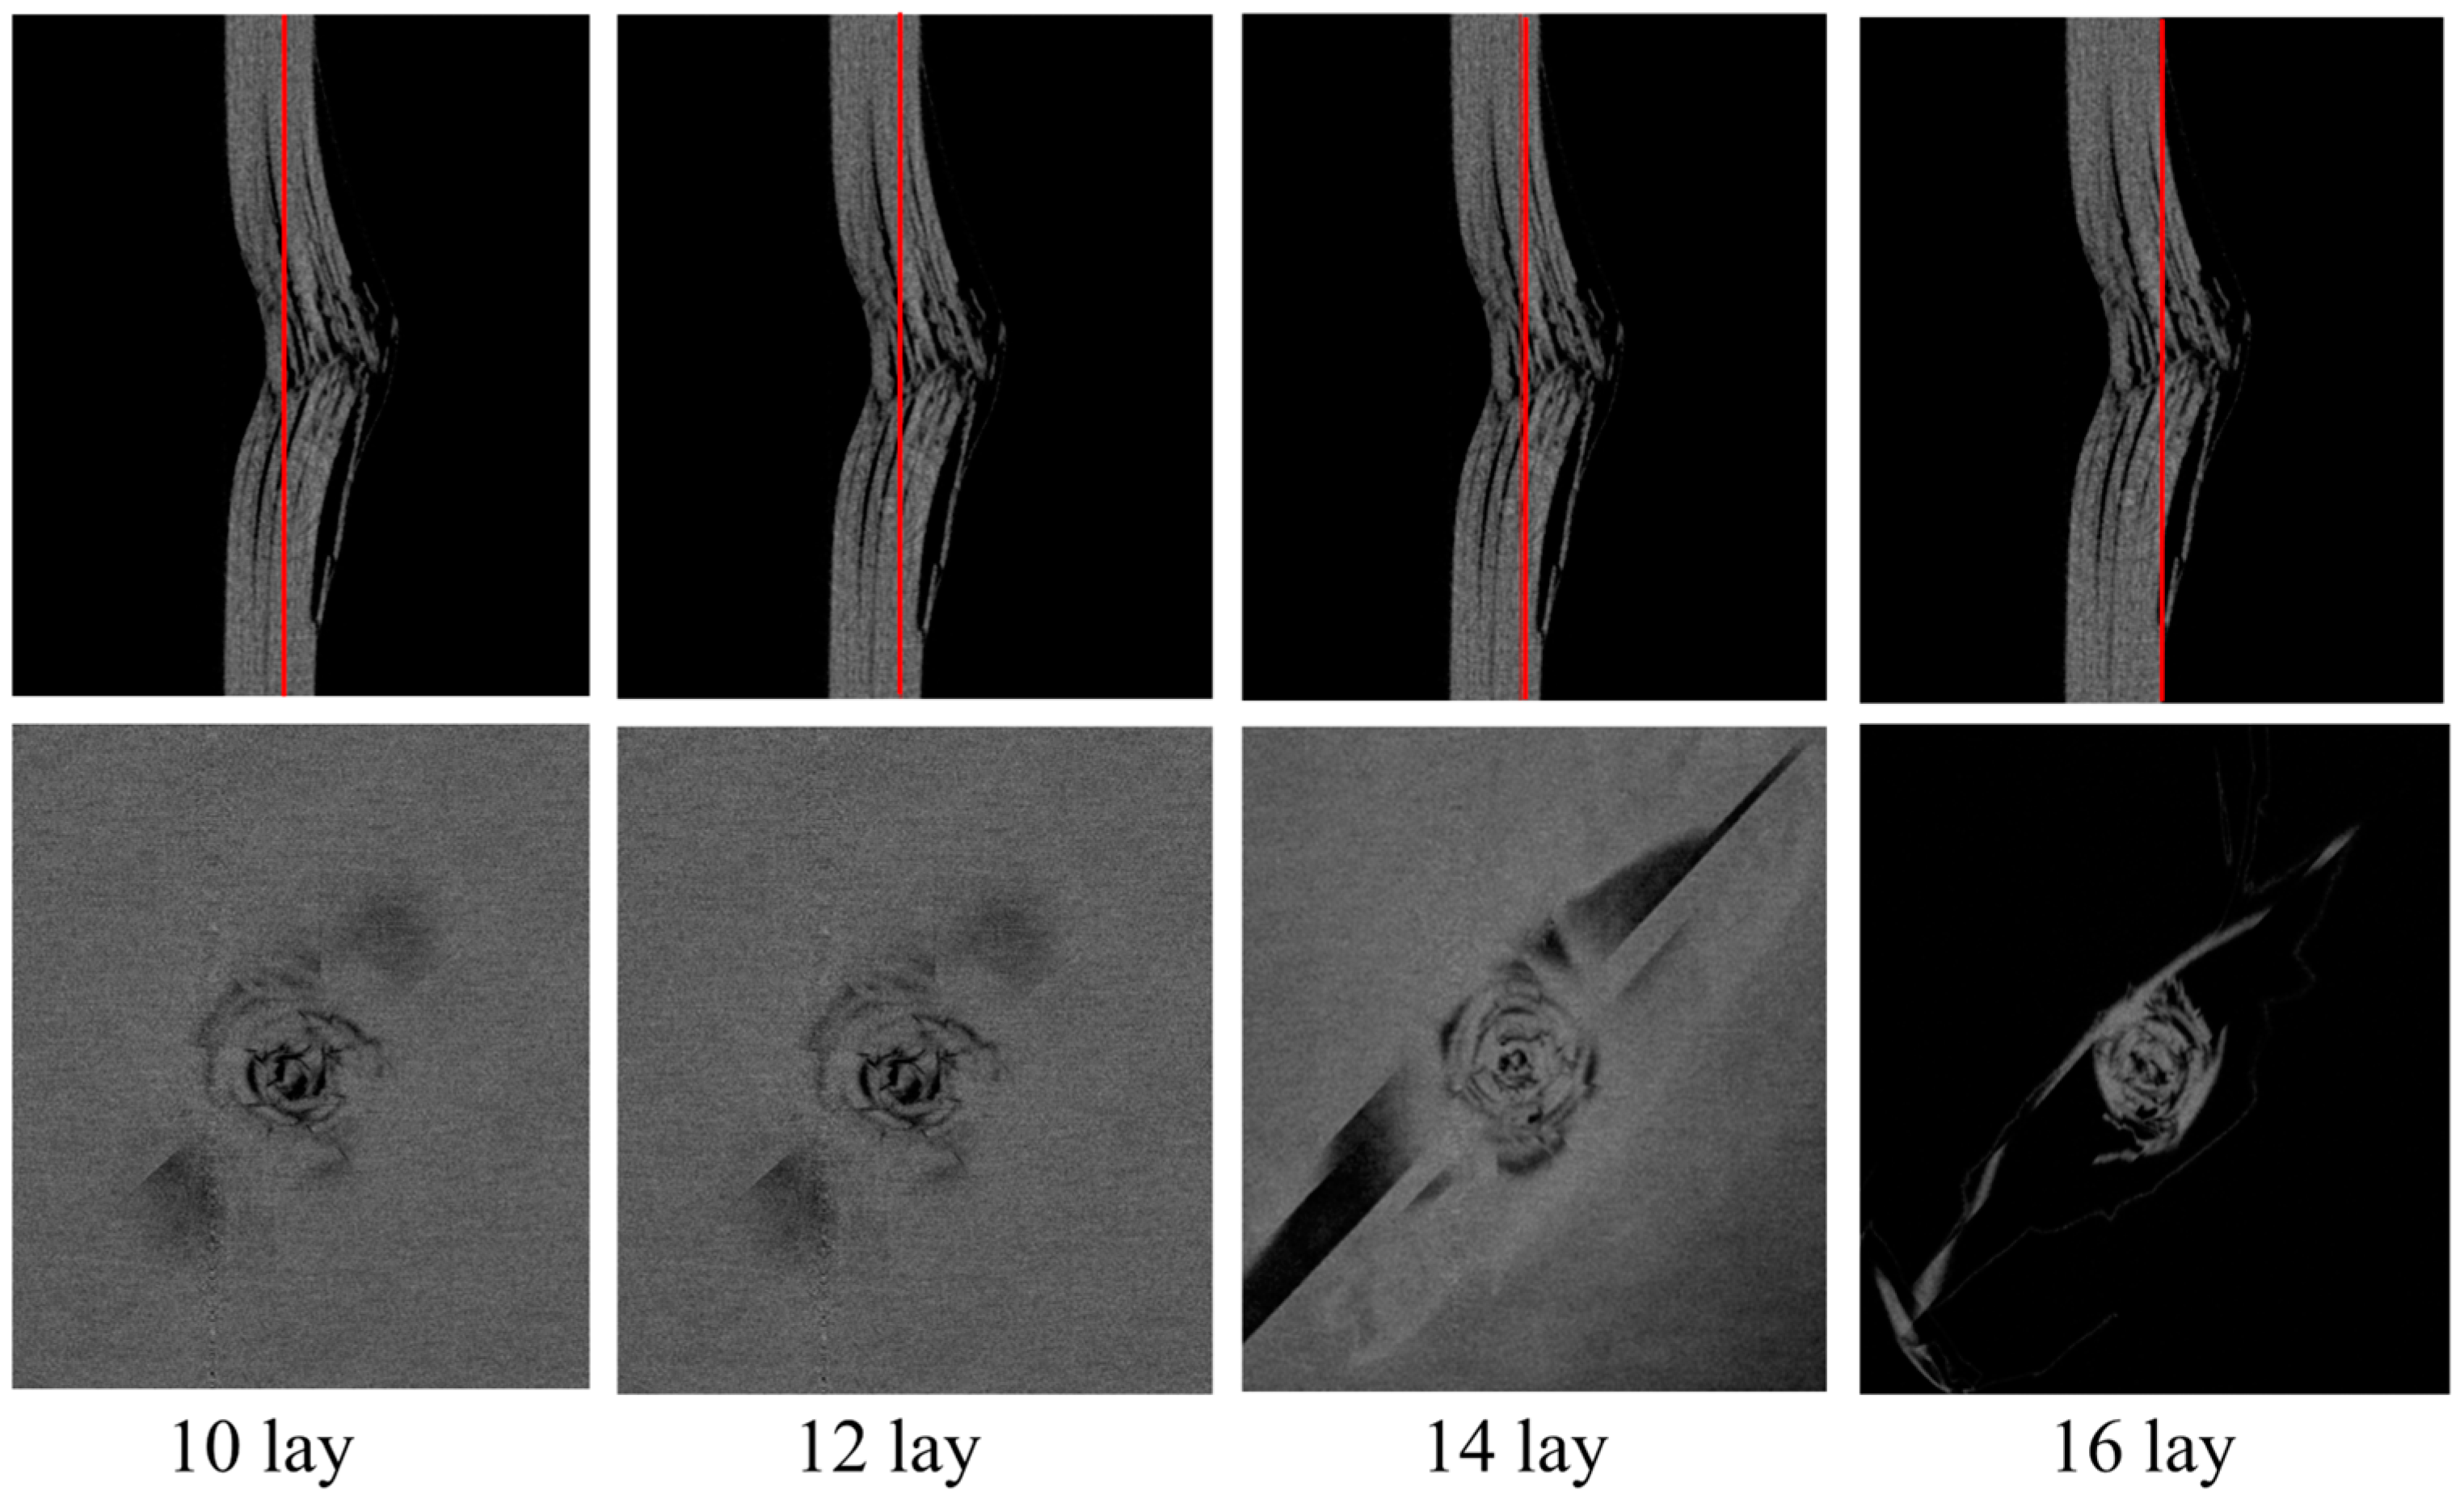
3.6. Internal Mesoscopic
4. Simulation Analysis
5. Conclusions
- (1)
- Through the comparative analysis of the initial damage valve force of the low-speed impact of different materials with different lay-ups, it is found that the initial damage valve force is not only related to the choice of laminate materials, but also to the lay-up order of the laminate. For the same material, the initial valve force of ply P2 with a lower stiffness is about 11% lower than that of ply P1; for the same ply sequence, the initial valve force of thermoplastic composite TP is about 28% lower than that of thermoset composite. For the same type of ply and the same type of material, under different impact energies, the initial damage valve force F1 of thermoset composites and thermoplastic composites is basically the same, and the slopes of the impact force–time curves are also basically the same (i.e. contact stiffness) before the appearance of F1, indicating that the magnitude of the initial valve force is mainly related to the contact stiffness of the laminate.
- (2)
- For quasi-isotropic sheet P1 and soft sheet P2, the indentation depth of both thermoplastic material and thermoset composite material increases with the increase of impact energy; at the same level of impact energy, the indentation depth of sheet P2 is larger than that of sheet P1, and the change of indentation depth of thermoplastic composite material is more obvious. This is because the sheet with more fibers in the 45° direction is less rigid. Under impact loading, fiber breakage and matrix cracking are more likely to occur in the weaker material, resulting in greater indentation depths in the laminate.
- (3)
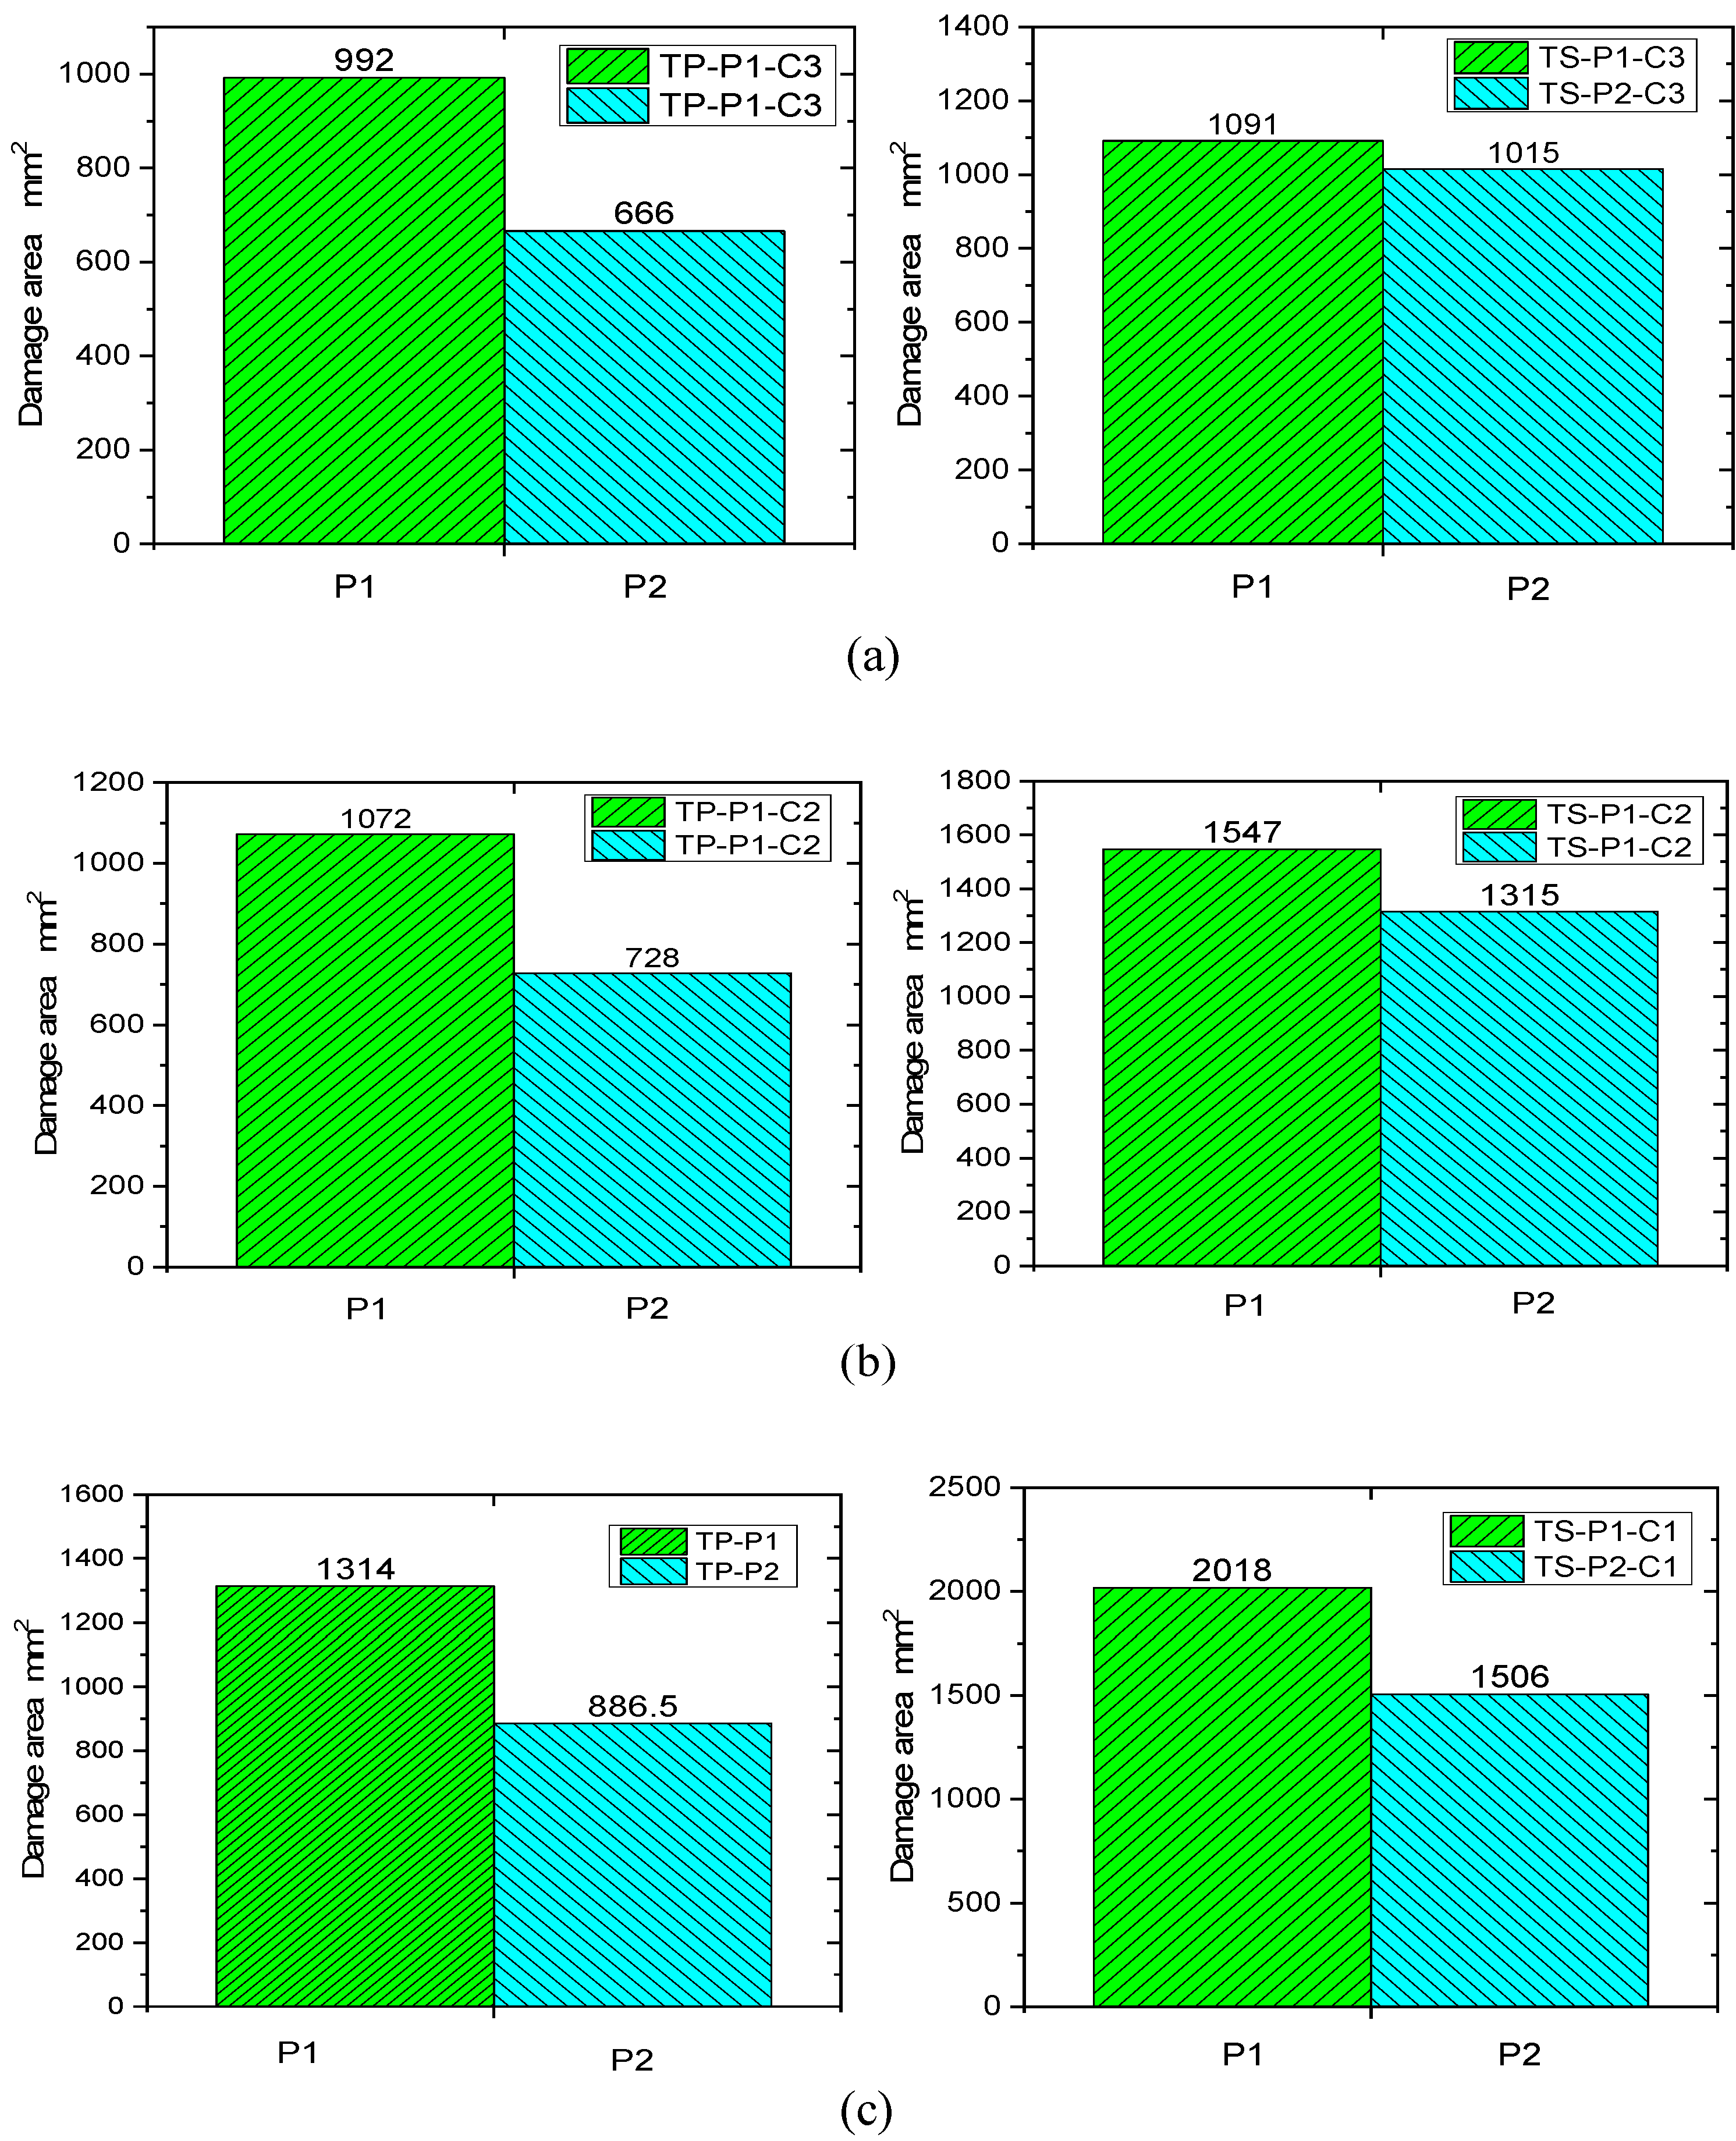
- For the quasi-isotropic ply P1, the delamination damage regions of the thermoplastic composites and thermoset composites are all extended, slightly larger in the 45° ply direction, whereas the soft ply P2, which contains a high proportion of 45°, has a more pronounced delamination extension in the 45° direction. This is mainly due to the bending deformation of the laminate under the impact load, and the impact back ply is subjected to tensile loads along and perpendicular to the fiber direction due to the bending deformation, resulting in fiber bundle separation, interlaminar slippage, and fiber breakage.
- (4)
- Comparing the scanning electron microscope SEM results of thermoplastic composites and thermoset composites, it was found that, compared with thermoset composites, the thermoplastic composite had significant matrix plastic deformation at the fiber/matrix interface junction, and relatively small fiber-resin interface shedding. There was also a microfluidic phenomenon of plastic deformation in the TP matrix that showed obvious ductile fracture characteristics, while most of the fracture regions of the TS matrix were edge flake fractures; brittle fracture characteristics are obvious. It is this toughness characteristic of thermoplastic composites that gives them good impact resistance.
- (5)
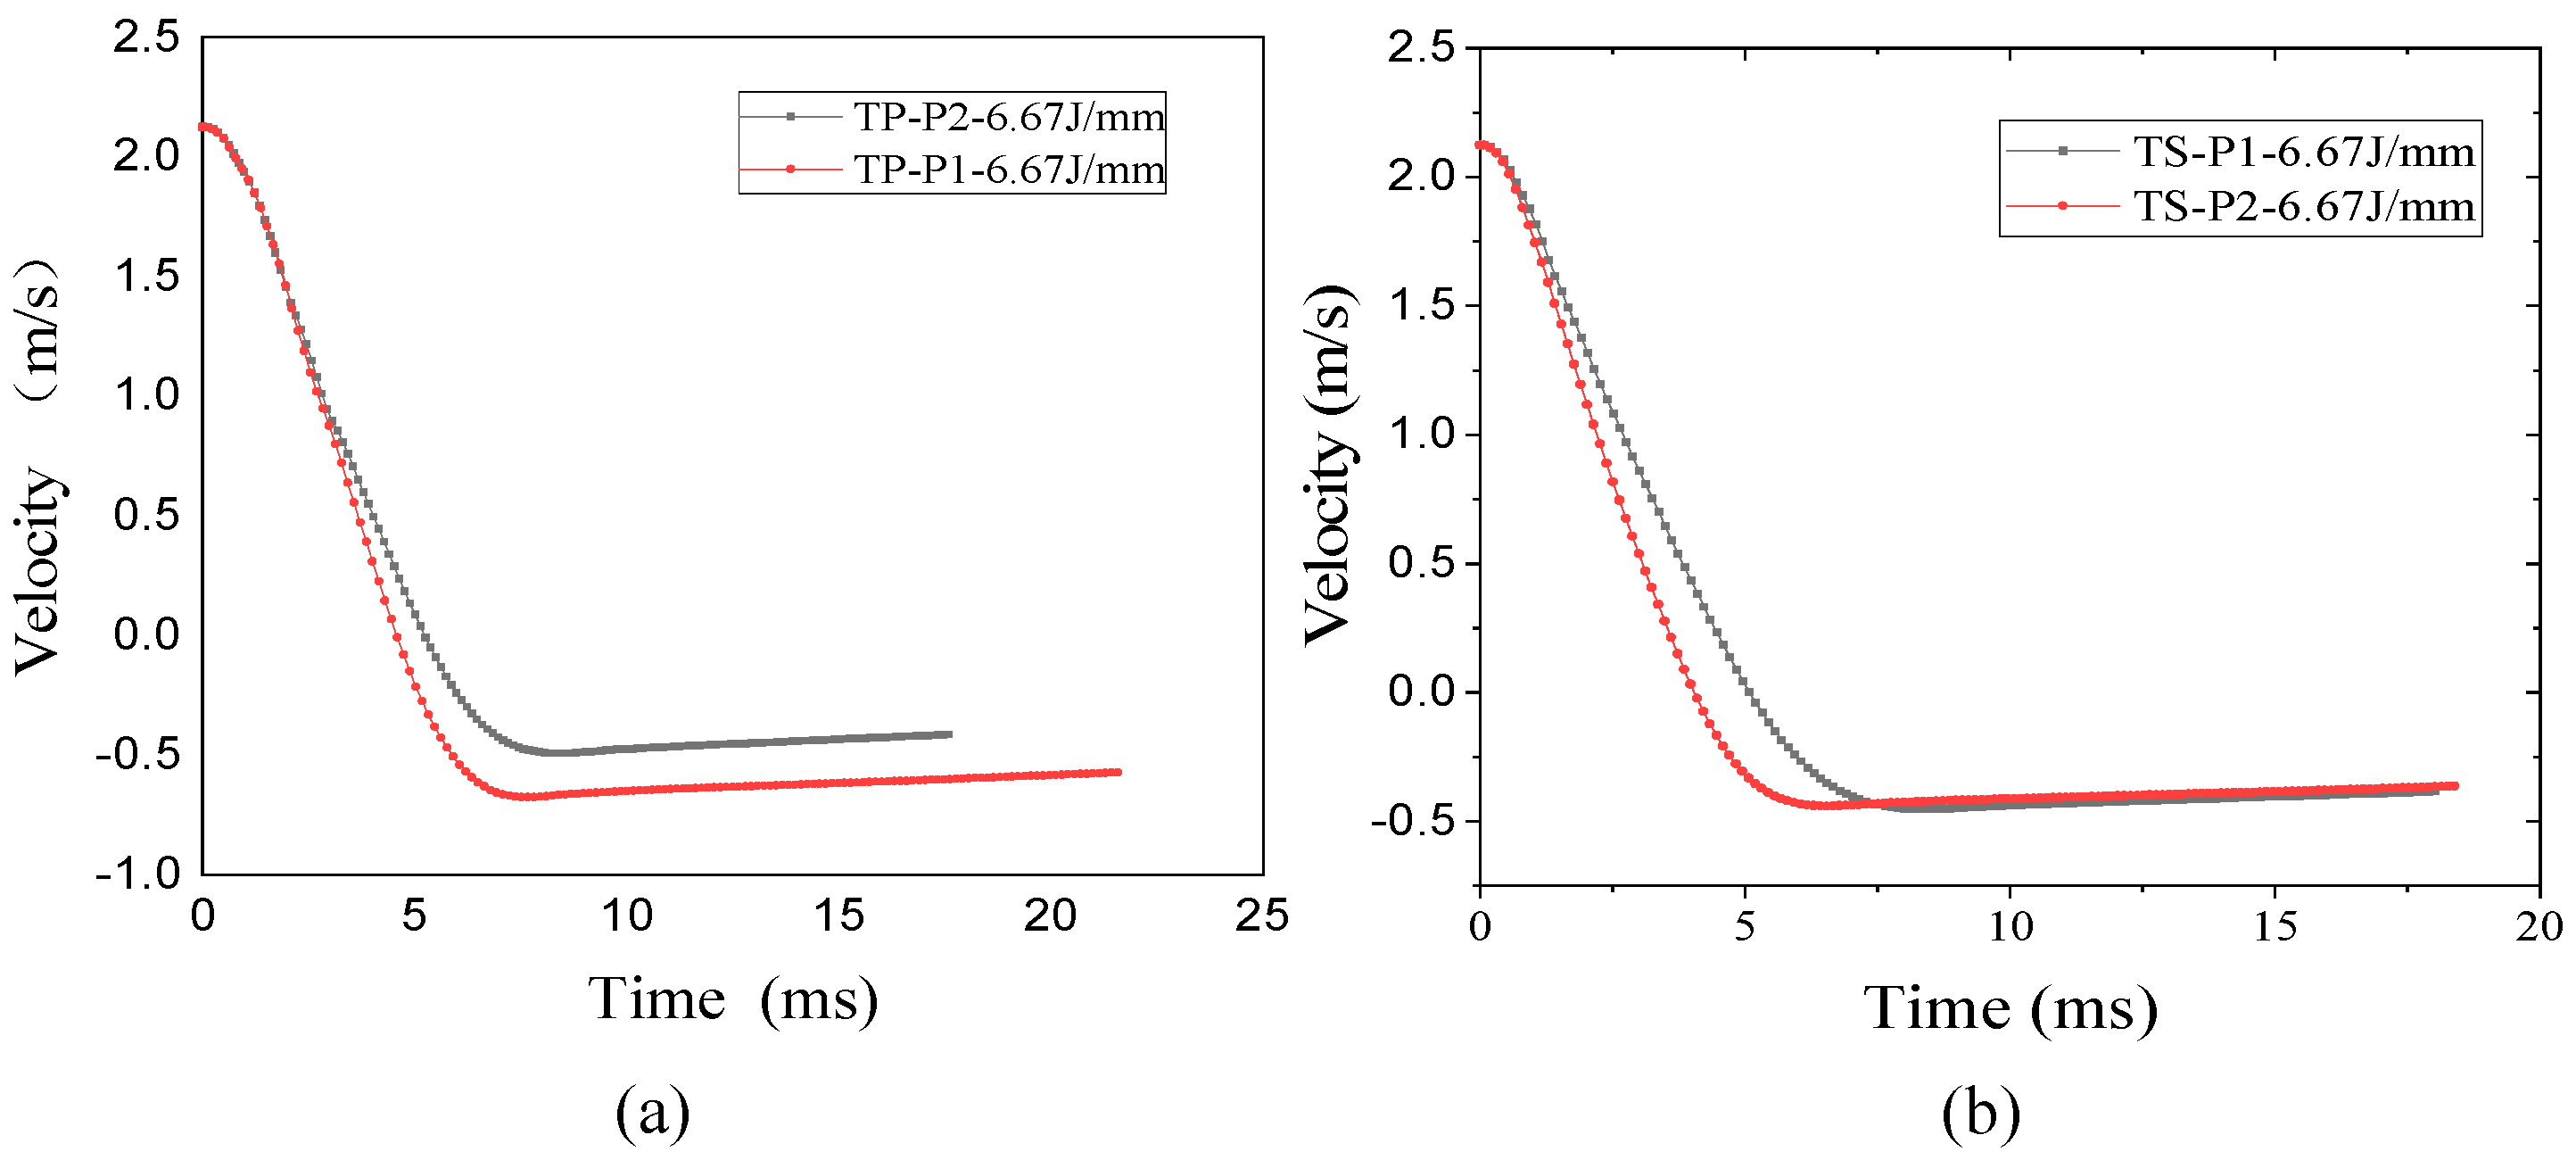
- In addition, the established damage model based on continuous damage mechanics (CDM) can effectively predict the various damage modes of thermoplastic composites during low-speed impact. Comparing the analytical results with the experimental results, the results show that the error is 5.26% in the simulation test of the initial damage threshold force, with an impact energy of 4.45 J/mm. The error of the maximum impact force is 4.36%. The simulated impact energy and impact velocity curves are in good agreement with the experimental results, indicating that the damage model has good reliability.
Author Contributions
Funding
Institutional Review Board Statement
Data Availability Statement
Acknowledgments
Conflicts of Interest
References
- Fantuzzi, N.; Bacciocchi, M.; Benedetti, D.; Agnelli, J. The use of sustainable composites for the manufacturing of electric cars. Compos. Part C Open Access 2021, 4, 100096. [Google Scholar] [CrossRef]
- Chen, D.; Yan, R.; Lu, X. Mechanical properties analysis of the naval ship similar model with an integrated sandwich composite superstructure. Ocean. Eng. 2021, 232, 109101. [Google Scholar] [CrossRef]
- Kilimtzidis, S.; Kotzakolios, A.; Kostopoulos, V. Kostopoulos. Efficient structural optimisation of composite materials aircraft wings. Compos. Struct. 2023, 303, 116268. [Google Scholar] [CrossRef]
- Higuchi, R.; Warabi, S.; Yoshimura, A.; Nagashima, T.; Yokozeki, T.; Okabe, T. Experimental and numerical study on progressive damage and failure in composite laminates during open-hole compression tests. Compos. Part A 2021, 145, 106300. [Google Scholar] [CrossRef]
- Wysmulski, P. Load Eccentricity of compressed composite Z-columns in non-linear state. Materials 2022, 15, 7631. [Google Scholar] [CrossRef] [PubMed]
- Shah, S.; Karuppanan, S.; Megat-Yusoff, P.; Sajid, Z. Impact resistance and damage tolerance of fiber reinforced composites: A review. Compos. Struct. 2019, 217, 100–121. [Google Scholar] [CrossRef]
- Yao, S.S.; Jin, F.L.; Rhee, K.Y.; Hui, D.; Park, S.J. Recent advances in carbon-fiber-reinforced thermoplastic composites: A review. Compos. Part B Eng. 2018, 142, 241–250. [Google Scholar] [CrossRef]
- Kalam, S.A.; Seshaiah, T.; Srividya, K. Damage behaviour and failure response of aircraft composite structure by soft body impact. Mater. Today Proc. 2022, 52, 867–872. [Google Scholar] [CrossRef]
- Dalfi, H.K.; Jan, K.; Yousaf, Z.; Peerzada, M. Improving the impact resistance and damage tolerance of fibre reinforced composites: A review. J. Compos. Mater. 2023, 57, 4479–4500. [Google Scholar] [CrossRef]
- Zhang, J.; Chevali, V.S.; Wang, H.; Wang, C.-H. Current status of carbon fibre and carbon fibre composites recycling. Compos. Part B Eng. 2020, 193, 108053. [Google Scholar] [CrossRef]
- Reddy, D.J. Composites in Rotorcraft Industry & Damage Tolerance Requirements; FAA Composites Workshop: Chicago, IL, USA, 2006. [Google Scholar]
- Huang, J.; Tan, V.; Chew, E.; Chan, K.; Tay, T.; Guo, L.; Liu, J. A new partially-infused fiber reinforced thermoplastic composite for improving impact resistance. Int. J. Impact Eng. 2022, 168, 104293. [Google Scholar] [CrossRef]
- Um, H.-J.; Hwang, Y.-T.; Bae, I.-J.; Kim, H.-S. Design and manufacture of thermoplastic carbon fiber/polyethylene terephthalate composites underbody shield to protect the lithium-ion batteries for electric mobility from ground impact. Compos. Part B Eng. 2022, 238, 109892. [Google Scholar] [CrossRef]
- Kassapoglou, C. Modeling the Effect of Damage in Composite Structures; John Wiley & Sons: Hoboken, NJ, USA, 2015. [Google Scholar]
- Sevkat, E.; Liaw, B.; Delale, F. Drop-weight impact response of hybrid composites impacted by impactor of various geometries. Mater. Des. 2013, 52, 67–77. [Google Scholar] [CrossRef]
- Léonard, F.; Stein, J.; Soutis, C.; Withers, P. The quantification of impact damage distribution in composite laminates by analysis of X-ray computed tomograms. Compos. Sci. Technol. 2017, 152, 139–148. [Google Scholar] [CrossRef]
- Lu, T.; Chen, X.; Wang, H.; Zhang, L.; Zhou, Y. Comparison of low-velocity impact damage in thermoplastic and thermoset composites by non-destructive three-dimensional X-ray microscope. Polym. Test. 2020, 91, 106730. [Google Scholar] [CrossRef]
- Gohel, G.; Bhudolia, S.K.; Leong, K.F.; Gerard, P. Understanding the impact properties and damage phenomenon of ultra-lightweight all-thermoplastic composite structures. Int. J. Impact Eng. 2023, 172, 104405. [Google Scholar] [CrossRef]
- Jiang, F.; Guan, Z.; Li, Z.; Wang, X. A method of predicting visual detectability of low-velocity impact damage in composite structures based on logistic regression model. Chin. J. Aeronaut. 2021, 34, 296–308. [Google Scholar] [CrossRef]
- Vieille, B.; Casado, V.; Bouvet, C. About the impact behavior of woven-ply carbon fiber-reinforced thermoplastic- and thermosetting-composites: A comparative study. Compos. Struct. 2013, 101, 9–21. [Google Scholar] [CrossRef]
- Garcea, S.; Sinclair, I.; Spearing, S. In situ synchrotron tomographic evaluation of the effect of toughening strategies on fatigue micromechanisms in carbon fibre reinforced polymers. Compos. Sci. Technol. 2015, 109, 32–39. [Google Scholar] [CrossRef]
- Garcea, S.; Sinclair, I.; Spearing, S. Fibre failure assessment in carbon fibre reinforced polymers under fatigue loading by synchrotron X-ray computed tomography. Compos. Sci. Technol. 2016, 133, 157–164. [Google Scholar] [CrossRef]
- Zhao, Z.; Yang, Z.; Zhang, W.; Liu, D.; Li, Y.; Chen, J. Low-velocity impact response and infrared radiation characteristics of thermoplastic/thermoset composites. Chin. J. Aeronaut. 2022, 35, 365–380. [Google Scholar] [CrossRef]
- Olsson, R. Analytical prediction of large mass impact damage in composite laminates. Compos. Appl. Sci. Manuf. 2001, 32, 1207–1215. [Google Scholar] [CrossRef]
- Lee, J.; Soutis, C. Prediction of impact-induced fibre damage in circular composite plates. Appl. Compos. Mater. 2005, 12, 109–131. [Google Scholar] [CrossRef]
- Ilanko, S.; Monterrubio, L.; Mochida, Y. The Rayleigh-Ritz Method for Structural Analysis; John Wiley and Sons: Hoboken, NJ, USA, 2014. [Google Scholar]
- Zhang, C.; Duodu, E.A.; Gu, J. Finite elementmodeling of damage development in cross-ply composite laminates subjected to low velocity impact. Compos. Struct. 2017, 173, 219–227. [Google Scholar] [CrossRef]
- Singh, H.; Mahajan, P. Modeling damage induced plasticity for low velocity impact simulation of three dimensional fiber reinforced composite. Compos. Struct. 2015, 131, 290–303. [Google Scholar] [CrossRef]
- Schwab, M.; Pettermann, H.E. Modelling and simulation of damage and failure in large composite components subjected to impact loads. Compos. Struct. 2016, 158, 208–216. [Google Scholar] [CrossRef]
- Romano, F.; Di Caprio, F.; Mercurio, U. Compression after impact analysis of composite panels and equivalent hole method. Procedia Eng. 2016, 167, 182–189. [Google Scholar] [CrossRef]
- Tuo, H.; Lu, Z.; Ma, X.; Xing, J.; Zhang, C. Damage and failure mechanism of thin composite laminates under low-velocity impact and compression-after-impact loading conditions. Compos. Part B 2019, 163, 642–654. [Google Scholar] [CrossRef]
- Soto, A.; González, E.V.; Maimí, P.; De La Escalera, F.M.; De Aja, J.S.; Alvarez, E. Low velocity impact and compression after impact simulation of thin ply laminates. Compos. Part A 2018, 109, 413–427. [Google Scholar] [CrossRef]
- Yang, J.S.; Zhang, W.M.; Yang, F.; Chen, S.Y. Low velocity impact behavior of carbon fibre composite curved corrugated sandwich shells. Compos. Struct. 2020, 238, 112027. [Google Scholar] [CrossRef]
- Hu, J.; Ji, C.; Chen, S.; Li, S.; Zou, Y.; Zhou, Z.; Wang, B. Two-position impact behavior and interference mechanism of CFF/PEEK thermoplastic composites. Int. J. Mech. Sci. 2022, 232, 107644. [Google Scholar] [CrossRef]
- Lu, T.; Shen, H.S.; Wang, H.; Chen, X. Compression-after-impact effect on post-buckling behavior of thermoplastic composite laminated plates. Aerosp. Sci. Technol. 2022, 121, 107384. [Google Scholar] [CrossRef]
- Javanshour, F.; Prapavesis, A.; Pournoori, N.; Soares, G.; Orell, O.; Pärnänen, T.; Kanerva, M.; Van Vuure, A.; Sarlin, E. Impact and fatigue tolerant natural fibre reinforced thermoplastic composites by using non-dry fibres. Compos. Part A Appl. Sci. Manuf. 2022, 161, 107110. [Google Scholar] [CrossRef]
- Kayaaslan, M.; Coskun, T.; Unlu, U.M.; Sahin, O.S. Effects of thickness, fibre orientation and fabric textile on the low-velocity impact performances of thermoset and thermoplastic composites. J. Thermoplast. Compos. Mater. 2023, 36, 4408–4429. [Google Scholar] [CrossRef]
- Sun, X.; Kawashita, L.; Kaddour, A.; Hiley, M.; Hallett, S. Comparison of Low Velocity Impact Modelling Techniques for thermoplastic and thermoset Polymer Composites. Compos. Struct. 2018, 203, 659–671. [Google Scholar] [CrossRef]
- González, E.V.; Maimí, P.; Martín-Santos, E.; Soto, A.; Cruz, P.; De La Escalera, F.M.; de Aja, J.S. Simulating drop-weight impact and compression after impact tests on composite laminates using conventional shell finite elements. Int. J. Solids Struct. 2018, 144–145, 230–247. [Google Scholar] [CrossRef]
- Composite Materials Handbook 17 Polymer Matrix Composites Material Properties; Federal Aviation Administration: Washington, DC, USA, 2012.
- ASTM D 7136; Standard Test Method for Measuring the Damage Resistance of a Fiber-Reinforced Polymer Matrix Composite to a Drop-Weight Impact Event. ASTM: West Conshohocken, PE, USA, 2012.
- Han, L.; Song, Y.; Qi, H.; Yang, J.S.; Li, S.; Liu, P.A. A Comparative Study on the Mechanical Properties of Open-Hole Carbon Fiber-Reinforced Thermoplastic and Thermosetting Composite Materials. Polymers 2023, 15, 4468. [Google Scholar] [CrossRef]
- Li, S.; Yang, J.-S.; Schmidt, R.; Wu, L.-Z.; Schröder, K.-U. Compression and hysteresis responses of multilayer gradient composite lattice sandwich panels. Mar. Struct. 2021, 75, 102845. [Google Scholar] [CrossRef]
- Han, L.; Qi, H.; Men, K.; Zhu, H.; Gong, S. Failure analysis and verification of honeycomb sandwich structure based on interface element. J. Harbin Eng. Univ. 2022, 56, 2211–2225. [Google Scholar]


| Tension Modulus (GPa) | Ultimate Tension Strength (MPa) | Elongation (%) | |
|---|---|---|---|
| AS4D | 231 | 4347 | 1.88 |
| CCF300 | 230 | 4210 | 1.78 |
| Tension Modulus (MPa) | Tension Strength (MPa) | Elongation (%) | Fracture Toughness (J/mm) | |
|---|---|---|---|---|
| PEEK | 3.8 | 94 | 50 | 2000 |
| Epoxy | 3.58 | 105 | 1.9 | 420 |
| Density (MPa) | Poisson’s Ratio | Elastic Modulus (GPa) | Share Modulus (GPa) | Tensile Strength (MPa) | Compression Strength (MPa) | Shear Strength (MPa) | ||||
|---|---|---|---|---|---|---|---|---|---|---|
| v | E1 | E2 | G12 | σt1 | σt2 | σc1 | σc2 | τ12 | ||
| AS-4D/PEEK | 1580 | 0.3 | 130 | 9.7 | 5.2 | 2280 | 69 | 1300 | 208 | 152 |
| CCF300/Epoxy | 1600 | 0.3 | 130 | 9.3 | 4.1 | 1673 | 68 | 1436 | 257 | 136 |
| Mark | Fiber Stacking Sequence | |
|---|---|---|
| TP composite | P1 | [45°/0°/−45°/90°]3S |
| P2 | [45°/−45°/90°/45°/−45°/45°/−45°/0°/45°/−45°]s | |
| TS composite | P1 | [45°/0°/−45°/90°]3S |
| P2 | [45°/−45°/90°/45°/−45°/45°/−45°/0°/45°/−45°]s |
| Equipment | Model | Precision |
|---|---|---|
| Drop hammer impact test bench (INSTRON, Boston, MA, USA) | 9250HV | ±0.5% |
| Depth gauge (KENTA, Singapore) | KT5-231-66 | 0.01 mm |
| Vernier caliper (MITUTOYO, Kawasaki City, Japan) | — | ±0.02 mm |
| Ultrasonic testing system (Sonoscan, IL, USA) | IUCS—II | — |
| X-ray testing device (YXLON, Hamburg, Germany) | Y.CT Modular | 1% |
| Material | Layer | Number | Energy of Impact | Indentation Depth (mm) | CV% | ||
|---|---|---|---|---|---|---|---|
| J/mm | J | Single Value | Average Value | ||||
| TP composite | P1 | TPP1C1-01 | 6.67 | 20.01 | 1.11 | 0.99 | 9.59 |
| TPP1C1-02 | 6.67 | 20.01 | 0.97 | ||||
| TPP1C1-03 | 6.67 | 20.01 | 0.88 | ||||
| TPP1C2-04 | 5.56 | 16.68 | 0.67 | 0.73 | 10.35 | ||
| TPP1C2-05 | 5.56 | 16.68 | 0.84 | ||||
| TPP1C2-06 | 5.56 | 16.68 | 0.69 | ||||
| TPP1C3-07 | 4.45 | 13.35 | 0.54 | 0.54 | 12.94 | ||
| TPP1C3-08 | 4.45 | 13.35 | 0.45 | ||||
| TPP1C3-09 | 4.45 | 13.35 | 0.62 | ||||
| P2 | TPP2C1-01 | 6.67 | 16.68 | 1.40 | 1.49 | 8.07 | |
| TPP2C1-02 | 6.67 | 16.68 | 1.41 | ||||
| TPP2C1-03 | 6.67 | 16.68 | 1.66 | ||||
| TPP2C2-04 | 5.56 | 13.90 | 1.12 | 1.12 | 11.99 | ||
| TPP2C2-05 | 5.56 | 13.90 | 1.29 | ||||
| TPP2C2-06 | 5.56 | 13.90 | 0.96 | ||||
| TPP2C3-07 | 4.45 | 11.13 | 0.68 | 0.65 | 12.37 | ||
| TPP2C3-08 | 4.45 | 11.13 | 0.54 | ||||
| TPP2C3-09 | 4.45 | 11.13 | 0.73 | ||||
| TS composite | P1 | TSP1C1-01 | 6.67 | 20.01 | 1.38 | 1.22 | 10.39 |
| TSP1C1-02 | 6.67 | 20.01 | 1.07 | ||||
| TSP1C1-03 | 6.67 | 20.01 | 1.21 | ||||
| TSP1C2-04 | 5.56 | 16.68 | 1.05 | 0.92 | 10.06 | ||
| TSP1C2-05 | 5.56 | 16.68 | 0.89 | ||||
| TSP1C2-06 | 5.56 | 16.68 | 0.83 | ||||
| TPP2C3-07 | 4.45 | 11.13 | 0.68 | 0.60 | 13.56 | ||
| TPP2C3-08 | 4.45 | 11.13 | 0.49 | ||||
| TPP2C3-09 | 4.45 | 11.13 | 0.64 | ||||
| P2 | TSP2C1-01 | 6.67 | 16.68 | 1.27 | 1.41 | 8.13 | |
| TSP2C1-02 | 6.67 | 16.68 | 1.40 | ||||
| TSP2C1-03 | 6.67 | 16.68 | 1.55 | ||||
| TSP2C2-04 | 5.56 | 13.90 | 1.08 | 1.08 | 9.42 | ||
| TSP2C2-05 | 5.56 | 13.90 | 1.21 | ||||
| TSP2C2-06 | 5.56 | 13.90 | 0.96 | ||||
| TSP2C3-07 | 4.45 | 11.13 | 0.63 | 0.61 | 11.48 | ||
| TSP2C3-08 | 4.45 | 11.13 | 0.52 | ||||
| TSP2C3-09 | 4.45 | 11.13 | 0.69 | ||||
| Material | Layer | Number | Energy of Impact | Damage Area (mm2) | CV% | ||
|---|---|---|---|---|---|---|---|
| J/mm | J | Single Value | Average Value | ||||
| TP composite | P1 | TPP1C1-01 | 6.67 | 20.01 | 1332 | 1314 | 11.26 |
| TPP1C1-02 | 6.67 | 20.01 | 1124 | ||||
| TPP1C1-03 | 6.67 | 20.01 | 1485 | ||||
| TPP1C2-04 | 5.56 | 16.68 | 979 | 1072 | 9.79 | ||
| TPP1C2-05 | 5.56 | 16.68 | 1019 | ||||
| TPP1C2-06 | 5.56 | 16.68 | 1219 | ||||
| TPP1C3-07 | 4.45 | 13.35 | 1164 | 992 | 12.34 | ||
| TPP1C3-08 | 4.45 | 13.35 | 926 | ||||
| TPP1C3-09 | 4.45 | 13.35 | 887 | ||||
| P2 | TPP2C1-01 | 6.67 | 16.68 | 913 | 887 | 10.84 | |
| TPP2C1-02 | 6.67 | 16.68 | 989 | ||||
| TPP2C1-03 | 6.67 | 16.68 | 758 | ||||
| TPP2C2-04 | 5.56 | 13.90 | 766 | 738 | 8.93 | ||
| TPP2C2-05 | 5.56 | 13.90 | 647 | ||||
| TPP2C2-06 | 5.56 | 13.90 | 801 | ||||
| TPP2C3-07 | 4.45 | 11.13 | 648 | 666 | 10.54 | ||
| TPP2C3-08 | 4.45 | 11.13 | 760 | ||||
| TPP2C3-09 | 4.45 | 11.13 | 591 | ||||
| TS composite | P1 | TSP1C1-01 | 6.67 | 20.01 | 2015 | 2018 | 11.97 |
| TSP1C1-02 | 6.67 | 20.01 | 2316 | ||||
| TSP1C1-03 | 6.67 | 20.01 | 1724 | ||||
| TSP1C2-04 | 5.56 | 16.68 | 1521 | 1547 | 11.62 | ||
| TSP1C2-05 | 5.56 | 16.68 | 1341 | ||||
| TSP1C2-06 | 5.56 | 16.68 | 1779 | ||||
| TSP1C3-07 | 4.45 | 13.35 | 1253 | 1091 | 12.12 | ||
| TSP1C3-08 | 4.45 | 13.35 | 1091 | ||||
| TSP1C3-09 | 4.45 | 13.35 | 929 | ||||
| P2 | TSP2C1-01 | 6.67 | 16.68 | 1527 | 1506 | 10.24 | |
| TSP2C1-02 | 6.67 | 16.68 | 1683 | ||||
| TSP2C1-03 | 6.67 | 16.68 | 1307 | ||||
| TSP2C2-04 | 5.56 | 13.90 | 1375 | 1315 | 16.83 | ||
| TSP2C2-05 | 5.56 | 13.90 | 1019 | ||||
| TSP2C2-06 | 5.56 | 13.90 | 1551 | ||||
| TSP2C3-07 | 4.45 | 11.13 | 1024 | 1015 | 9.99 | ||
| TSP2C3-08 | 4.45 | 11.13 | 1135 | ||||
| TSP2C3-09 | 4.45 | 11.13 | 887 | ||||
Disclaimer/Publisher’s Note: The statements, opinions and data contained in all publications are solely those of the individual author(s) and contributor(s) and not of MDPI and/or the editor(s). MDPI and/or the editor(s) disclaim responsibility for any injury to people or property resulting from any ideas, methods, instructions or products referred to in the content. |
© 2024 by the authors. Licensee MDPI, Basel, Switzerland. This article is an open access article distributed under the terms and conditions of the Creative Commons Attribution (CC BY) license (https://creativecommons.org/licenses/by/4.0/).
Share and Cite
Han, L.; Qi, H.; Yang, J.; Chu, F.; Lin, C.; Liu, P.; Zhang, Q. Study on the Low-Velocity Impact Response and Damage Mechanisms of Thermoplastic Composites. Polymers 2024, 16, 791. https://doi.org/10.3390/polym16060791
Han L, Qi H, Yang J, Chu F, Lin C, Liu P, Zhang Q. Study on the Low-Velocity Impact Response and Damage Mechanisms of Thermoplastic Composites. Polymers. 2024; 16(6):791. https://doi.org/10.3390/polym16060791
Chicago/Turabian StyleHan, Liu, Hui Qi, Jinshui Yang, Fuqing Chu, Changliang Lin, Pingan Liu, and Qian Zhang. 2024. "Study on the Low-Velocity Impact Response and Damage Mechanisms of Thermoplastic Composites" Polymers 16, no. 6: 791. https://doi.org/10.3390/polym16060791
APA StyleHan, L., Qi, H., Yang, J., Chu, F., Lin, C., Liu, P., & Zhang, Q. (2024). Study on the Low-Velocity Impact Response and Damage Mechanisms of Thermoplastic Composites. Polymers, 16(6), 791. https://doi.org/10.3390/polym16060791