Article

Structural and Transport Properties of Hydrophilic and Hydrophobic Modified Ionomers in Proton Exchange Membrane Fuel Cells

1
SJTU Paris Elite Institute of Technology, Shanghai Jiao Tong University, Shanghai 200240, China
2
Institute of Fuel Cells, Shanghai Jiao Tong University, Shanghai 200240, China
3
Zhejiang TangFeng Energy Technology Co., Ltd., Huzhou 313002, China
4
Commercial Vehicle Development Institute, FAW Jiefang Automotive Co., Ltd., Changchun 130011, China
5
MOE Key Laboratory of Power & Machinery Engineering, Shanghai Jiao Tong University, Shanghai 200240, China
*
Author to whom correspondence should be addressed.
Polymers 2024, 16(5), 668; https://doi.org/10.3390/polym16050668
Submission received: 6 February 2024 / Revised: 23 February 2024 / Accepted: 27 February 2024 / Published: 29 February 2024
(This article belongs to the Section Polymer Membranes and Films)

Abstract

:
The sluggish commercial application of proton exchange membrane fuel cells (PEMFCs) with low Pt loading is chiefly hindered by concentration polarization loss, particularly at high current density regions. Addressing this, our study concentrates on the ionomer membranes in the cathode catalyst layer (CCL) and explores the potential of incorporating additional hydrophilic or hydrophobic components to modify these ionomers. Therefore, an all-atom model was constructed and for the ionomer and hydrophilic and hydrophobic modifications were implemented via incorporating SiO2 and PTFE, respectively. The investigation was conducted via molecular dynamics (MD) simulations to predict the morphology and structure of the ionomer and analyze the kinetic properties of oxygen molecules and protons. The simulation results elaborate that the hydrophilic and hydrophobic modifications favor the phase separation and the self-diffusion coefficients of oxygen molecules and protons are enhanced. Considering the hydration level of the ionomer films, hydrophilic modification facilitates mass transfer under low-hydration-level conditions, while hydrophobic modification is more effective in optimizing mass transfer as the hydration level increases. The optimal contents of SiO2 and PTFE for each hydration level in this work are 9.6% and 45%, respectively. This work proposes a reliable model and presents a detailed analysis of hydrophilic and hydrophobic modifications, which provides theoretical guidance for quantitative preparations of various composite membranes.

1. Introduction

Proton exchange membrane fuel cells (PEMFCs) have become one of the cutting-edge topics for hydrogen energy applications due to their cleanliness, high energy conversion rate, and low noise pollution [1]. Nevertheless, the rapid development of PEMFCs and the investment in commercial use are greatly constrained due to drawbacks such as high manufacturing and operation costs and low durability [2]. The current mainstream approach to cost reduction is decreases in Pt loading. Nevertheless, insufficient Pt leads to a severe concentration polarization at high current densities, where the high local transport resistance in the cathode catalyst layer occupies more than 50% of the total loss [3,4,5]. In the cathode catalyst layer of PEMFCs, the three-phase interface formed by the compact contact of electrolytes, catalyst particles, and gas is the core place where the electrochemical reaction takes place [6]. Therefore, a detailed understanding of the changes in the internal morphology and structure within the catalyst layer, as well as the transport mechanisms of water molecules, protons, and gas molecules, is essential to optimize cell performance.
Water distribution in PEMFCs has a crucial impact on improving the efficiency of the cell. On one hand, protons are transported in their hydrated form inside the membrane electrode, implying that the conduction depends on the moisturizing ability of the proton exchange membrane (PEM). On the other hand, excessive water can lead to flooding, obstructing the diffusion pathways of reactant gases, particularly at high power densities and flow rates where water production is elevated, yet insufficient drainage exacerbates the problem. The accumulation of liquid water can impede gas diffusion and precipitate a decline in cell performance due to exacerbated concentration polarization at the reaction sites and a decrease in the oxygen reduction reaction (ORR) rate [7]. Modification of the hydrophilicity and hydrophobicity of the cathode catalyst layer is one of the important ways to ameliorate water distribution in PEMFCs. The introduction of hydrophilic substances has been proven as an accessible but effective way. Previous experiments have demonstrated that the incorporation of SiO2 into the membrane increases its water uptake, indicating an enhanced hydrophilicity of the membrane [8]. Moreover, SiO2 tends to cover the surface of Pt particles and prevents Pt particles from displaying different decaying behaviors, thus contributing to the stability and maintenance of the battery performance [9,10,11]. Additionally, SiO2 enables PEMs to function properly at high temperatures due to its hygroscopic capability [12]. Other substances, like Al2O3 [13] and TiO2 [14], can also endow the CCL with self-humidifying abilities via mixing them with the PEM during fabrication. However, SiO2 has a lower procurement cost compared to TiO2 and a better chemical stability compared to Al2O3. Herein, SiO2 is more accessible in hydrophilic modifications of PEMFCs.
Researchers have found that the doping hydrophobic substance weakens the interactions between Pt and Nafion and modifies the distribution of ionomers on the surface of the Pt particles. Only weak van der Waals interactions exist between the modified Pt surface and the ionomers instead of polar interactions [15]. Polytetrafluoroethylene (PTFE) is one of the commonly used substances for hydrophobic modification of the CCL. It is reported that PTFE can create a rougher material surface, which can drastically increase the contact angle of the water droplets, resulting in a further increase in the hydrophobicity of the coating. Consequently, the number of transport channels increases and the oxygen can reach the triple phase boundary (TPB) sites more effectively [16,17]. Sun et al. [18] constructed another Pt/C hydrophobic interface by adding 1-hexadecyl methanethiol (C16SH), which successfully reduced the density of sulfonate groups surrounding the Pt active site, and obtained a specific Pt/ionophore interface after removing the C16SH by in situ electrochemical oxidation. Experimentally, according to the limiting current density method, the mass transfer resistance of oxygen at the Pt/ionophore interface was reduced and the performance of PEMFCs was enhanced.
At the current stage, the connection between the morphological changes inside the catalyst layer and the mass transfer phenomena is difficult to explain intuitively through macroscopic experiments. Thus, its simulation at the microscopic level is particularly important in the study of its mechanism. MD simulations have been widely utilized in the PEMFC field, including investigations of the effect of I/C ratios on cell performance [19], the effect of hydration level on oxygen transport [20], the proton conduction mechanism [21], etc.
Prior studies have discovered that an excessive amount of hydrophilic and hydrophobic substances may bring some negative impacts. For instance, SiO2 may lead to an increased flooding phenomenon, resulting in the loss of battery performance [10]. Likewise, the over-doping of PTFE will hinder the proton conduction, which is not conducive to the enhancement of the performance of PEMFCs either. Herein, a quantitative analysis of the effects of hydrophilic and hydrophobic modifications is necessary. In this work, we constructed all-atom models for different types of CCLs. Then, MD simulations were carried out which enabled us to specifically describe the structural and transport properties and finally render a visual result.

2. Materials and Methods

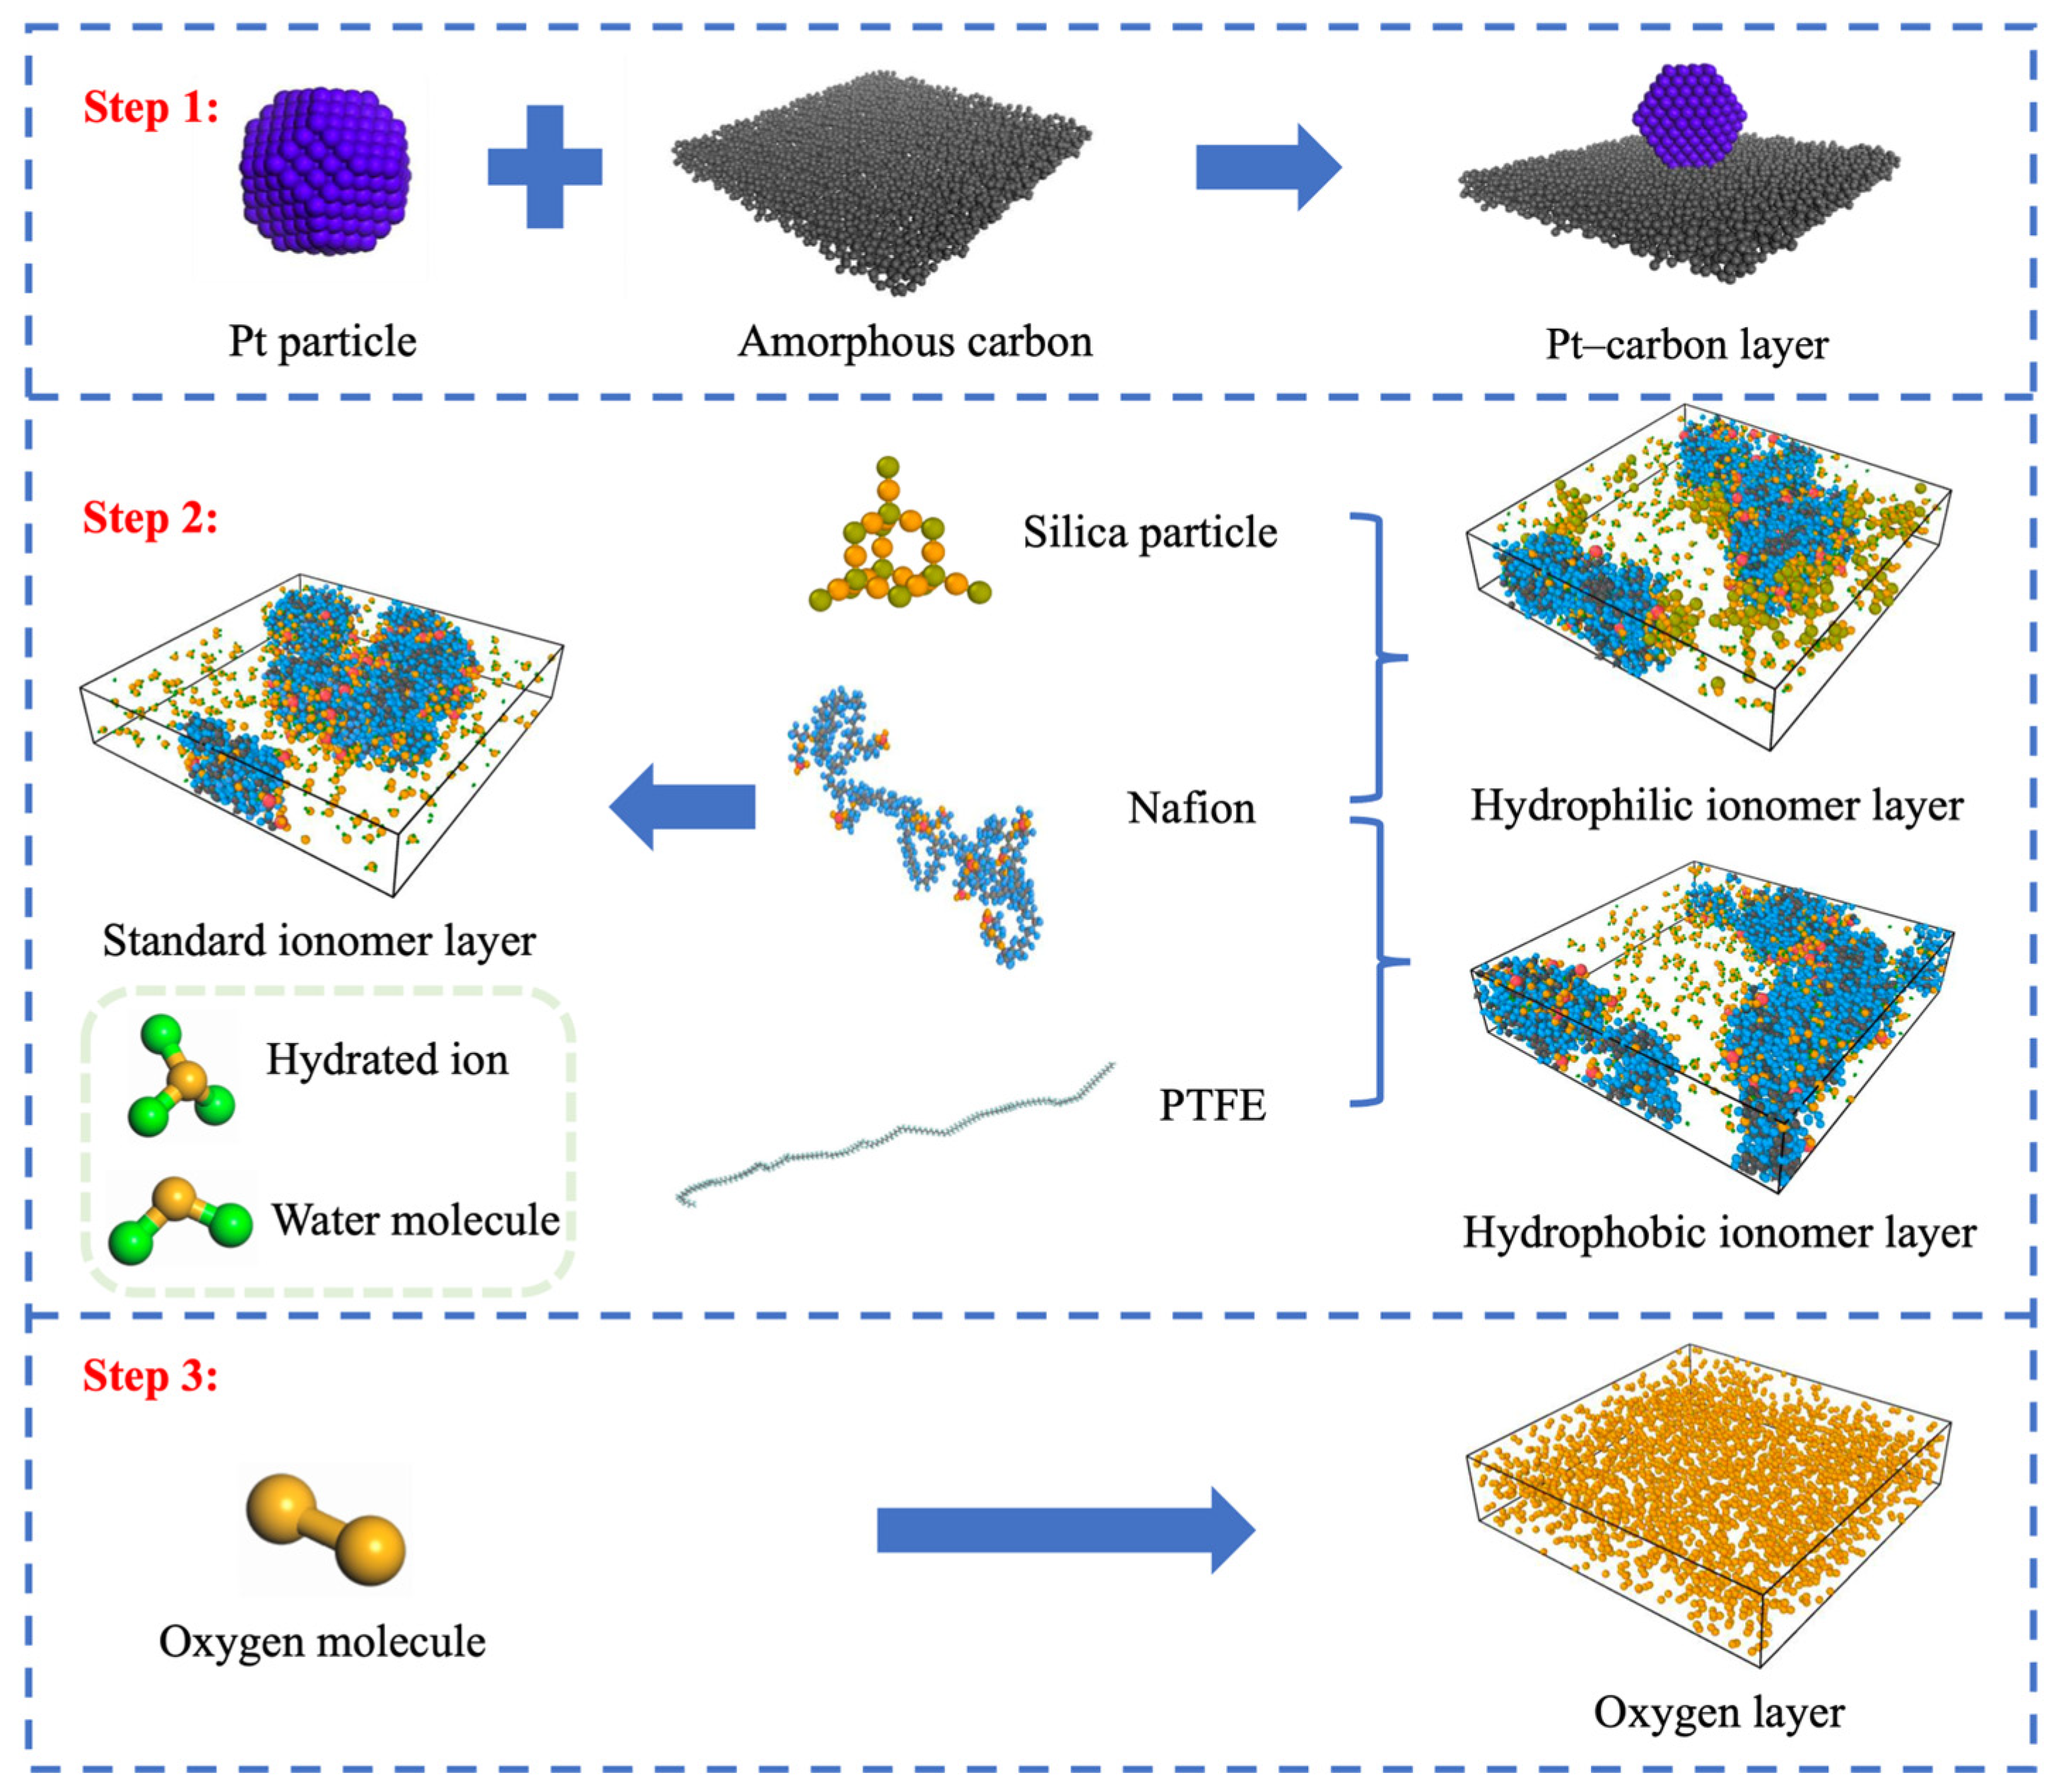
2.1. Modeling of PEMFC Cathode Catalyst Layer

The all-atom molecular dynamics model was constructed with a Pt/C layer, an ionomer layer, an oxygen layer, and a vacuum layer in order from the bottom up. The specific construction process is illustrated in Figure 1.
The amorphous carbon was used in the carbon layer to simulate the Vulcan XC-72 carbon black with a size of 70     ×   70     ×   6   . The Pt particles were cut into truncated octahedrons [22,23] with a diameter of 2.28 nm and were fixed to the carbon layer to ensure the simulation results were unaffected by Pt particle movement. The baseline ionomer layer contained 6 Nafion chains with a polymerization degree of 10, 60 hydrated ions (H3O+), and water molecules. Three different hydration levels (λ = 3, 5, 8) were set, which referred to the number of water molecules and hydrated ions per sulfonate group (-SO32−). The hydrophilic and hydrophobic modifications were realized via adding a designed number of SiO2 or PTFE, respectively. The SiO2 content in the hydrophilic ionomer film was determined by the mass ratio of SiO2 to Nafion, and three gradients of 4.8%, 9.6%, and 14.5% were set, corresponding to the number of SiO2 particles of 5, 10, and 15, respectively. The PTFE chain used in hydrophobic ionomer membranes consisted of 100 -C2F4- monomers and the content was determined likewise by the same standard: four gradients of 15%, 45%, 75%, and 120% were set, corresponding to 1, 3, 5, and 8 PTFE chains, respectively. The oxygen layer was built according to the method mentioned in MD simulations conducted by previous studies [24]. The initial pressure in the oxygen diffusion region was set to 10 MPa to guarantee that the simulation would obtain a sufficient sample of permeable oxygen molecules in a short period. In an attempt to cancel the effect of the periodic boundary conditions on the oxygen mass transfer in the z-axis direction, a vacuum layer region of 100 Å thickness was added above the oxygen layer. The baseline model with different hydration levels was noted as Std (λ = 3/5/8), while other hydrophilic and hydrophobic models were labeled as SiO2-4.8%/9.6%/14.5% (λ = 3/5/8) and PTFE-15%/45%/75%/120% (λ = 3/5/8), respectively.

2.2. MD Simulation Process

The COMPASS force field [25], which is an ab initio force field capable of accurately predicting the structure and thermophysical properties of small inorganic molecules [26], was applied in the simulation. The total potential energy in the COMPASS force field was determined by Equation (1):
E t o t a l = E V d W + E Q + E b o n d + E a n g l e + E t o r s i o n + E c r o s s c o u p l i n g
where E t o t a l , E V d W , E Q , E b o n d , E a n g l e , E t o r s i o n , and E c r o s s c o u p l i n g represent the total potential energy, van der Waals interactions, electrostatic interactions, bonding potentials, angular potentials, dihedral angular twisting potentials, and cross-coupling phases, respectively.
To acquire an equilibrium model, an MD simulation process was conducted using the Forcite modules of Materials Studio. Firstly, the ionomer layer was placed above the Pt/C layer, and geometry optimization was carried out using the steepest descent method [27]. Secondly, the model was subjected to NPT kinetic simulations at 353.15 K and 0.15 MPa for 20 ps. The simulated system was then controlled under the NVT system and four annealing operations were performed with the upper and lower temperature limits set at 1053.15 K and 353.15 K. Thirdly, the kinetic simulations were performed for 20 ps under the NVT system. The annealing and NVT kinetic simulations were repeated three times to confirm that the model reached the equilibrium state. The oxygen layer and the vacuum layer were then added to the above simulated system and the aforementioned simulation steps were duplicated. Finally, a 100 ps constant temperature kinetic simulation was performed under the NVT system to collect data for subsequent analysis of the internal structure and kinetic properties of the model.

2.3. Analysis Methods

To understand the microstructure in ionomer films, the radial distribution function (RDF) was used to embody precise equilibrium information. Four pairs of atoms are emphasized in this work:
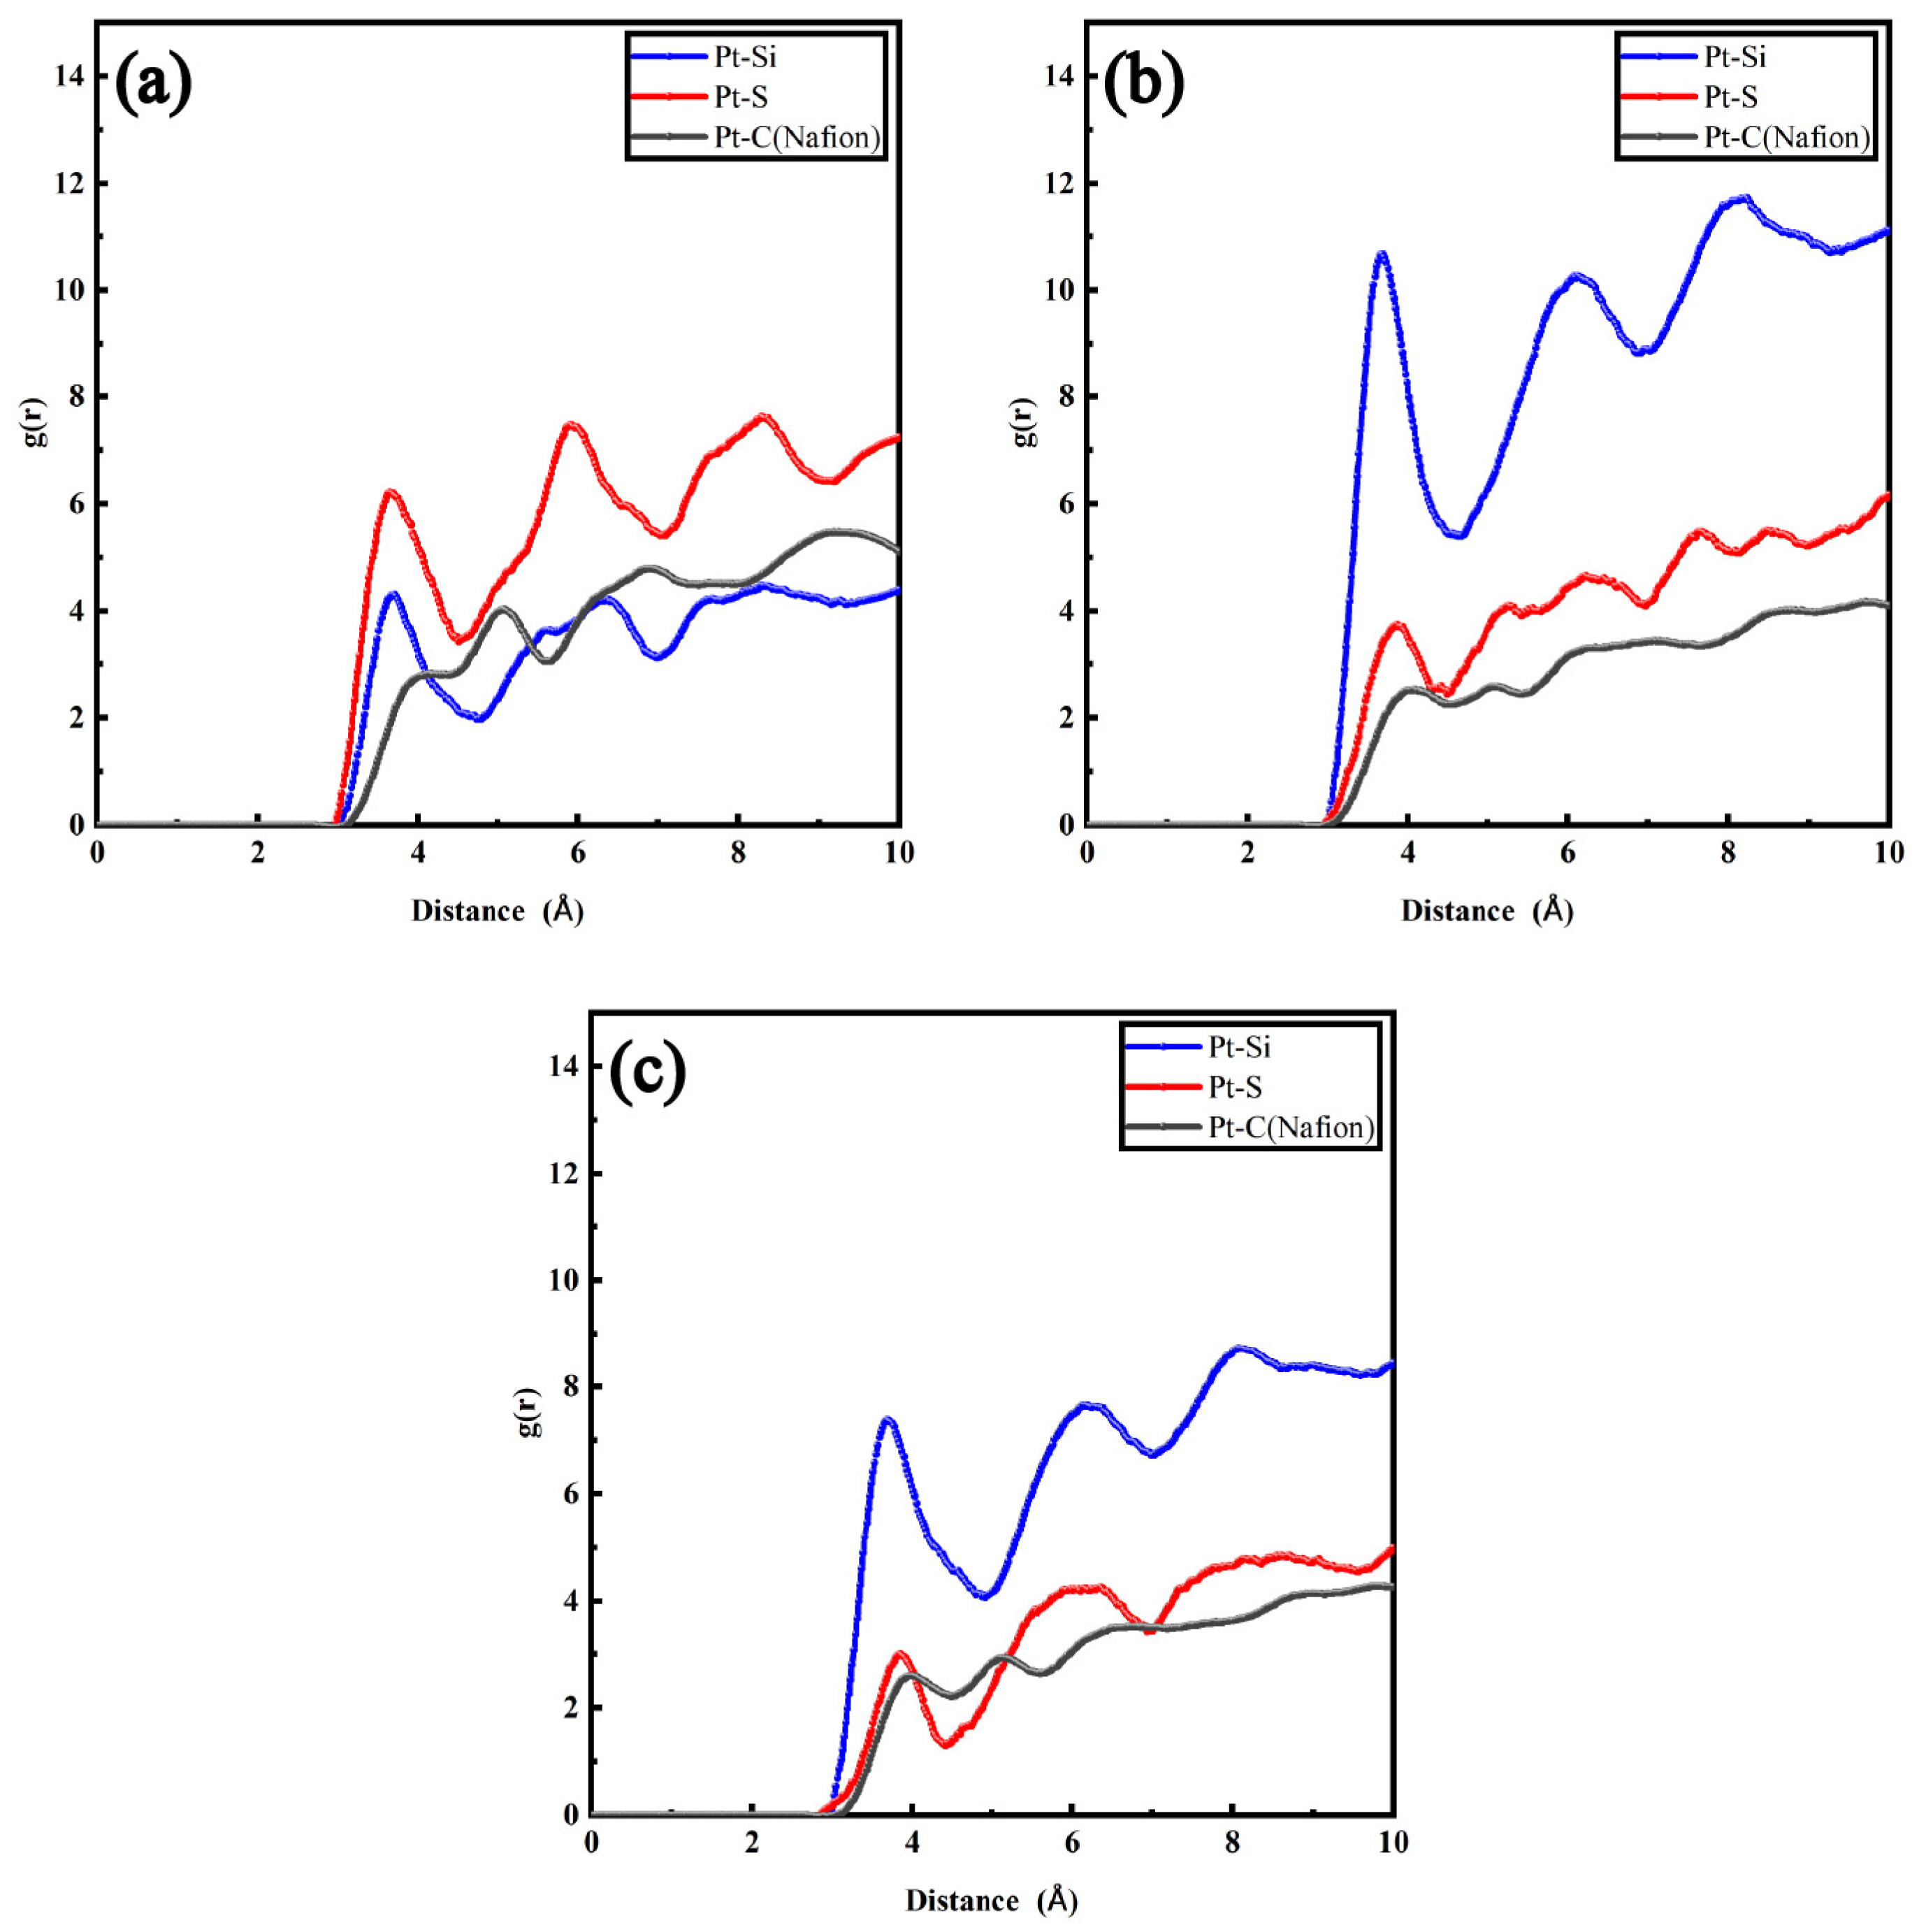
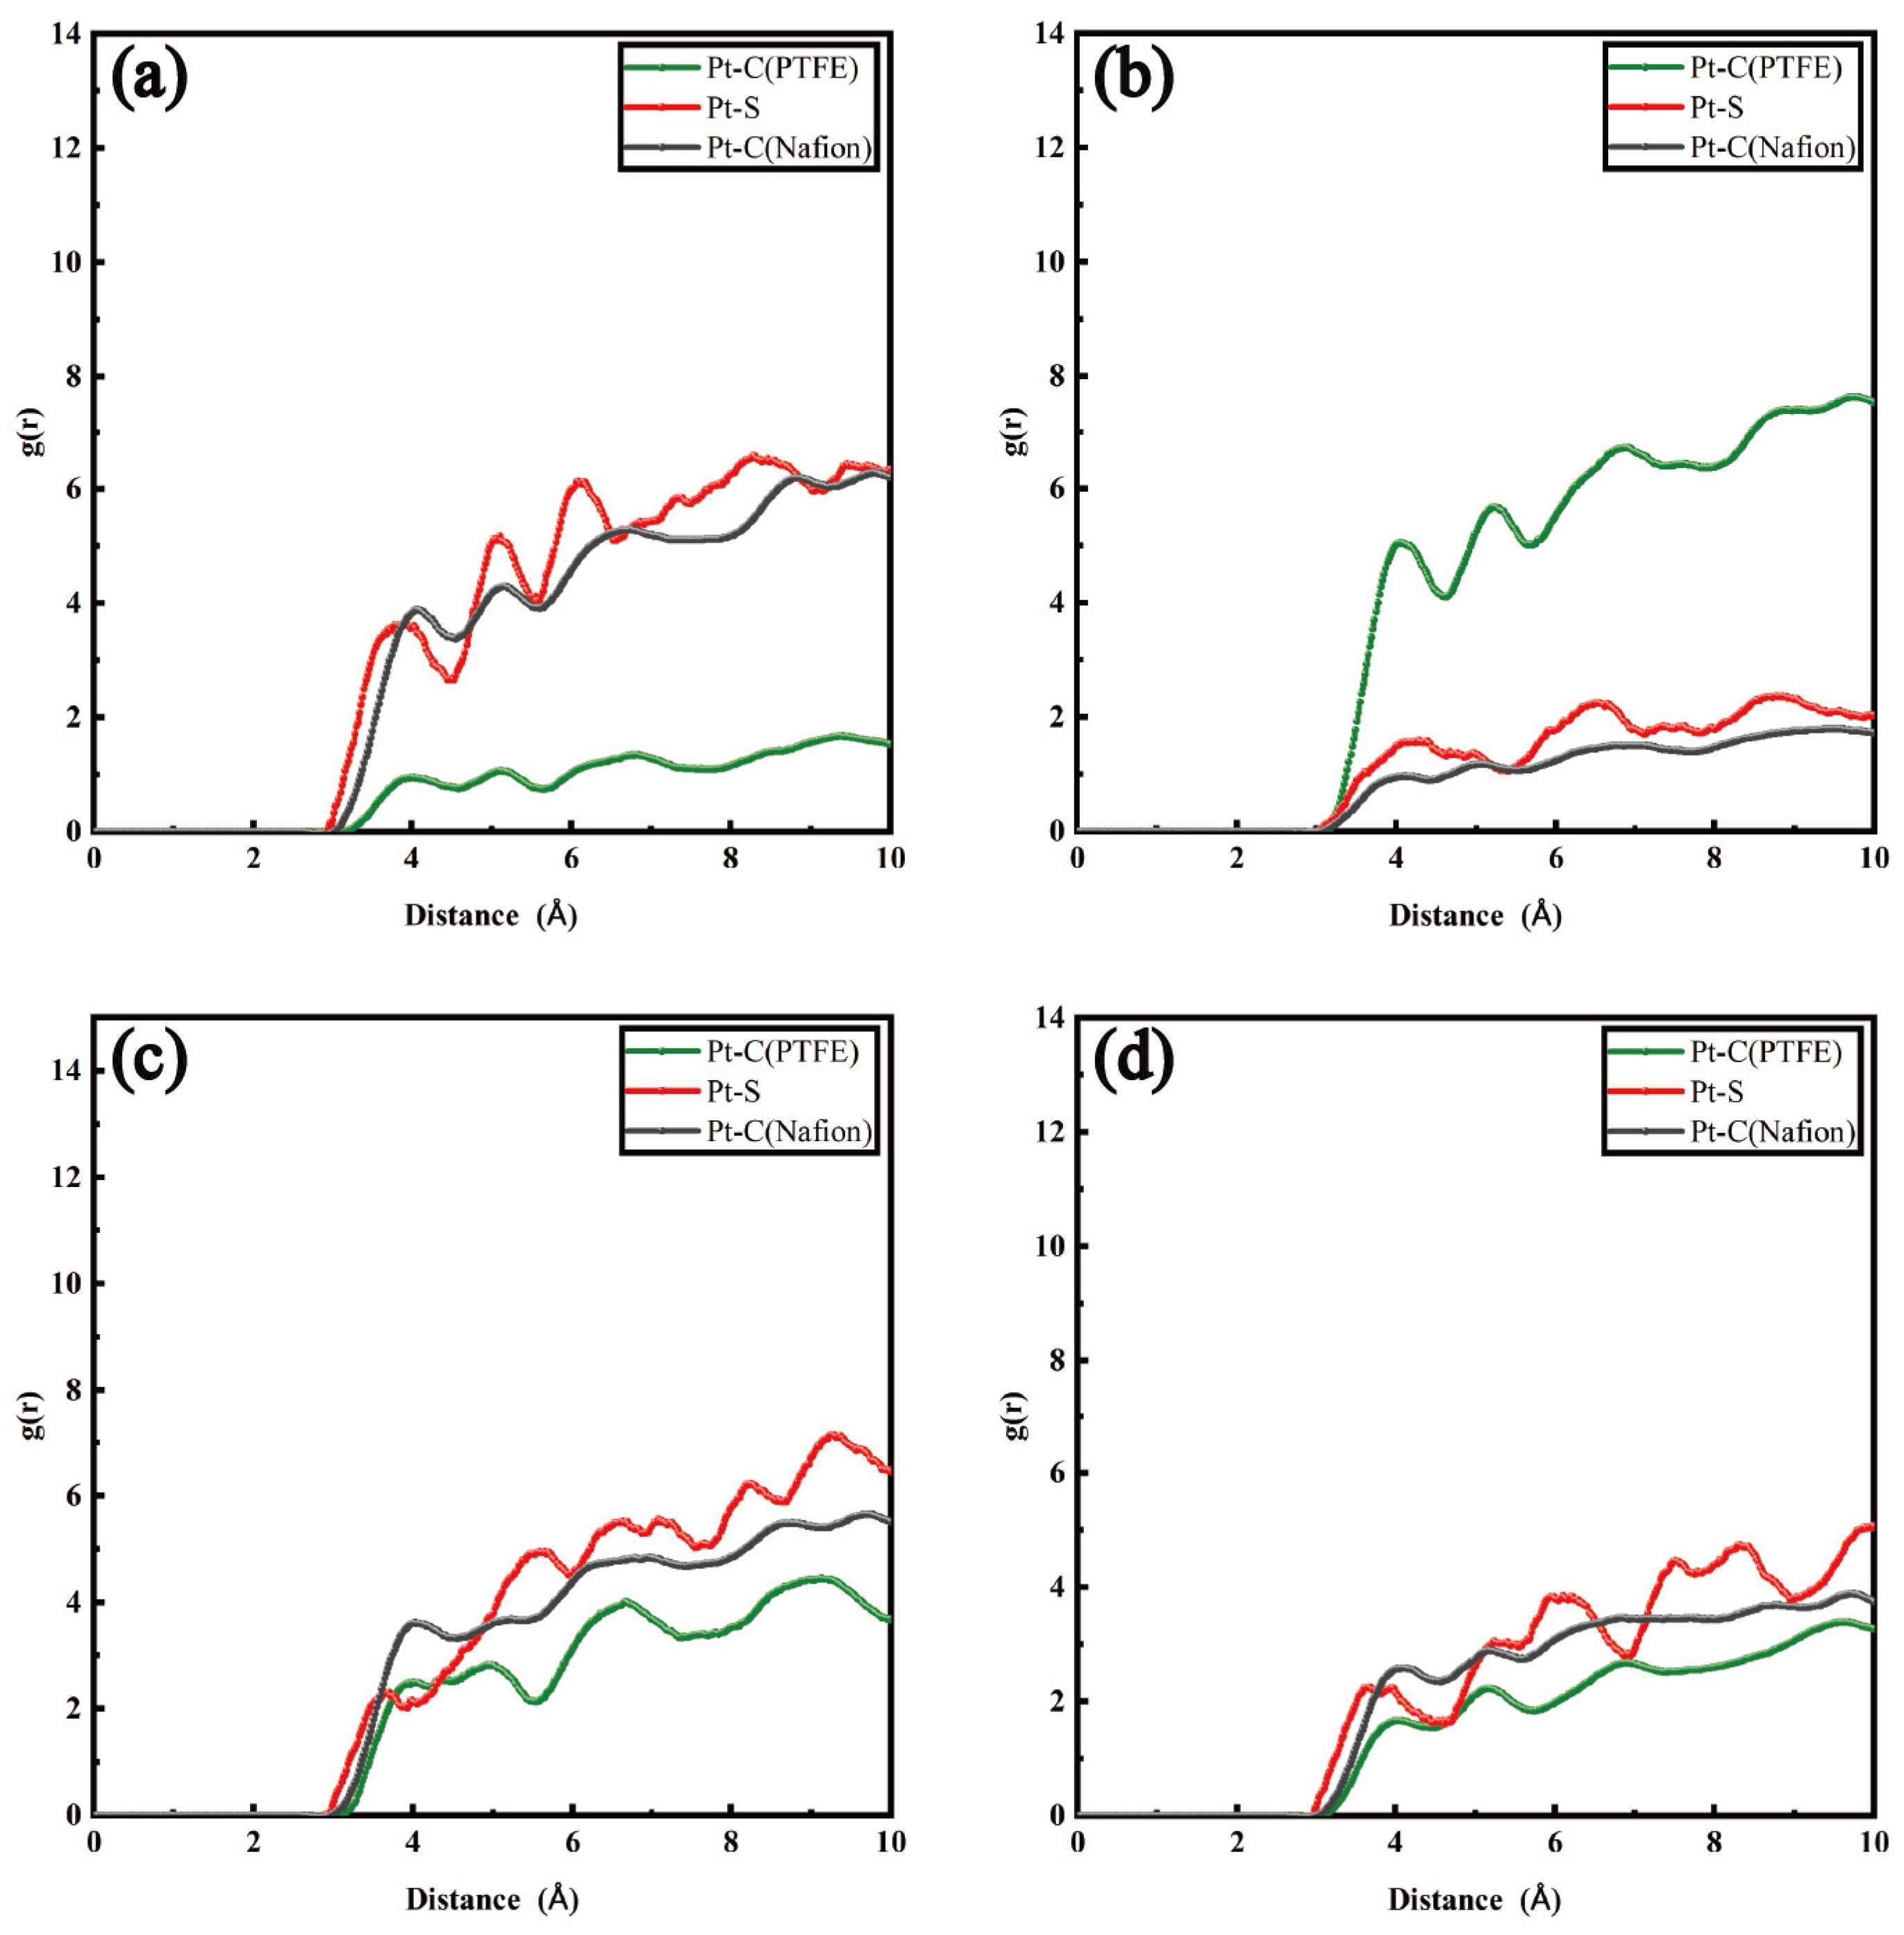
  • Pt with carbon atoms of Nafion backbone ( g P t C ( N a f i o n ) );
  • Pt with sulfur atoms of sulfonate groups ( g P t S ( S O 3 ) );
  • Pt with silicon atoms ( g P t S i );
  • Pt with carbon atoms of PTFE ( g P t C ( P T F E ) ).
The radius of gyration (Rg), as an important structural characterization method, has become an important means of determining the morphology and size of polymers in microscopic research methods. Specifically, Rg is defined as the average distance between the center of mass and the components of the polymer chains, as shown in Equation (2) [28]:
R g 2 = 1 M 1 N m a ( r a r c m ) 2
where M represents the molecular mass of Nafion, m a and r a are the molecular mass and position of atom a , and r c m is the position of the barycenter of Nafion.
To investigate the influence of the hydrophilic and hydrophobic modifications on the transport of oxygen molecules and protons, the self-diffusion coefficient was calculated via mean square displacement (MSD) and Einstein’s relation [29]. The MSD was obtained from the data collected during the 100 ps constant temperature kinetic simulation under the NVT system.
M S D t = 1 N r i t r i 0 2 / N
D = l i m t M S D t / 6 t
where r i t and r i 0 denote the spatial position of molecule i at the moments t > 0 and t = 0 , D represents the self-diffusion coefficient, and N represents the total number of particles of a certain type in the simulated system.

3. Results and Discussion

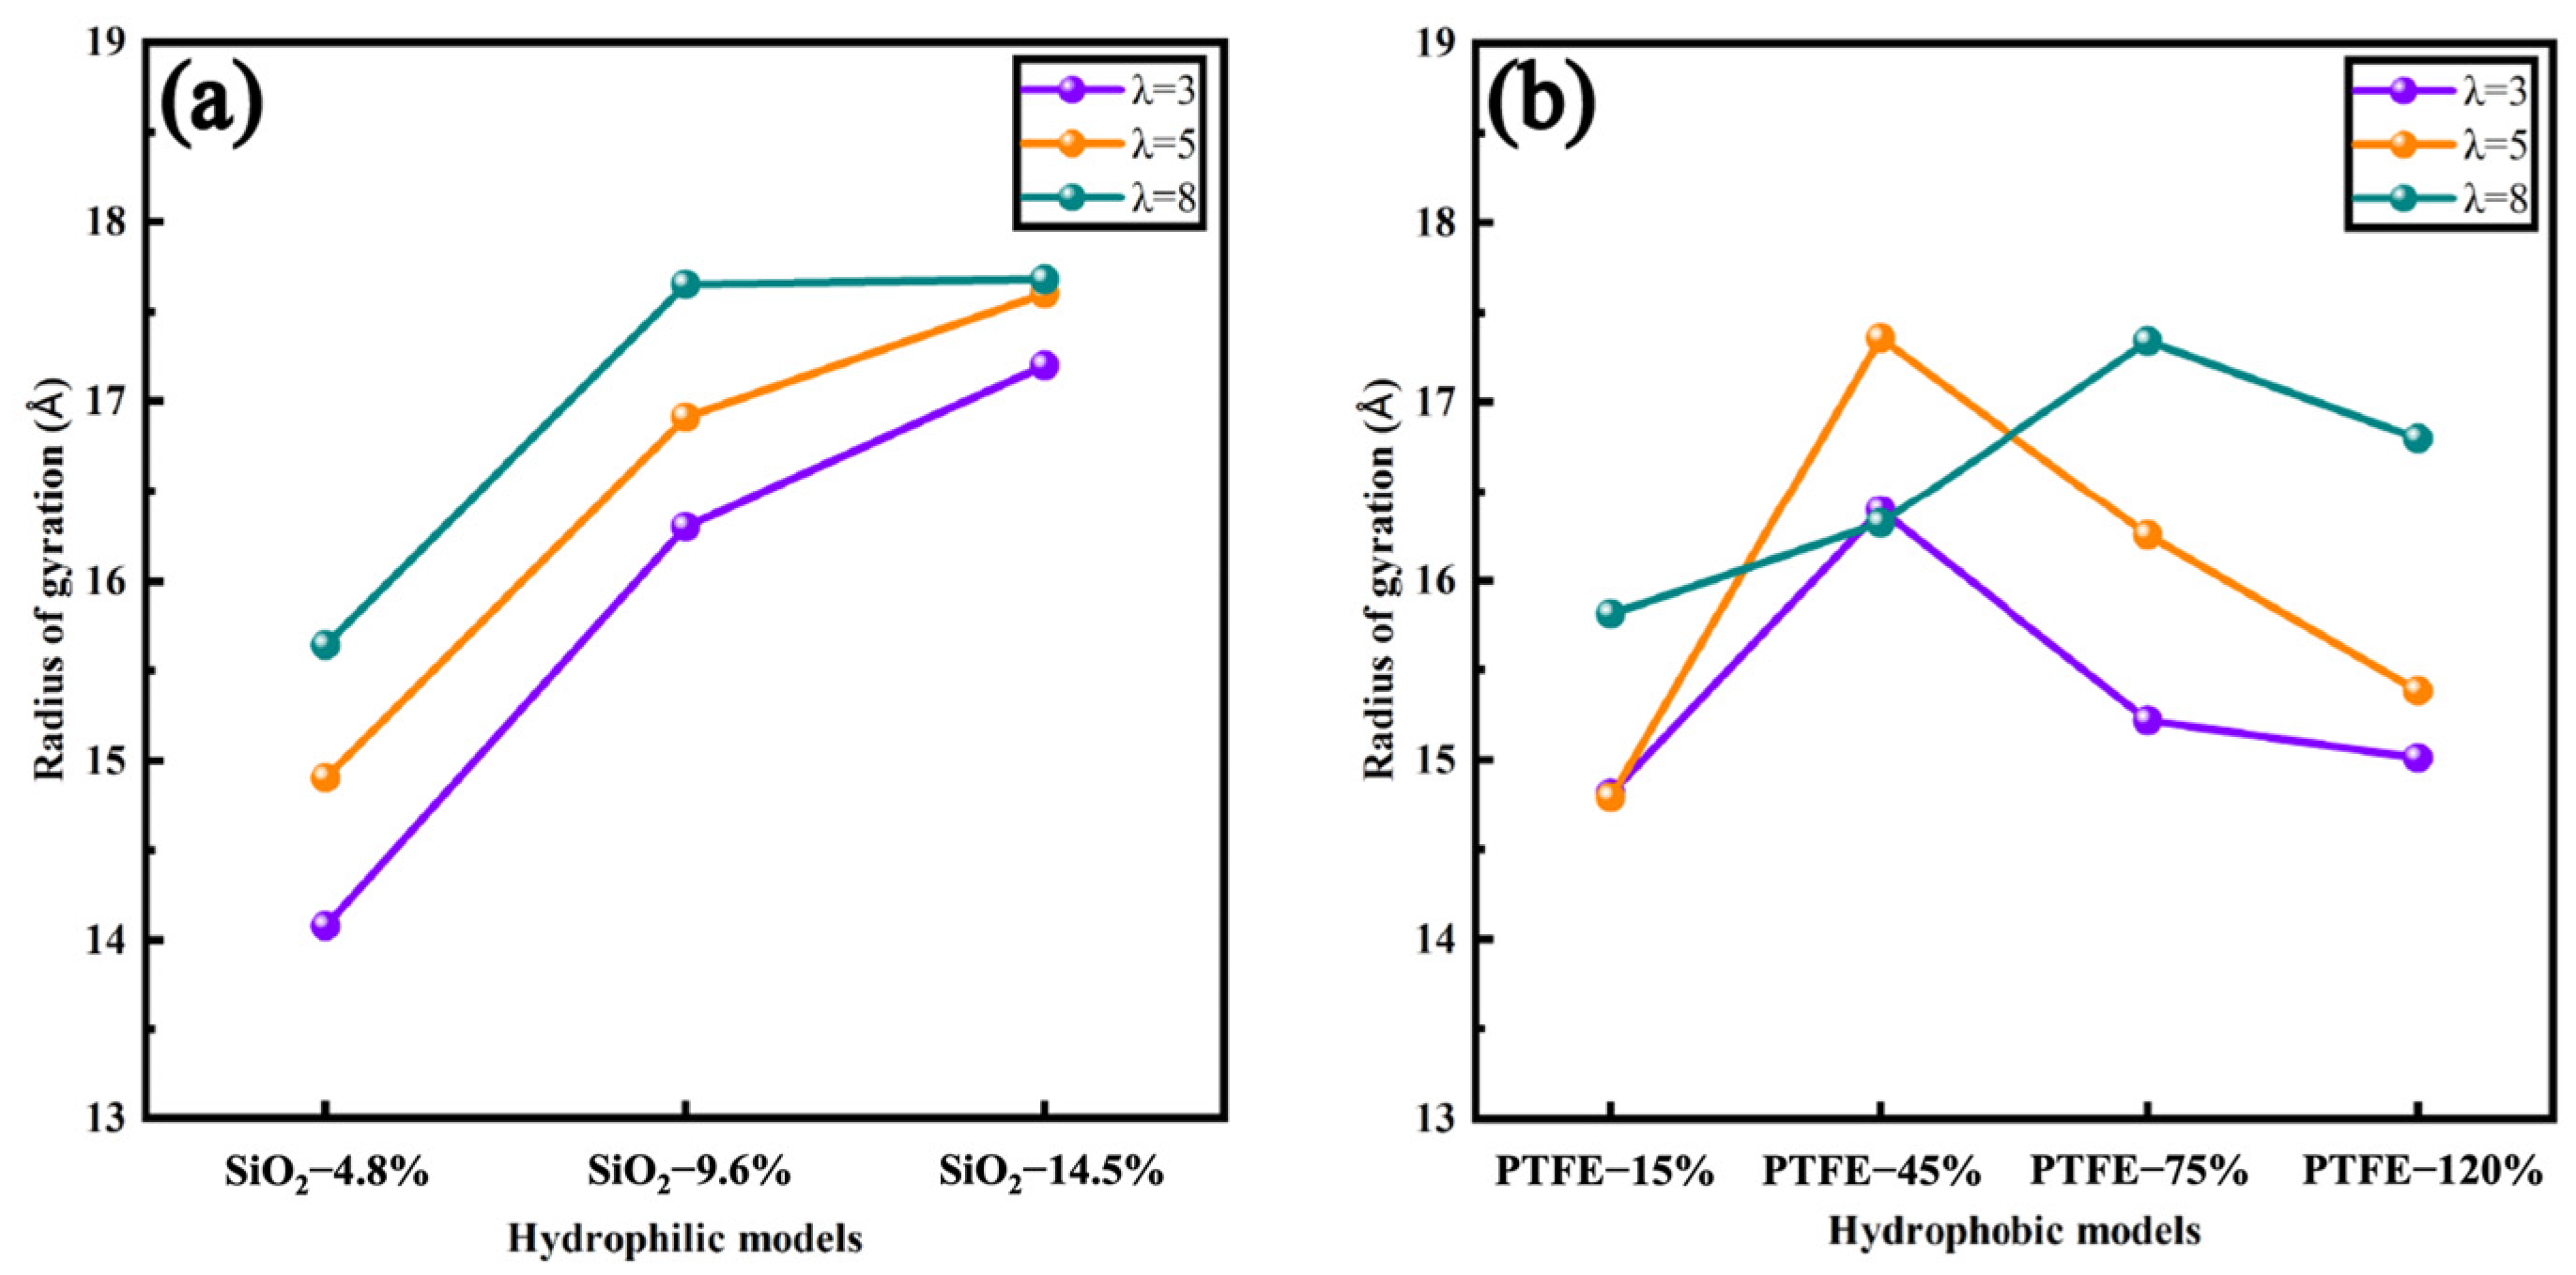
3.1. Analysis of the Equilibrium Structure

The model was replicated 3 × 3 in the XOY plane and cross sections in different orientations were obtained. Oxygen molecules, water molecules, and hydrated ions were removed in order to display the morphological structure inside the simulated system more intuitively. Figure 2, from left to right, sequentially represents three models with a hydration level of five: Figure 2a,d are the pure Nafion models, Figure 2b,e are the hydrophilic models, and Figure 2c,f are the hydrophobic models. In model Std (λ = 5), Nafion was more uniformly covered with Pt particles, and due to the strong interaction of the sulfonate groups of its side chains with Pt [30], Nafion became a cluster structure with the side chains inside the main chains outside. With the addition of SiO2 particles, the thickness of the ionomer film increased and the density decreased. Moreover, SiO2 tended to be distributed around the Pt particles on account of the hydrophilic interaction with Pt particles, thus occupying the original position of Nafion chains. Accordingly, there were more bare sites on the surface of the Pt particles for oxygen, hence effectively improving the ORR rate. Additionally, a larger surface of the carbon layer was exposed to oxygen compared to the baseline model. Similarly, the equilibrium configuration of PTFE-75% (λ = 5) revealed that the addition of the PTFE polymer increased the thickness of the ionomer film, with PTFE replacing some of the Nafion directly on the surface of the Pt particles. In consequence, little of the carbon substrate and Pt particles were left exposed.
To acquire more detailed equilibrium information, the RDFs were considered, as illustrated in Figure 3 and Figure 4. Figure 3 exhibits the RDFs of Pt particles with other atoms inside the hydrophilic catalyst layer with a hydration level λ = 5. The peak value of g P t S ( S O 3 ) appears nearer to Pt than that of g P t C ( N a f i o n ) , which corresponds to the morphological structure illustrated in Figure 2. Among different amounts of SiO2 particles, the curve g P t S i of SiO2-9.6% (Figure 3b) showed the highest peak value, which was 12.66, indicating that a large amount of SiO2 particles were attracted to each other to form a large irregular cluster structure. The porosity of the ionomer became higher, shaping a sparser internal structure. The peak values of SiO2-14.5% (Figure 3c) and SiO2-4.8% (Figure 3a) decreased in order, and were 9.51 and 6.18, respectively. Actually, due to the limited ability of mutual attraction, the increase in the number of SiO2 particles resulted in the formation of several larger clusters, and the aggregation of hydrophilic phases was intensified. In addition, the clusters were inclined to shift away from Pt particles as elaborated in Figure 3c. The increase in the size of SiO2 clusters made it harder to continuously adsorb Pt particles. In the meantime, the peak of g P t C ( N a f i o n ) re-approached the Pt particles, indicating a recoating of Nafion, which was not conducive to the diffusion of oxygen in the ionomer film.
Analogously, a similar tendency was discovered after hydrophobic modifications. In Figure 4b, model PTFE−45% exhibits the highest peak value of g P t C ( P T F E ) with a value of 8.67, and the peak occurred closest to the Pt particles. By contrast, the peak values of the curves g P t C ( N a f i o n ) and g P t S ( S O 3 ) were lower. The peaks appeared far away from the surface of the carbon layer. PTFE was more concentrated around the Pt particles compared to the other hydrophobic models. The original places of Nafion were substituted, leaving more exposed active sites, which indicated that the appearance of PTFE chains forced the Nafion chains far away from the surface of the Pt particles, and the structure of the ionomer film became looser, which was favorable for the diffusion of oxygen molecules inside the ionomer film. When the content of hydrophobic molecules continued to increase from 75% to 120%, the degree of encapsulation of PTFE molecules on the surface of Pt particles declined under the hydrophobic–hydrophobic interactions between the PTFE and the carbon layer. As shown in Figure 4c,d, the peak value of g P t C ( N a f i o n ) decreased and the peaks were located far away from the Pt particles. The Nafion molecules reformed a dense ionomer film on the surface of the Pt particles, which prevented oxygen molecules from reaching the Pt particles.
Not only was the distribution of Nafion affected by hydrophilic and hydrophobic modifications, but the properties of Nafion itself were altered. In this work, the radius of gyration (Rg) of the backbone of Nafion was studied, as illustrated in Figure 5. A general ascending trend of Rg was found as the hydration level of the ionomer increased, which signified an elevated water content led to the expansion of Nafion. Furthermore, the water in Nafion also served as a plasticizer, enhancing the flexibility of the polymer. This increased flexibility allowed the Nafion chains to move and unfold more easily in a moist environment, further augmenting the radius of gyration. In the meantime, SiO2 and PTFE both contributed to an amelioration in Rg because they facilitated the micro-separation of hydrophilic and hydrophobic phases. Separately, SiO2 particles embedded themselves into Nafion, promoting the unfolding of the backbone of Nafion, while the incorporation of PTFE into Nafion introduced additional rigidity and structural integrity to the composite material. Moreover, the hydrophobicity of PTFE altered the swelling dynamics, which led to changes in the spatial arrangement of the Nafion chains, potentially increasing their radius of gyration. Actually, researchers have discovered that the mobilities of Nafion have non-negligible impacts on transport properties [31,32]. Nafion with high backbone mobilities exhibits a less-clustered agglomerate morphology and a proper separation of microphases, which demonstrates the feasibility of hydrophilic and hydrophobic modifications.

3.2. Dynamic Properties

In order to obtain profound comprehension of the dynamic properties, the catalyst layer was divided into three regions based on the relative density distribution of the z-axis (Table 1): the Pt/C surface region, the bulk Nafion region, and the gas/Nafion region. For instance, the division of different regions of Std (λ = 5) is illustrated in Figure 6.
The self-diffusion coefficients of oxygen molecules in different regions of the hydrophilic and hydrophobic models are depicted in Figure 7. As expected, the mass transfer rate of oxygen molecules decreased significantly as they approached the Pt surface. Experiments and simulations demonstrated that the dense ionomer film adjacent to the Pt surface impeded oxygen from reaching the TPB sites, thus becoming the dominant part of local oxygen transport resistance [33,34]. Additionally, the inhibition effect of the ionomer has been proven to arise from the specific adsorption of sulfonate groups and Pt particles [35,36]. Accordingly, the change in the oxygen transfer rate in bulk Nafion regions and Pt/C surface regions should be given great importance. The simulation results exhibit a similar trend in both hydrophilic and hydrophobic models. The diffusion ability of oxygen molecules tended to be enhanced and then weakened with the increase in SiO2 particles or PTFE content, and the optimal contents of additives were SiO2-9.6% and PTFE-45%, respectively. Normally, oxygen molecules diffuse mainly through two types of regions: the interface region between the hydrophilic and hydrophobic domain, and the free volume created by ionomer and Pt particles [37]. Therefore, a moderate amount of SiO2 particles or PTFE not only promoted the separation of hydrophilic and hydrophobic phases but contributed to a porous intramembrane structure, thus reducing the Knudsen diffusion resistance [38]. However, excessive additives hindered the diffusion process of oxygen in different ways. On the one hand, the over-doping of SiO2 particles resulted in an over-concentration of hydrophilic phases. Water droplets continued building up to the point of clogging the gas transport channels. On the other hand, excessive amounts of PTFE aggregated in the vicinity of the Pt and carbon layer, hence reforming a dense film and diminishing the number of active sites.
Figure 7c,d exhibit the effect of different hydration levels on hydrophilic and hydrophobic models. A better performance of oxygen diffusion ability could be observed in hydrophilic models with low humidity, while hydrophobic models were better alternatives for oxygen transport with the increase in the hydration level. Studies have found that the increase in relative humidity will weaken the adsorption of oxygen on the gas/Nafion surface, but will enhance the diffusion of oxygen inside the bulk Nafion regions [39,40]. Therefore, possible explanations can be deduced that under low humidity conditions, SiO2 particles favor the diffusion process via adsorbing water molecules by their hydrophilicity compared with PTFE, thus retaining sufficient transport channels for oxygen molecules. When the hydration level is augmented, PTFE can still guarantee the adsorption rate while providing a loose intramembrane structure. Hence, hydrophobic modifications are more suitable for high-humidity membranes.
As illustrated in Figure 8, both hydrophilic and hydrophobic modifications improved the diffusion ability of hydrated ions. Specifically, the self-diffusion coefficient of hydrated ions decreases with the increasing SiO2 content. By contrast, the diffusion ability of hydrated ions generally increases with the increase in hydrophobicity, and this pattern is consistent with other researchers’ studies on the enhancement of the diffusion ability of hydrated ions by hydrophobic ionomer films [15]. Meanwhile, the conduction rate of hydrated ions increased continuously with increasing hydration levels, matching the pattern summarized by previous studies [41,42]. In addition, the results show that the conduction rate of hydrated ions in hydrophobic ionomer films was higher than that in hydrophilic ionomer films, and the gap widened as the hydration level kept increasing. Researchers have found that the vehicular mechanism plays a dominant role under low-hydration-level conditions, while the “Grotthus” hopping mechanism becomes more important under high hydration levels [43,44]. In concrete terms, protons are mainly conducted as H(H2O)n+ (i.e., H3O+, H5O2+, H9O4+) through water transport channels inside low-hydration-level membranes. Therefore, at a certain hydration level, excessive SiO2 would immobilize water molecules and hydrated ions in the membrane structure and lead to an incomplete hydrogen-bond network, which would reduce the rate of proton conduction. Nevertheless, in high-hydration-level membranes, hydrophobic particles attenuated the polar interactions between the water molecules and Pt particles and facilitated the formation of complete hydrogen-bond networks. In consequence, the conduction rate of hydrated ions could be ameliorated.

4. Conclusions

In this research, a molecular dynamics model of PEMFC cathode catalyst layers with different hydration levels was constructed using Materials Studio, focusing on the impact of hydrophilic and hydrophobic modifications of ionomer films by adding a hydrophilic substance, SiO2, or a hydrophobic substance, PTFE. The addition of SiO2 improved the connectivity between water molecules, thus creating more transport channels for protons, while the addition of PTFE weakened the strong adsorption between water molecules and Pt particles. Moreover, the addition of SiO2 or PTFE enabled Nafion to unfold and enhance the mobilities, resulting in a better microphase separation. Additionally, an appropriate amount of SiO2 or PTFE could improve the self-diffusion coefficient of oxygen, whereas excessive SiO2 or PTFE would block the oxygen transport channels and thus hinder oxygen transport. In the meantime, both hydrophilic and hydrophobic modifications were able to enhance the proton conductivity in the ionomer films. The optimal contents of SiO2 and PTFE for each hydration level in this work are 9.6% and 45%, respectively, and these quantitative results provide a theoretical basis for further studies.

Author Contributions

Conceptualization, G.W. and C.W.; methodology, G.W. and L.Y.; validation, C.W. and J.Y.; formal analysis, Q.Z.; investigation, L.Y. and Q.Z.; writing—original draft preparation, Q.Z.; writing—review and editing, J.Y.; funding acquisition, J.Z.; project administration, J.Z.; All authors have read and agreed to the published version of the manuscript.

Funding

This research was funded by the National Key Research and Development Program of China, grant number 2022YFB4003504.

Institutional Review Board Statement

Not applicable.

Data Availability Statement

Data are contained within the article.

Conflicts of Interest

Author Chao WANG was employed by the company Zhejiang TangFeng Energy Technology Co., Ltd. Author Lina YU was employed by the company Commercial Vehicle Development Institute, FAW Jiefang Automotive Co., Ltd. The remaining authors declare that the research was conducted in the absence of any commercial or financial relationships that could be construed as a potential conflict of interest.

References

  1. Song, C.; Xie, S.-X.; Xu, R.-F. Development Prospect of Hydrogen Energy Industry and its Development Path in China. Chem. Enterp. Manag. 2021, 7–8. [Google Scholar] [CrossRef]
  2. O’hayre, R.; Cha, S.-W.; Colella, W.; Prinz, F.B. Fuel Cell Fundamentals; John Wiley & Sons: Hoboken, NJ, USA, 2016. [Google Scholar]
  3. Sun, F.; Liu, H.; Di, Q.; Xu, K.; Chen, M.; Wang, H. Tailoring the Pt/ionomer interface for enhancing the local oxygen transport in proton exchange membrane fuel cells. J. Mater. Chem. A 2023, 11, 24026–24037. [Google Scholar] [CrossRef]
  4. Liu, S.; Yuan, S.; Liang, Y.; Li, H.; Xu, Z.; Xu, Q.; Yin, J.; Shen, S.; Yan, X.; Zhang, J. Engineering the catalyst layers towards enhanced local oxygen transport of Low-Pt proton exchange membrane fuel cells: Materials, designs, and methods. Int. J. Hydrogen Energy 2023, 48, 4389–4417. [Google Scholar] [CrossRef]
  5. Kongkanand, A.; Mathias, M.F. The priority and challenge of high-power performance of low-platinum proton-exchange membrane fuel cells. J. Phys. Chem. Lett. 2016, 7, 1127–1137. [Google Scholar] [CrossRef]
  6. Khajeh-Hosseini-Dalasm, N.; Kermani, M.J.; Moghaddam, D.G.; Stockie, J.M. A parametric study of cathode catalyst layer structural parameters on the performance of a PEM fuel cell. Int. J. Hydrogen Energy 2010, 35, 2417–2427. [Google Scholar] [CrossRef]
  7. Yan, S.; Yang, M.; Sun, C.; Xu, S. Liquid water characteristics in the compressed gradient porosity gas diffusion layer of proton exchange membrane fuel cells using the Lattice Boltzmann Method. Energies 2023, 16, 6010. [Google Scholar] [CrossRef]
  8. Xu, G.; Wu, Z.; Wei, Z.; Zhang, W.; Wu, J.; Li, Y.; Li, J.; Qu, K.; Cai, W. Non-destructive fabrication of Nafion/silica composite membrane via swelling-filling modification strategy for high temperature and low humidity PEM fuel cell. Renew. Energy 2020, 153, 935–939. [Google Scholar] [CrossRef]
  9. Liang, H.G.; Dang, D.; Xiong, W.; Song, H.Y.; Liao, S.J. High-performance self-humidifying membrane electrode assembly prepared by simultaneously adding inorganic and organic hygroscopic materials to the anode catalyst layer. J. Power Sources 2013, 241, 367–372. [Google Scholar] [CrossRef]
  10. Ye, Y.-K. Enhancement of Pt/C Catalyst Durability in Proton Exchange Membrane Fuel Cells by Thin Oxide Coating on the Surface of Pt Nanoparticles. Ph.D. Thesis, South China University of Technology, Guangzhou, China, 2020. [Google Scholar]
  11. Islam, J.; Kim, S.K.; Kim, K.H.; Lee, E.; Park, G.G. Enhanced durability of Pt/C catalyst by coating carbon black with silica for oxygen reduction reaction. Int. J. Hydrogen Energy 2021, 46, 1133–1143. [Google Scholar] [CrossRef]
  12. Adjemian, K.T.; Lee, S.J.; Srinivasan, S.; Benziger, J.; Bocarsly, A.B. Silicon oxide Nafion composite membranes for proton-exchange membrane fuel cell operation at 80–140 degrees C. J. Electrochem. Soc. 2002, 149, A256–A261. [Google Scholar] [CrossRef]
  13. Chao, W.-K.; Lee, C.-M.; Tsai, D.-C.; Chou, C.-C.; Hsueh, K.-L.; Shieu, F.-S. Improvement of the proton exchange membrane fuel cell (PEMFC) performance at low-humidity conditions by adding hygroscopic γ-Al2O3 particles into the catalyst layer. J. Power Sources 2008, 185, 136–142. [Google Scholar] [CrossRef]
  14. Yang, H.; Lee, W.; Choi, B.; Ko, Y.; Yi, S.; Kim, W. Self-humidifying Pt-C/Pt-TiO2 dual-catalyst electrode membrane assembly for proton-exchange membrane fuel cells. Energy 2017, 120, 12–19. [Google Scholar] [CrossRef]
  15. Lee, J.H.; Doo, G.; Kwon, S.H.; Kang, H.; Choi, S.; Yim, S.-D.; Kim, H.-T.; Lee, S.G. Controlling Ionomer Film Morphology through Altering Pt Catalyst Surface Properties for Polymer Electrolyte Membrane Fuel Cells. ACS Appl. Polym. Mater. 2020, 2, 1807–1818. [Google Scholar] [CrossRef]
  16. Veeramasuneni, S.; Drelich, J.; Miller, J.D.; Yamauchi, G. Hydrophobicity of ion-plated PTFE coatings. Prog. Org. Coat. 1997, 31, 265–270. [Google Scholar] [CrossRef]
  17. Kim, D.-H.; Jung, H.-S.; Chun, H.; Pak, C. Enhanced membrane electrode assembly performance by adding PTFE/Carbon black for high temperature polymer electrolyte membrane fuel cell. Int. J. Hydrogen Energy 2021, 46, 29424–29431. [Google Scholar] [CrossRef]
  18. Sun, F.; Liu, H.; Chen, M.; Wang, H. Boosting oxygen transport through mitigating the interaction between Pt and ionomer in proton exchange membrane fuel cell. J. Power Sources 2023, 553, 232240. [Google Scholar] [CrossRef]
  19. Wang, W.K.; Qu, Z.G.; Wang, X.L.; Zhang, J.F. A Molecular Model of PEMFC Catalyst Layer: Simulation on Reactant Transport and Thermal Conduction. Membranes 2021, 11, 148. [Google Scholar] [CrossRef]
  20. Kato, M.; Henry, A.; Graham, S.; Doan, D.H.; Fushinobu, K. Molecular dynamics simulation of oxygen transport characteristics in the electrolyte membrane of PEMFC. Int. J. Numer. Method Heat 2018, 28, 289–296. [Google Scholar] [CrossRef]
  21. Liu, Z. Molecular Dynamics Study of the Structure and Migration Properties of Proton-Limited Domains in Perfluorosulfonic Acid Membranes. Ph.D. Thesis, Dalian University of Technology, Dalian, China, 2017. [Google Scholar]
  22. Yoo, J.W.; Hathcock, D.; El-Sayed, M.A. Characterization of pt nanoparticles encapsulated in Al2O3 and their catalytic efficiency in propene hydrogenation. J. Phys. Chem. A 2002, 106, 2049–2054. [Google Scholar] [CrossRef]
  23. Song, H.; Kim, F.; Connor, S.; Somorjai, G.A.; Yang, P.D. Pt nanocrystals: Shape control and Langmuir-Blodgett monolayer formation. J. Phys. Chem. B 2005, 109, 188–193. [Google Scholar] [CrossRef]
  24. Kurihara, Y.; Mabuchi, T.; Tokumasu, T. Molecular Analysis of Structural Effect of Ionomer on Oxygen Permeation Properties in PEFC. J. Electrochem. Soc. 2017, 164, F628–F637. [Google Scholar] [CrossRef]
  25. Sun, H. COMPASS: An ab initio force-field optimized for condensed-phase applications—Overview with details on alkane and benzene compounds. J. Phys. Chem. B 1998, 102, 7338–7364. [Google Scholar] [CrossRef]
  26. Yang, J.; Ren, Y.; Tian, A.M.; Sun, H.A. COMPASS force field for 14 inorganic molecules, He, Ne, Ar, Kr, Xe, H-2, O-2, N-2, NO, CO, CO2, NO2, CS2, and SO2, in liquid phases. J. Phys. Chem. B 2000, 104, 4951–4957. [Google Scholar] [CrossRef]
  27. Bruix, A.; Neyman, K.M. Modeling Ceria-Based Nanomaterials for Catalysis and Related Applications. Catal Lett. 2016, 146, 2053–2080. [Google Scholar] [CrossRef]
  28. McNaught, A.D.; Wilkinson, A. Compendium of Chemical Terminology; Blackwell Science Oxford: Oxford, UK, 1997; Volume 1669. [Google Scholar]
  29. Rapaport, D.C.; Rapaport, D.C.R. The Art of Molecular Dynamics Simulation; Cambridge University Press: Cambridge, UK, 2004. [Google Scholar]
  30. Venkatnathan, A.; Devanathan, R.; Dupuis, M. Atomistic simulations of hydrated Nafion and temperature effects on hydronium ion mobility. J. Phys. Chem. B 2007, 111, 7234–7244. [Google Scholar] [CrossRef]
  31. Kim, T.-H.; Yoo, J.H.; Maiyalagan, T.; Yi, S.-C. Influence of the Nafion agglomerate morphology on the water-uptake behavior and fuel cell performance in the proton exchange membrane fuel cells. Appl. Surf. Sci. 2019, 481, 777–784. [Google Scholar] [CrossRef]
  32. Kim, T.-H.; Yi, J.-Y.; Jung, C.-Y.; Jeong, E.; Yi, S.-C. Solvent effect on the Nafion agglomerate morphology in the catalyst layer of the proton exchange membrane fuel cells. Int. J. Hydrogen Energy 2017, 42, 478–485. [Google Scholar] [CrossRef]
  33. Lee, J.H.; Kang, H.; Yim, S.-D.; Sohn, Y.-J.; Lee, S.G. Revelation of transport properties of ultra-thin ionomer films in catalyst layer of polymer electrolyte membrane fuel cells using molecular dynamics. Appl. Surf. Sci. 2022, 598, 153815. [Google Scholar] [CrossRef]
  34. Fan, L.; Wang, Y.; Jiao, K. Enhancing oxygen transport in the ionomer film on platinum catalyst using ionic liquid additives. Fundam. Res. 2022, 2, 230–236. [Google Scholar] [CrossRef]
  35. Toney, M.F.; Howard, J.N.; Richer, J.; Borges, G.L.; Gordon, J.G.; Melroy, O.R.; Wiesler, D.G.; Yee, D.; Sorensen, L.B. Voltage-dependent ordering of water molecules at an electrode–electrolyte interface. Nature 1994, 368, 444–446. [Google Scholar] [CrossRef]
  36. Ahmed, M.; Morgan, D.; Attard, G.A.; Wright, E.; Thompsett, D.; Sharman, J. Unprecedented structural sensitivity toward average terrace width: Nafion adsorption at Pt {hkl} electrodes. J. Phys. Chem. C 2011, 115, 17020–17027. [Google Scholar] [CrossRef]
  37. Lee, J.H.; Kwon, S.H.; Kang, H.; Lee, J.H.; Lee, S.G. Investigation of structural and transport properties of highly oxygen-permeable ionomer in polymer electrolyte membrane fuel cells using molecular dynamics simulations. J. Ind. Eng. Chem. 2023, 123, 418–427. [Google Scholar] [CrossRef]
  38. Wan, Z.; Liu, S.; Zhong, Q.; Jin, A.; Pan, M. Mechanism of improving oxygen transport resistance of polytetrafluoroethylene in catalyst layer for polymer electrolyte fuel cells. Int. J. Hydrogen Energy 2018, 43, 7456–7464. [Google Scholar] [CrossRef]
  39. Takamura, Y.; Nakashima, E.; Yamada, H.; Tasaka, A.; Inaba, M. Effects of temperature and relative humidity on oxygen permeation in Nafion® and sulfonated poly (arylene ether sulfone). ECS Trans. 2008, 16, 881. [Google Scholar] [CrossRef]
  40. Novitski, D.; Holdcroft, S. Determination of O2 mass transport at the Pt| PFSA ionomer interface under reduced relative humidity. ACS Appl. Mater. Interfaces 2015, 7, 27314–27323. [Google Scholar] [CrossRef] [PubMed]
  41. Perrin, J.C.; Lyonnard, S.; Volino, F. Quasielastic neutron scattering study of water dynamics in hydrated nafion membranes. J. Phys. Chem. C 2007, 111, 3393–3404. [Google Scholar] [CrossRef]
  42. Chen, L.; Tao, W.-Q.; Li, Z.-Z.; Zhou, W.-J. Molecular dynamics simulations of water and proton diffusion within the PEM. J. Therm. Sci. 2010, 31, 1917–1920. [Google Scholar]
  43. Kusoglu, A.; Weber, A.Z. New insights into perfluorinated sulfonic-acid ionomers. Chem. Rev. 2017, 117, 987–1104. [Google Scholar] [CrossRef]
  44. Kreuer, K. On the development of proton conducting polymer membranes for hydrogen and methanol fuel cells. J. Membr. Sci. 2001, 185, 29–39. [Google Scholar] [CrossRef]
Figure 1. Flow chart of the model construction. The gray, purple, red, blue, green, orange, and olive spheres represent carbon, platinum, sulfur, fluorine, hydrogen, oxygen, and silicon atoms, respectively.
Polymers 16 00668 g001
Figure 2. Morphology of different catalyst layers: (a,d) Std (λ = 5); (b,e) SiO2-9.6% (λ = 5); (c,f) PTFE-75% (λ = 5).
Polymers 16 00668 g002
Figure 3. RDFs of different atom groups in hydrophilic catalyst layers: (a) SiO2-4.8% (λ = 5); (b) SiO2-9.6% (λ = 5); (c) SiO2-14.5% (λ = 5).
Polymers 16 00668 g003
Figure 4. RDFs of different atom groups in hydrophobic catalyst layers: (a) PTFE−15% (λ = 5); (b) PTFE−45% (λ = 5); (c) PTFE−75% (λ = 5); (d) PTFE−120% (λ = 5).
Polymers 16 00668 g004
Figure 5. Rg of carbon atoms on the backbone of Nafion: (a) hydrophilic models; (b) hydrophobic models.
Polymers 16 00668 g005
Figure 6. Relative concentration profile of Std (λ = 5) and division of different regions.
Polymers 16 00668 g006
Figure 7. Self-diffusion coefficient of oxygen molecules influenced by various factors: (a) SiO2 content (λ = 5); (b) PTFE content (λ = 5); (c) water content in hydrophilic models; (d) water content in hydrophobic models.
Polymers 16 00668 g007
Figure 8. Self-diffusion coefficient of hydrated ions influenced by various factors: (a) SiO2 content (λ = 5); (b) PTFE content (λ = 5); (c) water content.
Polymers 16 00668 g008
Table 1. Basis for the regional division of the cathode catalyst layer.
RegionsDivision Basis
Pt/C surface regionThe region between the location where the relative density of the ionomer film increases from the surface of the carbon layer in the z-axis direction to 0.1 and the location where the first peak in the density of the ionomer film occurs.
Bulk Nafion regionThe region between the location of the first peak in the density of the ionomer film and the location of the last peak.
Nafion/gas regionThe area between the location where the first peak in the density of the ionomer film occurs and the location where the relative density of the ionomer film is less than 0.1.
Disclaimer/Publisher’s Note: The statements, opinions and data contained in all publications are solely those of the individual author(s) and contributor(s) and not of MDPI and/or the editor(s). MDPI and/or the editor(s) disclaim responsibility for any injury to people or property resulting from any ideas, methods, instructions or products referred to in the content.

