1. Introduction
Semicrystalline polymers, characterized by a complex, multilevel structure, exhibit unique physical properties that allow them to replace other types of materials, such as wood, glass or steel, in various industrial applications [
1]. The advantages of these materials led to their use in numerous commercial applications, including pipes [
2,
3], packaging [
4,
5] automotive parts [
6], electrical appliances [
7] and many others. Moreover, blends of semicrystalline polymers are also used to develop materials with balanced or improved mechanical, thermal or barrier properties [
8,
9,
10]. Considering the wide range of applications of semicrystalline polymers, it is also essential to know their properties under various conditions, including different temperatures or strain rates.
It is well known that semicrystalline polymers typically crystallize during solidification, resulting in a structure consisting of stacked lamellar crystals and amorphous layers. The amorphous regions are characterized by local heterogeneity as they contain fragments of macromolecules forming entanglements, tie-molecules, chains ends and other non-crystallizable units (chain branches) or substances (oligomers, stabilizers) [
11]. Due to their structure, plastic deformation of semicrystalline polymer is a complicated process based on the cooperative and simultaneous responses of crystalline and amorphous components. Recently, we have shown that the elastic modulus of the amorphous phase of semicrystalline polymers (above the glass transition temperature) is two orders of magnitude lower than that of lamellar crystals [
12,
13]. Thus, the initial stage of deformation of semicrystalline polymer takes place mainly in the interlamellar regions due to the significantly lower value of the critical stress required to activate deformation of the amorphous phase compared to the crystalline phase [
14]. Crystals characterized by greater “rigidity” play a passive part in the deformation of the amorphous component, acting as non-deformable objects. Measurable deformation of the amorphous component appears before the macroscopic yield point is reached and takes place according to three different mechanisms, depending on the orientation of lamellae in relation to the deformation direction. These mechanisms are: separation of lamellae, interlamellar slips and rotation of lamellar crystals stacks [
15,
16,
17].
In the literature, two different mechanisms of plastic deformation of crystalline component have been proposed. Peterson described this phenomenon as the emission of dislocation from the edges of the lamellar crystals and their subsequent movement due to the crystallographic slips. This concept was further explored by Shadrake and Guiu [
18,
19,
20]. Two kinds of crystallographic slips can be distinguished: fine and coarse. Both of them occur in planes containing chains as a result of the generation and progression of dislocations. Coarse slips cause the formation of block structures from continuous lamellae, leading to lamellae fragmentation [
21,
22]. In contrast, fine slips are responsible for changing the angle between the chain and the normal to the plane of the lamellae, leading to lamellae rotation and thinning. The second mechanism of the plastic yielding of semicrystalline polymers is associated with non-crystallographic changes of the initial crystalline skeleton. It has been demonstrated that adiabatic heating results in partial melting and recrystallization, leading to the formation of new crystalline structures [
23,
24,
25].
During the deformation process of semicrystalline polymers in a stretching mode, a phenomenon called cavitation is usually observed. The appearance of cavities leads to whitening of the polymeric material when the size of cavities is comparable to the wavelengths of visible light [
26]. Around the yield point, the plastic deformation of crystals is a process that competes with cavitation phenomenon. Its presence is dependent on the microstructure of a material and the deformation conditions. In general, cavitation occurs when crystals have higher plastic resistance (thicker lamellae), whereas in the case of crystals with lower plastic resistance (thinner lamellae), plastic deformation of the crystalline component is observed without cavitation [
7,
27,
28,
29,
30,
31]. Cavitation is one of the main reasons for a volume increase during the deformation process. However, the overall value for the volume variation is the sum of three components: elastic, plastic and cavitational [
25]. Due to the lack of internal structure, cavities are unable to transfer stress, unlike crazes that also appear in semicrystalline polymers [
21].
The structure of the amorphous phase has a strong influence on cavitation. The intensity of cavitation was found to be higher for polymeric materials with a lower molecular weight or a reduced density of entanglements [
32,
33]. The presence and intensity of cavitation is dependent on the density of stress transmitters in the interlamellar regions, which was proved by Humbert et al. [
34]. Significant changes in the cavitation phenomenon can also be achieved through the modification of interlamellar regions at the free-volume level [
35,
36,
37]. In our recent studies, we removed potential cavitation-nucleation sites using supercritical CO
2 extraction. This process did not alter the crystalline skeleton of the material but, surprisingly, it intensified the cavitation phenomenon. On the other hand, the presence of an appropriate modifier in the amorphous-phase regions can eliminate the cavitation phenomenon. An increase/decrease in the content and size of free-volume pores in the amorphous regions of purified/modified samples was the reason for the observed effects. These studies proved that the mechanism of cavitation has a homogeneous nature, and that it is based on local fluctuations in free volume within amorphous regions.
Experimental conditions (temperature, strain rate) likewise have a strong influence on the micromechanisms activated during the deformation process. The appearance of the cavitation phenomenon depends upon the deformation temperature. First of all, it can only be observed above the glass-transition temperature [
21]. Xiong et al. mapped the initiation of three processes: crystal shear, martensitic transformation and cavitation for polyethylene as a function of the deformation temperature. It was proved that the occurrence of cavitation is delayed when the temperature of deformation is increasing [
38]. For most semicrystalline polymers, stretching at an elevated temperature results in a decrease in tensile stress and an increase in deformability [
39]. Merah et al. investigated the tensile properties of high density polyethylene (HDPE) in the temperature range from −10°C to 70°C [
40]. In presented studies, they demonstrated that the yield stress and elastic modulus decrease linearly with an increase in deformation temperature. Enikolopian et al. studied the plastic deformation of low-density polyethylene (LDPE) of a temperature increase from 20 °C to 105 °C (melting point) [
39]. It was proven that an increase in temperature causes an increase in the inhomogeneity of the microstructure due to the gradual destruction (melting) of less organized and imperfect crystals.
It is also well known that a higher strain rate usually leads to an intensification of the cavitation phenomenon, a higher value of yield stress and earlier sample fracture [
41,
42]. Dijkstra et al. noted that at high strain rates, the shape of the stress-strain curve significantly changes. [
43] A sharp downward slope appears after reaching maximum stress and the stress plateau disappears. This effect corresponds with the studies of Cessna, which concluded that a transition in deformation behavior due to an increase in strain rate is accompanied by a gradual increase in volume strain [
43,
44]. Hobeika et al. also proved that increasing a strain rate increased the volume fraction of sheared crystalline component due to an increase in slipping surface area [
45]. Pawlak et al. concluded that during slower deformation crystals are more able to undergo a plastic deformation process [
42]. Due to the easier deformation of crystals under slow strain rates, the cavitation phenomenon may not occur or may be unstable (healing process).
The Small Angle X-ray Scattering (SAXS) technique is commonly used to investigate deformation-induced changes in the microstructure of semicrystalline polymers [
46]. However, the very high electron-density contrast between cavities and the polymer matrix enables the observation of microstructure evolution within cavitating material during tensile drawing [
47]. Additionally, the typical setup configuration for SAXS measurements only allows for the observation of objects with sizes ranging from several nanometers to several dozens of nanometers [
48]. Humbert et al. studied cavitation evolution during the deformation of polyethylene using in situ SAXS measurements [
34]. The smallest dimension of cavities recorded in this research was around 40 nm (at nominal strain around 35%), which was significantly higher than value of long period (22 nm). They concluded that the very first stage of the nucleation process evolves quickly from 0 to 40 nm and cannot be recorded by SAXS. In our previous work [
49] dedicated to the analysis of the plastic deformation of HDPE, the minimum radius of gyration of the cavities, as determined by SAXS measurements, was 16.9 nm (under nominal strain around 35%).
Positron Annihilation Lifetime Spectroscopy (PALS) is one of the most valuable techniques for investigating the size and distribution of free-volume pores. It is used to study the microstructure of metals, ceramics and polymeric systems [
50]. In this technique, a positron generated by a radioactive source is implanted into a solid sample and subsequently annihilated with a random electron. This process is called bulk/free annihilation, and it occurs very fast because the average positron lifetime is around 100–500 ps. During the material investigation using the PALS technique, some of the positrons injected into the solid can form a state called positronium (Ps). Ps can exist in two spin states: para-positonium (p-Ps) and ortho-positonium (o-Ps), in a ratio of 1:3. In a vacuum, the lifetime for p-Ps is 0.125 ns, while it is 142 ns for o-Ps. However, when o-Ps is formed inside solid matter it becomes sensitive to the size of free-volume pores within the investigated material, and its lifetime typically decreases to 1–10 ns [
51].
Using PALS measurement, one can determine the size of empty spaces within the range of 0.25–16 nm. However, due to the long exposure time of the sample during a single PALS measurement, an in situ analysis of the tensile deformation process was impossible. Therefore, in our previous papers, we described an alternative method for analysis of the deformation process using the PALS technique, which is treated as a pseudo-in situ analysis [
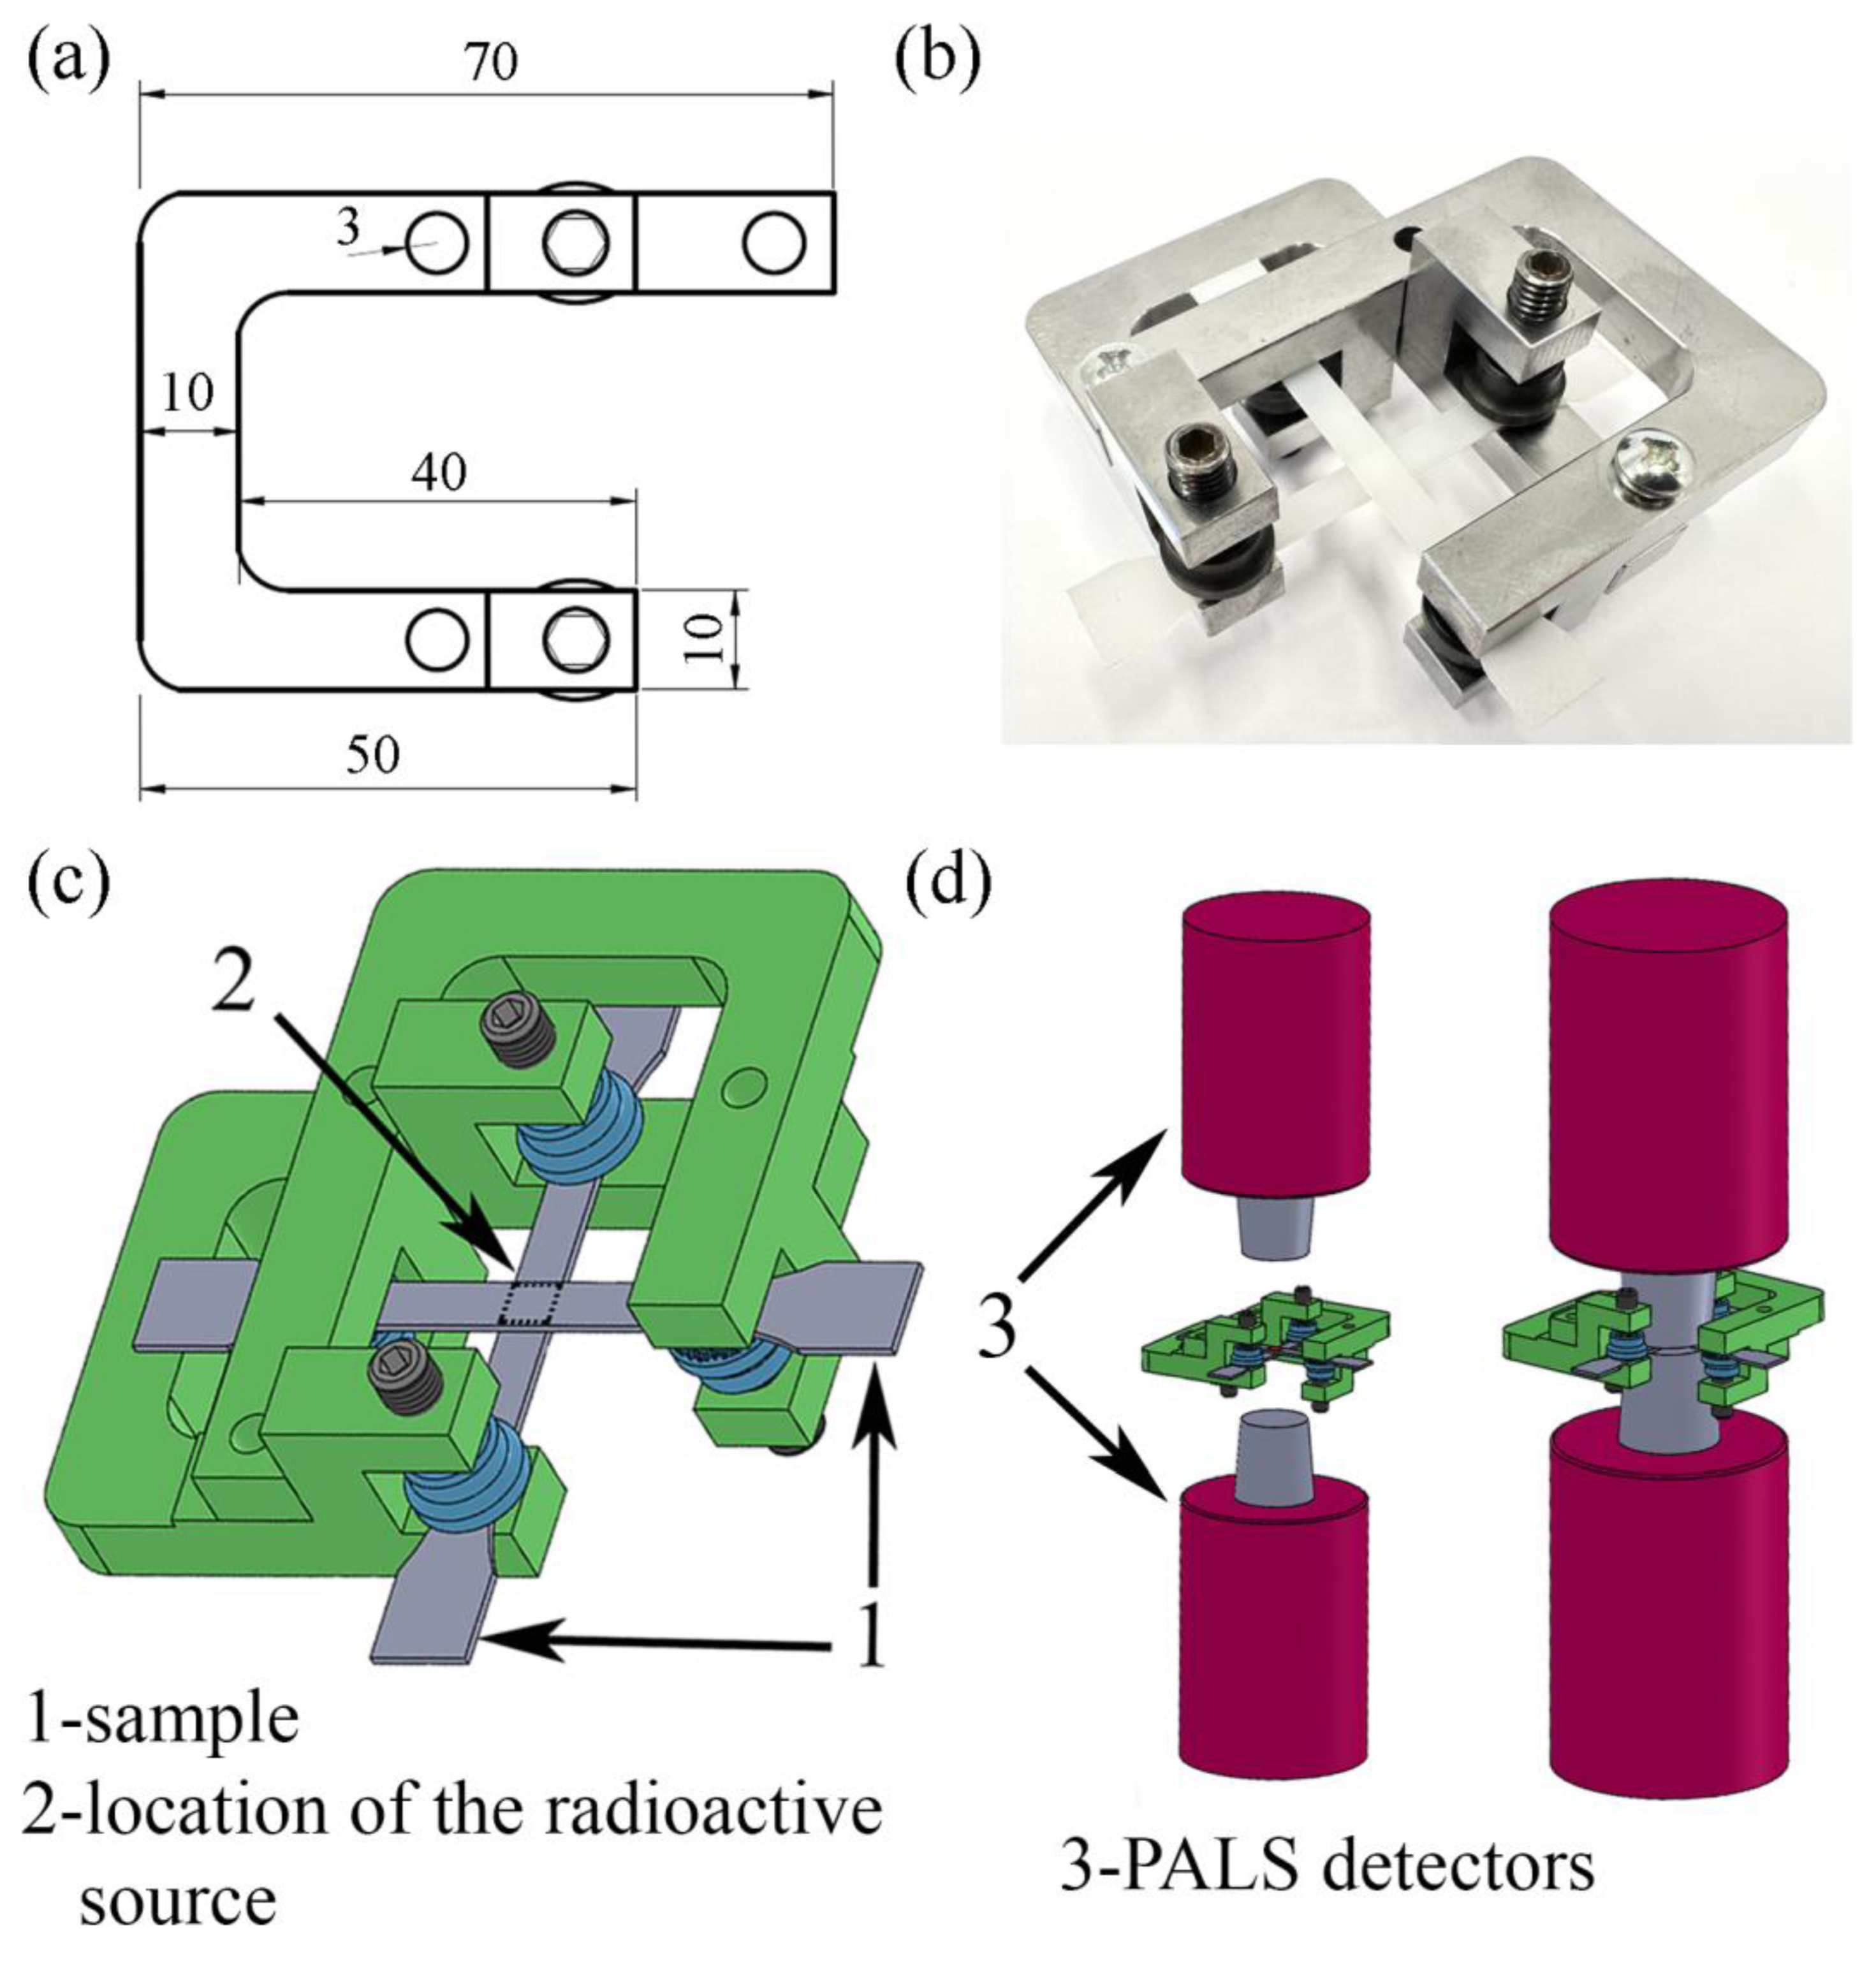
49,
52]. In this method, two samples deformed to the same value of local strain (LS) were securely fixed in special frames to prevent relaxation processes (
Figure 1). The radioactive source was placed between these samples and the whole set was assembled between PALS detectors. For each experiment, new samples were stretched to the selected strain values and fixed in the frames for the collection of PALS data. Thus, this method allows for the investigation of changes in the size and distribution of free-volume pores across a desired range of strains, similar to in situ tests [
49,
52]. Recently, a new spectrometer with a high count rate was described as an alternative setup for in situ PALS measurements [
53].
Most of the studies on the deformation of semicrystalline polymers are focused at or significantly above the yield-point strain values. Due to this fact, there is still a lack of knowledge about the initial stages of deformation-induced changes in microstructure of semicrystalline polymers. Therefore, in this study, the evolution of size and the distribution of free-volume pores within amorphous regions up to the yield point was investigated over a wide range of strain rates and temperatures during the uniaxial deformation of two semicrystalline polymers—HDPE and LDPE. The influences of drawing conditions on the micromechanisms of deformation activated in both polymers were analyzed mainly using the PALS technique.
3. Results and Discussion
During the research, two different polymers were analyzed. HDPE and LDPE are both polymers synthesized from the same monomer, ethylene, but they exhibit different properties due to variations in the degree of branching. In
Table 1, the structural parameters of the materials used in the studies are presented. The degree of crystallinity was calculated using the specific heat of fusion value for perfectly crystalline polyethylene, which is 293 J/g [
64]. The different architectures of the macromolecules in LDPE and HDPE resulted in materials with significantly different degrees of crystallinity, amounting to 39% and 68%, respectively. Using the crystalline volume fraction (X
c (vol)) and the value of the long period (LP), the thickness of lamellar crystals and amorphous layers were also determined (
Table 1). The thickness of crystals amounted to 4.2 nm and 13.4 nm for LDPE and HDPE, respectively. Meanwhile, the thickness of the amorphous layers was practically constant and was about 8 nm regardless of the type of polyethylene.
According to their different morphologies, HDPE and LDPE are characterized by different mechanical properties. In
Figure 2, the mechanical curves of both materials are presented. HDPE displayed a typical shear-yielding deformation with a microneck formation process. The macroscopic yield point was observed at a strain value of 20%, which corresponds to a LS within the range of 0.12 to 0.15. Additionally, in our previous work the mechanical curve was matched with SAXS patterns registered for different local strains [
49]. Cavitation was observed in SAXS patterns by the appearance of a characteristic scattering signal within an LS range of 0.12–0.15 [
49]. PALS analysis, conducted in the LS range 0–0.25, revealed that the mean ortho-positronium lifetime (τ
3), corresponding to the average size of the free-volume pores in the amorphous regions, decreased in comparison with the undeformed material, even after the initiation of cavitation pores. This phenomenon was induced by the highly anisotropic, ellipsoidal shape of cavities, with the aspect ratio amounting to approximately 45. As a result, only the shortest axis of the pores was detectable using the PALS technique. It was also proven that the cavitation phenomenon was responsible for the increase in the dispersion of the ortho-positronium lifetime (σ
3). Additionally, no changes in the mean positron lifetime (τ
2) and a decrease in its dispersion (σ
2) were observed. These effects were caused by mutually compensating changes of interplanar spacing within the crystalline component and by the relative displacement (slips) of crystalline blocks within individual lamellae, respectively. All details regarding this research (experimental data, discussion, conclusions) are included in a previous report [
49].
The deformation of LDPE occurs in a slightly different way than the deformation of HDPE; it occurs homogenously within gauge length, without a microneck-formation process (
Figure 2). A macroscopic yield point was observed at a strain value of 30%, which corresponds to a LS of 0.15. It is well known that LDPE, under standard deformation conditions (3.3 × 10
−3 s
−1 at 20 °C), does not cavitate [
66]. This effect results from the low plastic resistance of highly defective and thin LDPE crystals [
67]. To confirm this, SAXS patterns were collected for selected LS values (
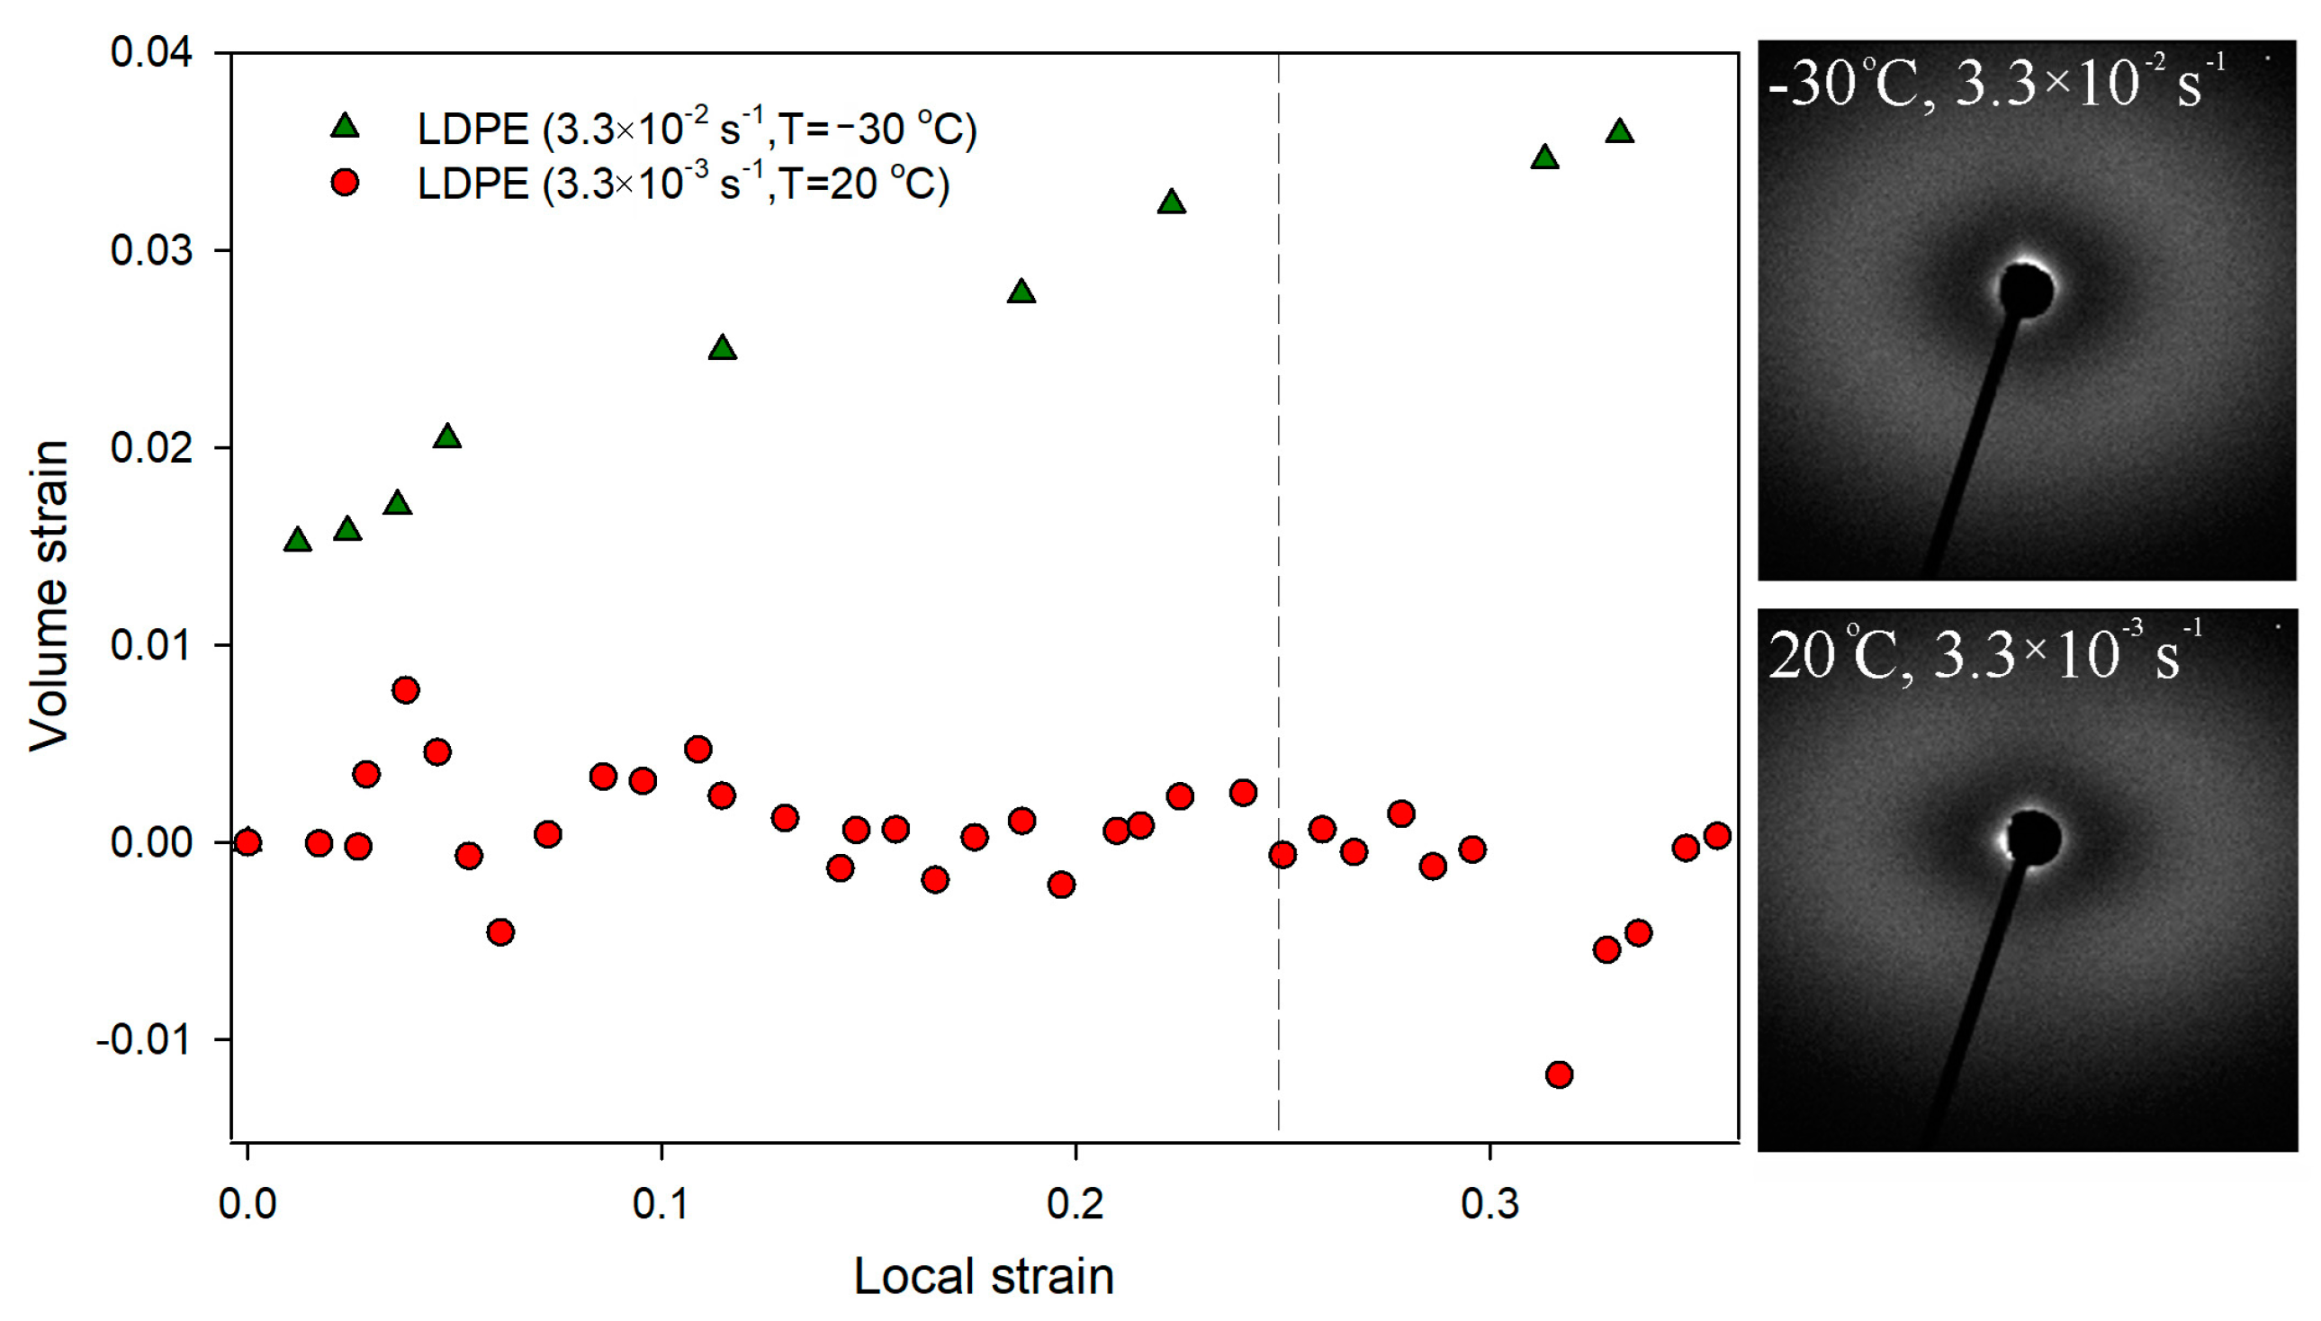
Figure 2). No characteristic scattering signals were observed close to the beam stop, clearly confirming that within the range of LS values 0–0.25 the analyzed LDPE did not cavitate. The lack of cavitation process during uniaxial stretching of LDPE was also clearly visualized with the use of volume strain measurements.
Figure 3 shows no changes in the volume strain, which proves that the deformation proceeds in a non-cavitating manner.
It is also worth mentioning that the deformation of low-density polyethylene has never been previously analyzed using the PALS technique. Therefore, prior to analysis of the influence of strain rate and temperature on the deformation behavior of LDPE, PALS analysis was performed on this material that was deformed under standard deformation conditions (strain rate of 3.3 × 10
−3 s
−1/temperature of 20 °C) within the range of LS values 0–0.25. In
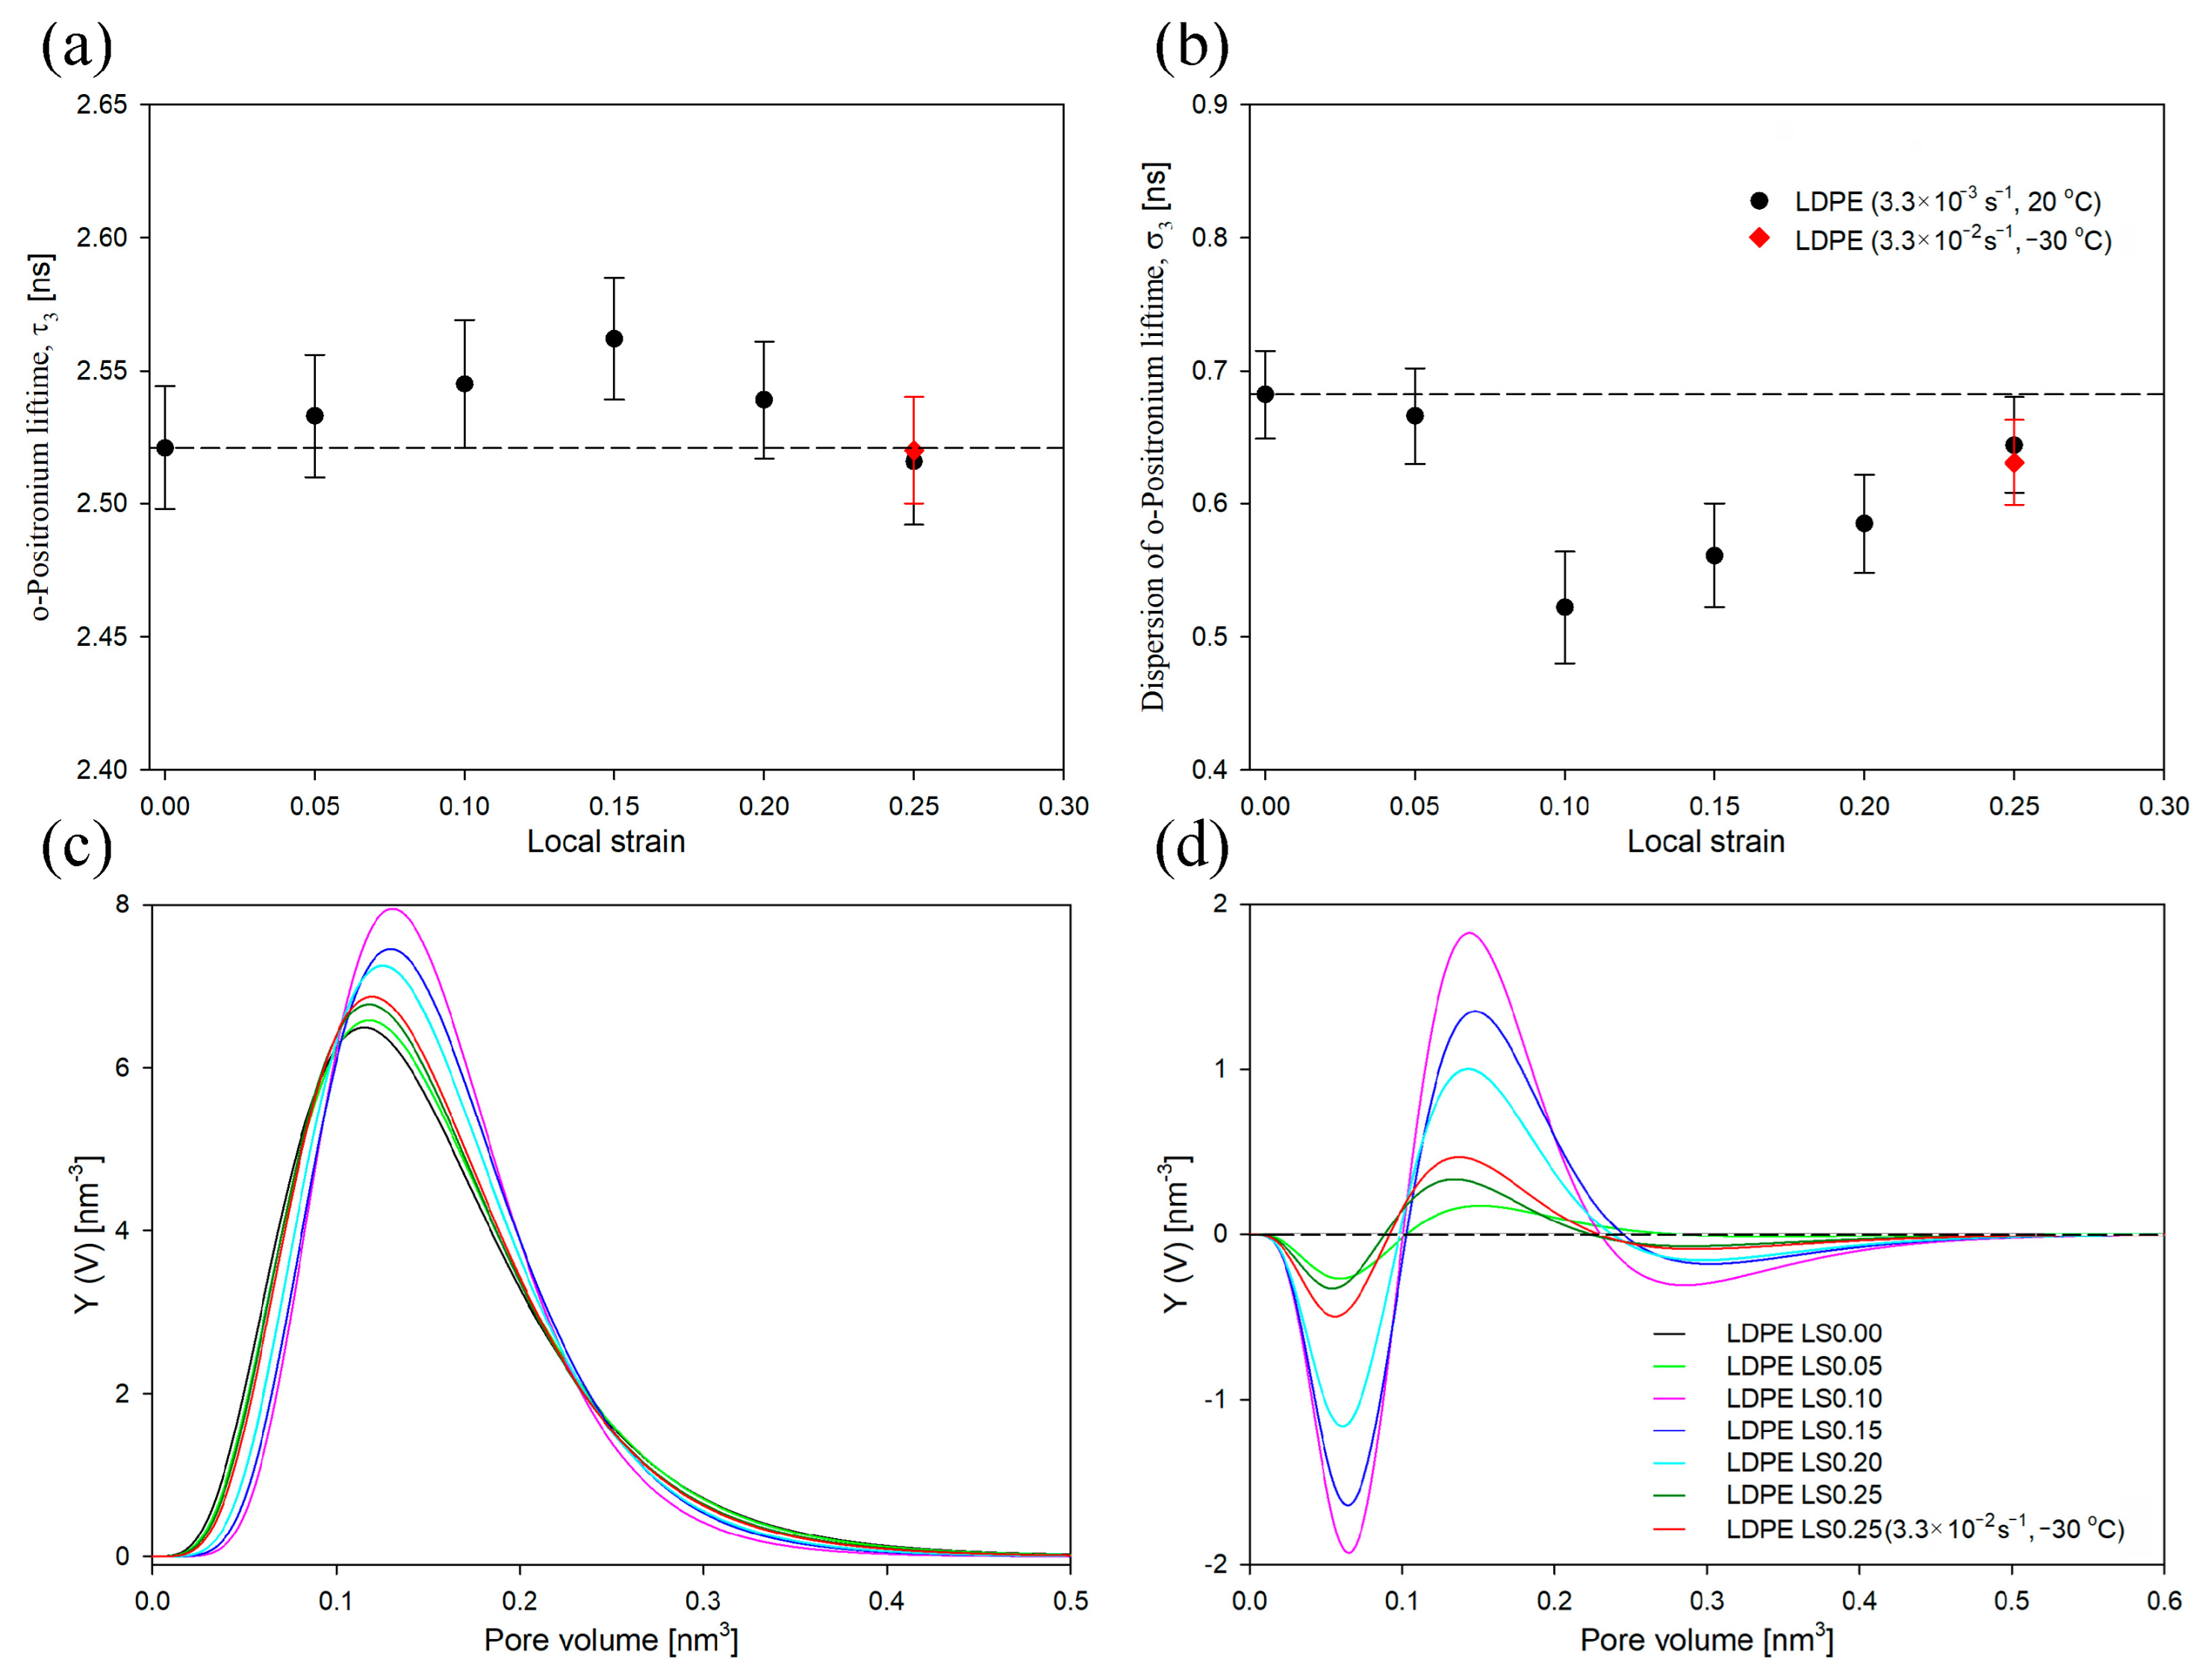
Figure 4, the mean ortho-positronium lifetime (τ
3) and its dispersion (σ
3) as a function of LS values are presented. Additionally, for a better visualization of PALS data, the size distributions of free-volume pores for deformed samples, both as collected and after subtracting the distribution for undeformed LDPE, are shown (
Figure 4c,d)
As depicted in
Figure 4, both the mean ortho-positronium lifetime (τ
3, 2.521 ns) and the dispersion of the ortho-positronium lifetime (σ
3, 0.682 ns) for undeformed low-density polyethylene were noticeably higher compared to the high density polyethylene analyzed in our previous study: 2.384 ns and 0.499 ns, respectively [
49]. This meant that both the average size of the free-volume pores of the amorphous phase and their size distribution were clearly larger in LDPE. This effect was probably induced by a lower molecular-packing density within the amorphous regions, resulting from the higher density of branching in low-density polyethylene. During stretching, the value of τ
3 initially increased gradually up to the yield point (LS = 0.15), then it decreased slightly for a LS of 0.25 but remained close to the value observed in the undeformed sample. Thus, within the studied range of strains, the average size of the free-volume pores in the amorphous phase was generally higher than that in the undeformed sample. Analogous conclusions can be drawn from the evolution of size-distribution profiles, which generally shift towards higher values (
Figure 4c).
On the other hand, as mentioned above, in the case of the previously analyzed HDPE, the mean ortho-positronium lifetime (τ
3) was decreased compared to undeformed HDPE [
49]. This difference can be correlated with the different mechanical response of the amorphous regions of these polyethylenes. It is well known that, in the case of lamellar crystals oriented parallel to the deformation direction, the amorphous component located between them undergoes compression, resulting in a decrease in the mean size of free-volume pores (decrease in τ
3). Meanwhile, the amorphous component located between the lamellae oriented perpendicular to the deformation direction undergoes stretching as a result of the lamellae-separation process, which is manifested by an increase in the mean size of free-volume pores (increase in τ
3). In the case of HDPE at a LS of 0.15, the change in thickness of amorphous regions between lamellae oriented parallel and perpendicular to the deformation directions was −4.8% and 17.5%, respectively [
49]. In the case of LDPE at a LS of 0.15, the change in thickness of the amorphous regions between lamellae oriented parallel and perpendicular to the deformation directions, estimated based on the initial thickness of the amorphous regions (
Table 1) and observed changes in LP (
Figure S9), was −10.1% and 31.8%, respectively The relative increase in the content of interlamellar spaces during the deformation of LDPE was therefore clearly higher than in HDPE. This would explain the observed differences in the values of τ
3 in a function of LS between LDPE and HDPE. It is worth mentioning that the observed differences in the deformability of amorphous regions of LDPE and HDPE can be attributed to the differences in the stiffness of this component. Recently, we demonstrated that the elastic modulus of the amorphous regions of LDPE is significantly lower than that in HDPE: ≈4 MPa and ≈40 MPa, respectively [
12,
13].
The dispersion of ortho-positronium lifetime (σ
3,
Figure 4b) reached a minimum at a local strain of 0.1, then gradually increased for higher LS values. This effect was mainly caused by a significant reduction in the content of free volume pores of the smallest and, to some extent, the largest sizes (
Figure 4c,d). It is worth mentioning that a significant increase in the value of σ
3 for HDPE (compared to the undeformed sample) was an indicator of the cavitation phenomenon [
49]. In the case of LDPE at a LS of 0.25, this parameter remained below the value characteristic for the undeformed sample, which is consistent with the above conclusions that this polymer does not cavitate.
3.1. Strain Rate
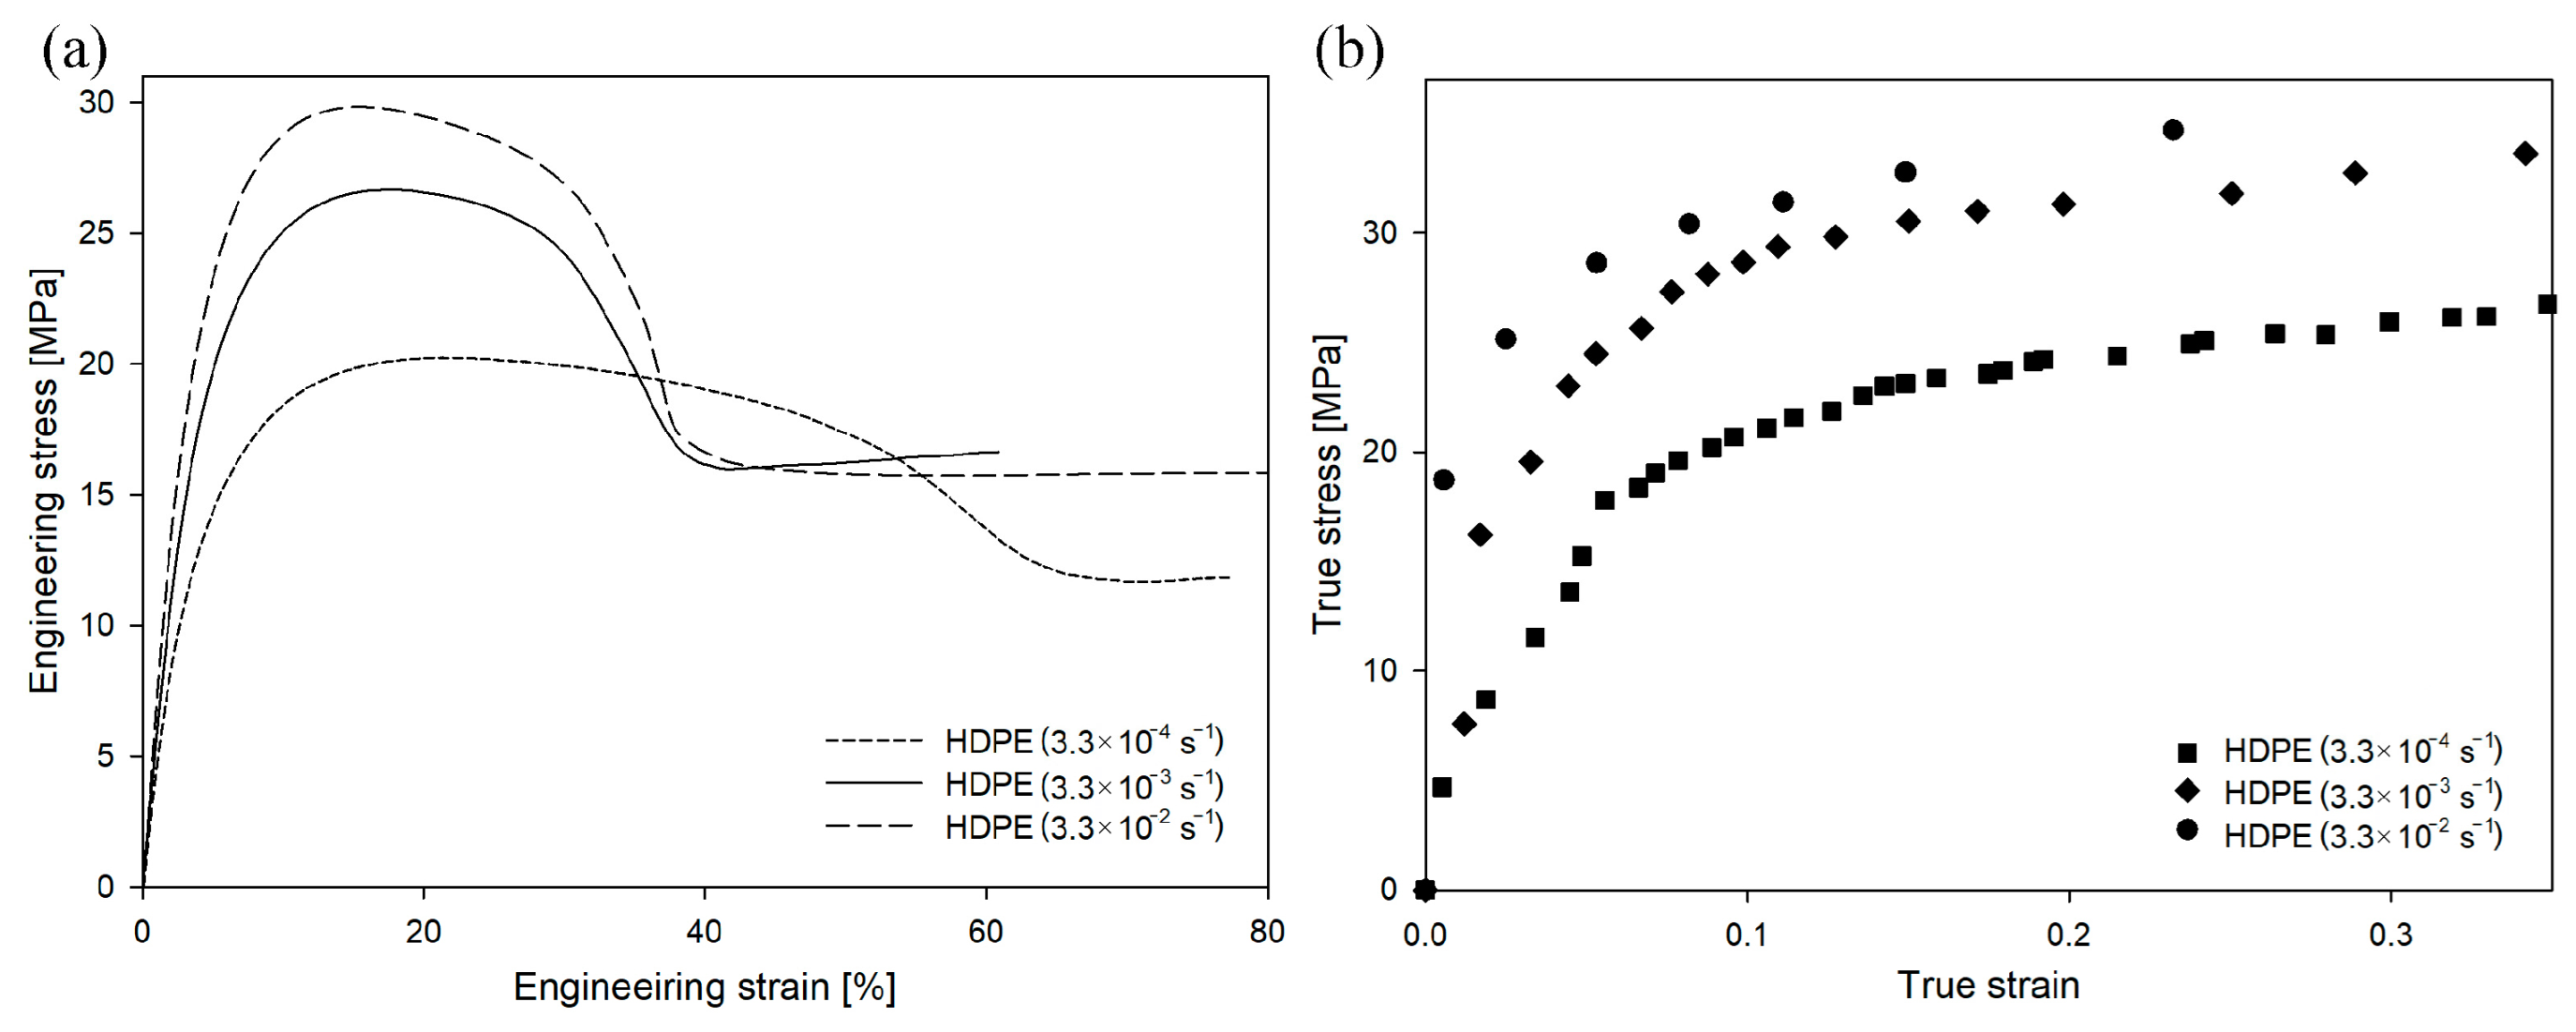
When the same polymer is stretched under different conditions, the engineering/true strain–engineering/true stress curves change shape. In the case of HDPE deformed at different strain rates (
Figure 5), the value of engineering or true stress increased with an increasing deformation rate. This trend was visible in the early stages of the deformation process, but the difference in stress values became particularly significant near the yield point. The yield stress for the drawing rate of 3.3 × 10
−4 s
−1 was 22.5 MPa (yield-stress values in this study were determined from the true stress–true strain curves), for the drawing rate of 3.3 × 10
−3 s
−1 was 29.2 MPa, and for the drawing rate of 3.3 × 10
−2 s
−1 was 30.5 MPa. A similar influence of strain rate on yield stress has been observed by others [
68].
It is well known that the strain rate influences the intensity of the cavitation phenomenon [
43,
69,
70]. As shown in
Figure 6, HDPE drawn with a strain rate of 3.3 × 10
−2 s
−1 showed the highest increase in volume strain values since the very beginning of the deformation process. At a LS of 0.25, the volume strain was approximately five times higher than that of the sample deformed with a strain rate of 3.3 × 10
−3 s
−1. A measurable difference between samples deformed at strain rates of 3.3 × 10
−3 s
−1 and 3.3 × 10
−4 s
−1 appeared around the LS value of 0.13. This LS value was estimated in our previous work as the deformation stage at which the cavitation phenomenon was initiated (for a strain rate of 3.3 × 10
−3 s
−1) [
49]. In the case of HDPE stretched at the lowest strain rate (3.3 × 10
−4 s
−1), no increase in volume strain was observed, which clearly indicates a complete inhibition of cavitation. SAXS patterns collected for samples deformed to a LS of 0.25 confirmed the influence of strain rate on the intensity of the cavitation process described above (
Figure 6).
In
Figure 7a,b, the mean ortho-positronium lifetime (τ
3) and its dispersion (σ
3) for undeformed HDPE and samples deformed to the LS of 0.25 with different strain rates were presented, respectively. Additionally, for a better visualization of PALS data, the size distributions of free-volume pores for deformed samples, both as collected and after subtracting the distribution for undeformed HDPE, are presented (
Figure 7c,d).
As shown in
Figure 7a, τ
3 decreased gradually as the strain rate increased. This meant that the average size of the free-volume pores of the amorphous phase also decreased. Considering the observed increase in cavitation intensity with a higher strain rate (
Figure 6), this effect was rather surprising. One would expect the opposite trend. However, this phenomenon can be explained by considering the initial highly anisotropic/ellipsoidal shape of the cavities. As mentioned above and detailed in our previous studies [
49,
52], only the shortest axis of the cavities is detectable using the PALS technique. It should be considered that the initial thickness of the amorphous layers in all analyzed systems was identical. It is also known that the thickness of the amorphous layer naturally limits the size of the cavitation pores along the short axis. Therefore, with an increase in the strain rate/cavitation intensity, the number or aspect ratio of cavitation pores can primarily increase, whereas the short pore axis will not change significantly. Consequently, only a slight increase in the content of large-sized cavities (range of pore volume of 0.2–0.4 nm
3,
Figure 7c,d) with an increase in the strain rate/cavitation intensity was observed. At the same time, with the increase in strain rate, a clear increase in the content of pores with the smallest sizes was observed (range of pore volume of 0–0.1 nm
3,
Figure 7c,d). This process most likely takes place between the lamellar crystals whose deformation is accompanied by compression of the amorphous layers. This, in turn, ultimately led to a decrease in the τ
3 value, as depicted in
Figure 7a. With an increase in the strain rate/cavitation intensity, the dispersion of the mean ortho-positronium lifetime also increased (
Figure 7b). The highest increase in σ
3 value was observed for sample deformed with the highest strain rate/cavitation intensity.
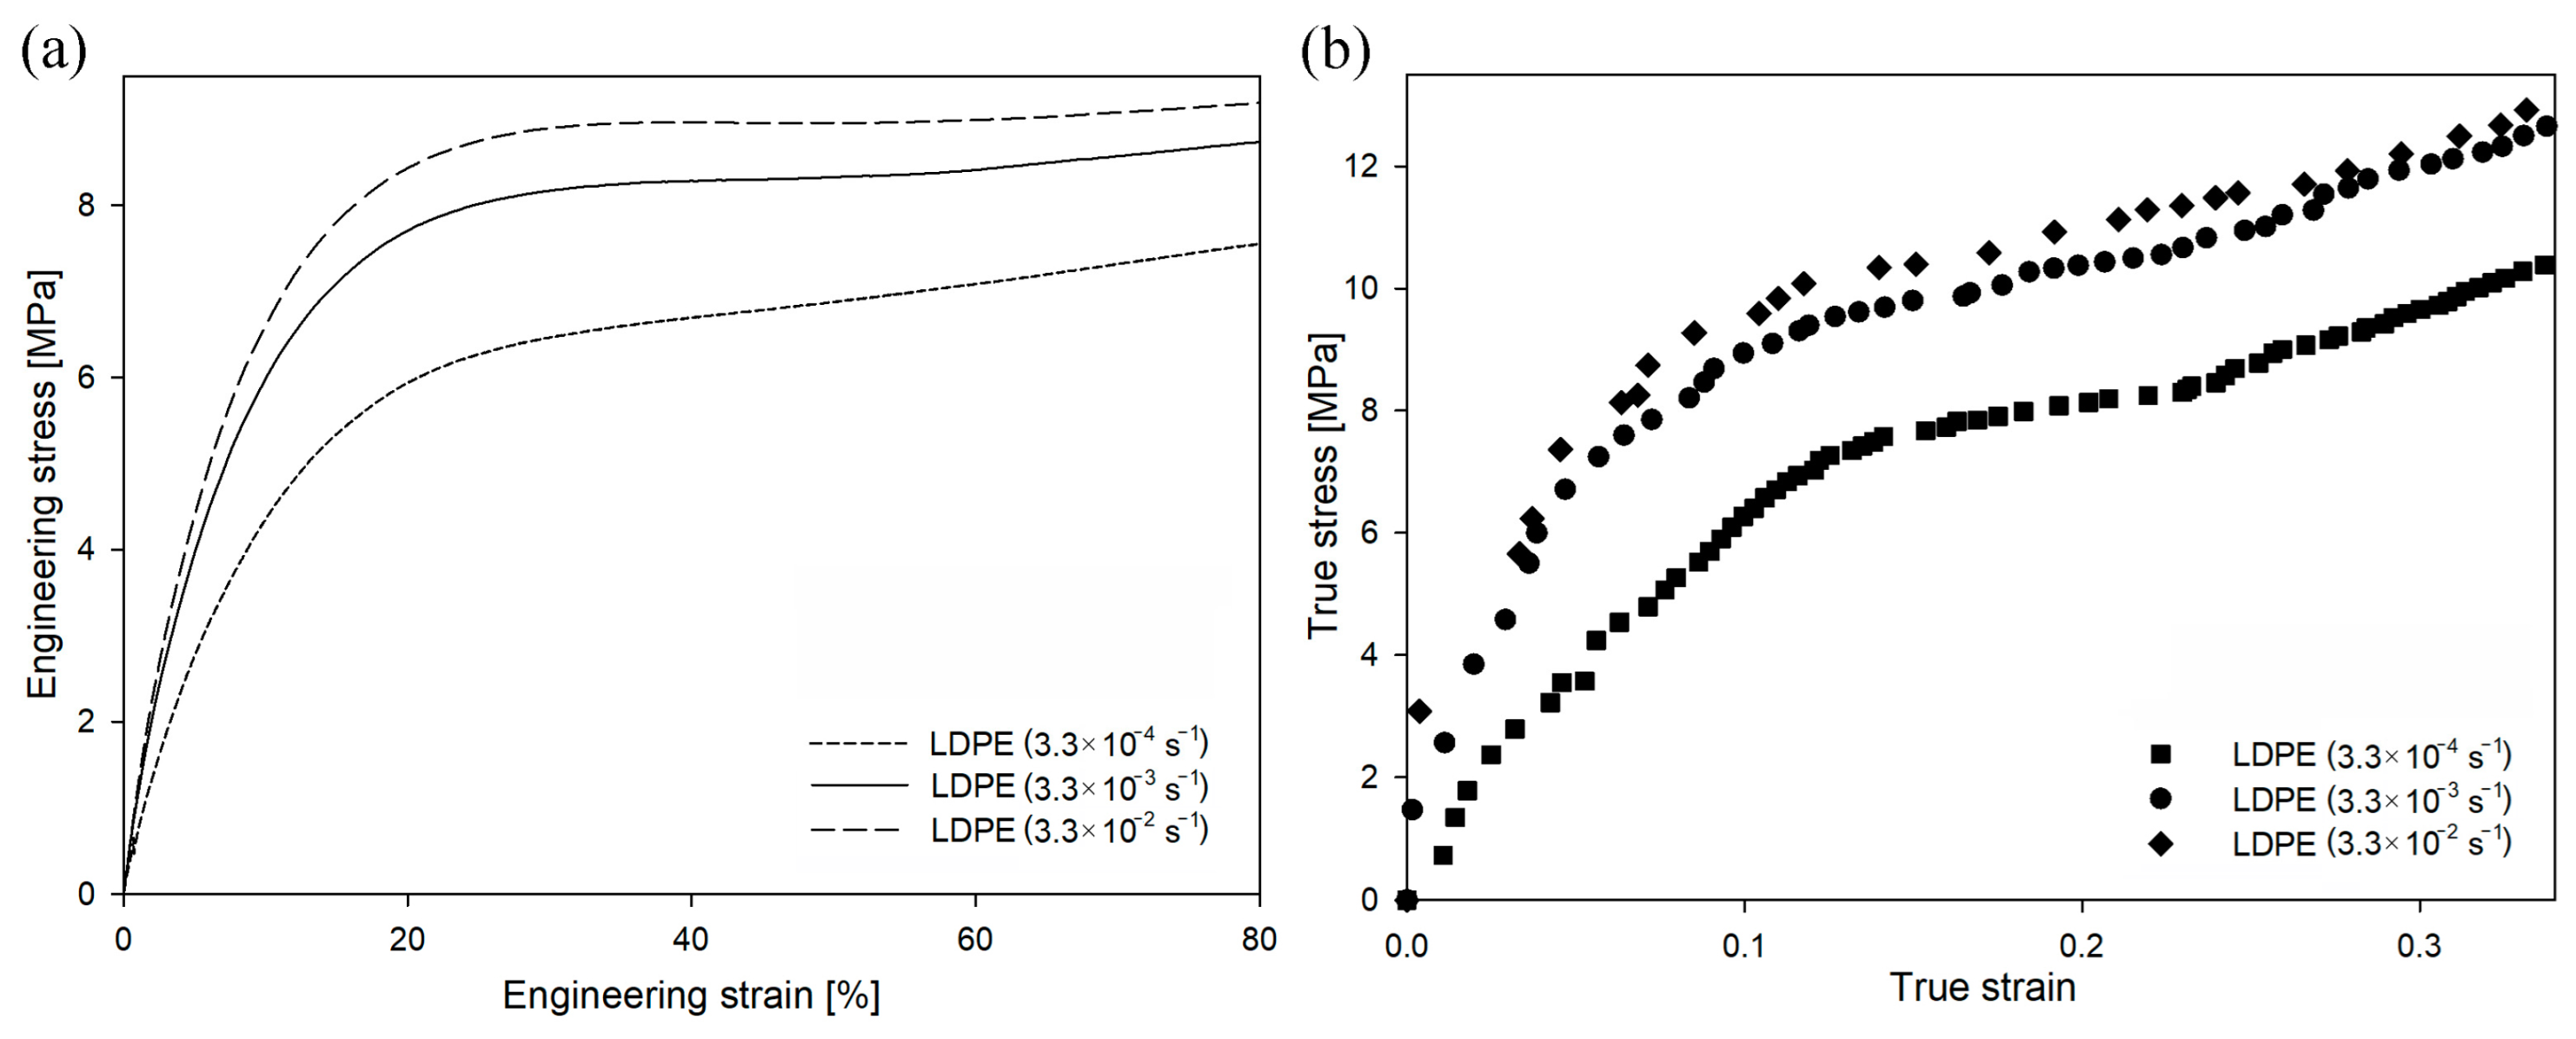
In the case of LDPE deformed at different strain rates (as shown in
Figure 8), the value of engineering stress also increased with an increasing deformation rate. However, the changes in yield stress were lower than those in HDPE. The yield stress for the drawing rate of 3.3 × 10
−4 s
−1 was 7.6 MPa, for the drawing rate of 3.3 × 10
−3 s
−1 was 9.4 MPa, and for the drawing rate of 3.3 × 10
−2 s
−1 was 10.1 MPa.
In the case of HDPE, the stress at the yield point had to exceed 22–29 MPa before the cavitation process could be initiated (
Figure 5 and
Figure 6). Assuming that the susceptibility of the amorphous phase of LDPE and HDPE to a loss of consistency and to the formation of cavities during deformation is similar, in order to observe cavitation during deformation of LDPE, an analogous stress at the yield point should be obtained. Meanwhile, for LDPE, even when the highest strain rate was used, the yield-stress value was relatively low. Therefore, it was expected that no cavitation pores would develop during the deformation of LDPE under the given deformation conditions. Instead, plastic deformation of the crystals would be initiated before the stress exceeded the critical mechanical resistance of amorphous regions. The volume strain measurements presented in
Figure S10 confirmed this hypothesis. Within the analyzed range of strain rates, an increase in volume strain as a function of LS was not observed, so the LDPE samples deformed without cavitation. PALS analysis (not presented here) did not reveal significant differences in the structural responses of LDPE samples (compared to HDPE samples) deformed in the analyzed range of strain rates.
3.2. Temperature
Changes in the temperature of the deformation process had a significant impact on the tensile behavior of the analyzed polymers. In the case of HDPE (
Figure 9), decreasing the temperature to −30 °C resulted in an increase in stress value from the very beginning of the process and the appearance of the yield point at a lower strain value compared to standard strain conditions. Consequently, it was impossible to prepare a homogenously deformed sample with a LS of 0.25, as was the case with the other samples. PALS measurements were therefore performed for samples deformed at −30 °C to a maximum local strain value of 0.17. On the contrary, increasing the deformation temperature to 70 °C resulted in a decrease in stress values across the range of studied strains and practically suppressed the micronecking process typically observed in the curves of HDPE deformed at temperatures of −30 °C and 20 °C (
Figure 9). The yield stress for the temperature of −30 °C was 49.0 MPa, for the temperature of 20 °C was 29.2 MPa, and for the temperature of 70 °C was 11.5 MPa. Similar influences of temperature on yield stress have been observed by others [
23,
71,
72].
It has been shown in the literature that temperature influences the intensity of the cavitation phenomenon [
38,
72]. The analysis of the volume strain of HDPE, the results of which are presented in
Figure 10, clearly shows that the volume strain depends on the temperature. The greatest increase in the value of volume strains was observed in HDPE drawn at the lowest temperature tested, i.e., −30 °C. At a LS of 0.17, the increase in volume of this sample was 5%. At this stage of deformation, at higher temperatures no change in volume strain was observed. At a LS of 0.25, the volume strain was approximately three times higher than that of the sample deformed at 20 °C. Meanwhile, in the HDPE sample stretched at the highest temperature (70 °C), no increase in volume strain was observed across the range of studied strains, indicating complete suppression of cavitation. SAXS patterns collected for samples deformed to local strains of 0.17 and 0.25 confirmed the influence of temperature on the formation of the cavities discussed above (
Figure 10).
In
Figure 11a,b, the mean ortho-positronium lifetime (τ
3) and its dispersion (σ
3) for undeformed HDPE and samples deformed at different temperatures were presented. The PALS results for selected local-strain values are presented (0.17 and 0.25). The size distributions of free-volume pores for deformed samples, both as collected and after subtracting the distribution for undeformed HDPE, are also shown (
Figure 11c,d).
The sample deformed at 70 °C exhibited the lowest changes in τ
3 and σ
3 values compared to the undeformed material (
Figure 11a,b). It can therefore be assumed that the changes in the nanostructure of the amorphous phase at the free-volume level, including the mean size of free-volume pores and their size distribution, were the smallest. The greatest changes in the structure of the material after lowering the deformation temperature were observed in the size distribution of free-volume pores. This effect was mainly caused by a significant increase in the content of free volumes pores, particularly those of the smallest sizes and, to some extent, the largest sizes (
Figure 11c,d). Similar effect was observed in HDPE after increasing the strain rate (
Figure 7c,d). An insignificant increase in the content of large-sized cavities (in the range of pore volume of 0.2–0.4 nm
3, as shown in
Figure 11c,d) in the samples deformed at a lower temperature (which exhibited a higher intensity of cavitation,
Figure 11) was explained earlier and is attributed to the initial highly anisotropic/ellipsoidal shape of cavities. The annihilation of the o-Ps along the longer axis of the cavities was highly unlikely, and this component was not present in the PAL spectrum. At the same time, the shorter axis of the cavities was naturally limited by the thickness of the amorphous layers; hence, despite a clear increase in cavitation intensity with a decrease in the deformation temperature, the rise in the content of large-sized cavities detectable by PALS was relatively low.
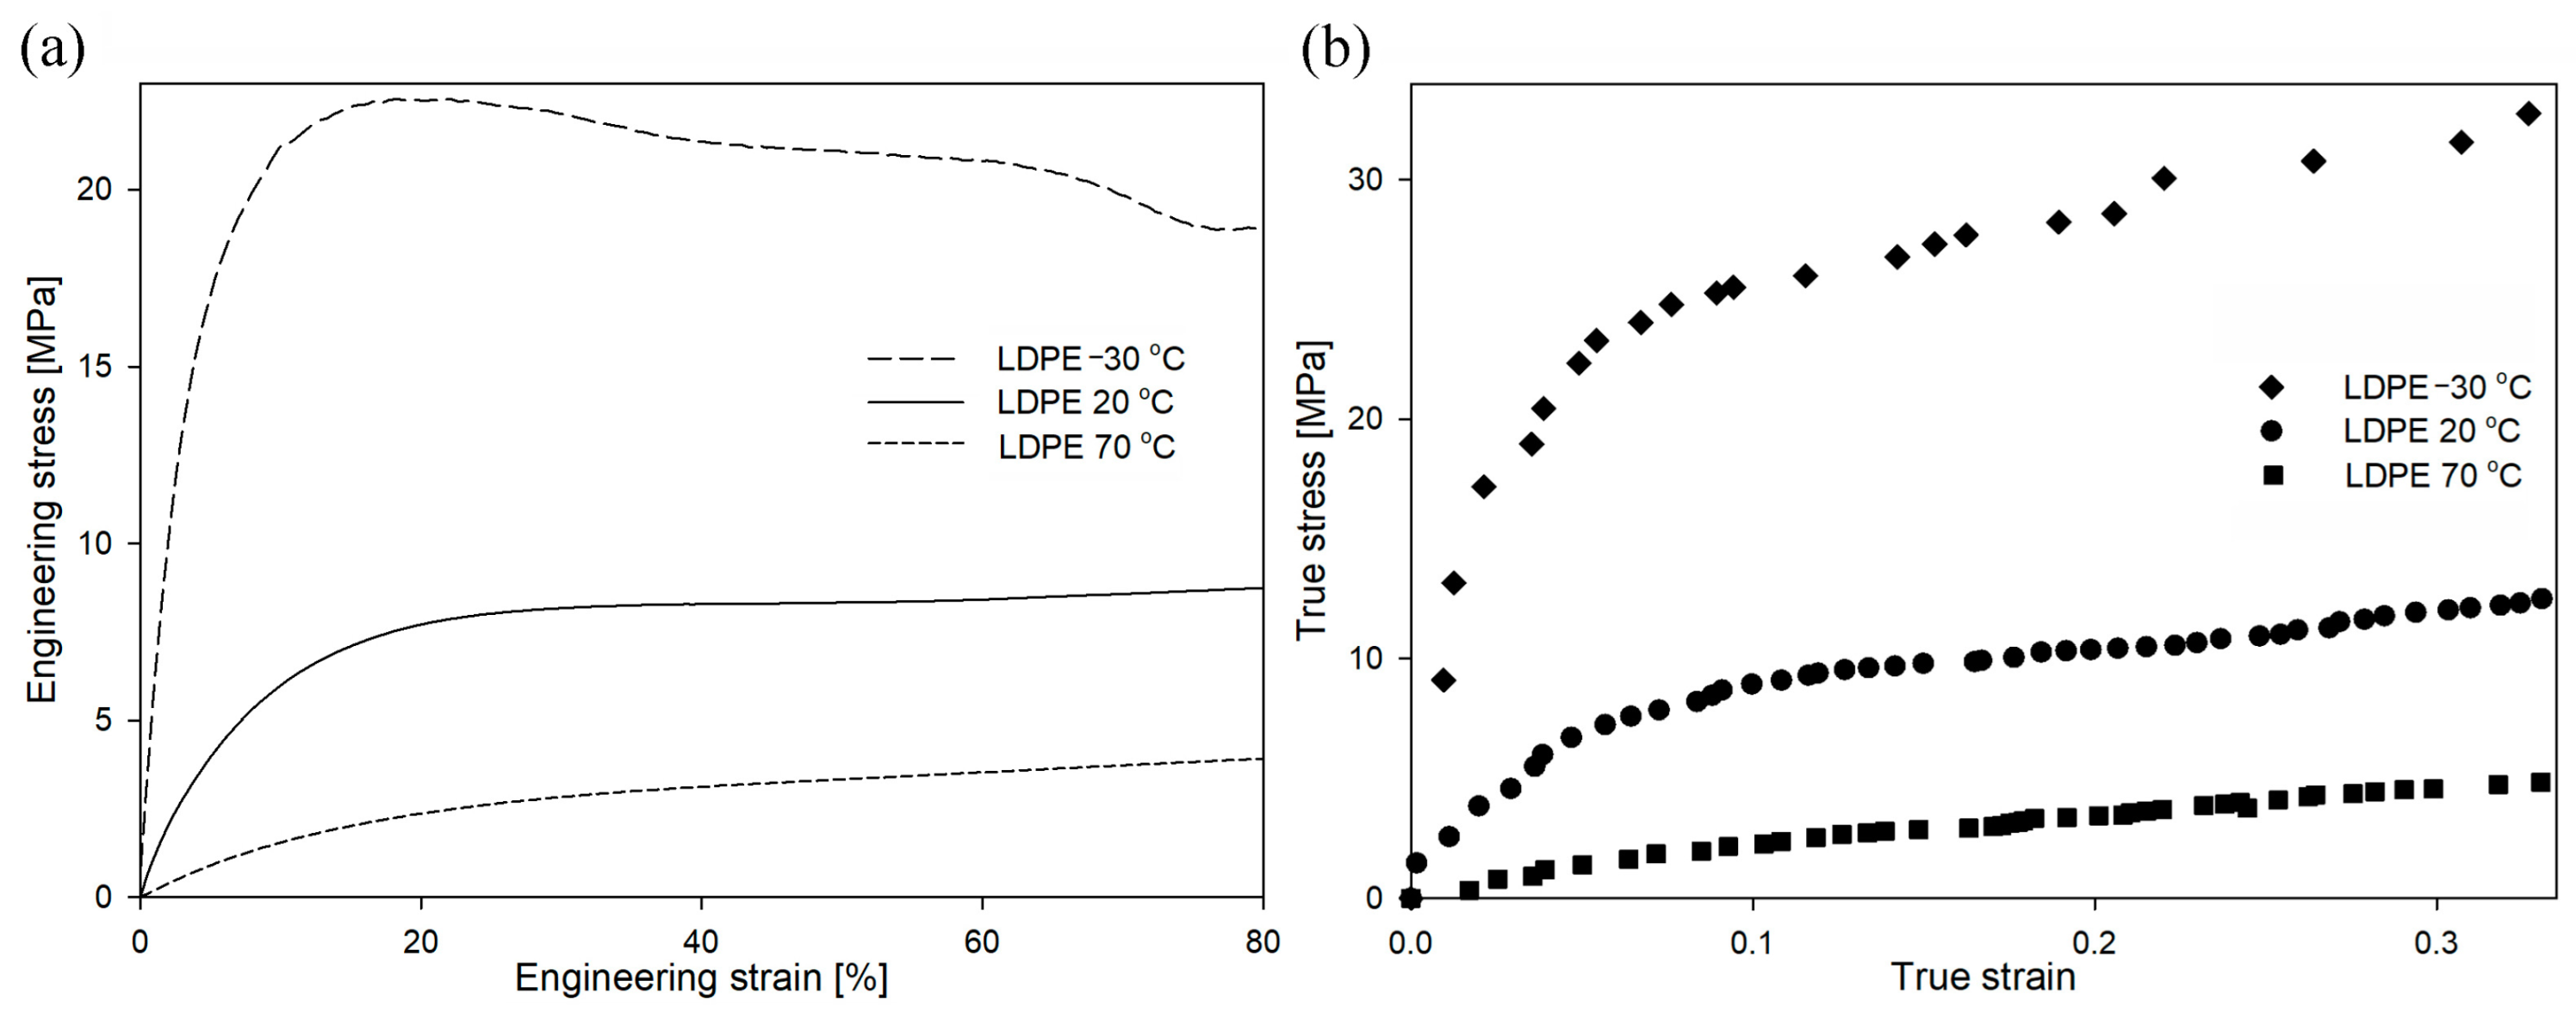
The mechanical curves for LDPE deformed at different temperatures are presented in
Figure 12. The yield stress for the temperature of −30 °C was 25.0 MPa, for the temperature of 20 °C was 9.4 MPa, and for the temperature of 70 °C was 3.3 MPa. In the case of the sample deformed at −30 °C, the engineering curve clearly showed the micronecking phenomenon, previously exclusively observed in HDPE samples. It is also worth mentioning that the yield stress for this deformation condition was only slightly below the yield stress of the cavitating HDPE sample (
Figure 5 or
Figure 9). It could therefore be expected that the deformation of the LDPE sample at −30 °C would be accompanied by the phenomenon of cavitation. However, the volume strain measurements presented in
Figure S11 did not confirm this hypothesis. Across the analyzed range of deformations, there was no increase in volume strain as a function of local strain, regardless of the deformation temperature. Therefore, the LDPE samples deformed within the analyzed range of temperatures/LSs without experiencing cavitation. The measurements with the use of PALS technique (not presented here) did not reveal significant differences in the structural changes of LDPE samples (in comparison to HDPE) deformed in the analyzed range of temperatures [
49].
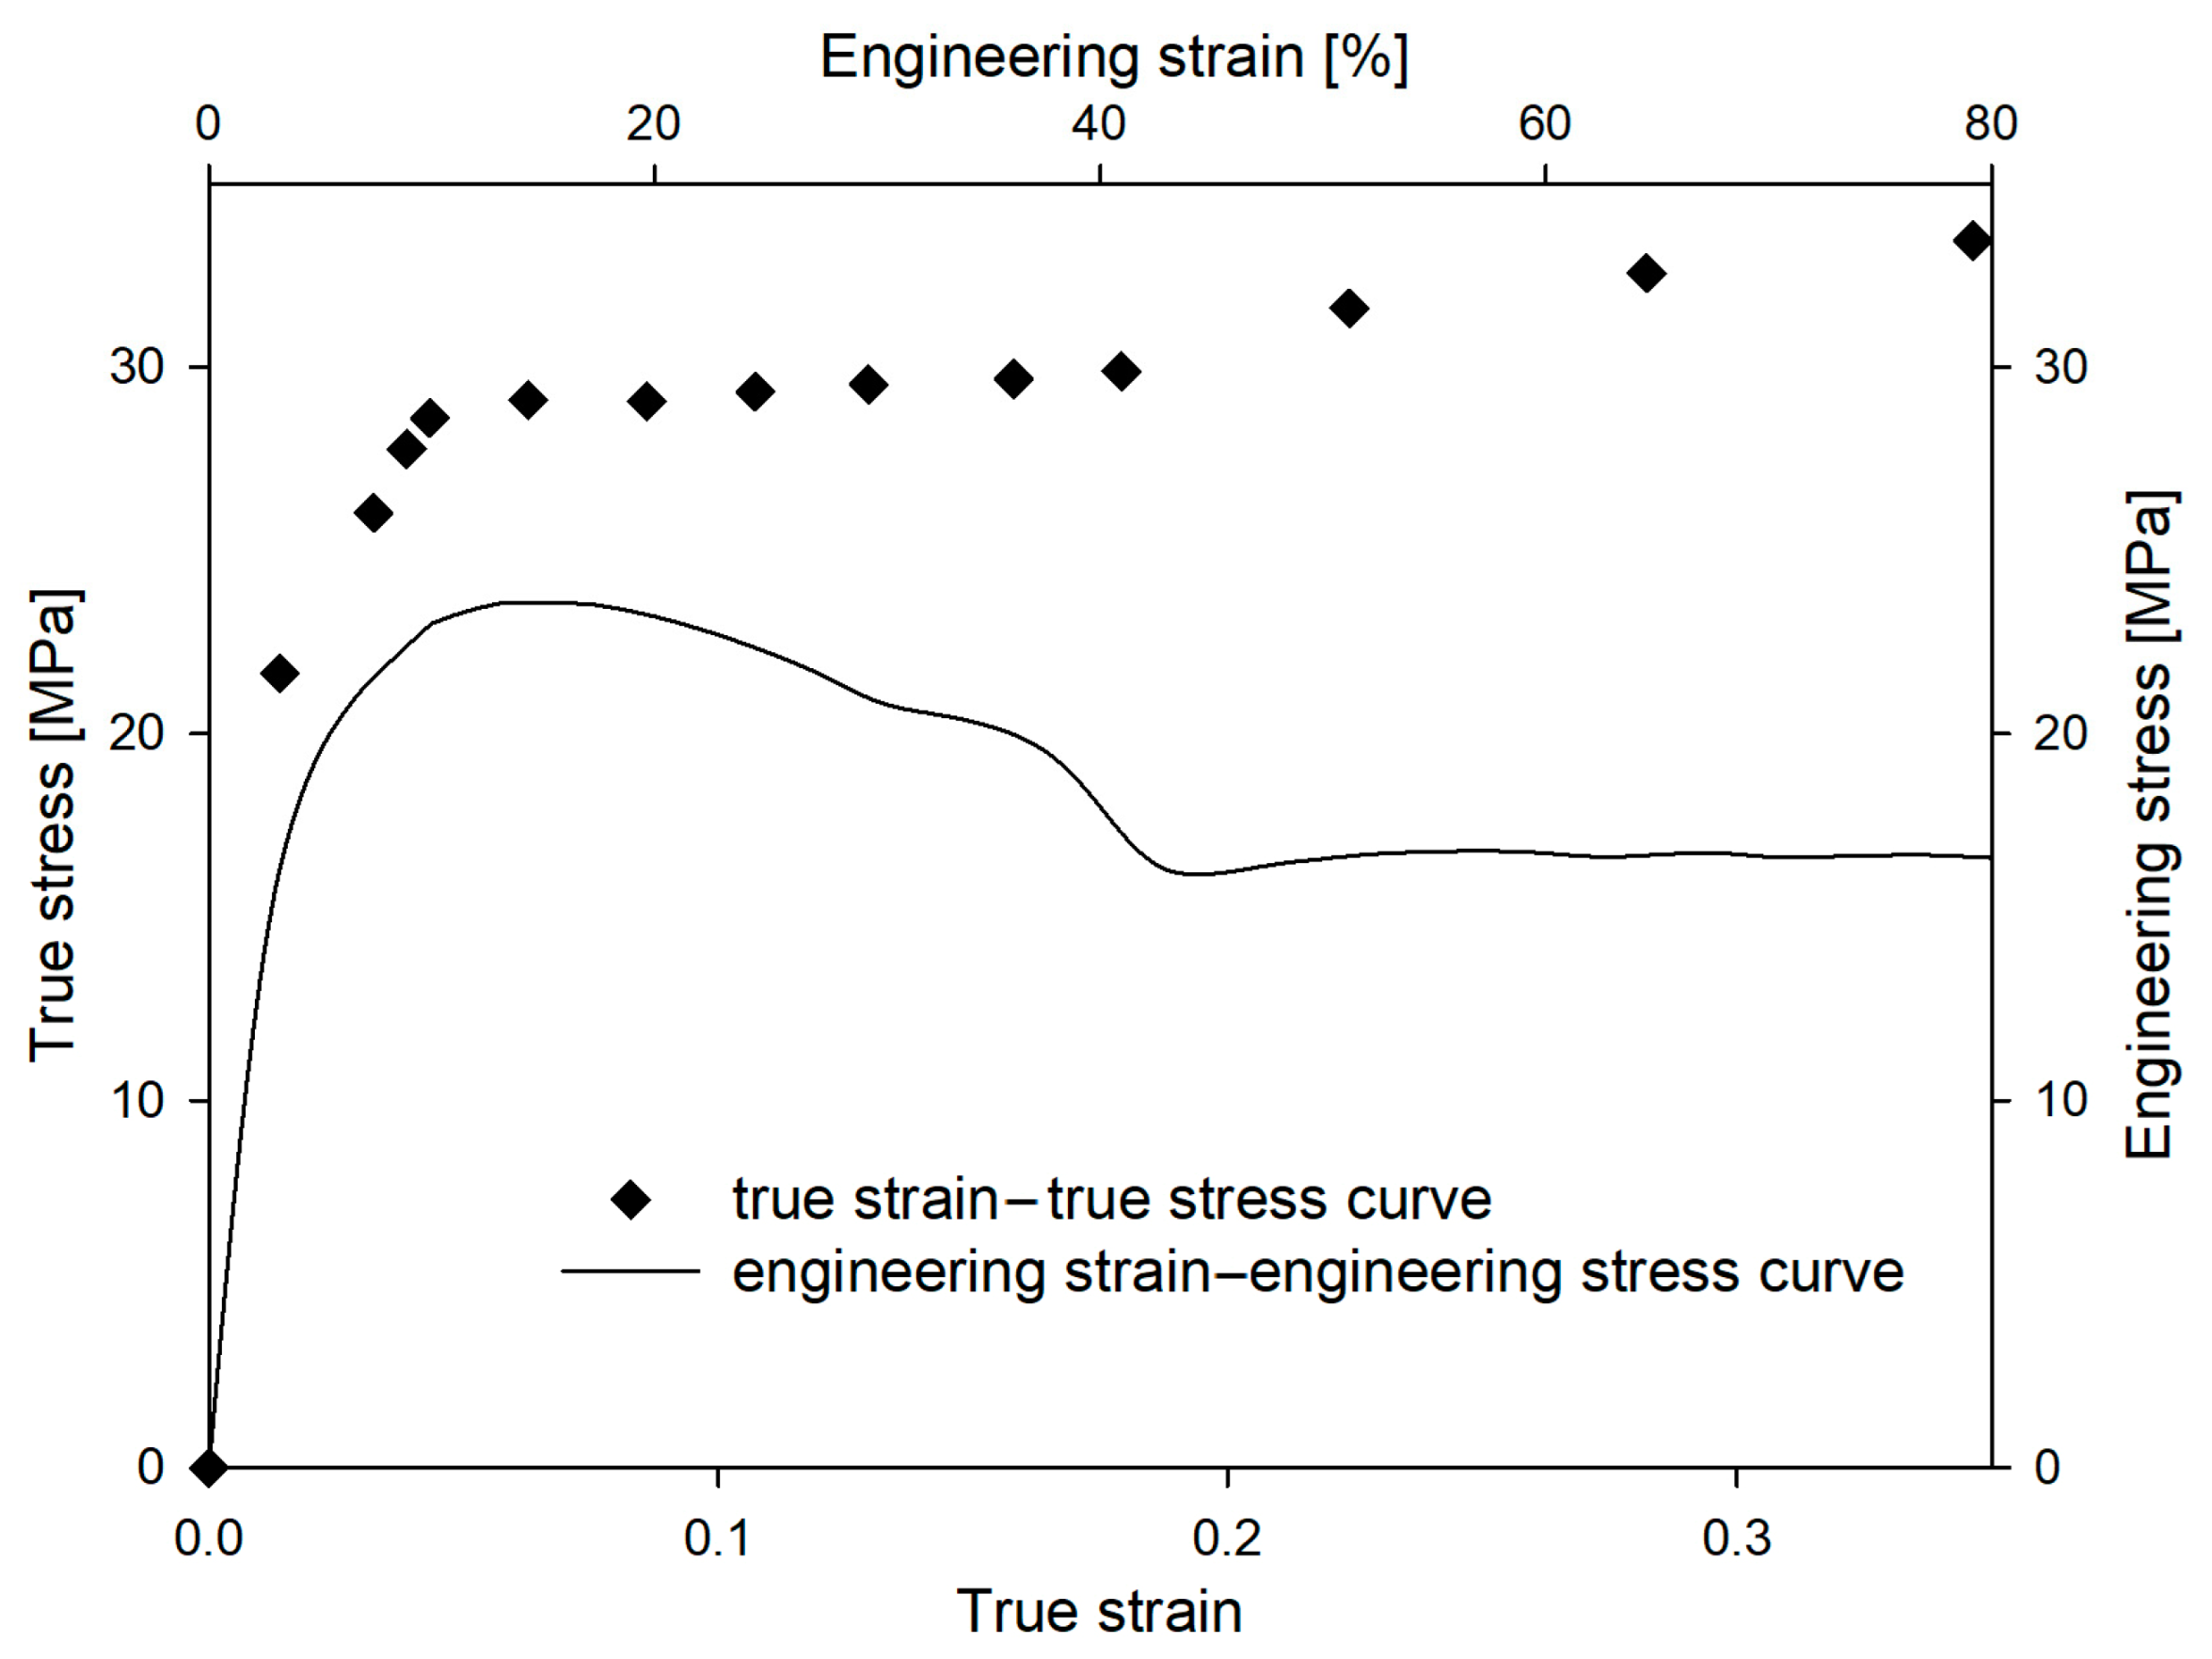
In order to further “intensify” the mechanical response of LDPE, a deformation process was carried out at a temperature of −30 °C, increasing additionally the strain rate to 3.3 × 10
−2 s
−1. The mechanical curves for LDPE deformed at those conditions are presented in
Figure 13. After the increase in strain rate, the process of deformation localization (microneck formation) observed in the engineering strain–engineering stress curve become even more distinguishable. In
Figure 3 volume strain measurements for this LDPE sample are presented. With the increase in LS, a gradual increase in volume strain was observed from the earliest stages of the deformation process. At a LS of 0.25, the increase in sample volume was 3%. Such an effect usually indicates the formation of cavitation pores in the material. However, SAXS measurements did not confirm that cavitation was responsible for the observed increase in sample volume. No characteristic scattering from cavitation pores was observed in the SAXS pattern (
Figure 3). This aspect will require further analysis.
It is worth mentioning that with the increase in the strain rate, the yield stress increased from 25 MPa to 29.1 MPa. Therefore, for the LDPE sample deformed at −30 °C with a strain rate of 3.3 × 10⁻² s−1, the yield stress corresponded to that recorded for the cavitating HDPE deformed at 20 °C with a strain rate of 3.3 × 10⁻³ s−1. Meanwhile, as mentioned above, the LDPE sample did not cavitate. Therefore, the susceptibility of the amorphous phase of LDPE to lose its consistency and the formation of cavities is lower than in the case of amorphous component of HDPE. This can be correlated to the higher content of branches in LDPE, which ensures higher cohesion of the amorphous component.
In
Figure 4a,b, the mean ortho-positronium lifetime (τ
3) and its dispersion (σ
3) for LDPE sample deformed at −30 °C with a strain rate of 3.3 × 10
−2 s
−1 for LS of 0.25 are presented, respectively (marked in red). Additionally, the size distribution of free-volume pores is shown (
Figure 4c,d, red curve). Both τ
3 and σ
3 values were similar to the values recorded for the LDPE sample deformed at 20 °C with a strain rate of 3.3 × 10
−3 s
−1. Also, the size distribution profiles were very similar. Consequently, at a LS of 0.25, the nanostructure of the amorphous component of LDPE, including the mean size of free-volume pores and their size distribution, was similar regardless of the deformation conditions. It can therefore be concluded that the deformation conditions have limited influence on the evolution of structural changes in the amorphous component of LDPE under the range of strains studied.
4. Conclusions
HDPE and LDPE samples, solidified under the same conditions, were characterized by different nanostructure of amorphous regions. Both the mean ortho-positronium lifetime and the dispersion of ortho-positronium lifetime, corresponding to the average size and size distribution of the free-volume pores of the amorphous component, respectively, were noticeably higher in LDPE than in HDPE. This effect was induced by a lower and less uniform molecular packing within the amorphous regions, which resulted from the higher density of branching in low-density polyethylene.
During the deformation of LDPE, an increase in the τ3 value was observed under local strains within 0–0.25 compared to an undeformed sample. This effect was mainly stimulated by a significant increase in the interlamellar distances between lamellae oriented perpendicular to the deformation directions (31.8%), in contrast to a mere decrease (10.1%) in the interlamellar distances between lamellae oriented parallel to the deformation directions. No significant effect of temperature or strain rate on the τ3 value was observed during LDPE deformation.
Within the range of strains studied, the σ3 value of LDPE, and thus the size distribution of the free-volume pores within the amorphous component, generally remained below the value observed for the undeformed sample. This effect was mainly caused by a considerable reduction in the content of the smallest and, to some extent, the largest pores of free volumes. Consequently, the dimensions of free-volume pores became more uniform. No significant effect of temperature and strain rate on the σ3 value was observed during LDPE deformation.
A significant impact of the deformation condition on the evolution of the amorphous-phase nanostructure was observed in the case of HDPE. With an increase in the strain rate or a decrease in temperature, the cavitation phenomenon was intensified in HDPE. Meanwhile, a decrease in mean ortho-positronium lifetime was observed. This effect was mainly caused by a significant increase in the content of the smallest and, to some extent, the largest pores of free volumes. An insignificant increase in the content of large-sized pores (which were indeed cavities) in the samples deformed at a lower temperature or higher strain rate was attributed to the initial shape of the cavities. The annihilation of the o-Ps along the longer axis of the anisotropic/ellipsoidal cavities was highly unlikely. The input of this dimension into the PAL spectrum was therefore limited. At the same time, the increase in the dimension of the shorter axis of the cavities was limited by the thickness of amorphous layers; hence, the increase in the content of large-sized pores/cavities detectable by PALS was relatively low.
With an increase in the strain rate or a decrease in temperature, the dispersion of the mean ortho-positronium lifetime increased during the deformation of HDPE. The highest increase in the σ3 value was observed in the sample deformed at the highest strain rate or at the lowest temperature, and this effect was directly correlated with the initiation or intensification of the cavitation phenomenon.
The yield stress of the LDPE sample deformed at lowered temperature and increased strain rate was consistent with cavitating HDPE, but the LDPE sample did not cavitate. This meant that the susceptibility of the amorphous regions of LDPE to the formation of cavities is lower than that for the amorphous component of HDPE. This, in turn, can be correlated to the higher content of branches in LDPE, which ensures higher cohesion of the amorphous component.
