3.1. Macroscopic Analysis of Crack Resistance Performance
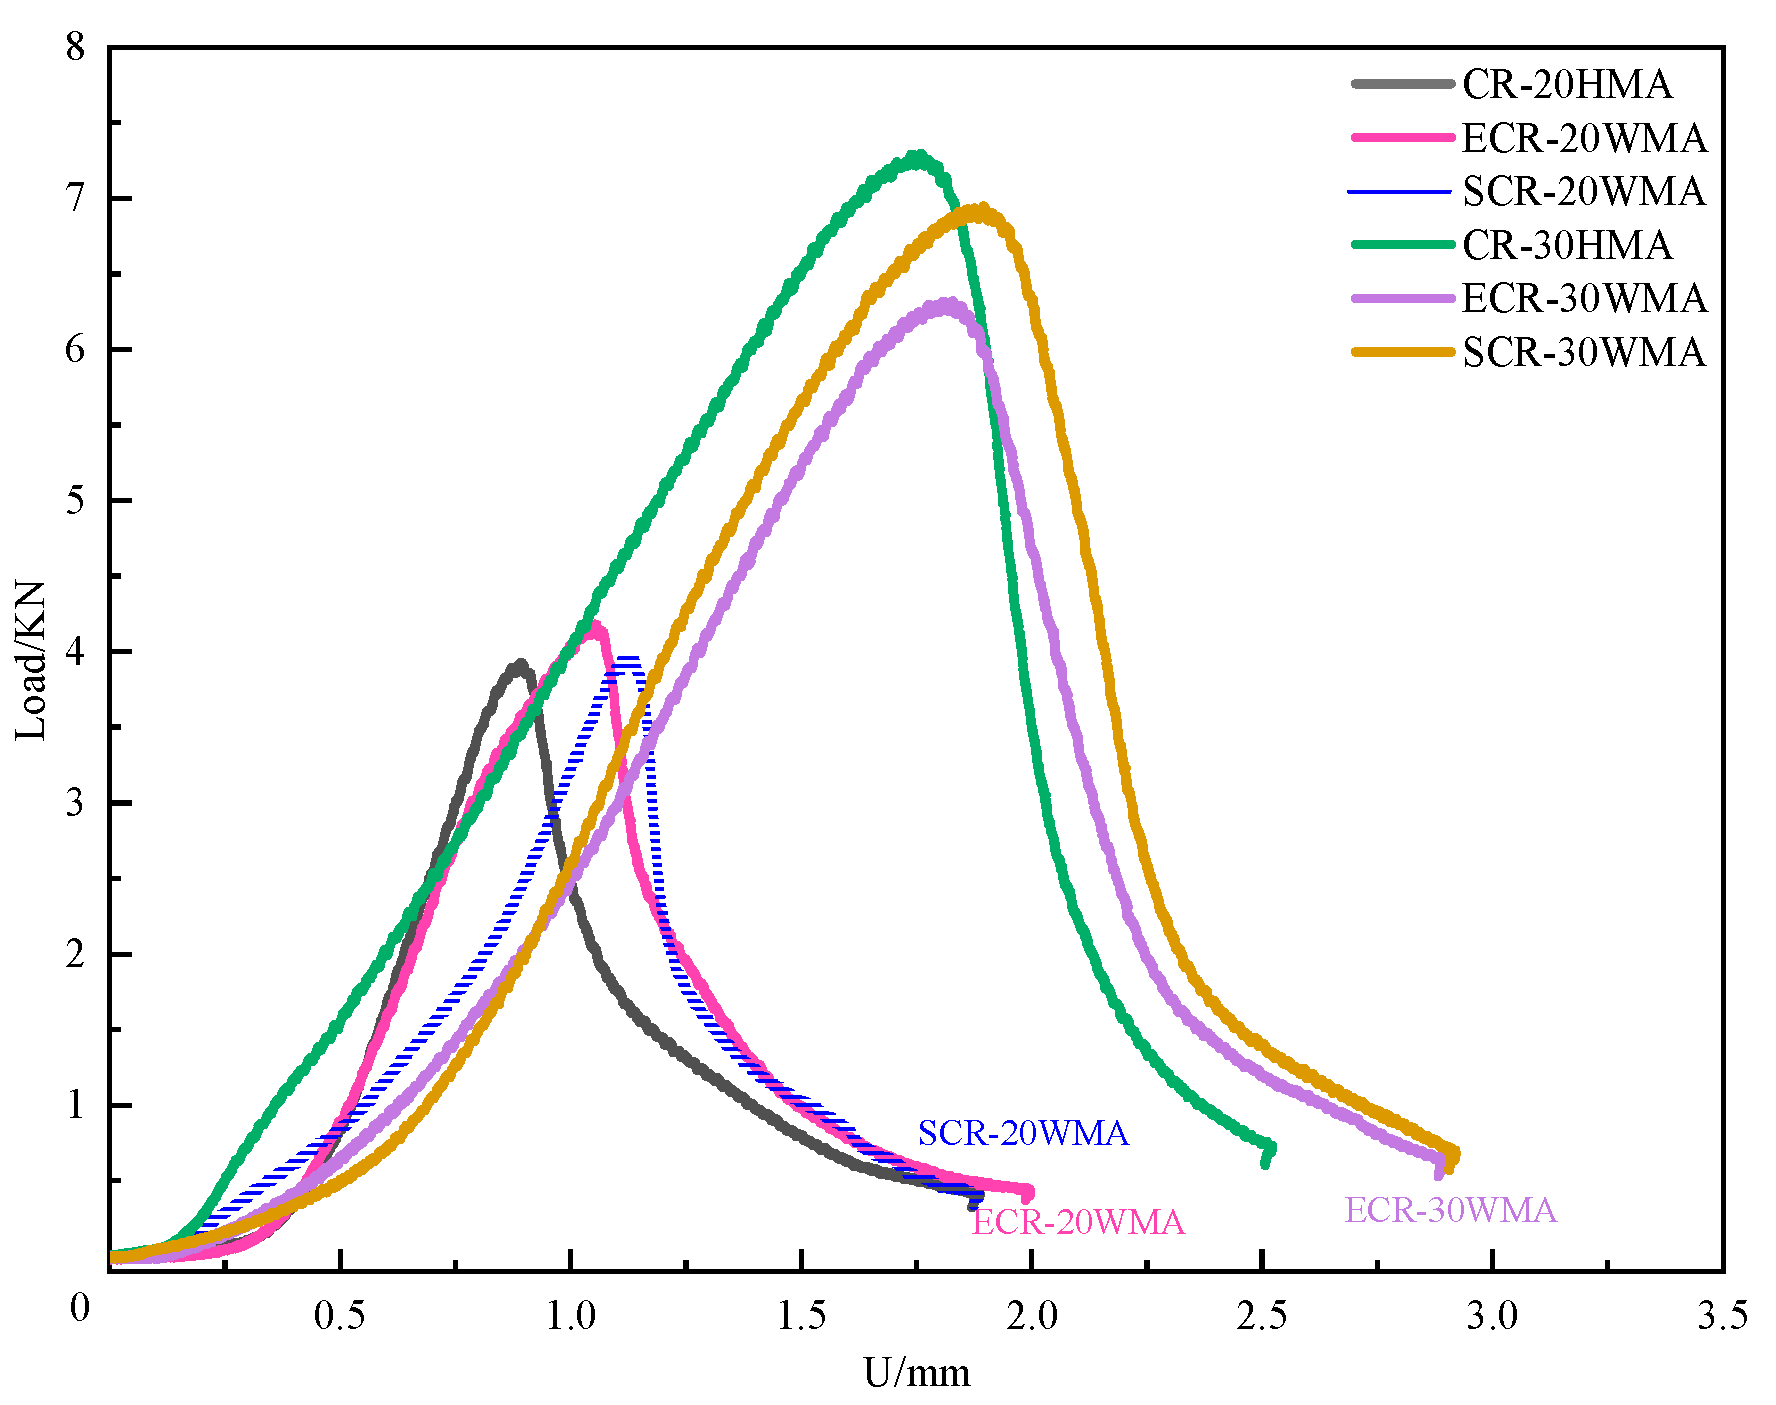
Figure 3 shows the load–displacement curves of six types of rubber-powder-modified asphalt mixtures. In
Figure 3, it can be seen that the load–displacement curves of the rubber-powder-modified asphalt mixtures can be divided into two stages based on the peak load. In the first stage, the displacement increases with the increase in applied stress. As the accumulated stress on the asphalt mixture exceeds its ultimate tensile strength, the load reaches its peak and enters the second stage. In this stage, the specimen cracks, and the fracture resistance of the asphalt mixture rapidly decreases, causing the applied stress to decrease with the increase in displacement. The first stage of SCR-30WMA is characterized by a forward displacement smaller than that of the other five types of rubber-powder-modified asphalt mixtures. The curve slope is also more gentle, and the duration of the entire fracture process is longer. Therefore, the deformation ability and stress relaxation ability of the rubber-powder-modified asphalt mixture improve [
19].
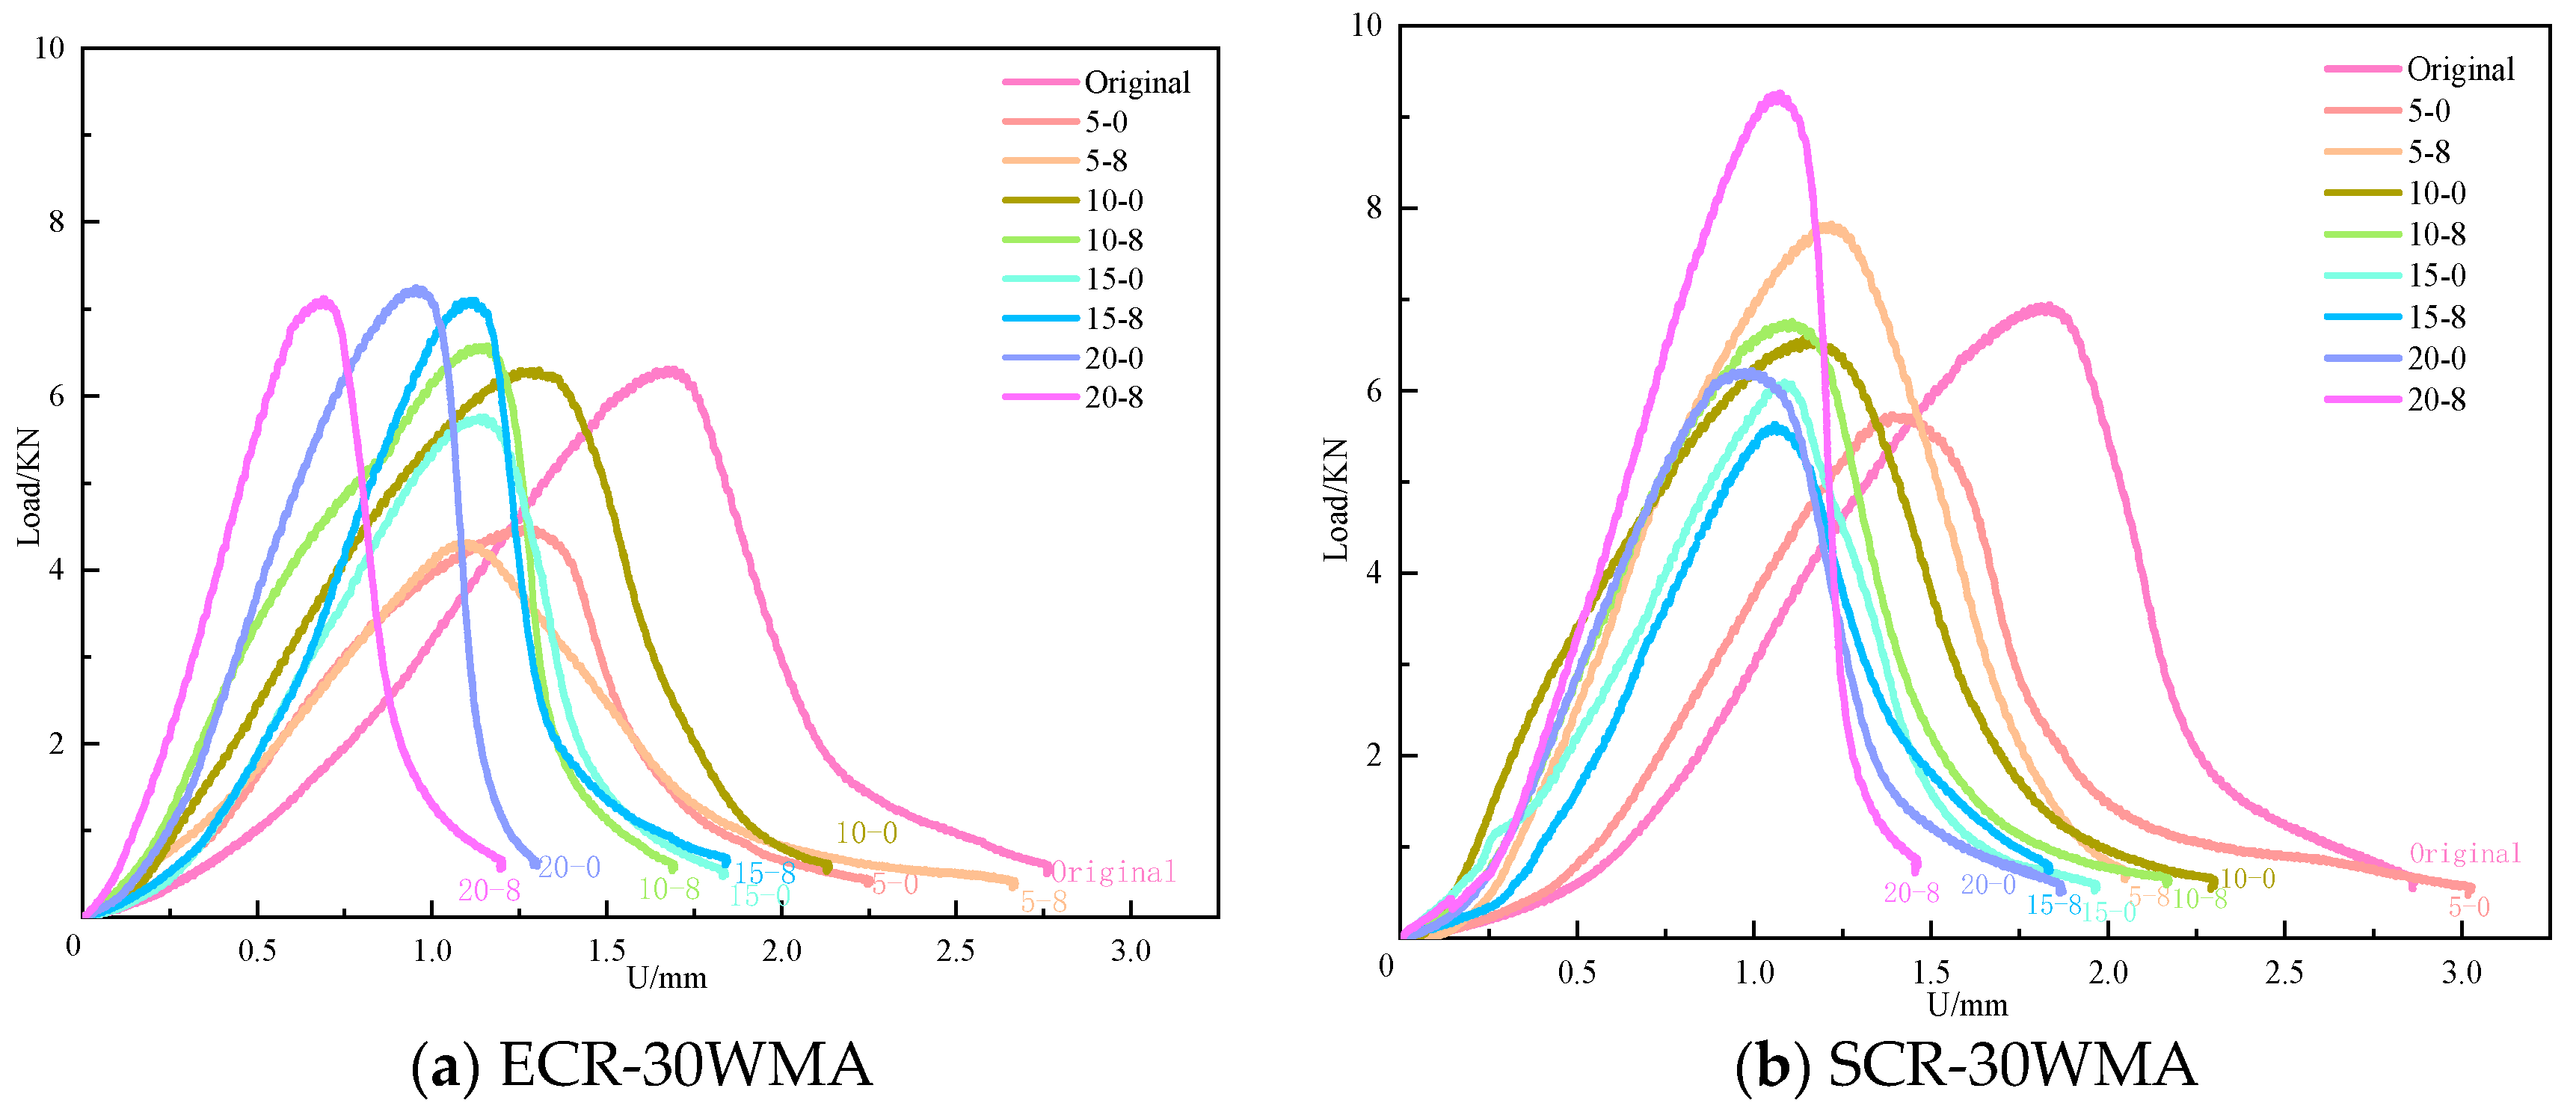
Figure 4 shows the modification of warm-mixed high-content rubber powder under the freeze–thaw cycle load–displacement curve of the asphalt mixture. As shown in
Figure 4, when using the same salt solution concentration, the magnitude of the forward shift of the first-stage curve of SCR-30WMA increases with the increase in freeze–thaw cycles. This indicates that the viscosity of the asphalt mixture begins to transition from elasticity after the freeze–thaw cycles, leading to a decrease in its deformation ability and an earlier occurrence of fracture. This is because, as the number of freeze–thaw cycles increases, an increasing number of water molecules enter the interior of the asphalt film. The water aging caused by the water molecules on the asphalt results in a decrease in the adhesion between the asphalt and the aggregates. When the temperature drops from high to low again, the water molecules entering the interior of the mixture form ice crystals, causing the volume of the mixture to expand. The freezing and expansion effect of the water leads to a loose structure of the asphalt mixture skeleton and a decrease in the interaction force between the asphalt-and-aggregate interface, making the specimen more prone to failure. Therefore, the low-temperature fracture resistance of the rubber-powder-modified asphalt mixture decreases with the increase in freeze–thaw cycles.
In
Figure 4, it can also be seen that, under the same number of freeze–thaw cycles, the first-stage curve of the specimens subjected to salt freeze–thaw cycles moves forward more significantly than that of the specimens subjected to water freeze–thaw cycles. This is because salt ions have a stronger polarity than asphalt, and salt ions have a stronger adsorption capacity for aggregates than asphalt. At this point, the peeling effect of
and
in the solution on asphalt reduces the adhesion of the asphalt to the aggregates [
20], leading to a decrease in the deformation ability of the rubber-powder-modified asphalt mixture. The fracture characteristics of the material are similar to those of elastic materials in low-temperature environments and under external loads.
3.2. Microscopic Analysis of Crack Resistance Performance
Figure 5 shows the changes in the horizontal strain field (Exx) cloud map of the crack in the initiation, propagation, and failure stages during the loading process of the SCR-30WMA semicircular specimen; this map was collected using DIC equipment and processed and calculated using VIC-3D 9 software. In
Figure 5, the closer the red area, the stronger the horizontal tensile stress and the greater the horizontal tensile deformation of the specimen; the closer the purple area, the stronger the horizontal compressive stress and the greater the horizontal compressive deformation of the specimen.
In
Figure 5a, it can be seen that during the crack initiation stage, the EXX values of the specimen increased from top to bottom. In this stage, the specimen was under compression at the top and under tension at the bottom. A localized horizontal strain concentration zone (indicated by the red area in the figure) appeared at the pre-cut notch, and a crack tip formed at the top of the specimen, indicating the initiation of a microcrack. In
Figure 5b, in addition to the horizontal strain concentration zone, it can be observed that, during the crack propagation stage, as the load continued to increase, the specimen was under compression overall. The horizontal strain concentration zone moved upward as the macroscopic crack extended. In
Figure 5c, it can be seen that during the failure stage, the localized horizontal strain concentration zone continued to move along the crack until the crack penetrated the specimen, and the horizontal strain concentration zone disappeared at the top of the specimen.
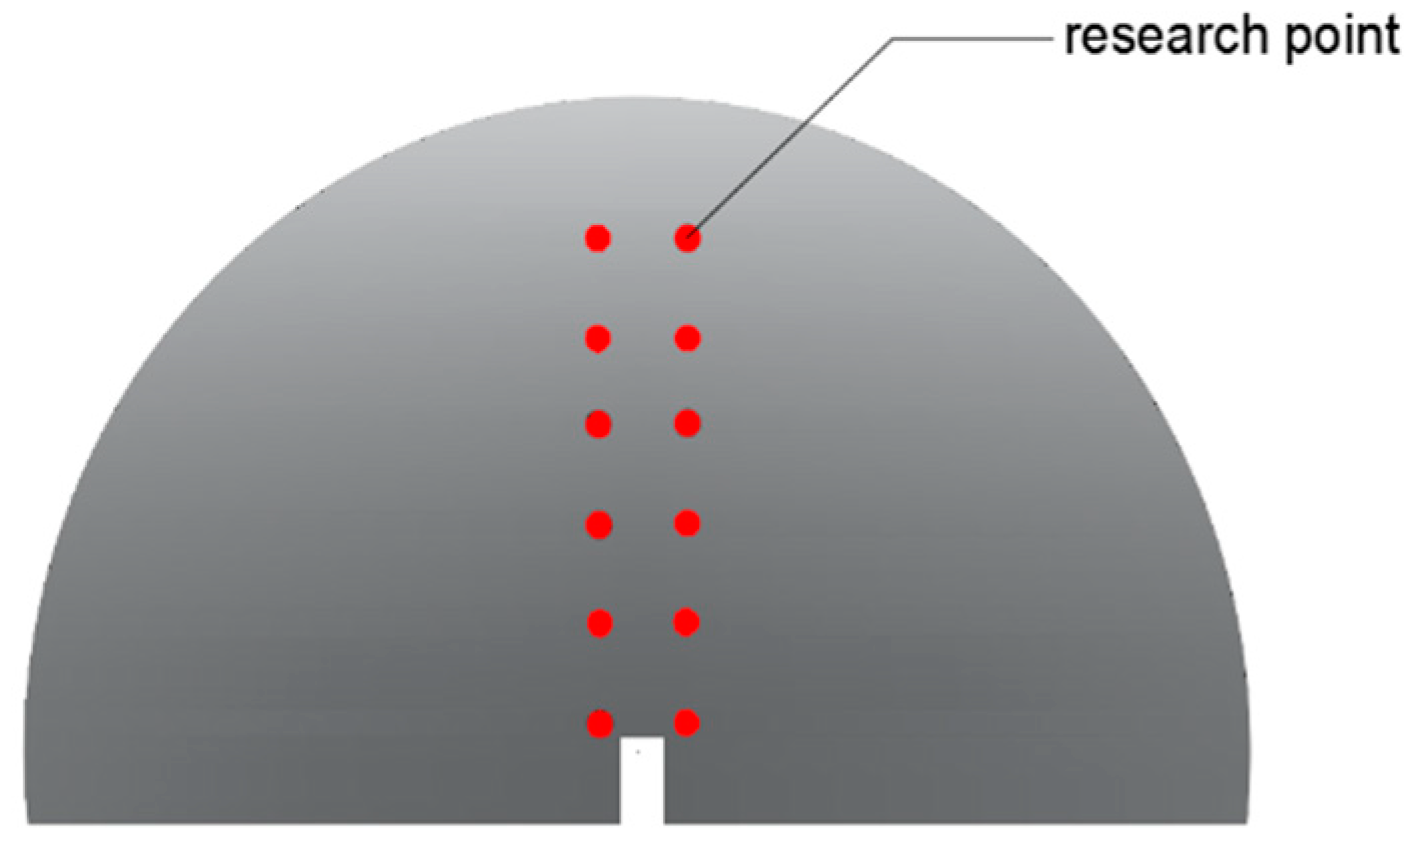
Based on the analysis of the horizontal strain characteristics of the rubber-powder-modified asphalt mixture, it was determined that the localized horizontal strain concentrated area was mainly in the form of a circle with a radius of 5 mm centered at the crack tip. In order to avoid missing data points too close to the crack position and data points deviating from the strain concentration area when they are too far away, two symmetric columns of data points located 2 mm away from both sides of the crack initiation point were selected as the research points for the cracking area (as shown in
Figure 6). Since Type I cracks usually occur under horizontal tensile stress, compared with the vertical strain–time (Eyy-t) curve, the Exx-t curve can better reflect the cracking characteristics of the rubber-modified asphalt mixture [
21]. Therefore, in this study, the Exx-t curve was used to analyze the cracking characteristics of the asphalt mixture.
As shown in
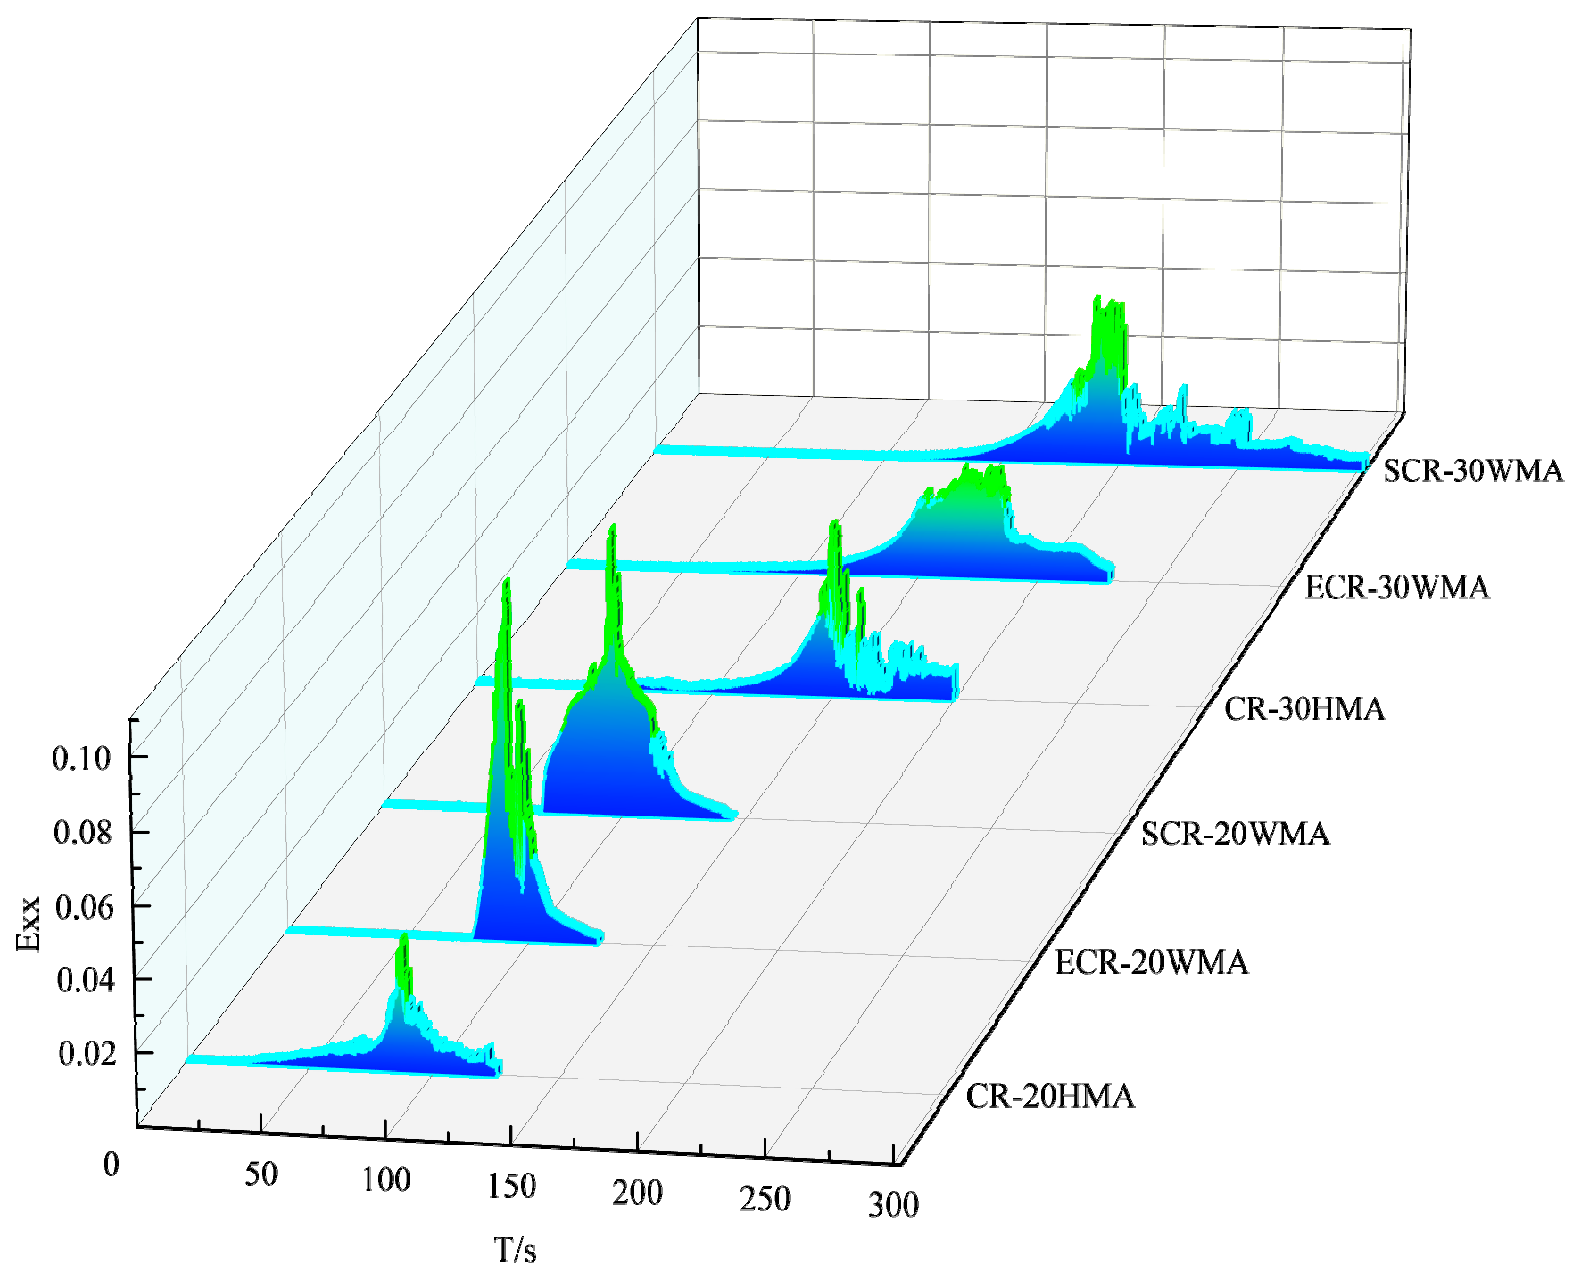
Figure 7, the Exx-t curve of SCR-30WMA divides the cracking process into three stages: The first stage is the stable growth stage of the strain, where the specimen could resist the bending and tensile stress generated by the load, and only a small amount of deformation occurred without crack formation. The second stage is the rapid growth stage of the strain, where, as the load continued to increase, the specimen reached its ultimate bending and tensile strength, and microcracks were generated at the top of the pre-cut notch and continuously developed into macroscopic cracks, with a horizontal strain concentration zone appearing at the crack initiation point. The third stage is the decrease in the strain, where, as the specimen completely released the stress caused by cracking, the horizontal strain decreased with the release of stress, the macroscopic crack rapidly expanded upward until the specimen was completely destroyed, and the localized horizontal strain concentration position moved upward until it disappeared.
Based on the occurrence time of the second stage of Exx-t, which is the moment when the specimen undergoes cracking behavior, the influence of the amount of warm-mixing agent and rubber powder on the cracking characteristics of the asphalt mixtures is analyzed.
Figure 8 shows the Exx-t curves of the six types of asphalt mixtures.
In
Figure 8, it was observed that ECR-20WMA appeared later than CR-20HMA in the second stage, and ECR-30WMA also appeared later than CR-30HMA in the second stage, indicating a slower crack propagation rate. The reason for this was that the addition of EM in the asphalt mixture effectively improved the stress relaxation ability of the mixture, enhancing its flexibility and reducing the stress concentration, thus delaying the occurrence and development of cracks and improving the crack resistance of the asphalt mixture. It was also observed that SCR-20WMA appeared later than CR-20HMA in the second stage, and SCR-30WMA appeared later than CR-30HMA in the second stage, indicating that the addition of SDYK improved the low-temperature crack resistance of the asphalt mixture. This was because SDYK, as a surfactant, had polarity and charge, and the aggregate surface also had charge under normal conditions. Therefore, with the increase in the mixing time between the asphalt and the aggregate [
21], the attraction between the positive and negative charges allowed for the asphalt to better coat the aggregate surface, enhancing the continuity of the internal structure of the asphalt mixture and improving its deformation ability. As a result, external stress could be distributed more uniformly throughout the asphalt mixture, reducing the impact of the stress concentration and effectively slowing down the crack propagation rate. It was observed that ECR-20WMA appeared earlier than SCR-20WMA in the second stage, and ECR-30WMA appeared earlier than SCR-30WMA in the second stage, indicating that the addition of SDYK had a better effect on the crack resistance of the asphalt mixture than EM. This was because EM exists in a crystalline form in low-temperature environments, and this causes changes in the asphalt structure and a decrease in the adhesion between the asphalt and the aggregates, making the asphalt mixture more prone to cracking under external stress.
CR-30HMA appeared later than CR-20HMA in the second stage, and ECR-30WMA also appeared later than ECR-20WMA in the second stage. Additionally, SCR-30WMA appeared later than SCR-20WMA in the second stage. Therefore, increasing the dosage of rubber powder can effectively improve the crack resistance of asphalt mixtures. This is because the increased dosage of the rubber powder forms a larger and more complex network structure after swelling in asphalt. The interaction forces between the network structures in the asphalt are stronger, resulting in greater surface roughness. This enhances the adhesion between the asphalt and aggregates, effectively slowing down the crack propagation speed. Furthermore, rubber powder has good elasticity, and when the dosage is high, it can effectively reduce the stress concentration in asphalt mixtures, thereby improving the crack resistance performance of asphalt mixtures.
The strain derivative index
is used for evaluation, where
is the ratio of
EYY to
EXX per unit time, which characterizes the relative deformation of the asphalt mixture per unit time under the three-point bending tensile loading mode. The smaller the value of
, the closer it is to the cohesive body in low-temperature environments, and the better its crack resistance performance. The function expression is outlined in (1) [
22]:
In the equation, is the horizontal strain–time curve function; is the vertical strain–time curve function; and t is the time.
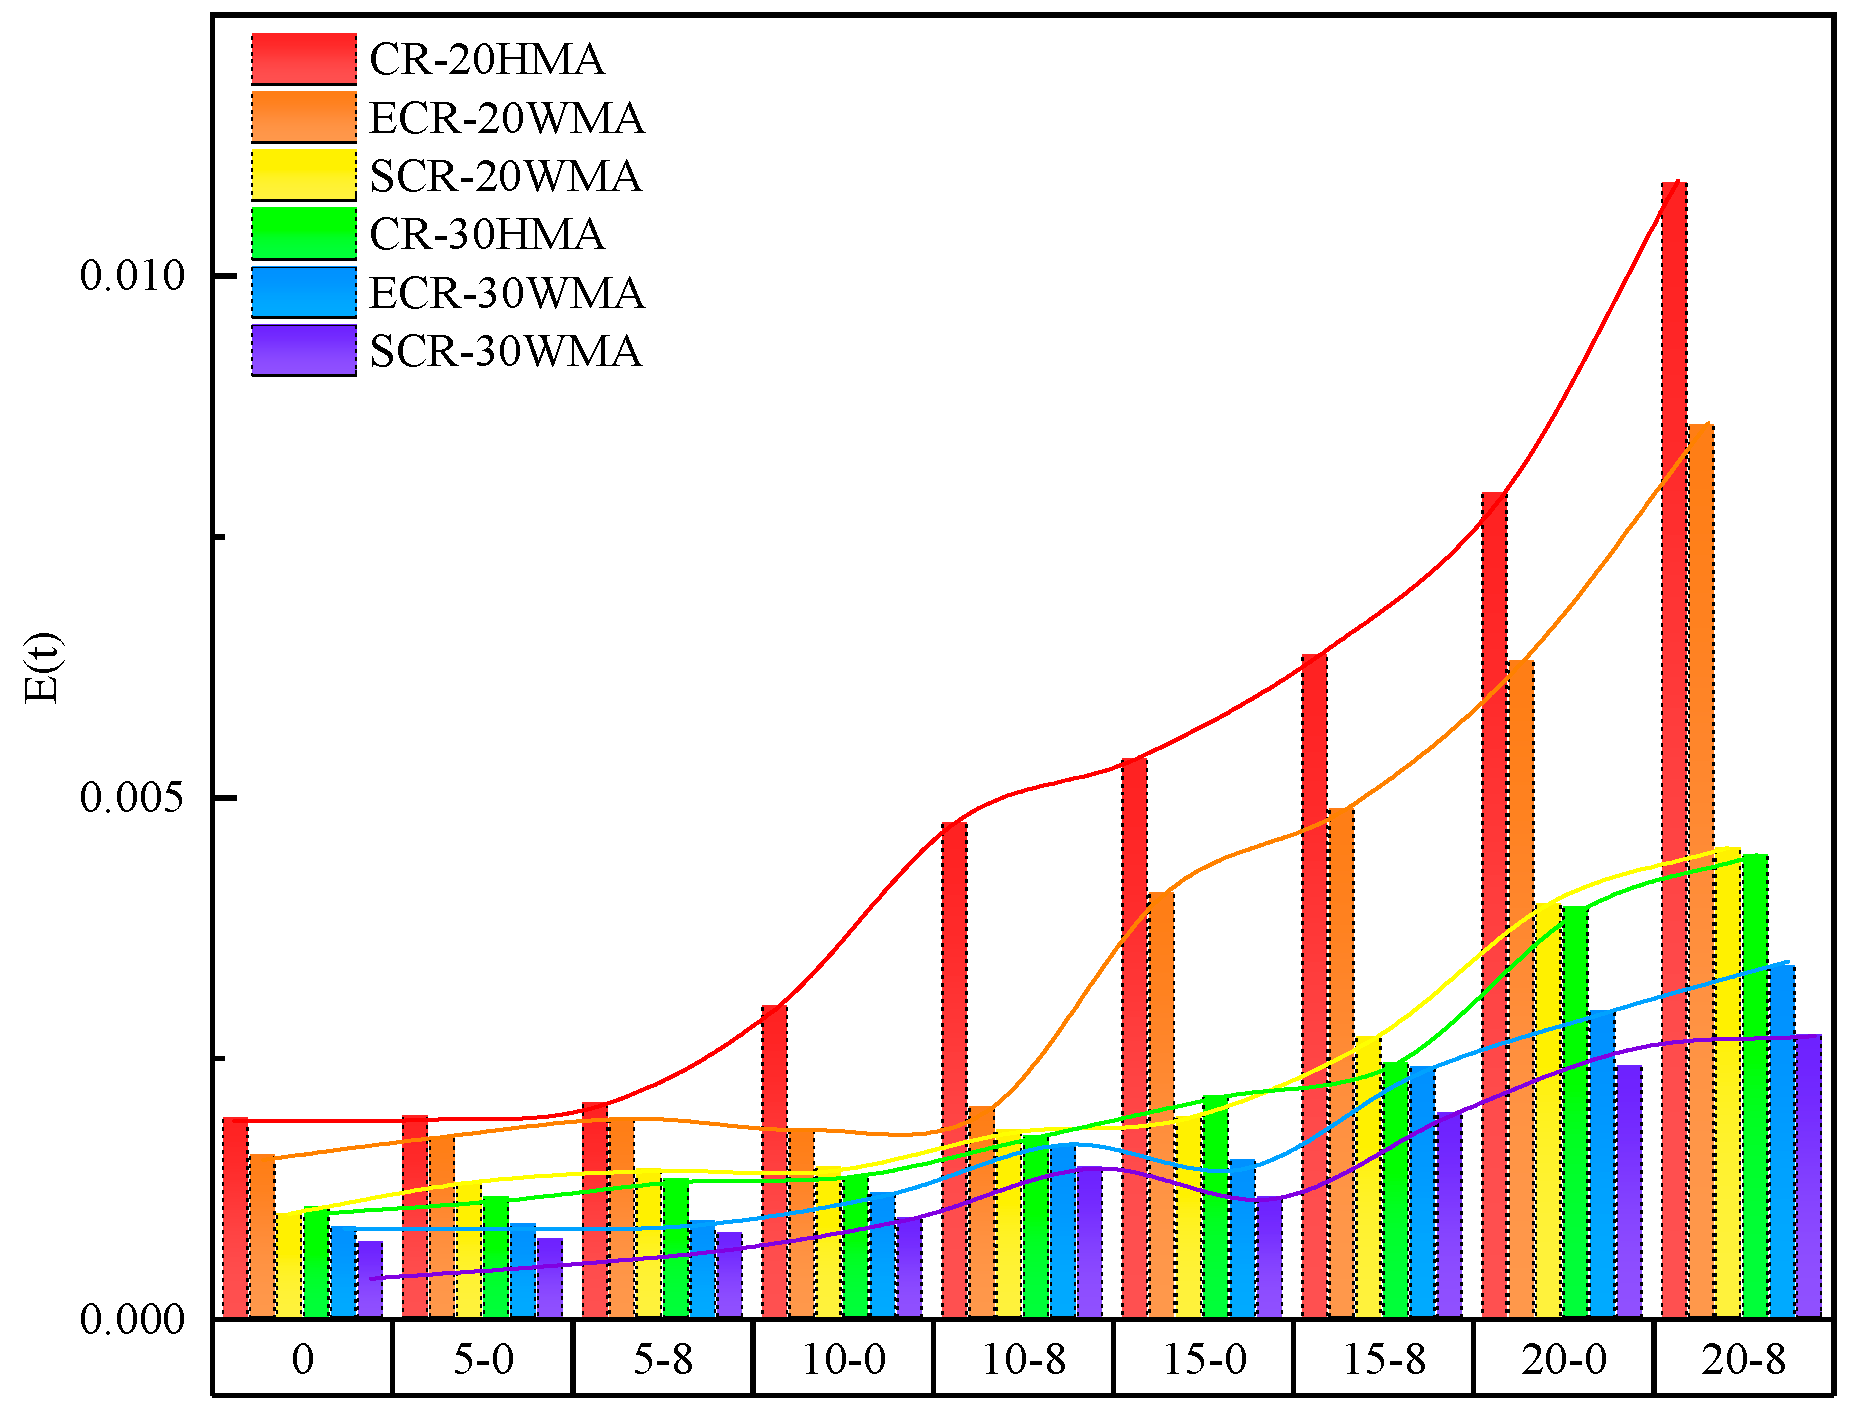
When Exx reaches its maximum, that is, when macroscopic cracks form in the asphalt mixture, the specimen undergoes fracture failure, which is more suitable for analyzing the crack resistance performance of the asphalt mixture. Therefore, t in Formula (1) is the time when Exx reaches its maximum value.
Figure 9 shows the values of the different rubber-powder-modified asphalt mixtures under various freeze–thaw cycles. According to the analysis in
Figure 9, under the same freeze–thaw cycle, the order of values from largest to smallest is as follows: CR-20HMA > ECR-20WMA > SCR-20WMA > CR-30HMA > ECR-30WMA > SCR-30WMA. This indicates that the high-dosage rubber-powder-modified asphalt mixtures had a better fracture resistance in low-temperature environments. The essence of this phenomenon is twofold. On the one hand, increasing the dosage of the rubber powder enhanced the adhesive properties of the rubber-powder-modified asphalt, making the mixture more resistant to cracking under external forces. On the other hand, the addition of the warm-mixing additives not only improved the adhesion between the asphalt and aggregates but also enhanced the deformability of the rubber-powder-modified asphalt mixture. Among them, SCR-30WMA had better fracture resistance than ECR-30WMA, mainly due to the different interaction mechanisms with the asphalt. The polar groups in the SDYK surfactant were easily adsorbed by the asphalt resin, resulting in a relatively loose asphalt aggregate structure, which exhibited certain fluidity at low temperatures [
23] and had a small impact on the viscosity of the asphalt. The EM viscosity reducer formed a new aggregate structure through a molecular interaction with the asphalt, creating a stable spatial structure that made the asphalt less prone to deformation. This led to an increase in the dispersion of the asphalt molecular structure, thereby reducing the viscosity of the asphalt [
24].
According to
Figure 9, the values of the various rubber-powder-modified asphalt mixtures increased with the increase in freeze–thaw cycles with the same salt solution concentration. This indicates that, during the loading process of the asphalt mixtures in low-temperature environments, the freeze–thaw cycles accelerated the transition of the material from viscous to elastic, making the specimens more prone to damage. At the same time, under the same freeze–thaw cycles, the values of the specimens after the salt freeze–thaw cycle were larger than those after the water freeze–thaw cycle, indicating that the coupling effect of freeze–thaw cycles and salt erosion made the fracture characteristics of the rubber-powder-modified asphalt mixtures more similar to those of linear elastic materials, resulting in a significant decrease in the fracture resistance.
3.3. Microscopic Properties under AFM
Figure 10 shows the morphological images of the six types of rubber-powder-modified asphalt before and after the salt freeze–thaw cycles. In
Figure 10, it can be observed that all six types of rubber-powder-modified asphalt did not exhibit an obvious “honeycomb structure”, but instead showed a chain-like structure with three colors: black, brown, and white. This was because, after the addition of the rubber powder to the asphalt, the light components and some wax in the asphalt were absorbed by the rubber powder, resulting in a reduction in the wax content that formed the “honeycomb structure” [
25]. The asphalt surface was scattered with larger black particles and white bright spots, which was caused by the asphalt adhering to the surface of the rubber powder and the temperature being insufficient to achieve a molten state between the rubber powder and the asphalt, resulting in agglomeration. However, increasing the preparation temperature would lead to the severe aging of the asphalt, a loss of oil content, and the generation of smoke that is harmful to the environment and human health.
The analysis in
Figure 10 revealed that the high-dosage rubber-powder-modified asphalt had a higher number of chain-like structures and a more uniform distribution of white bright spots (rubber powder particles) than the normal-dosage rubber-powder-modified asphalt. This was because, with a higher dosage of rubber powder, the high-molecular-weight polymers in the rubber powder are more densely distributed in the asphalt, forming more cross-linking and aggregation points, resulting in a more stable network structure. Compared to the normal-dosage rubber-powder-modified asphalt, the high-dosage rubber-powder-modified asphalt had a more complex network structure with tighter cross-linking, thus exhibiting a better bonding strength. Additionally, the high-dosage rubber-powder-modified asphalt had a higher deformation capacity, as the cross-linking between the rubber powder molecules could absorb more deformation energy, thereby enhancing the low-temperature crack resistance of the asphalt.
The chain-like structure of the modified asphalt with six types of rubber powder significantly decreased after 20 freeze–thaw cycles, and the white bright spots were greatly diminished, replaced by more black granular particles. The reason behind this is that the rubber powder particles tended to agglomerate after the freeze–thaw cycles, making it difficult to observe individual rubber powder particles and their chain-like structures in the morphology image. The dispersed medium also became rougher, resulting in a reduced uniformity in the rubber powder asphalt and water aging phenomenon. The connection between the rubber powder particles and the asphalt matrix weakened, leading to a decreased flexibility in the asphalt at low temperatures [
26].
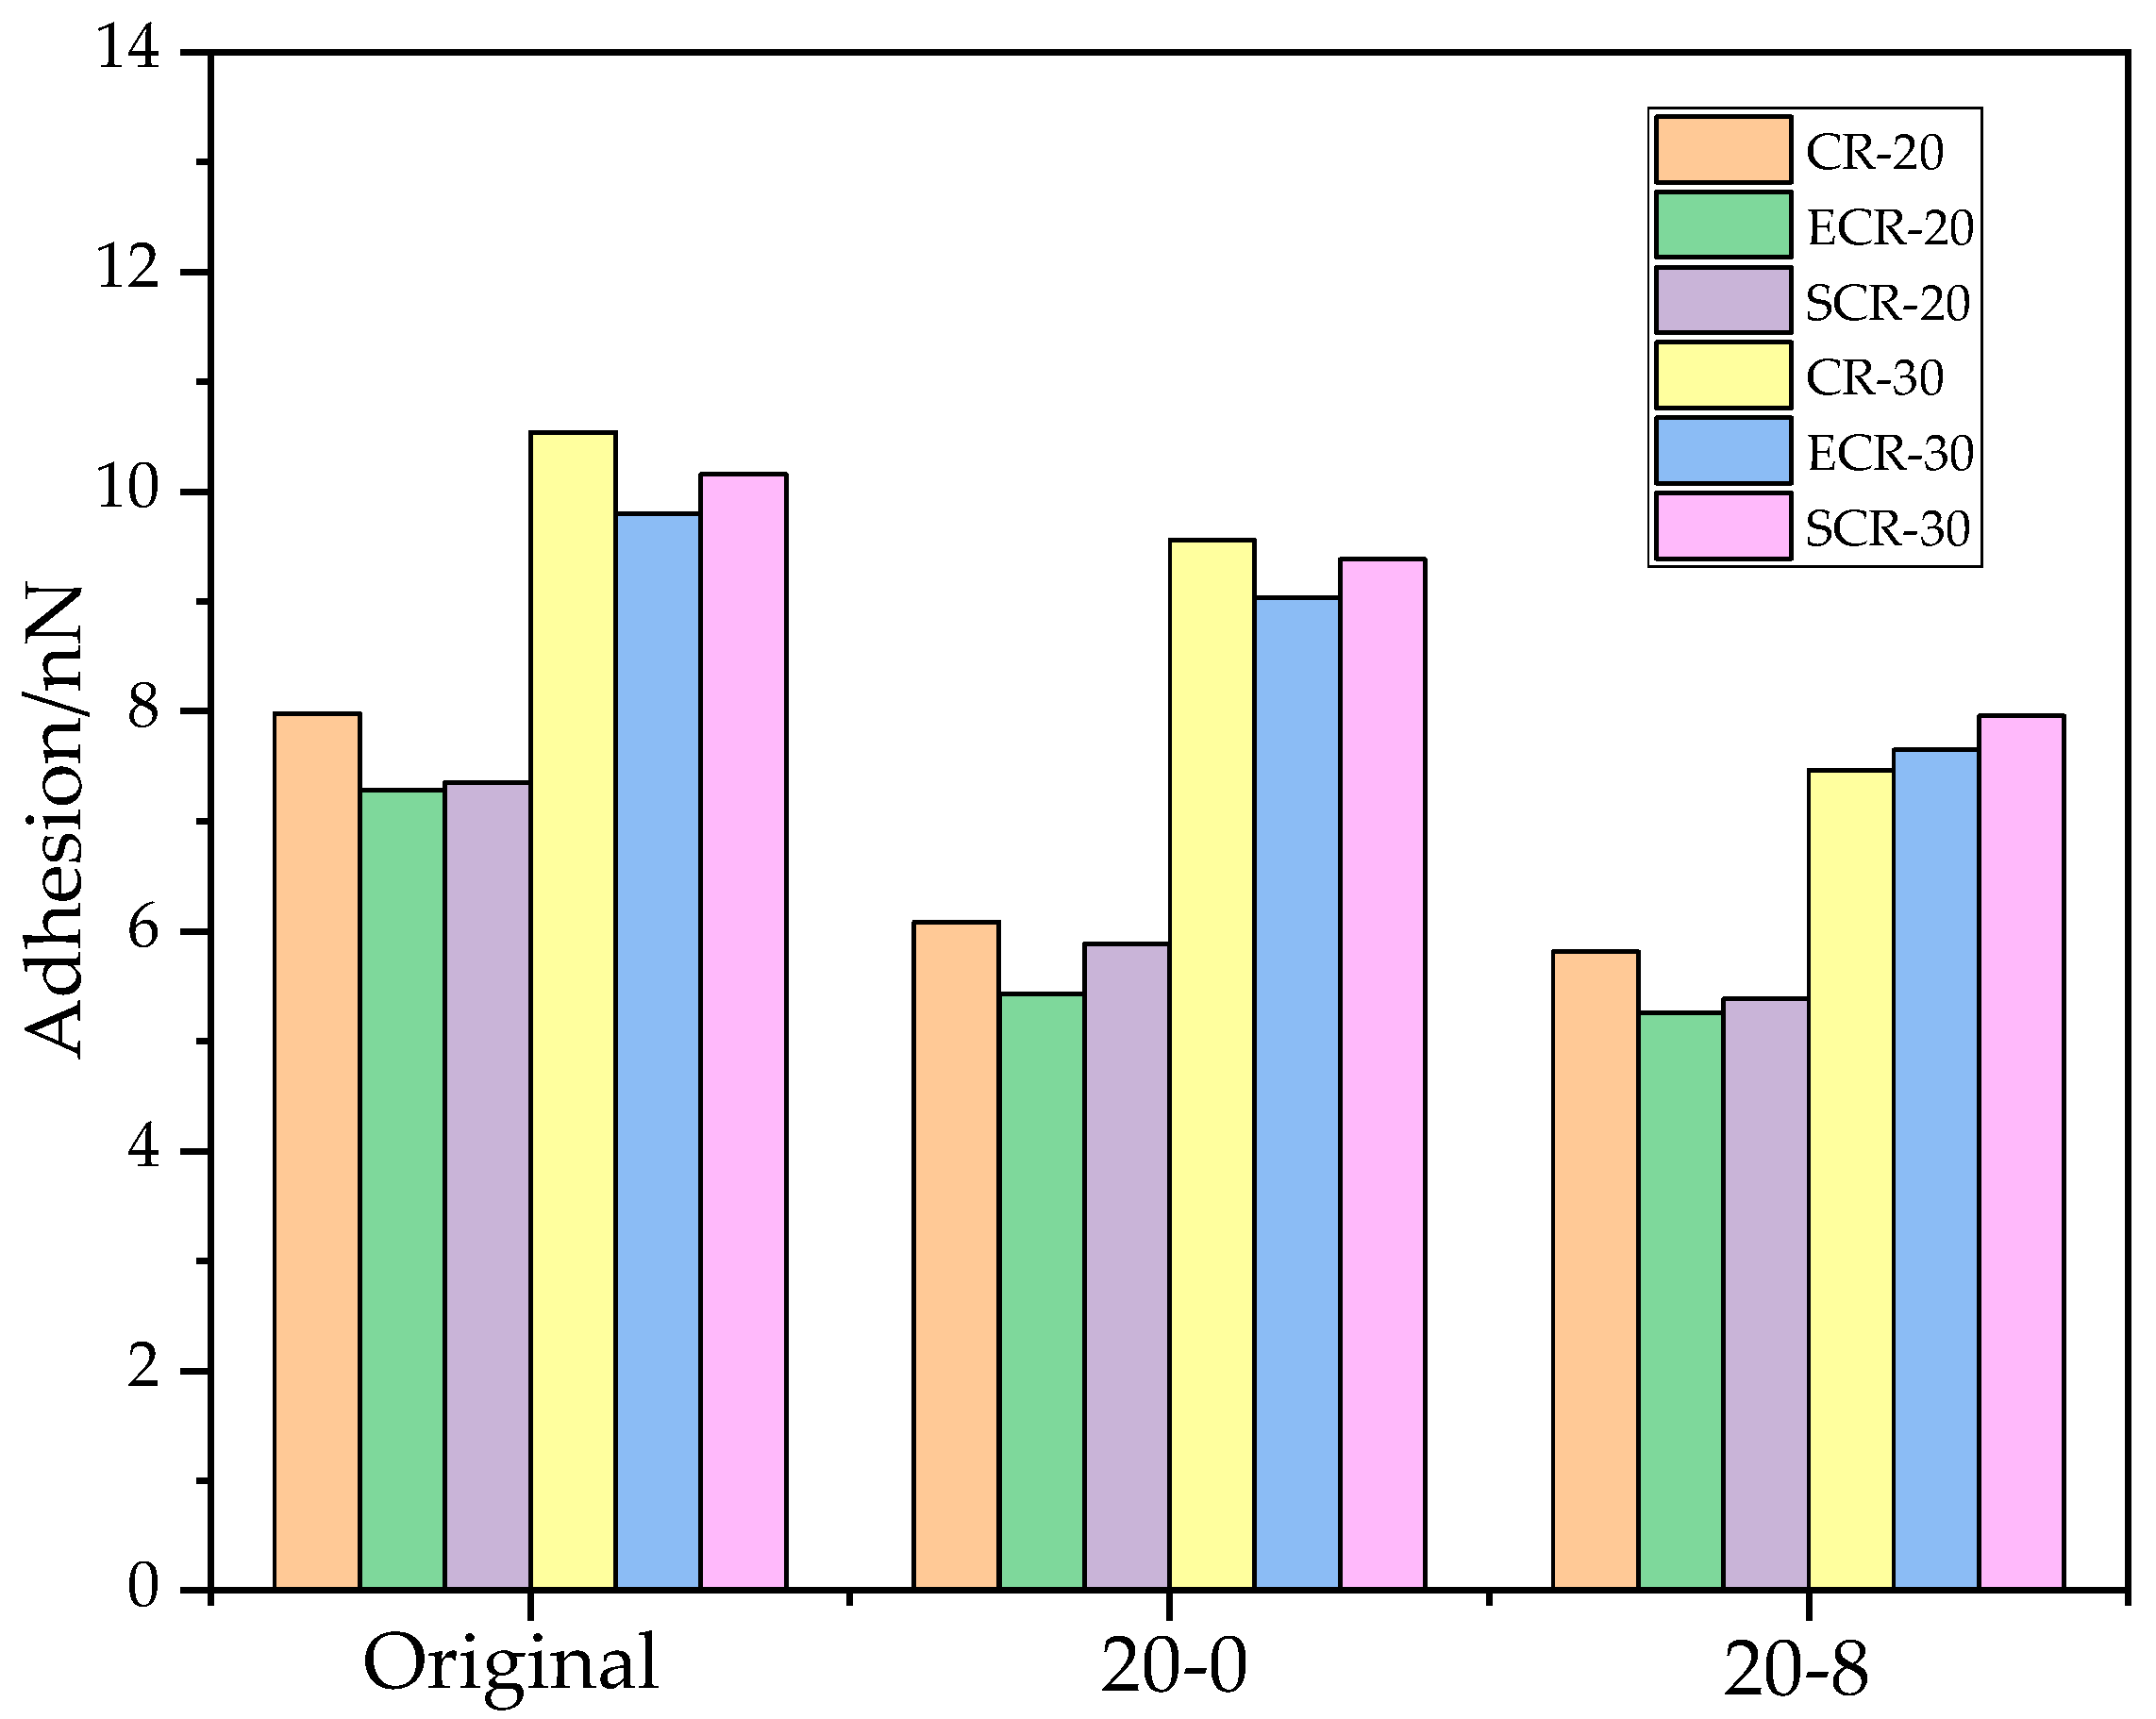
In
Figure 11, it can be seen that the adhesion of ECR-20 was lower than that of CR-20, and the adhesion of ECR-30 was lower than that of CR-30, indicating that the addition of EM reduced the adhesion of the asphalt to the aggregates. This is because EM reduced the intermolecular forces of the asphalt, decreased the surface roughness, and reduced the adhesive area. The adhesion of SCR-20 was lower than that of CR-20, and the adhesion of SCR-30 was lower than that of CR-30. This is because the addition of SDYK to the asphalt resulted in the formation of a charged water film on the surface, which lubricated the asphalt structure and reduced the surface roughness, resulting in a decrease in the adhesive area. Therefore, the addition of SDYK also reduced the adhesion of the asphalt to the aggregates. The adhesion of ECR-20 was lower than that of SCR-20, and the adhesion of ECR-30 was lower than that of SCR-30. This is because the addition of EM increased the light components of the asphalt, reduced the surface roughness, and decreased the adhesion. However, the addition of SDYK to the asphalt did not significantly increase its light components, but instead, lubricated its surface. Moreover, the addition of EM reduced the surface roughness of the asphalt more than the addition of SDYK. Therefore, the impact of EM on the adhesion of asphalt is greater than that of SDYK.
The adhesion of CR-30 was greater than that of CR-20, ECR-30 had greater adhesion than ECR-20, and SCR-30 had greater adhesion than SCR-20, indicating that increasing the dosage of the rubber powder resulted in an increase in the adhesion of the asphalt. The reason for this was that increasing the dosage of the rubber powder made the surface of the asphalt rougher, thereby increasing the adhesive area and improving the adhesion with the aggregate, thus enhancing the crack resistance of the asphalt mixture.
The adhesion forces of the six types of asphalt were reduced after the freeze–thaw and salt freeze–thaw cycles. This was because the freeze–thaw cycles intensified the erosion of the water molecules and salt ions on the asphalt, causing changes in the apparent structure of the asphalt and a decrease in the surface roughness, resulting in a reduction in the adhesive area. Additionally, the salt freeze–thaw cycles further decreased the surface roughness of the asphalt, leading to a decrease in the adhesion forces.
In
Figure 12, it can be observed that the DMT modulus of ECR-20 was lower than that of CR-20, and the DMT modulus of ECR-30 was lower than that of CR-30, indicating that the addition of EM improved the deformation ability of the asphalt. This is because the addition of EM increased the light components in the asphalt, enhanced its flowability, and provided a better deformation ability at low temperatures. Furthermore,
Table 3 and
Table 4 show that the elongation of ECR-20 and ECR-30 was higher than that of CR-20 and CR-30. The DMT modulus of SCR-20 was lower than that of CR-20, and the DMT modulus of SCR-30 was lower than that of CR-30. This is because, when SDYK was added, it acted as a lubricant in the asphalt structure, reducing the surface roughness, enhancing flowability, and providing a better deformation ability at low temperatures. It also improved the uniform adhesion of the asphalt to the aggregates, thereby enhancing the crack resistance of the asphalt mixtures. The DMT modulus of ECR-20 was higher than that of SCR-20, and the DMT modulus of ECR-30 was higher than that of SCR-30, indicating that the addition of SDYK to the asphalt improved its deformation ability more than the addition of EM. This is because at normal or low temperatures, EM exists in the form of crystals in asphalt, causing some changes in the asphalt structure and reducing its flexibility. Therefore, the addition of warm-mixing additives can improve the low-temperature crack resistance of asphalt mixtures, and SDYK has a better effect on the low-temperature crack resistance of asphalt mixtures than EM.
The DMT modulus of CR-30 was greater than that of CR-20, and the DMT modulus of ECR-30 was greater than that of ECR-20. Additionally, the DMT modulus of SCR-30 was greater than that of SCR-20. This indicates that the incorporation of more rubber powder resulted in a decrease in the deformability of the asphalt. This was because increasing the amount of rubber powder led to a denser internal structure and a rougher surface of the asphalt, reducing the free space. Therefore, CR-30 was harder and had slightly poorer deformability.
The DMT modulus of all six types of asphalt increased after the freeze–thaw cycles and salt freeze–thaw cycles. This was due to the intensified erosion of the water molecules and salt ions on the asphalt during the freeze–thaw cycles, causing the asphalt to become harder and reducing its flowability and deformability. The increase in the DMT modulus after the salt freeze–thaw cycles was greater than that after the water freeze–thaw cycles, indicating that, under the same number of freeze–thaw cycles, the damage caused by the salt solution to the asphalt was greater than that caused by water. This made the asphalt harder and reduced its deformability, thereby negatively affecting the low-temperature crack resistance of the asphalt mixture.


