
Unveiling the Mechanics Behind Polyimide’s Friction-Greening Phenomenon


Abstract

1. Introduction
2. Materials and Methods
3. Results
4. Conclusions
Supplementary Materials
Author Contributions
Funding
Institutional Review Board Statement
Data Availability Statement
Conflicts of Interest
References
- Hong, G.; Gan, X.; Leonhardt, C.; Zhang, Z.; Seibert, J.; Busch, J.M.; Bräse, S. A brief history of OLEDs—Emitter development and industry milestones. Adv. Mater. 2021, 33, 2005630. [Google Scholar] [CrossRef] [PubMed]
- Sazonov, A.; Striakhilev, D.; Czang-Ho, L.; Nathan, A. Low-temperature materials and thin film transistors for flexible electronics. Proc. IEEE 2005, 93, 1420–1428. [Google Scholar] [CrossRef]
- Hwang, H.W.; Hong, S.; Hwang, S.S.; Kim, K.W.; Ha, Y.M.; Kim, H.J. Analysis of recoverable residual image characteristics of flexible organic light-emitting diode displays using polyimide substrates. IEEE Electron Device Lett. 2019, 40, 1108–1111. [Google Scholar] [CrossRef]
- Yu, Z.; Fang, Y.; Lu, X.; Lu, Q. Methyl side-group-regulated terphenyl polyimides with high heat resistance and ultralow thermal expansion for OLED applications. ACS Appl. Polym. Mater. 2024, 6, 6658–6666. [Google Scholar] [CrossRef]
- Ji, D.; Li, T.; Hu, W.; Fuchs, H. Recent progress in aromatic polyimide dielectrics for organic electronic devices and circuits. Adv. Mater. 2019, 31. [Google Scholar] [CrossRef]
- Xi, S.; Li, J.; Huang, C.; Liu, W.; Guo, X.; Liu, X.; Yu, Y.; Yang, X. The investigation on high-temperature color deviation of flexible AMOLED display. SID Symp. Dig. Tech. Papers 2023, 54, 929–932. [Google Scholar] [CrossRef]
- Xi, Z.; Chen, L.; Qiang, T.; Xu, F.; Lei, Z. Cover Plate, Display Module, and Display Device; W.I.P. Organization: Newcastle Upon Tyne, UK, 2024. [Google Scholar]
- Kim, K.W.; Kang, J.S.; Shin, D.J.; Ku, H.; Kang, I.B.; Lee, K.H.; Kim, H.J. The analysis of kink effect in LTPS TFTs with LDD and source contacted bottom shield metal. SID Symp. Dig. Tech. Papers 2017, 48, 1318–1322. [Google Scholar] [CrossRef]
- Xiang, C.; Koo, W.; So, F.; Sasabe, H.; Kido, J. A systematic study on efficiency enhancements in phosphorescent green, red and blue microcavity organic light emitting devices. Light Sci. Appl. 2013, 2, 74. [Google Scholar] [CrossRef]
- Cai, W.; Li, W.; Song, X.; Zheng, X.; Guo, H.; Lin, C.; Yang, D.; Ma, D.; Ng, M.; Tang, M.C. Host engineering of deep-blue-fluorescent organic light-emitting diodes with high operational stability and narrowband emission. Adv. Sci. 2024, 2407278. [Google Scholar] [CrossRef]
- Xiong, Z.; Gu, J.; Xiang, D. Electrostatic damage influenced by bottom gate-like effects in flexible organic light-emitting diodes. IEEE Electron Device Lett. 2023, 44, 1656–1659. [Google Scholar] [CrossRef]
- Brekner, M.-J.; Feger, C. Curing studies of a polyimide precursor. II. polyamic acid. J. Polym. Sci. Pol. Chem. 1987, 25, 2479–2491. [Google Scholar] [CrossRef]
- Brekner, M.-J.; Feger, C. Curing studies of a polyimide precursor. J. Polym. Sci. Pol. Chem. 1987, 25, 2005–2020. [Google Scholar] [CrossRef]
- Lei, H.; Zhang, M.; Niu, H.; Qi, S.; Tian, G.; Wu, D. Multilevel structure analysis of polyimide fibers with different chemical constitutions. Polymer 2018, 149, 96–105. [Google Scholar] [CrossRef]
- Torres, A.; Soto, C.; Carmona, J.; Comesaña-Gandara, B.; de la Viuda, M.; Palacio, L.; Prádanos, P.; Simorte, M.T.; Sanz, I.; Muñoz, R.; et al. Gas Permeability through Polyimides: Unraveling the Influence of Free Volume, Intersegmental Distance and Glass Transition Temperature. Polymers 2023, 16, 13. [Google Scholar] [CrossRef]
- Jian, S.; Liu, S.; Chen, L.; Zhou, S.; Fan, P.; Zeng, Y.; Hou, H. Nano-boria reinforced polyimide composites with greatly enhanced thermal and mechanical properties via in-situ thermal conversion of boric acid. Compos. Commun. 2017, 3, 14–17. [Google Scholar] [CrossRef]
- Maity, S.; Jana, T. Polybenzimidazole block copolymers for fuel cell: Synthesis and studies of block length effects on nanophase separation, mechanical properties, and proton conductivity of PEM. ACS Appl. Mater. Interfaces 2014, 6, 6851–6864. [Google Scholar] [CrossRef]
- Yin, C.; Dong, J.; Tan, W.; Lin, J.; Chen, D.; Zhang, Q. Strain-induced crystallization of polyimide fibers containing 2-(4-aminophenyl)-5-aminobenzimidazole moiety. Polymer 2015, 75, 178–186. [Google Scholar] [CrossRef]
- Sun, Y.; Yang, Z.; Wang, Q.; Wang, T. The effect of N-doped quantum dots on the properties of in situ prepared colorless polyimide nanocomposite films. Mater. Des. 2018, 140, 144–152. [Google Scholar] [CrossRef]
- Jiang, S.; Bi, Z.; Wang, J.; Zhao, J.; Fan, L.; Tian, L.; Wu, Y.; Yi, N.; Wei, Z.; Gan, F. Construction of novel Cu-α-diimide interactions for enhancing thermal resistance and dimensional stability of polyimide films. J. Mater. Res. Technol. 2023, 25, 1920–1930. [Google Scholar] [CrossRef]
- Li, T.; Senesi, A.J.; Lee, B. Small angle X-ray scattering for nanoparticle research. Chem. Rev. 2016, 116, 11128–11180. [Google Scholar] [CrossRef]
- Ioan, S.; Hulubei, C.; Popovici, D.; Musteata, V.E. Origin of dielectric response and conductivity of some alicyclic polyimides. Polym. Eng. Sci. 2012, 53, 1430–1447. [Google Scholar] [CrossRef]
- Wang, Q.; Che, J.; Wu, W.; Hu, Z.; Liu, X.; Ren, T.; Chen, Y.; Zhang, J. Contributing Factors of Dielectric Properties for Polymer Matrix Composites. Polymers 2023, 15, 590. [Google Scholar] [CrossRef]
- Wakita, J.; Sekino, H.; Sakai, K.; Urano, Y.; Ando, S. Molecular design, synthesis, and properties of highly fluorescent polyimides. J. Phys. Chem. B 2009, 113, 15212–15224. [Google Scholar] [CrossRef] [PubMed]
- Zhou, Z.; Zhang, Y.; Liu, S.; Chi, Z.; Chen, X.; Xu, J. Flexible and highly fluorescent aromatic polyimide: Design, synthesis, properties, and mechanism. J. Mater. Chem. C 2016, 4, 10509–10517. [Google Scholar] [CrossRef]
- Wu, J.-H.; Liou, G.-S. High-efficiency fluorescent polyimides based on locally excited triarylamine-containing dianhydride moieties. Polym. Chem. 2015, 6, 5225–5232. [Google Scholar] [CrossRef]
- Meunier, M.; Quirke, N.; Aslanides, A. Molecular modeling of electron traps in polymer insulators: Chemical defects and impurities. J. Chem. Phys. 2001, 115, 2876–2881. [Google Scholar] [CrossRef]
- Zhang, L.; Zhou, M.; Zhang, Z.; Yuan, J.; Li, B.; Wen, W.; Tian, J. Ultra-long photoluminescence lifetime in an inorganic halide perovskite thin film. J. Mater. Chem. A 2019, 7, 22229–22234. [Google Scholar] [CrossRef]
- Meng, G.; Shi, Y.; Wang, X.; Wang, W.; Wang, S.; Ji, M.; Hao, C. New insight into the ultra-long lifetime of excitons in organic–inorganic perovskite: Reverse intersystem crossing. J. Energy Chem. 2018, 27, 1496–1500. [Google Scholar] [CrossRef]
- Boggs, S. A rational consideration of space charge. IEEE Electr. Insul. Mag. 2004, 20, 22–27. [Google Scholar] [CrossRef]
- Suh, K.S.; Koo, J.H. Effects of sample preparation conditions and short chains on space charge formation in LDPE. IEEE Trans. Dielectr. Electr. Insul. 1996, 3, 153–160. [Google Scholar] [CrossRef]
- Xia, X.; Yin, J.; Chen, M.; Liu, X. The role of interfaces in PI matrix nano composite films on electrical properties. Polym. Test. 2018, 69, 405–409. [Google Scholar] [CrossRef]


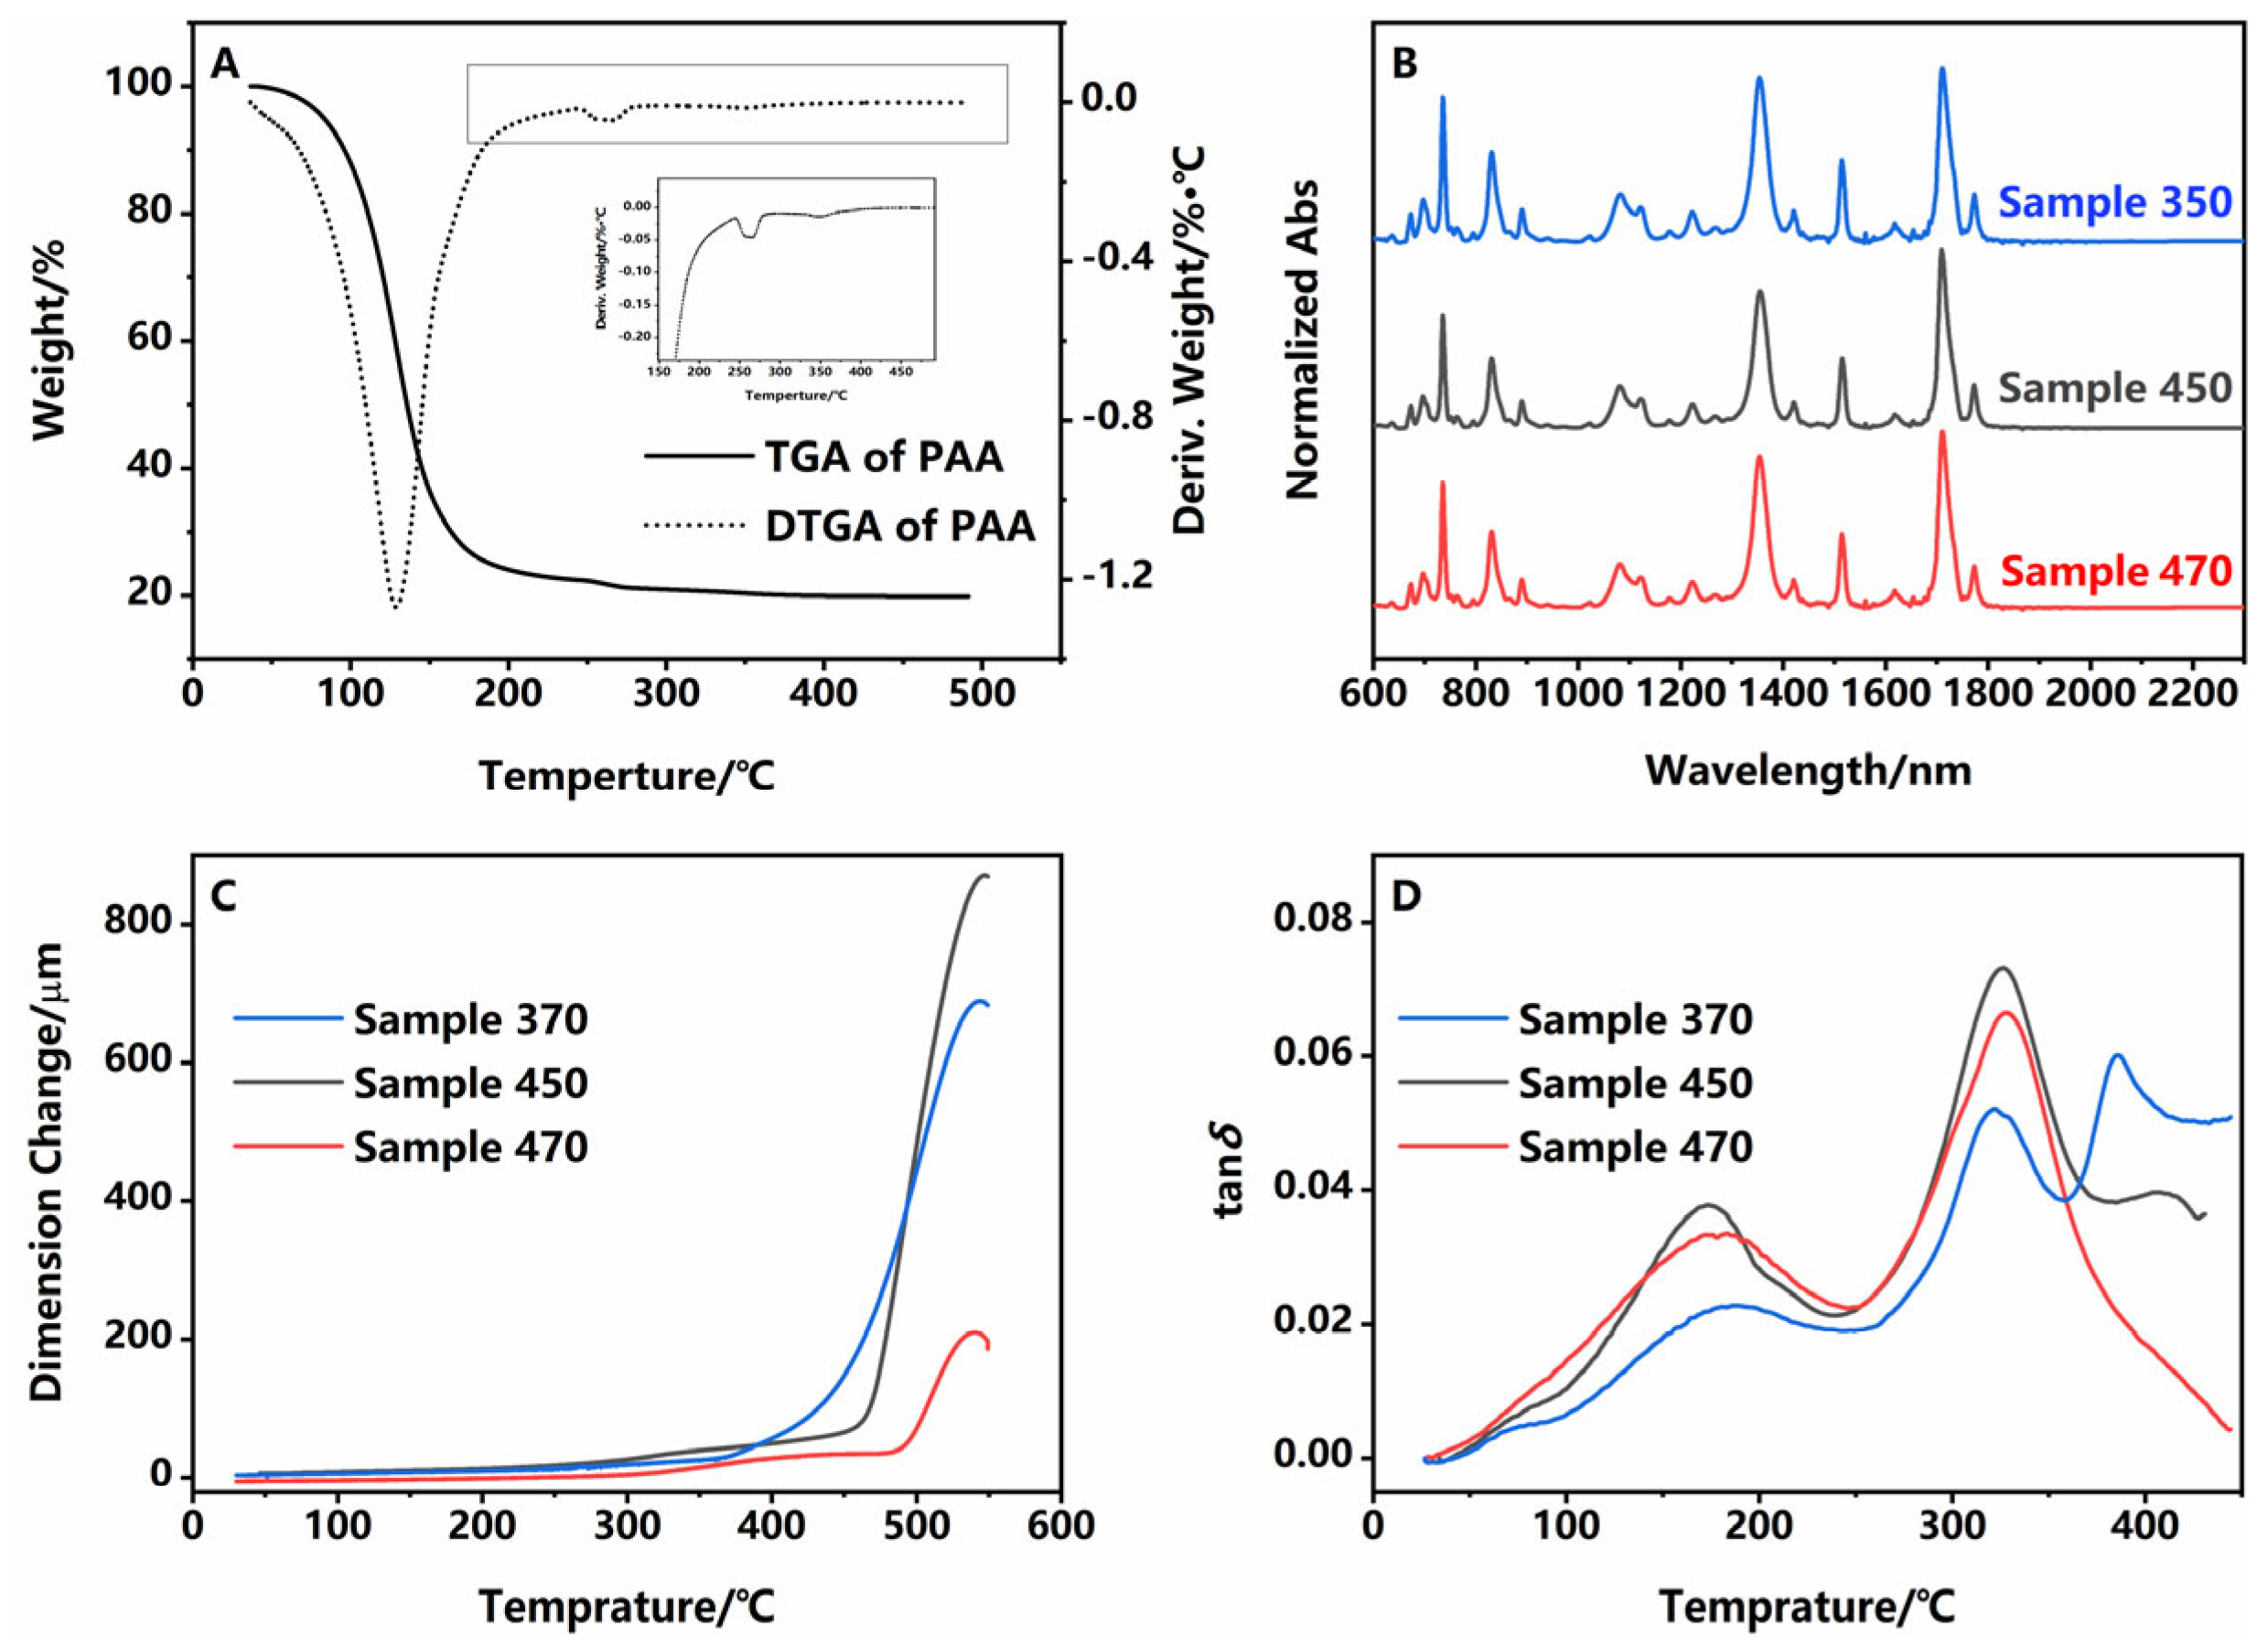
| C−N−C | Tg1/°C | Tg2/°C | CTE/ppm·°C−1 | |
|---|---|---|---|---|
| sample 350 | 5.02 | 322.81/387.52 | 443.11 | 15.64 |
| sample 450 | 4.96 | 327.05/408.34 | 468.33 | 6.464 |
| sample 470 | 5.05 | 328.06 | 491.17 | 4.297 |
| Long Periodrazmak/Å | Crystalline Thicknessrazmak/Å | Crystallinityrazmak/% | Polydispersityrazmak/% | |
|---|---|---|---|---|
| sample 350 | 41 | 8.16 | 19.90 | 20.9 |
| sample 450 | 36.9 | 7.63 | 20.68 | 19.8 |
| sample 470 | 35.9 | 7.58 | 21.11 | 16.7 |
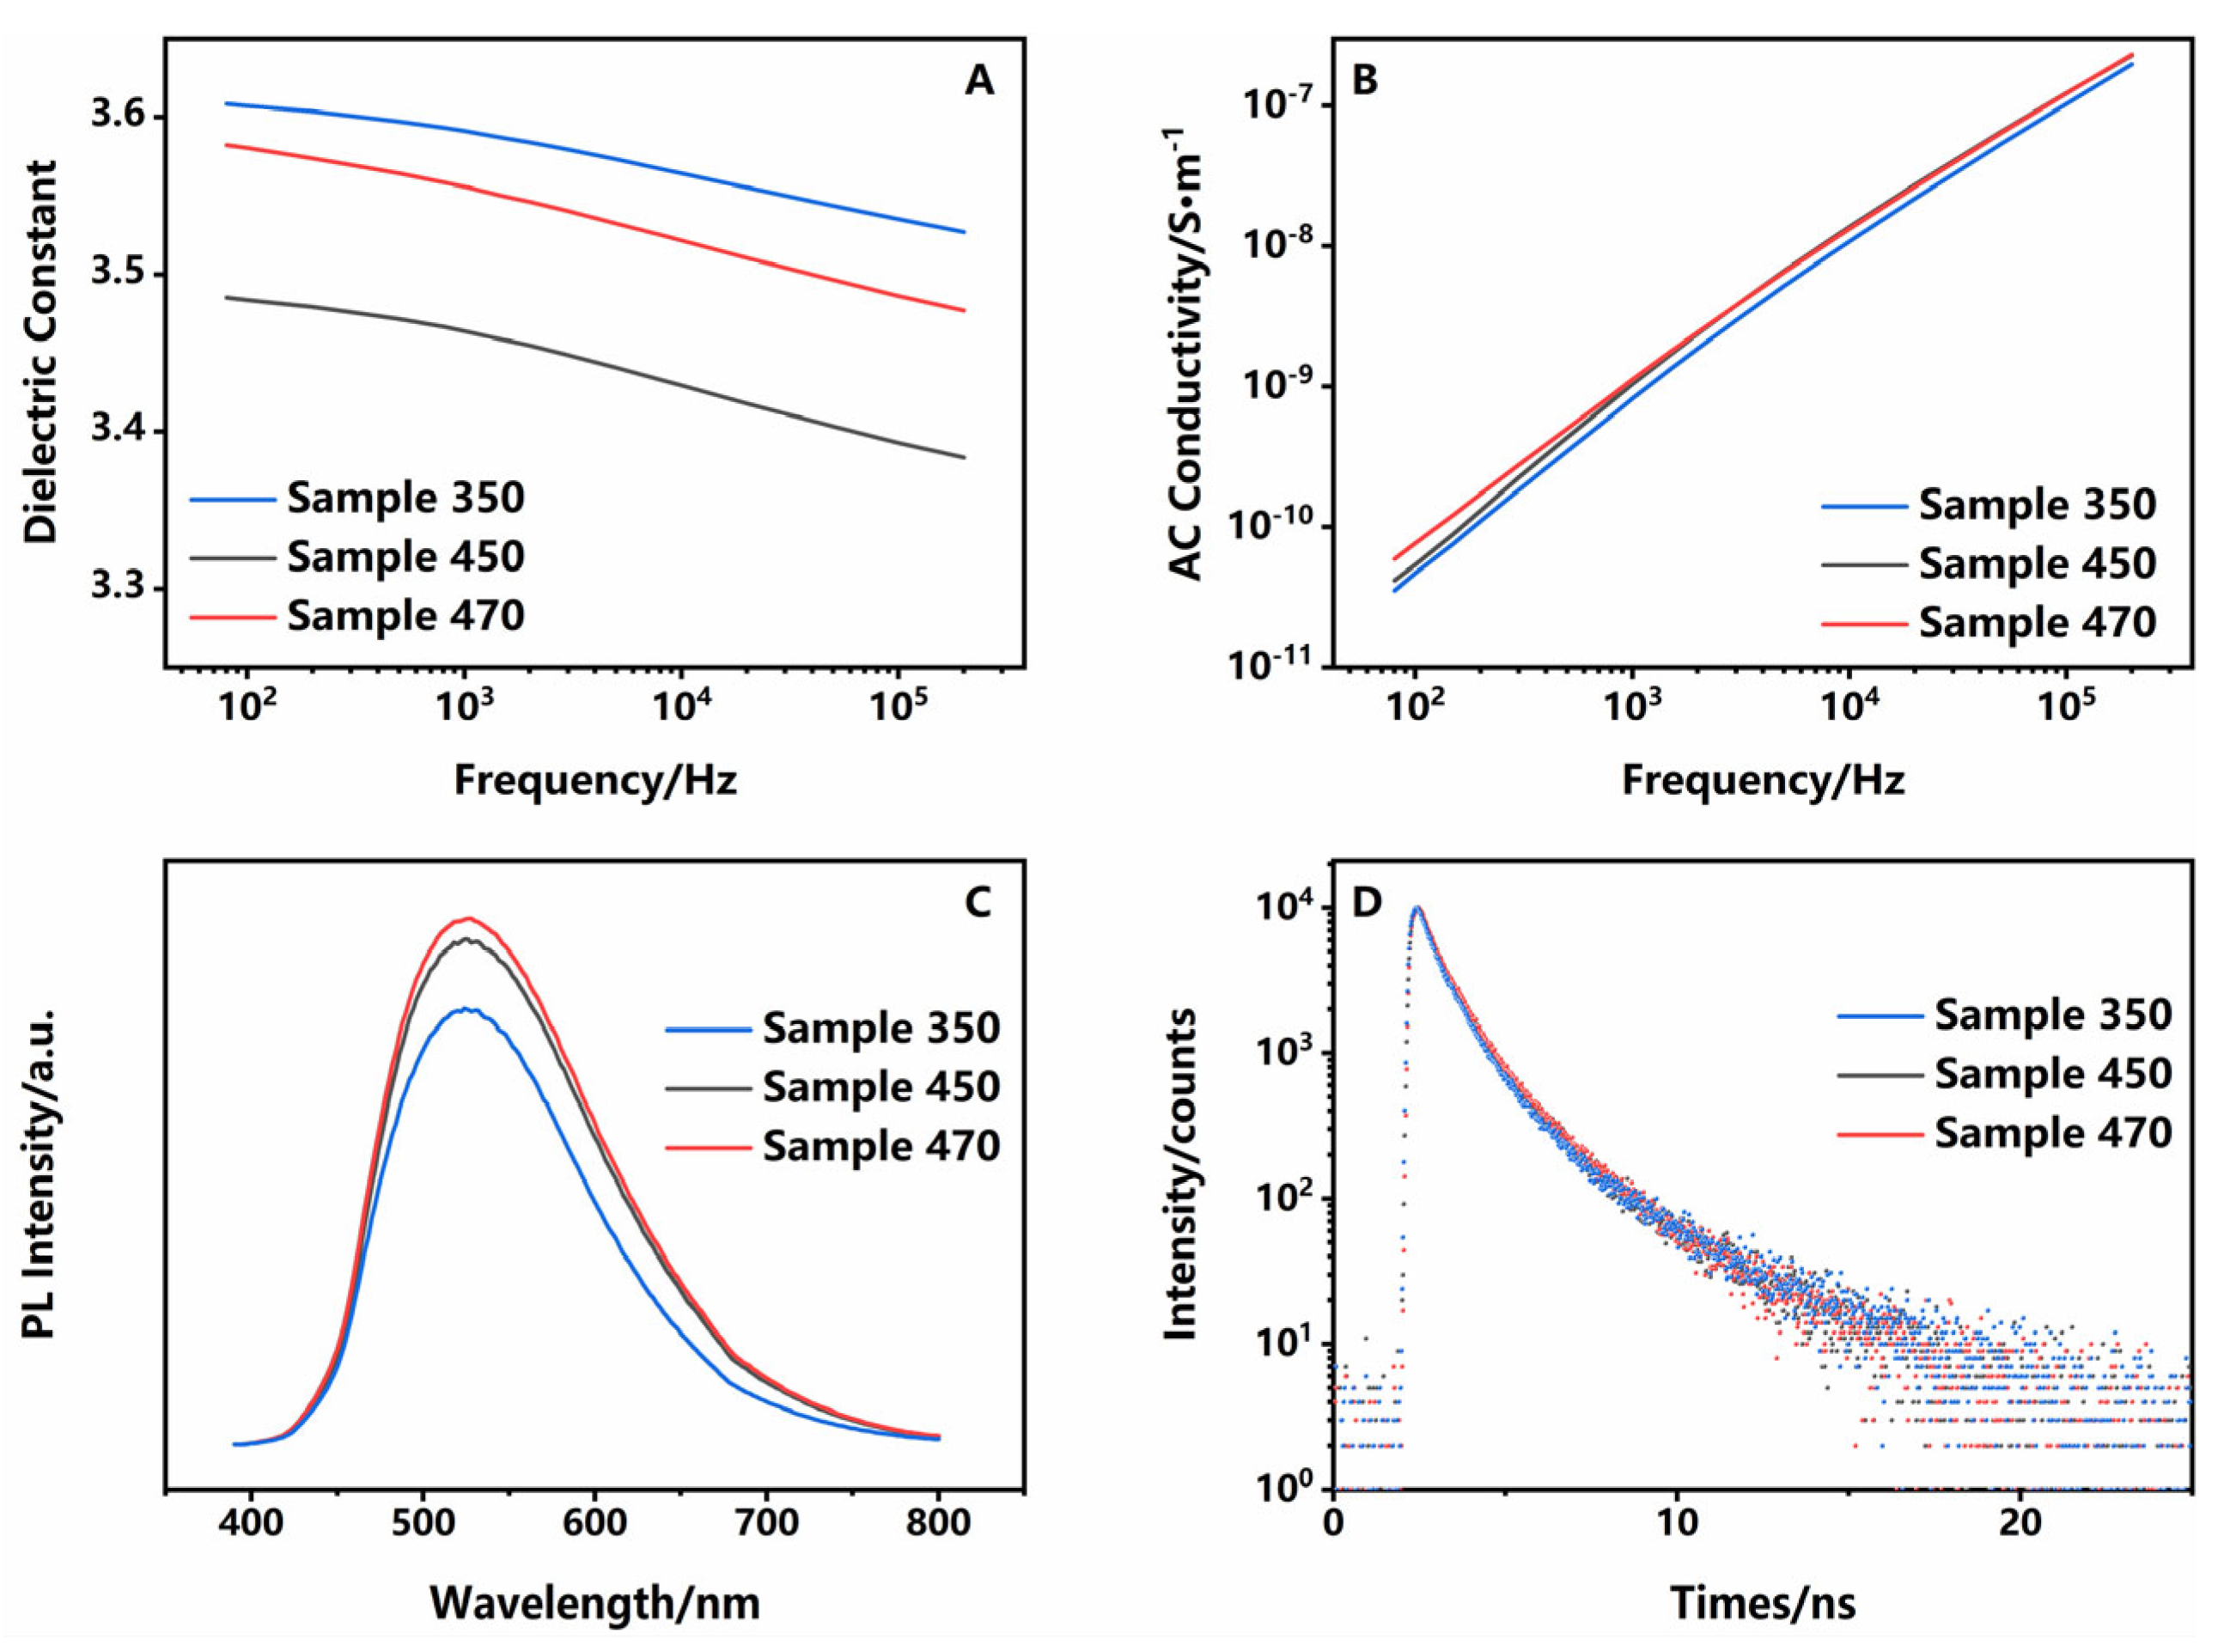
| τ1/ns | A1/Counts | τ2/ns | A2/Counts | |
|---|---|---|---|---|
| sample 350 | 0.6446 | 13,361 | 2.9807 | 1149.5 |
| sample 450 | 0.6111 | 13,290 | 2.4114 | 1786.6 |
| sample 470 | 0.6231 | 12,771 | 2.3449 | 1908.1 |
| ΔVth/V | CIE | Intensity/Nit | |
|---|---|---|---|
| sample 350 | 1.12 | 0.33, 0.48 | 0.40 |
| sample 450 | 0.78 | 0.32, 0.41 | 0.23 |
| sample 470 | 0.36 | 0.33, 0.38 | 0.15 |
Disclaimer/Publisher’s Note: The statements, opinions and data contained in all publications are solely those of the individual author(s) and contributor(s) and not of MDPI and/or the editor(s). MDPI and/or the editor(s) disclaim responsibility for any injury to people or property resulting from any ideas, methods, instructions or products referred to in the content. |
© 2024 by the authors. Licensee MDPI, Basel, Switzerland. This article is an open access article distributed under the terms and conditions of the Creative Commons Attribution (CC BY) license (https://creativecommons.org/licenses/by/4.0/).
Share and Cite
Li, Z.; Ma, D.; Li, H.; Zhao, B.; Huang, Y.; Li, Y. Unveiling the Mechanics Behind Polyimide’s Friction-Greening Phenomenon. Polymers 2024, 16, 3253. https://doi.org/10.3390/polym16233253
Li Z, Ma D, Li H, Zhao B, Huang Y, Li Y. Unveiling the Mechanics Behind Polyimide’s Friction-Greening Phenomenon. Polymers. 2024; 16(23):3253. https://doi.org/10.3390/polym16233253
Chicago/Turabian StyleLi, Zhipeng, Dawei Ma, Haowen Li, Baojie Zhao, Yinglong Huang, and Yanbo Li. 2024. "Unveiling the Mechanics Behind Polyimide’s Friction-Greening Phenomenon" Polymers 16, no. 23: 3253. https://doi.org/10.3390/polym16233253
APA StyleLi, Z., Ma, D., Li, H., Zhao, B., Huang, Y., & Li, Y. (2024). Unveiling the Mechanics Behind Polyimide’s Friction-Greening Phenomenon. Polymers, 16(23), 3253. https://doi.org/10.3390/polym16233253