3.1. The Structural Characterization of the Siloxane Polyurea Copolymer Films
Herein, the L-30D and H-130D oligomers were used to synthesize the siloxane polyurea copolymer, respectively.
Scheme 1 gives the synthetic route of the copolymers.
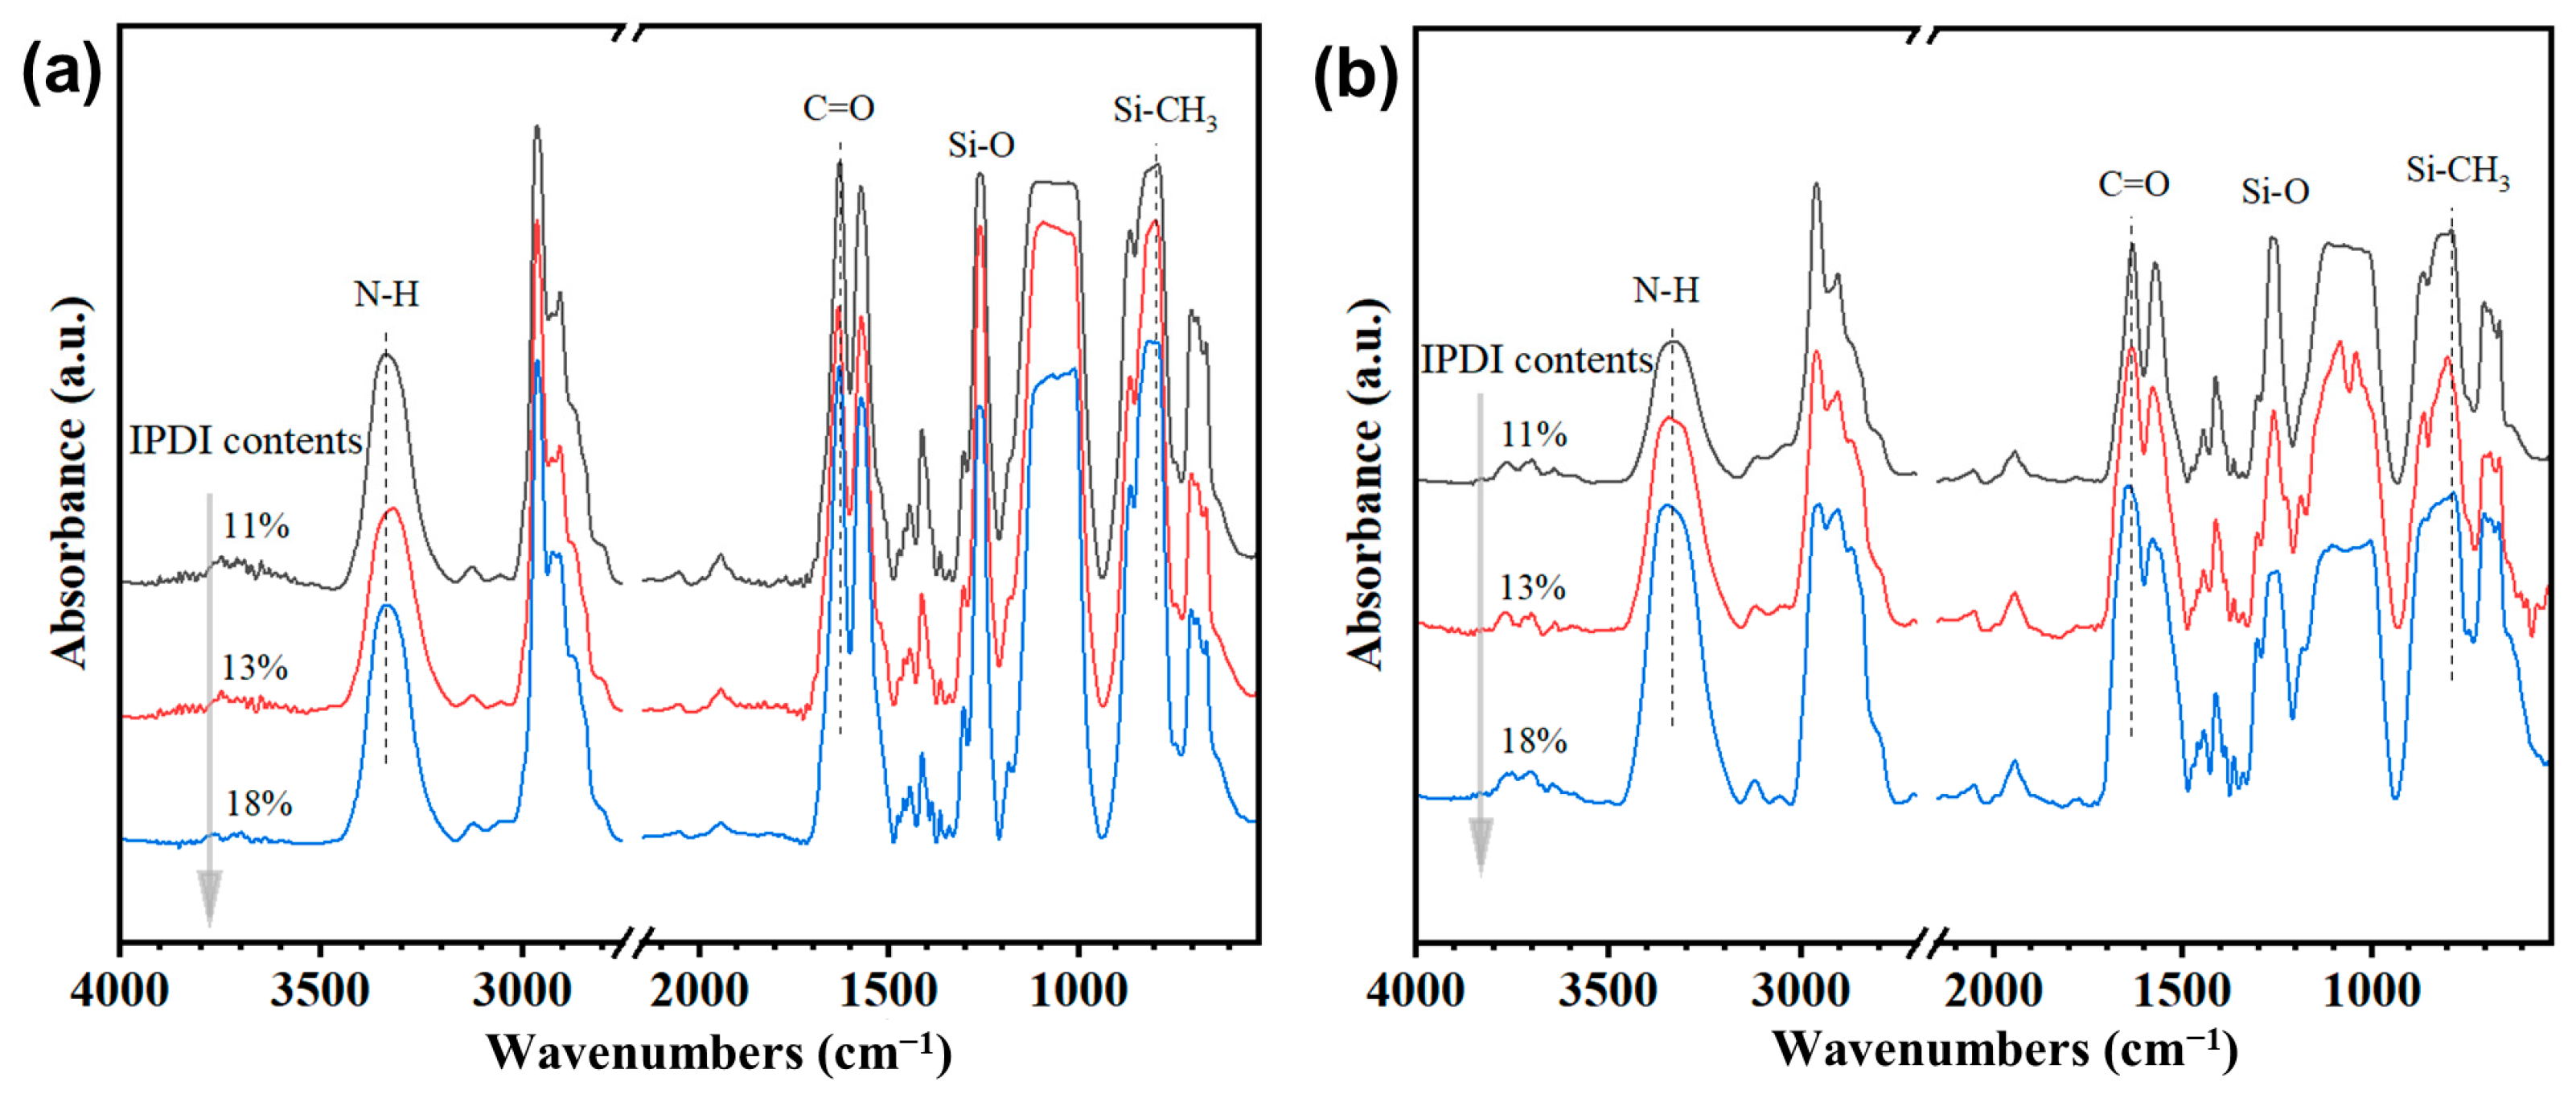
Figure 1a,b give the FTIR spectra of the copolymer films synthesized with L-30D and H-130D, respectively. The characteristic peaks of polysiloxane at 1263 cm
−1 and 793 cm
−1 are assigned to the in-plane bending vibration of the CH
3 connecting with Si and the stretching vibration of Si-O, respectively [
18], and the peaks at 2000 cm
−1 can be attributed to the group of Si-CH=CH
2, which might derive from the siloxane raw materials. For the copolymer films with the same monomer, the absorption peak intensities of the urea groups (3345 cm
−1, 1630 cm
−1, and 1570 cm
−1) rise with the increasing IPDI contents. The results show that the urea group ratio in the copolymer increases with higher IPDI concentration. In addition, the results of NMR spectra for the oligomers and copolymers are shown in
Supplementary Figure S1, which agrees with the FTIR results. By comparison, at the same IPDI content, the copolymer using H-130D displays higher relative peak intensities of the urea groups, reflecting more hard segment contents in the copolymer (
Table 1). For the copolymer films using L-30D, the
Mn is 2.1 × 10
4 g/mol (11% IPDI), 1.6 × 10
4 g/mol (13% IPDI), and 1.6 × 10
4 g/mol (18% IPDI), respectively, with a distribution index ranging from 1.4 to 1.7. At the IPDI contents of 11%, 13%, and 18%, the
Mn of the synthetic films using H-130D is 8.2 × 10
4 g/mol, 7.8 × 10
4 g/mol, and 5.2 × 10
4 g/mol, respectively, with a distribution index between 1.7 and 1.8. In comparison with the copolymers using L-30D, the
Mn of the copolymers is significantly enhanced, which might be attributed to the introduction of more APTMS extenders to ensure the same IPDI contents. We can conclude that the siloxane polyurea copolymers have been synthesized.
3.1.1. The Mechanical Properties of the Copolymer Films
The films were prepared from the synthetic copolymer products to study their mechanical performance, transmittance, and morphology.
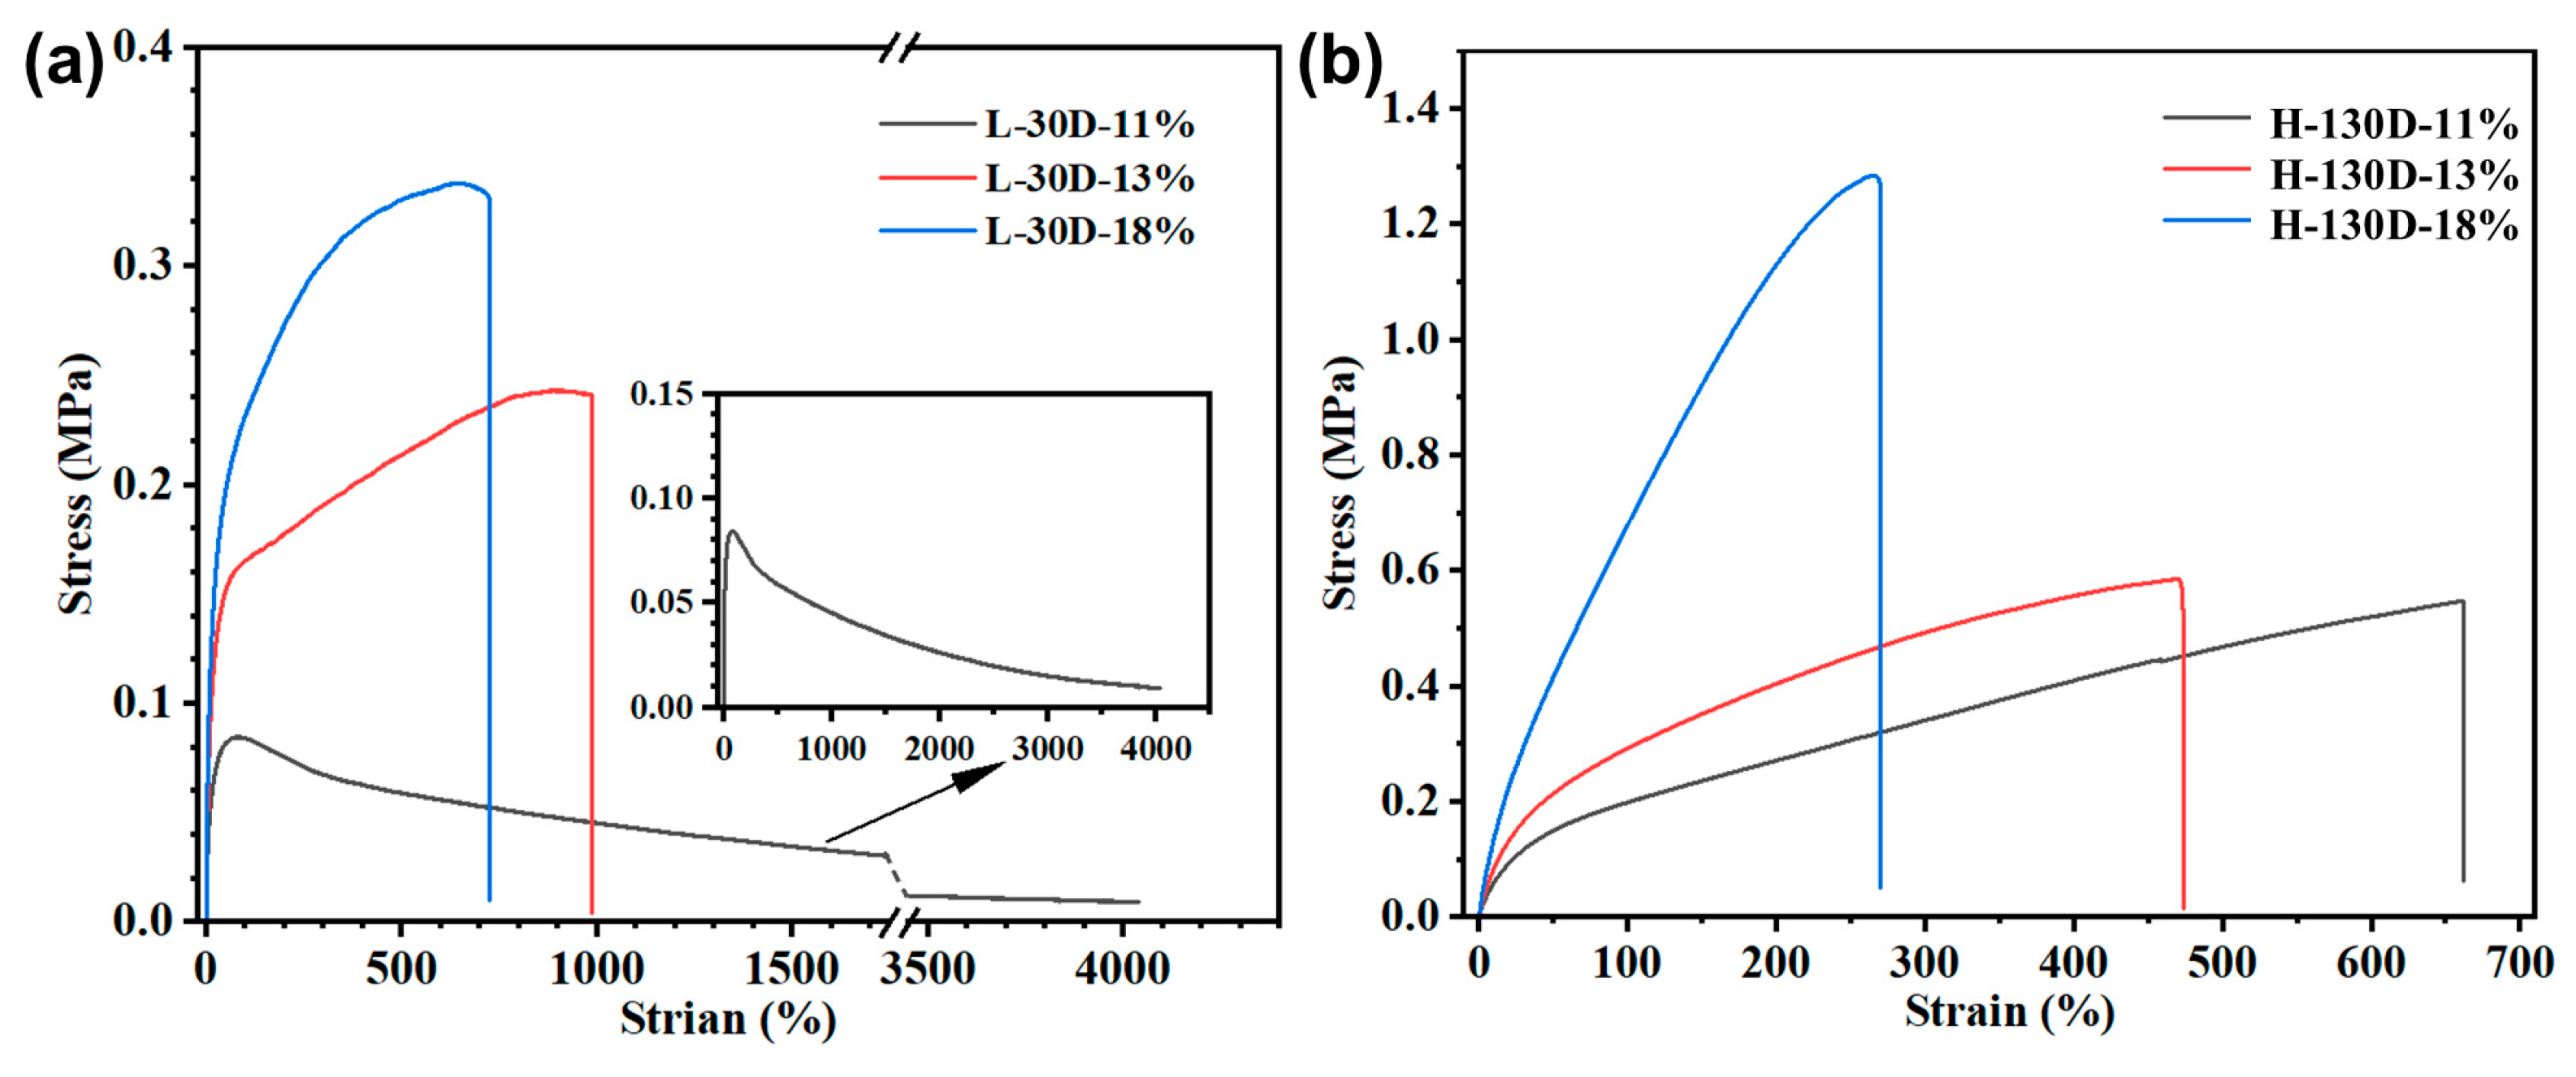
Figure 2a,b show the stress–strain curves of the films using L-30D and H-130D, respectively. When the L-30D is used as the soft segment, the films display excellent ductility with an elongation at break of more than 700%, which is higher than that of urea elastomer in the previous works [
19,
20,
21]. Notably, the films with an IPDI content of 11% exhibit an elongation at break of more than 4000%. The tensile strength of the films ranges from 0.08 MPa to 0.33 MPa. As for the films using H-130D, with the IPDI content increasing, the elongation at break of the films decreases from roughly 670% to 250%, with the tensile strength enhanced from 0.6 MPa to 1.3 MPa. Compared with the copolymers containing L-30D, at the equal IPDI contents, the films using H-130D have much higher tensile strength, which indicates that the films using H-130D might have more physical cross-linked structures.
The areas under the stress–strain curves before fracture can represent the work of the tension (
W), reflecting the energy absorption and toughness of the material [
22,
23]. For the films synthesized with L-30D, when the IPDI contents of the films are 11%, 13%, and 18%, the work of tension (
W) is 0.15 N·m, 0.20 N·m, and 0.21 N·m, respectively. The work of tension (
W) for the films using H-130D exhibits the values of 0.29 N·m, 0.16 N·m, and 0.26 N·m, respectively, when the IPDI contents of 11%, 13%, and 18%. Clearly, the H-130D-11% films exhibit the highest toughness.
The T
g of the films can be analyzed through the DMA test. The results in
Supplementary Figure S2 indicate that all samples have a rubbery plateau, followed by a rapid decline in the storage modulus with rising temperature, which agrees with the characterization of the thermoplastic elastomer. At the same IPDI content, the films using H-130D show a wider rubbery plateau, ranging from roughly −40 °C to around 70 °C (
Supplementary Figure S2), indicating their wider working temperature ranges. The films have two T
g in total, as shown in
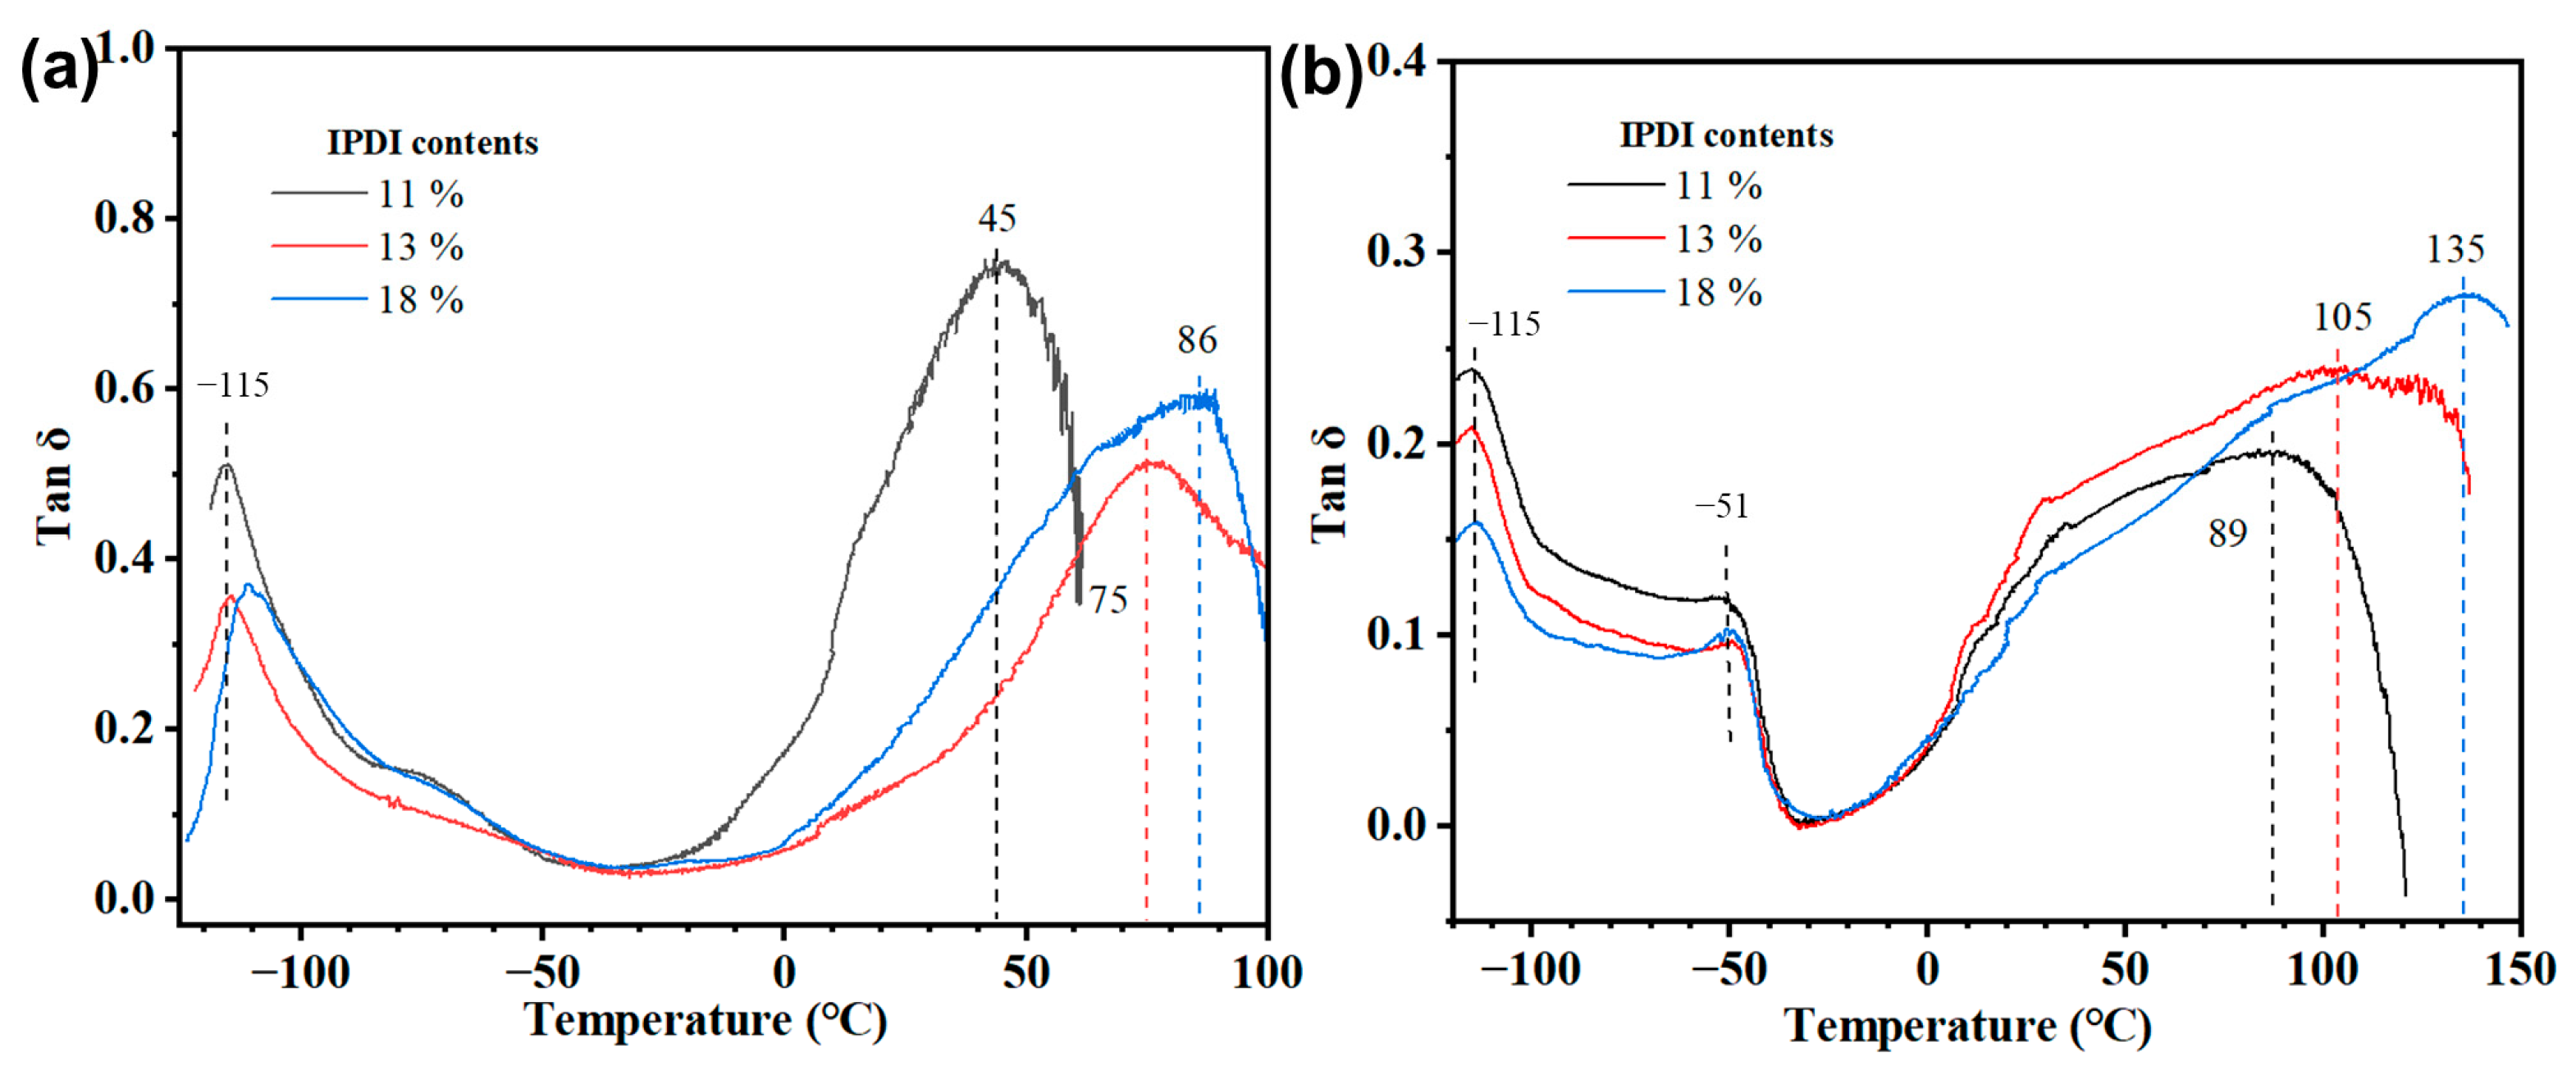
Figure 3. The T
g at low temperature is approximately −115 °C, which is related to the soft segments of polysiloxane chains [
7,
8]. Another T
g at high temperature is ascribed to the hard domains. For the films using L-30D, the results in
Figure 3a indicate that, when the IPDI content rises from 11% to 18%, the T
g of the hard domains increases from around 45 °C to 86 °C, which implies that the various IPDI contents can influence the hard domain structures. As shown in
Figure 3b, the films using H-130D also display an increasing T
g of the hard domains ranging from 89 °C to 135 °C, as the IPDI content increases; moreover, the minor peaks at roughly −51 °C are attributed to the crystallinity of the polysiloxane that has high
Mn, which is close to the reported melting temperature for the polysiloxane crystalline region [
8]. In compassion, there were no obvious peaks at around −50 °C for the copolymer using L-30D due to the poor crystallizing ability of the L-30D with low
Mn.
3.1.2. The Transparency of the Copolymer Films
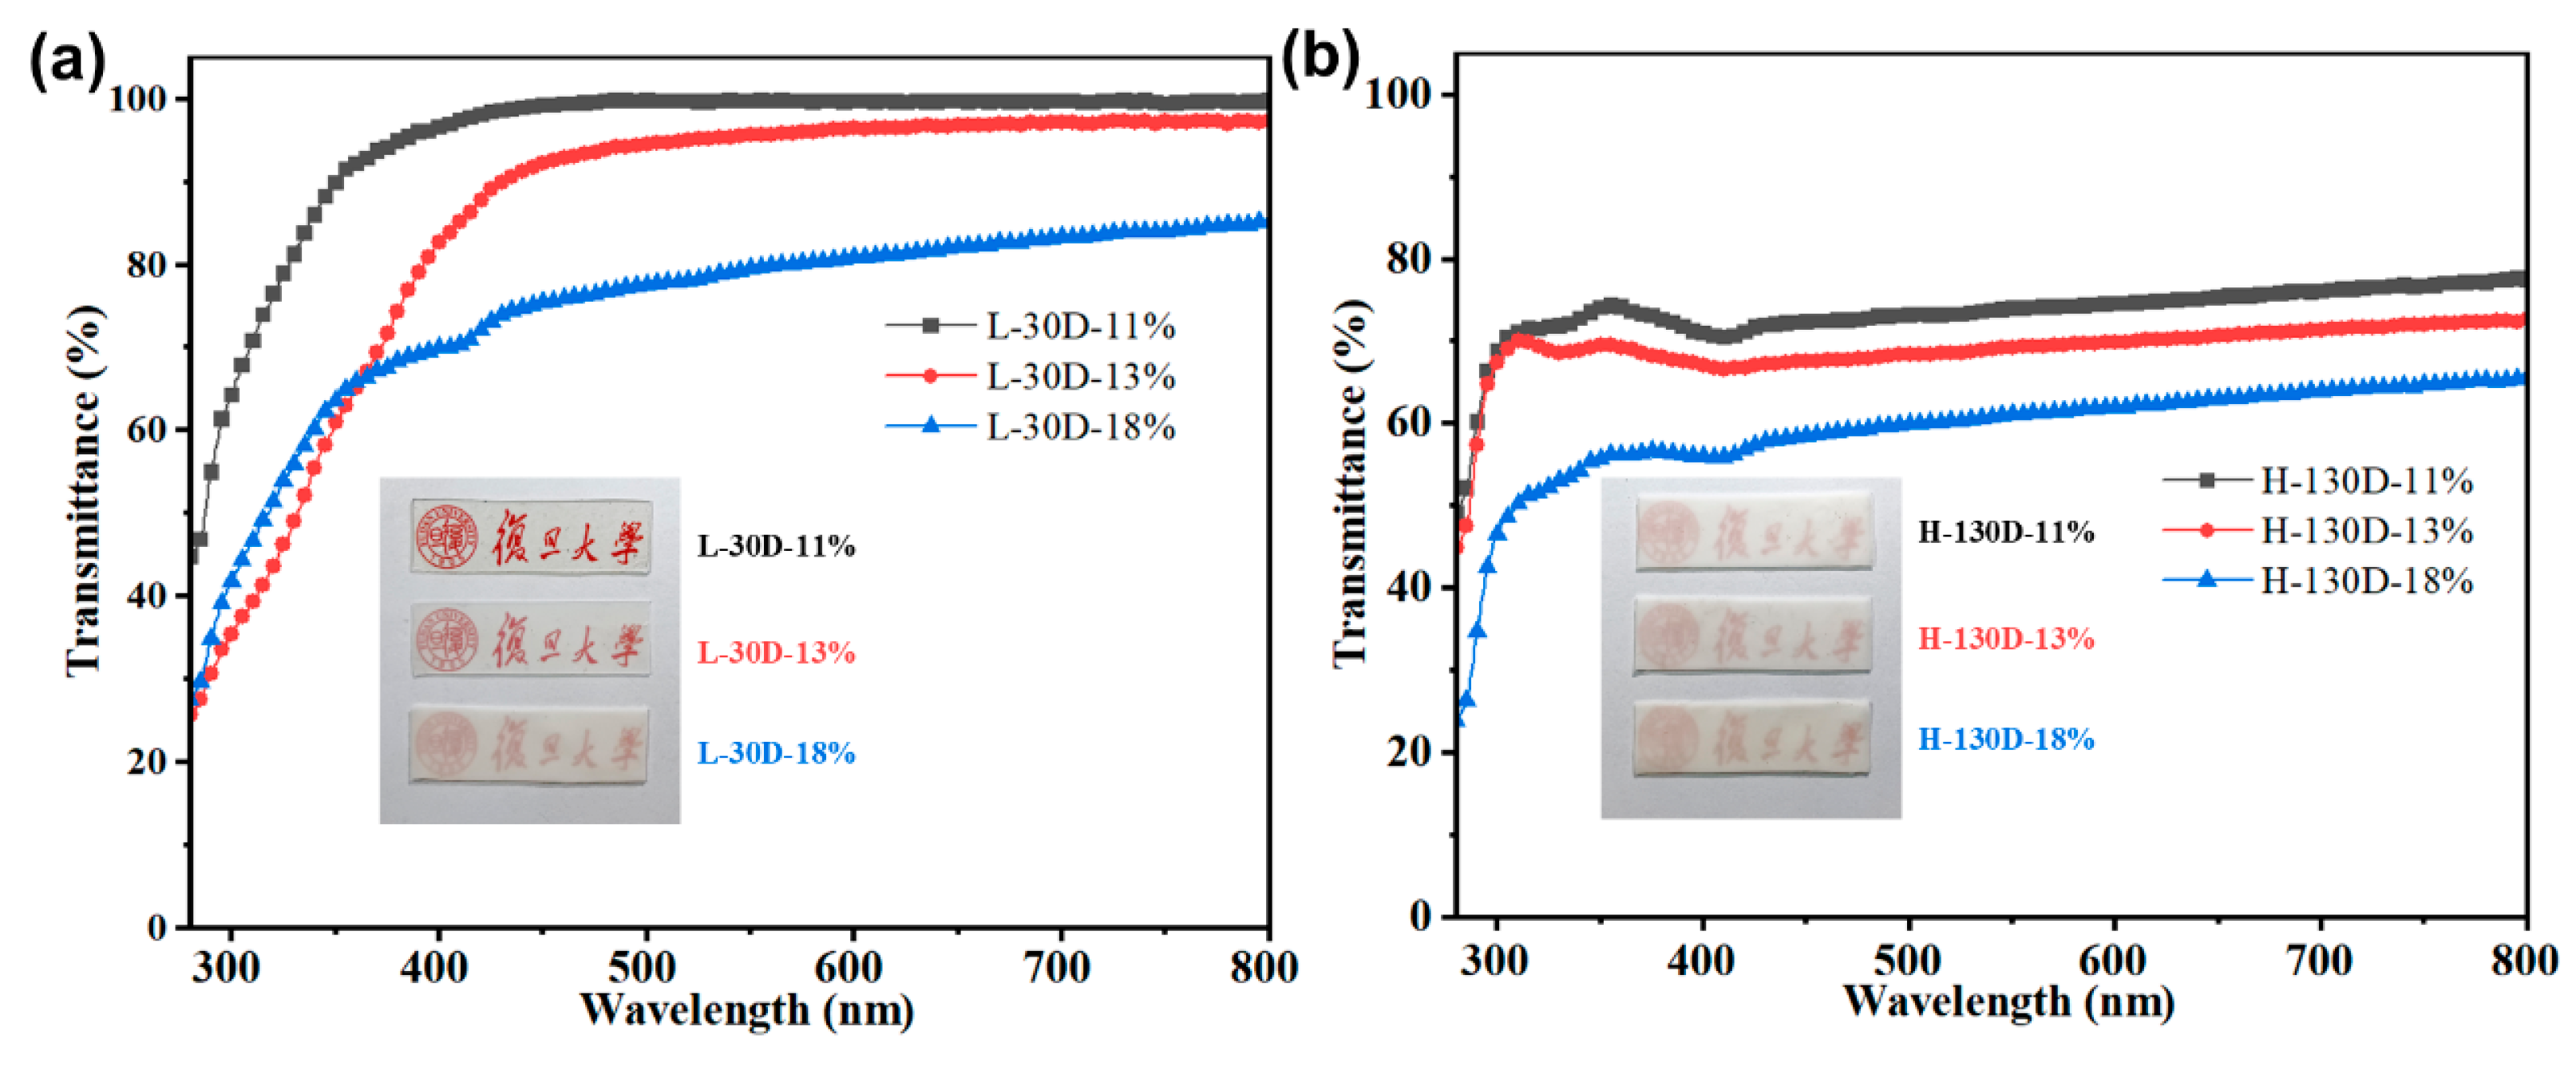
Figure 4a gives the UV-vis absorption spectra of the films synthesized with L-30D. When the IPDI contents are 11% and 13%, the films show quite high transparency at visible light, with light transmittance of roughly 99% and 96% at the wavelengths from 500 nm to 800 nm, respectively, which is similar to the transmittance of non-siloxane block polyurethane coatings described in the literature [
24,
25]. As the IPDI content increases to 18%, the films display a light transmittance ranging from 80% to 68%. As presented in
Figure 4b, the films using H-130D display the transmittance below 80%. For the L-30D films using 11% and 13% contents of IPDI, the characters on the bottom of the films can be seen clearly, which agrees with the results of the higher transmittance. It is known that the transmittance is affected by the phase separation structure of the material containing multiple compounds [
26,
27]. In the siloxane polyurea copolymer, there is a notable difference in the polarity among the soft domains of polysiloxane and the hard domains formed by hydrogen bonding. The solubility parameters for the soft and hard domains are 15.6 (J·cm
−3)
1/2 and 45.6 (J·cm
−3)
1/2, respectively, showing a phase-separated trend [
28]. Conclusively, the copolymer films exhibit decreased transmittance when the H-130D is introduced, implying that the films might have higher degree of the phase separation that leads to more light scattering or reflection.
Furthermore, the SEM has been used to study the cross-sectional topographies of the synthetic films after brittle fracture in liquid nitrogen.
Figure 5 images the cross-sectional topographies of the films using L-30D. When the IPDI content is 11%, the cross-section is flat and smooth; as the IPDI content increases to 13%, little particles appear on the cross-section. In contrast, when the IPDI content is raised to 18%, the topography changes distinctly, resulting in more obvious heterogeneous phase structures; specifically, little particles are distributed with the size from 1 μm to 2 μm. These results are consistent with the film transmittance test in
Figure 4a. The SEM images in
Figure 6 display the cross-sectional topographies of the films using H-130D. The results indicate that the films display various heterogeneous structures, characterized by multiple dispersed phases ranging scatter across the cross-sections, and the number of the dispersed phases increases with the higher IPDI content. By comparison, the thermoplastic copolymer films based on H-130D exhibit much lower transmittance and a higher degree of phase separation at the same IPDI content.
3.2. The Modeling Analysis of the High Elasticity for the Copolymer Films
The tensile recovery and cyclic tensile tests are utilized to characterize the elasticity of the copolymer films. The results in
Supplementary Figure S3 indicate that the strain can recover to roughly 60% at the greatest level for the films using L-30D, while the films containing H-130D exhibit remarkable resilience with the ability to recover to less than 10% strain. The cyclic tensile curves are presented in
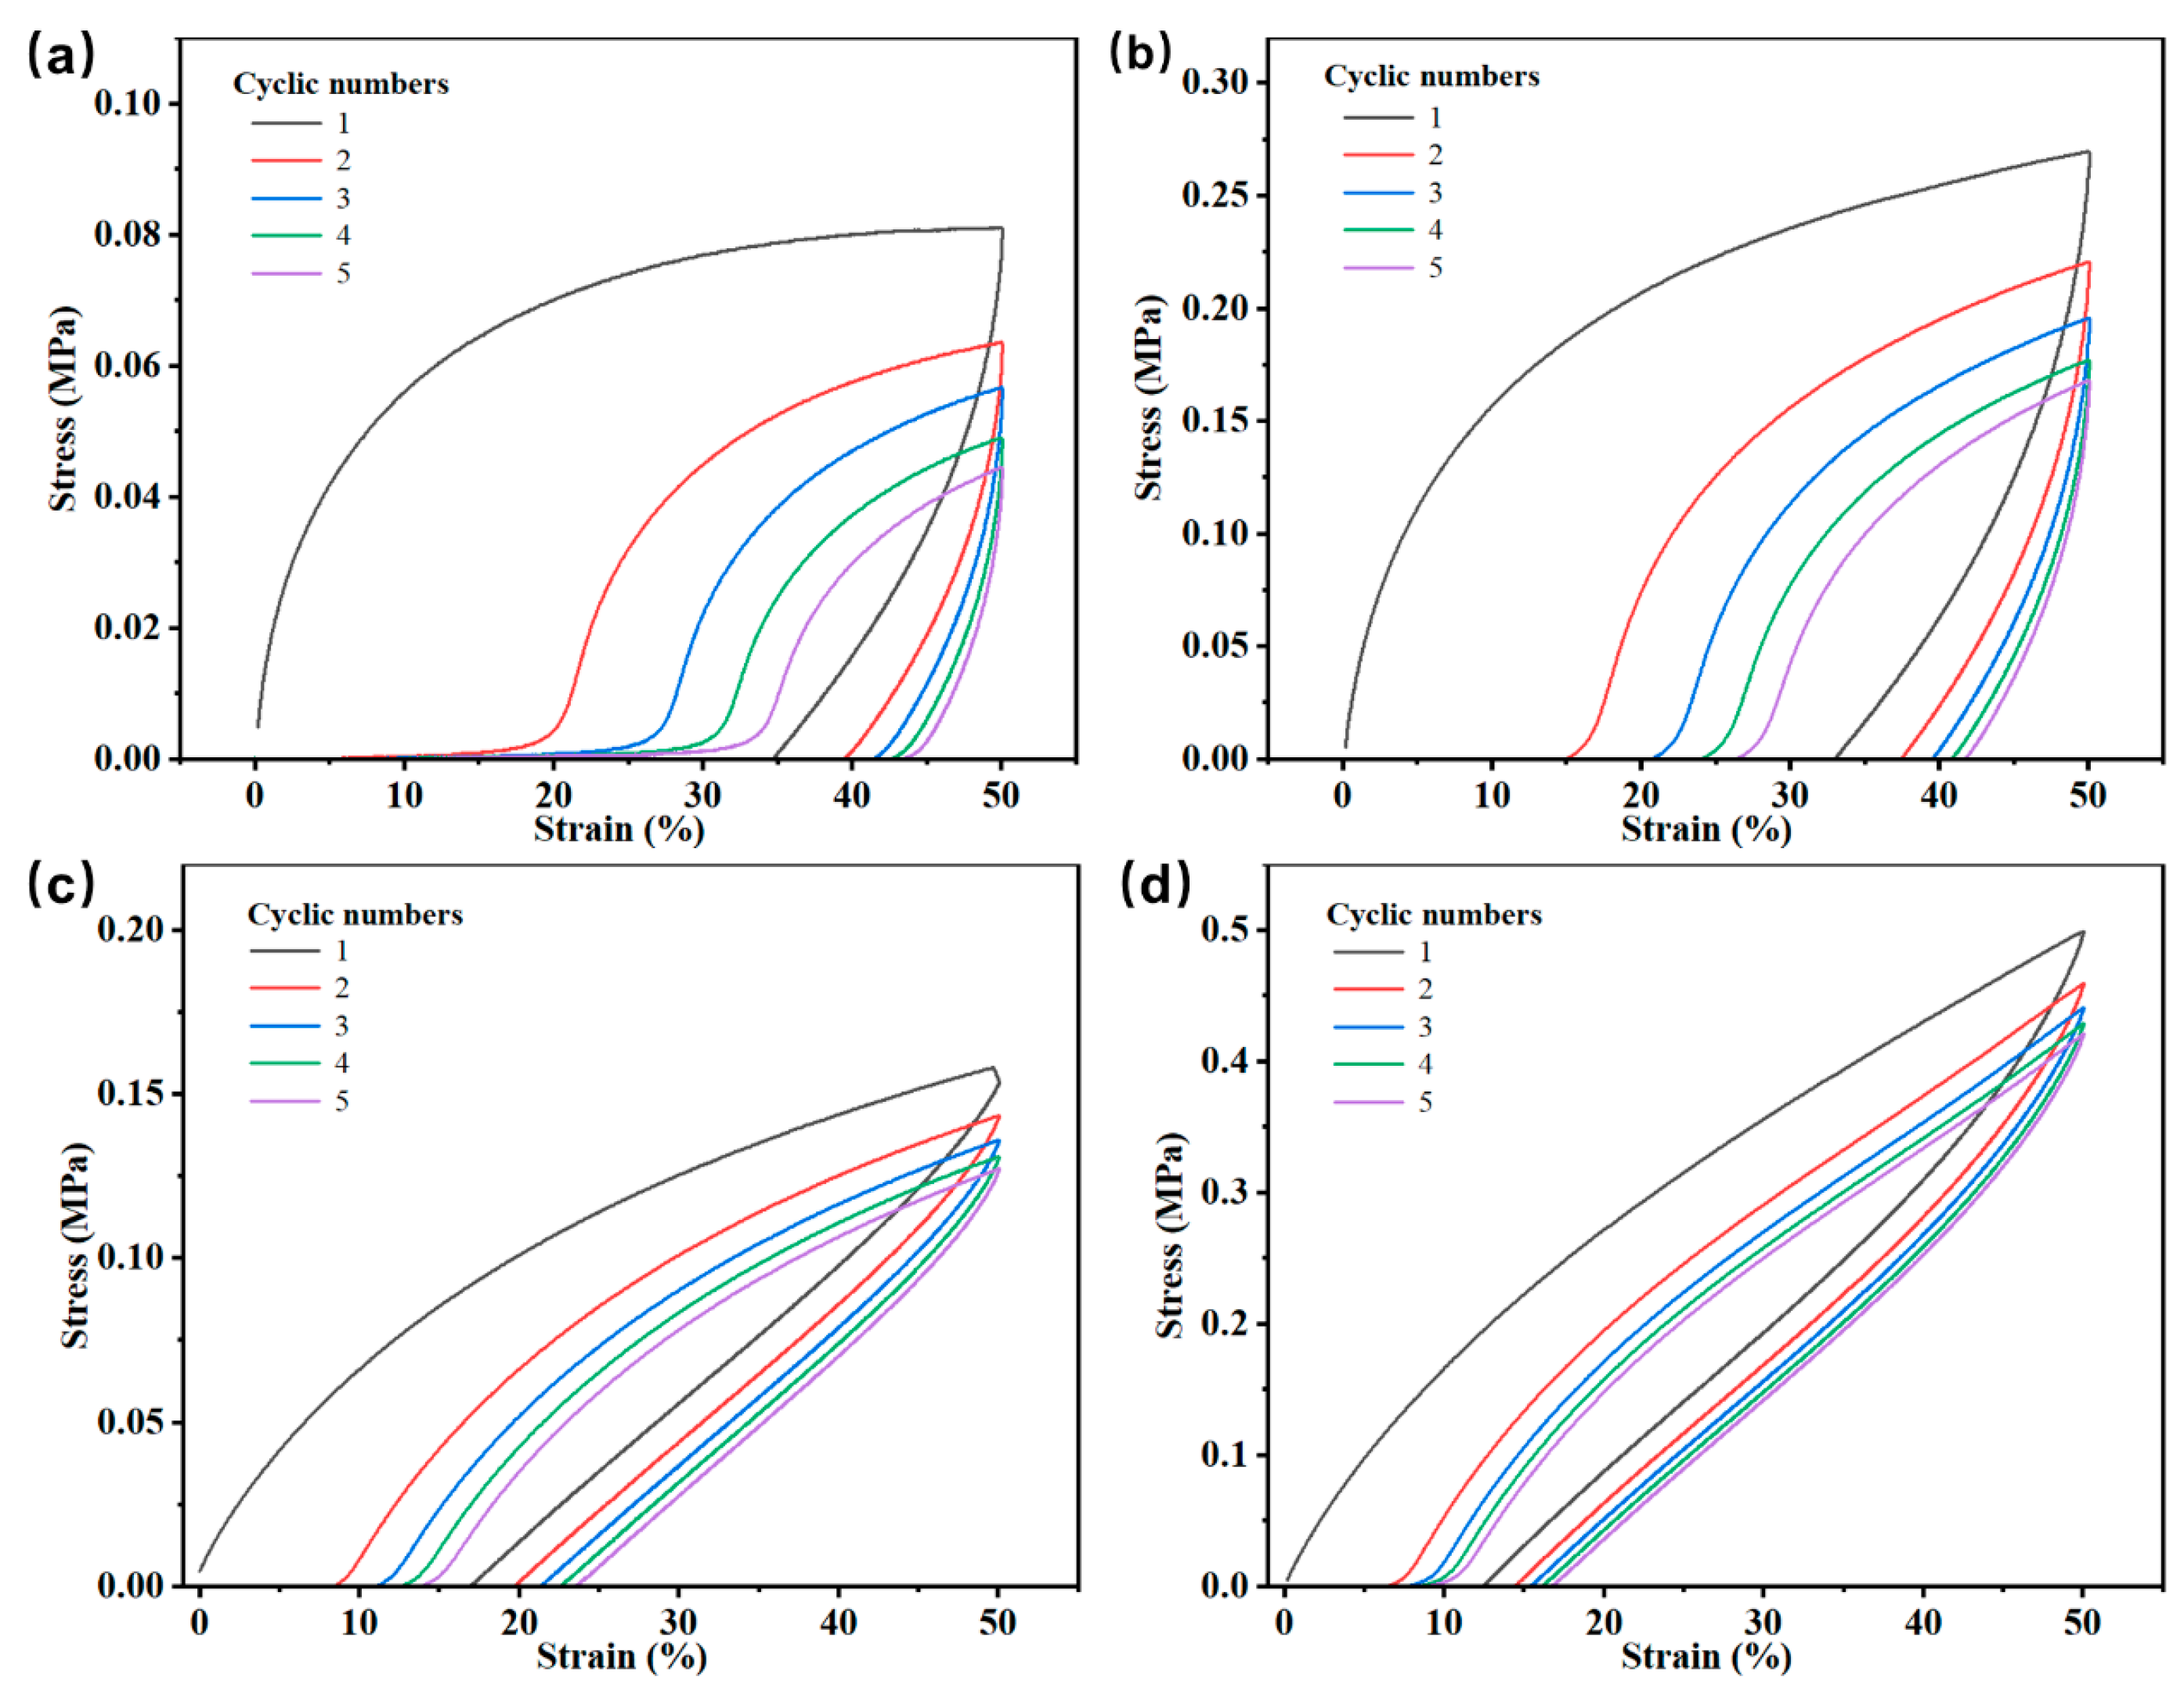
Figure 7, with the hysteresis listed in
Table 2. The hysteresis is calculated by the Formula (1) and represents the energy dissipation of the films. The results show that the films have the highest hysteresis in the first cycle, which is caused by the energy dissipation during the tensile process. The energy dissipation is primarily formed by the dissociation of the hydrogen bonding, the deformation of soft segments, and the interaction of the hard and soft segments [
29,
30]. It is seen that the film hysteresis tends to decrease with the increase of IPDI contents, indicating that the increasing IPDI contents may affect the film phase structure. Compared with the films using L-30D, the films containing H-130D display significantly lower hysteresis at the same IPDI contents, and their differences enlarge with the increasing IPDI contents. The result might be ascribed to fewer breakages of the hydrogen bonding owing to the hard domains connected by soft segments with higher
Mn [
25].
As for the copolymer films using the two polysiloxane monomers, the results mentioned before show notable distinctions in many aspects, such as the limited highest temperature (Tg), toughness (W), ductility, resilience, and the hysteresis of the cyclic tensile process. These results reflect the influence of the oligomer structures and isocyanate contents on the mechanical performance, thermal properties, and transparency of the copolymer films. Having realized that the copolymer properties are mostly affected by the hydrogen bonding interaction, we investigate the hydrogen bonding by the modeling fitting and the temperature-dependent IR spectroscopy to study the effect of the copolymer structures on the film properties.
For the ideal highly elastic materials that are isotropic in the undeformed state, the physical properties can be specified by the stored energy function W. Based on the Mooney–Rivlin model [
29,
30], the strain during the deforming process in a single direction can be described by the Formula (2).
where
λ represents the strain in the tensile direction (
λ ≠ 0), and
δ is calculated through the
W as a function of the strain invariants (
λ). C and k are both the modeling parameters; the parameter
C reflects the cross-linked degree of the material, and its value increases with the cross-linked degree.
The Formula (2) can be transformed according to the following formula:
where [
] is named the contrastive strain.
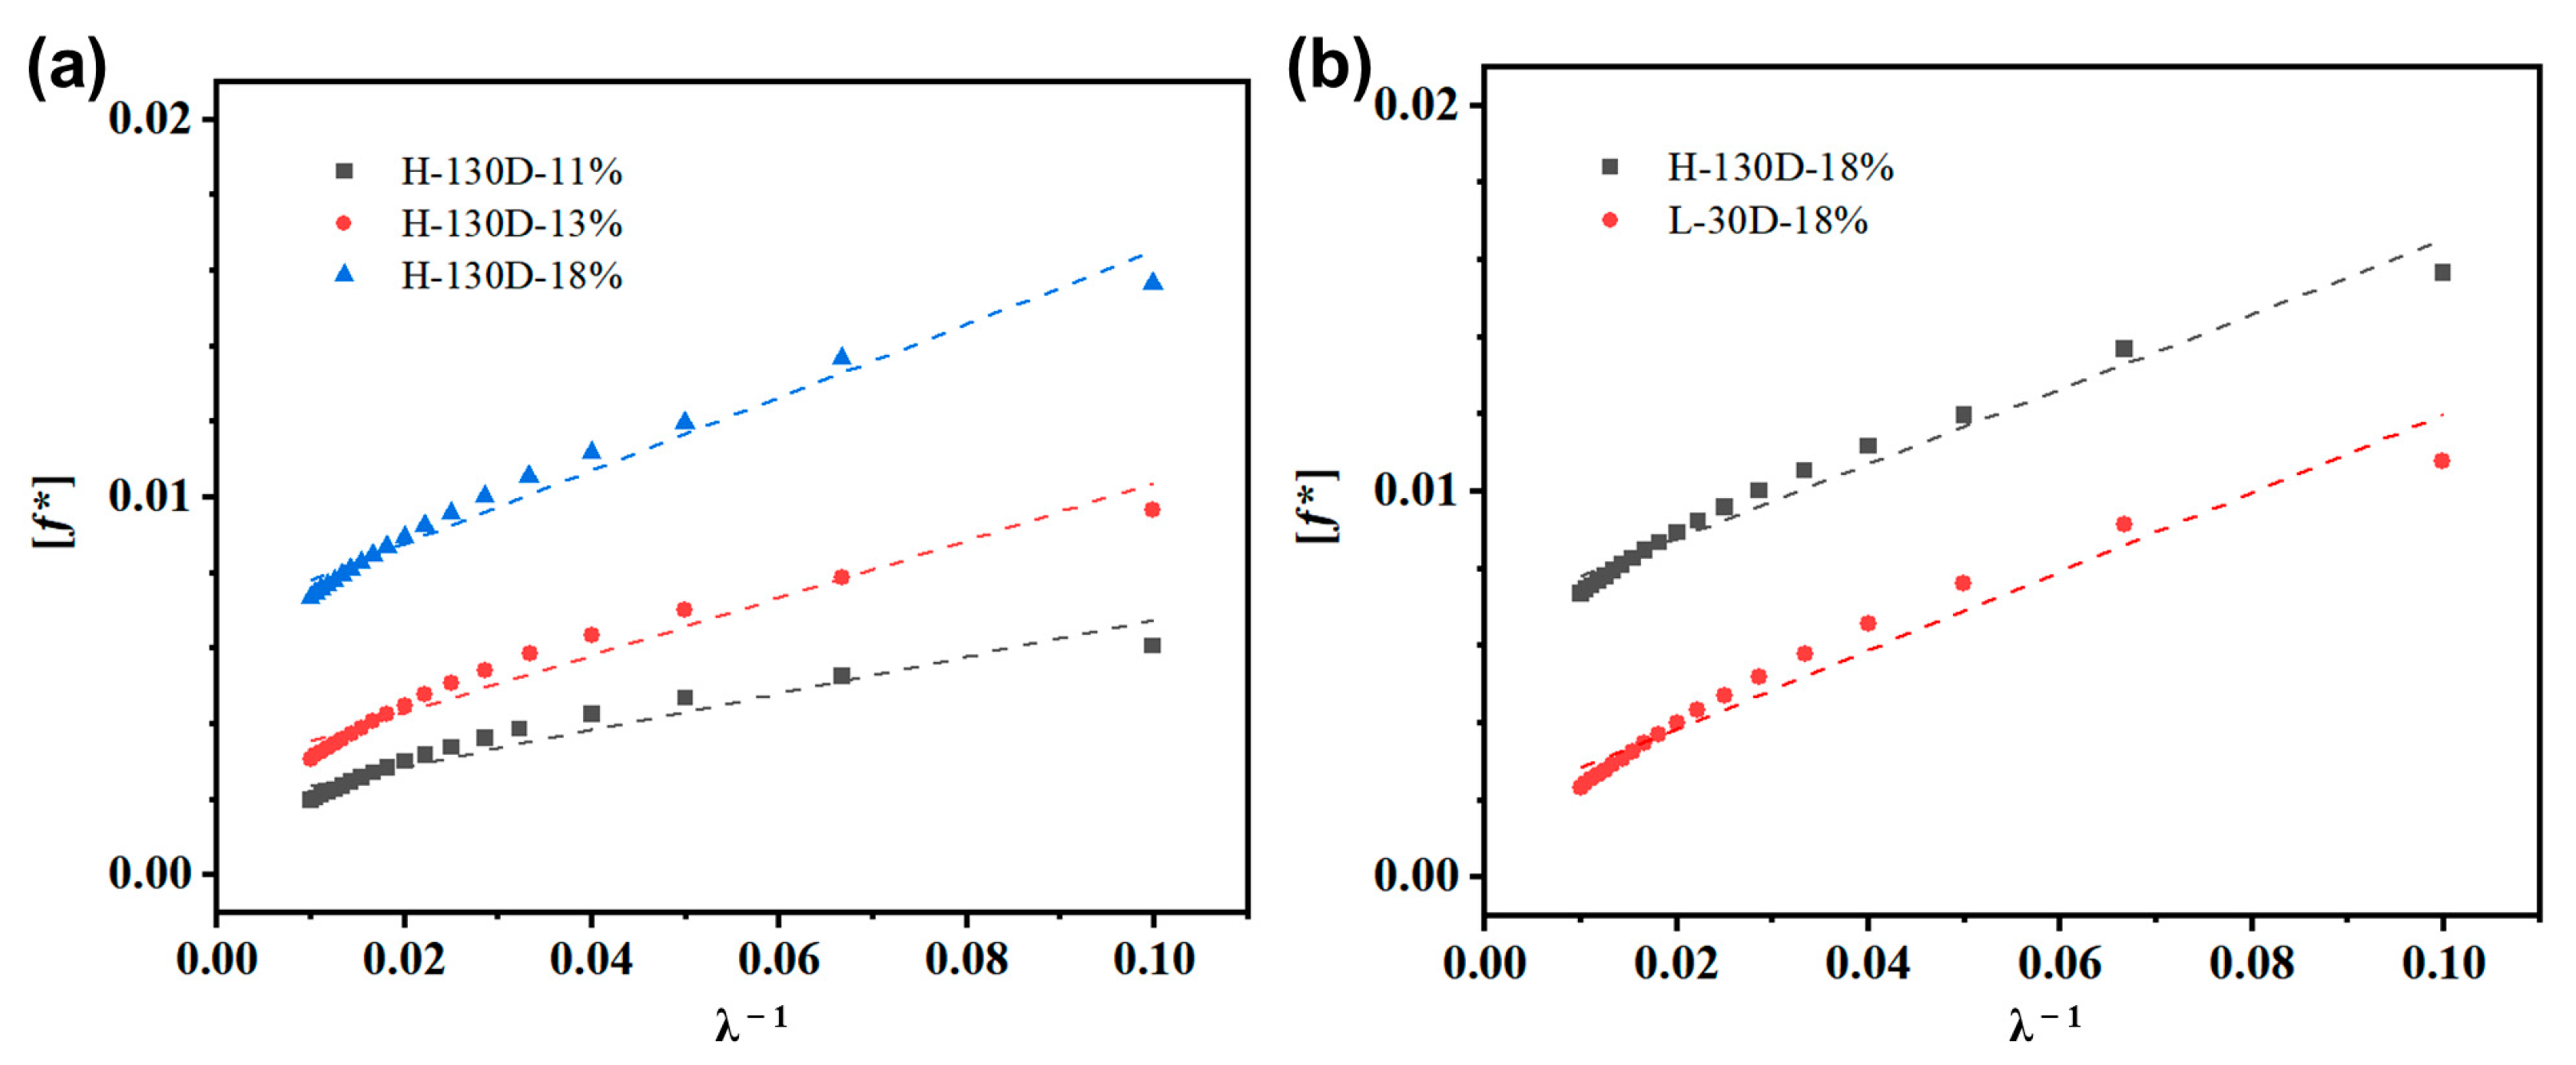
As for the copolymer films using H-130D, based on the tensile strain–stress data within the strain range from 10% to 100%, the contrastive strain [
] is calculated firstly, followed by obtaining the function curves of [
] and λ
−1 with the [
] and λ
−1 as Y-axis and X-axis, respectively, as shown in
Figure 8. It is seen that the [
] and λ
−1 approximately conform to the linear relation, which indicates that the Mooney–Rivlin model can describe the elasticity of the siloxane polyurea copolymer. Furthermore, the linear fitting is conducted according to the Formula (3), with the calculated model parameters of
C,
k, and R
2 listed in
Table 3. The R
2 of all the samples is higher than 0.92, certifying the reliability of the fitting results.
The parameter 2C is the Y-intercept for the fitted lines of the [
] and
λ−1. The results in
Figure 8a indicate that the model parameter C is enhanced with the increase of IPDI contents. Based on the model, the value of C is positively related to the elastomer cross-linked degree, which indicates that the synthetic polyurea copolymer films display a higher cross-linked degree as the IPDI content increases. In the TPU materials, the physical crosslinking is mostly composed of the interaction of hydrogen bonding. Therefore, the changing trend of the parameter C indicates that the hydrogen bonding interaction is improved with the IPDI content increasing.
Moreover, at the same experimental conditions with the IPDI contents of 18%, the tensile data for the films using two oligomers separately are also fitted and calculated, with the results shown in
Figure 8 and
Table 3. At the same IPDI content, when using the oligomer of low
Mn (L-30D), the synthetic film displays a smaller parameter C, suggesting that the film displays fewer crosslinking due to the weaker hydrogen bonding interaction.
3.3. Analyzing the Hydrogen Bonding of the Hard Domains by Using Temperature-Dependent IR Spectroscopy
In the polyurea materials, the soft segments of the copolymer are typically composed of diamine oligomers, and the hard segments are formed by the chains synthesized by the isocyanate and extender. Due to the hydrogen bonding, the hard segments tend to aggregate as hard domains, resulting in the microphase separation structure. The FTIR spectra are an efficient tool for analyzing the hydrogen bonding interactions. For example, the formation of hydrogen bonding may cause a shift in the carbonyl peaks towards lower wavenumbers. According to the literature results [
27,
31], the polyurea copolymer contains three carbonyl states: free (~1670 cm
−1), disordered (~1645 cm
−1), and ordered (~1620 cm
−1). The free carbonyl is without the hydrogen bonding, while the disordered and ordered carbonyls are formed by the hydrogen bonding of single and bidentate ligands, respectively.
The peaks in the IR spectra exhibit different wavenumbers for the carbonyl with or without the hydrogen bonding. Therefore, as the samples are heated, the weakening of hydrogen bonding can result in shifts in the carbonyl peak [
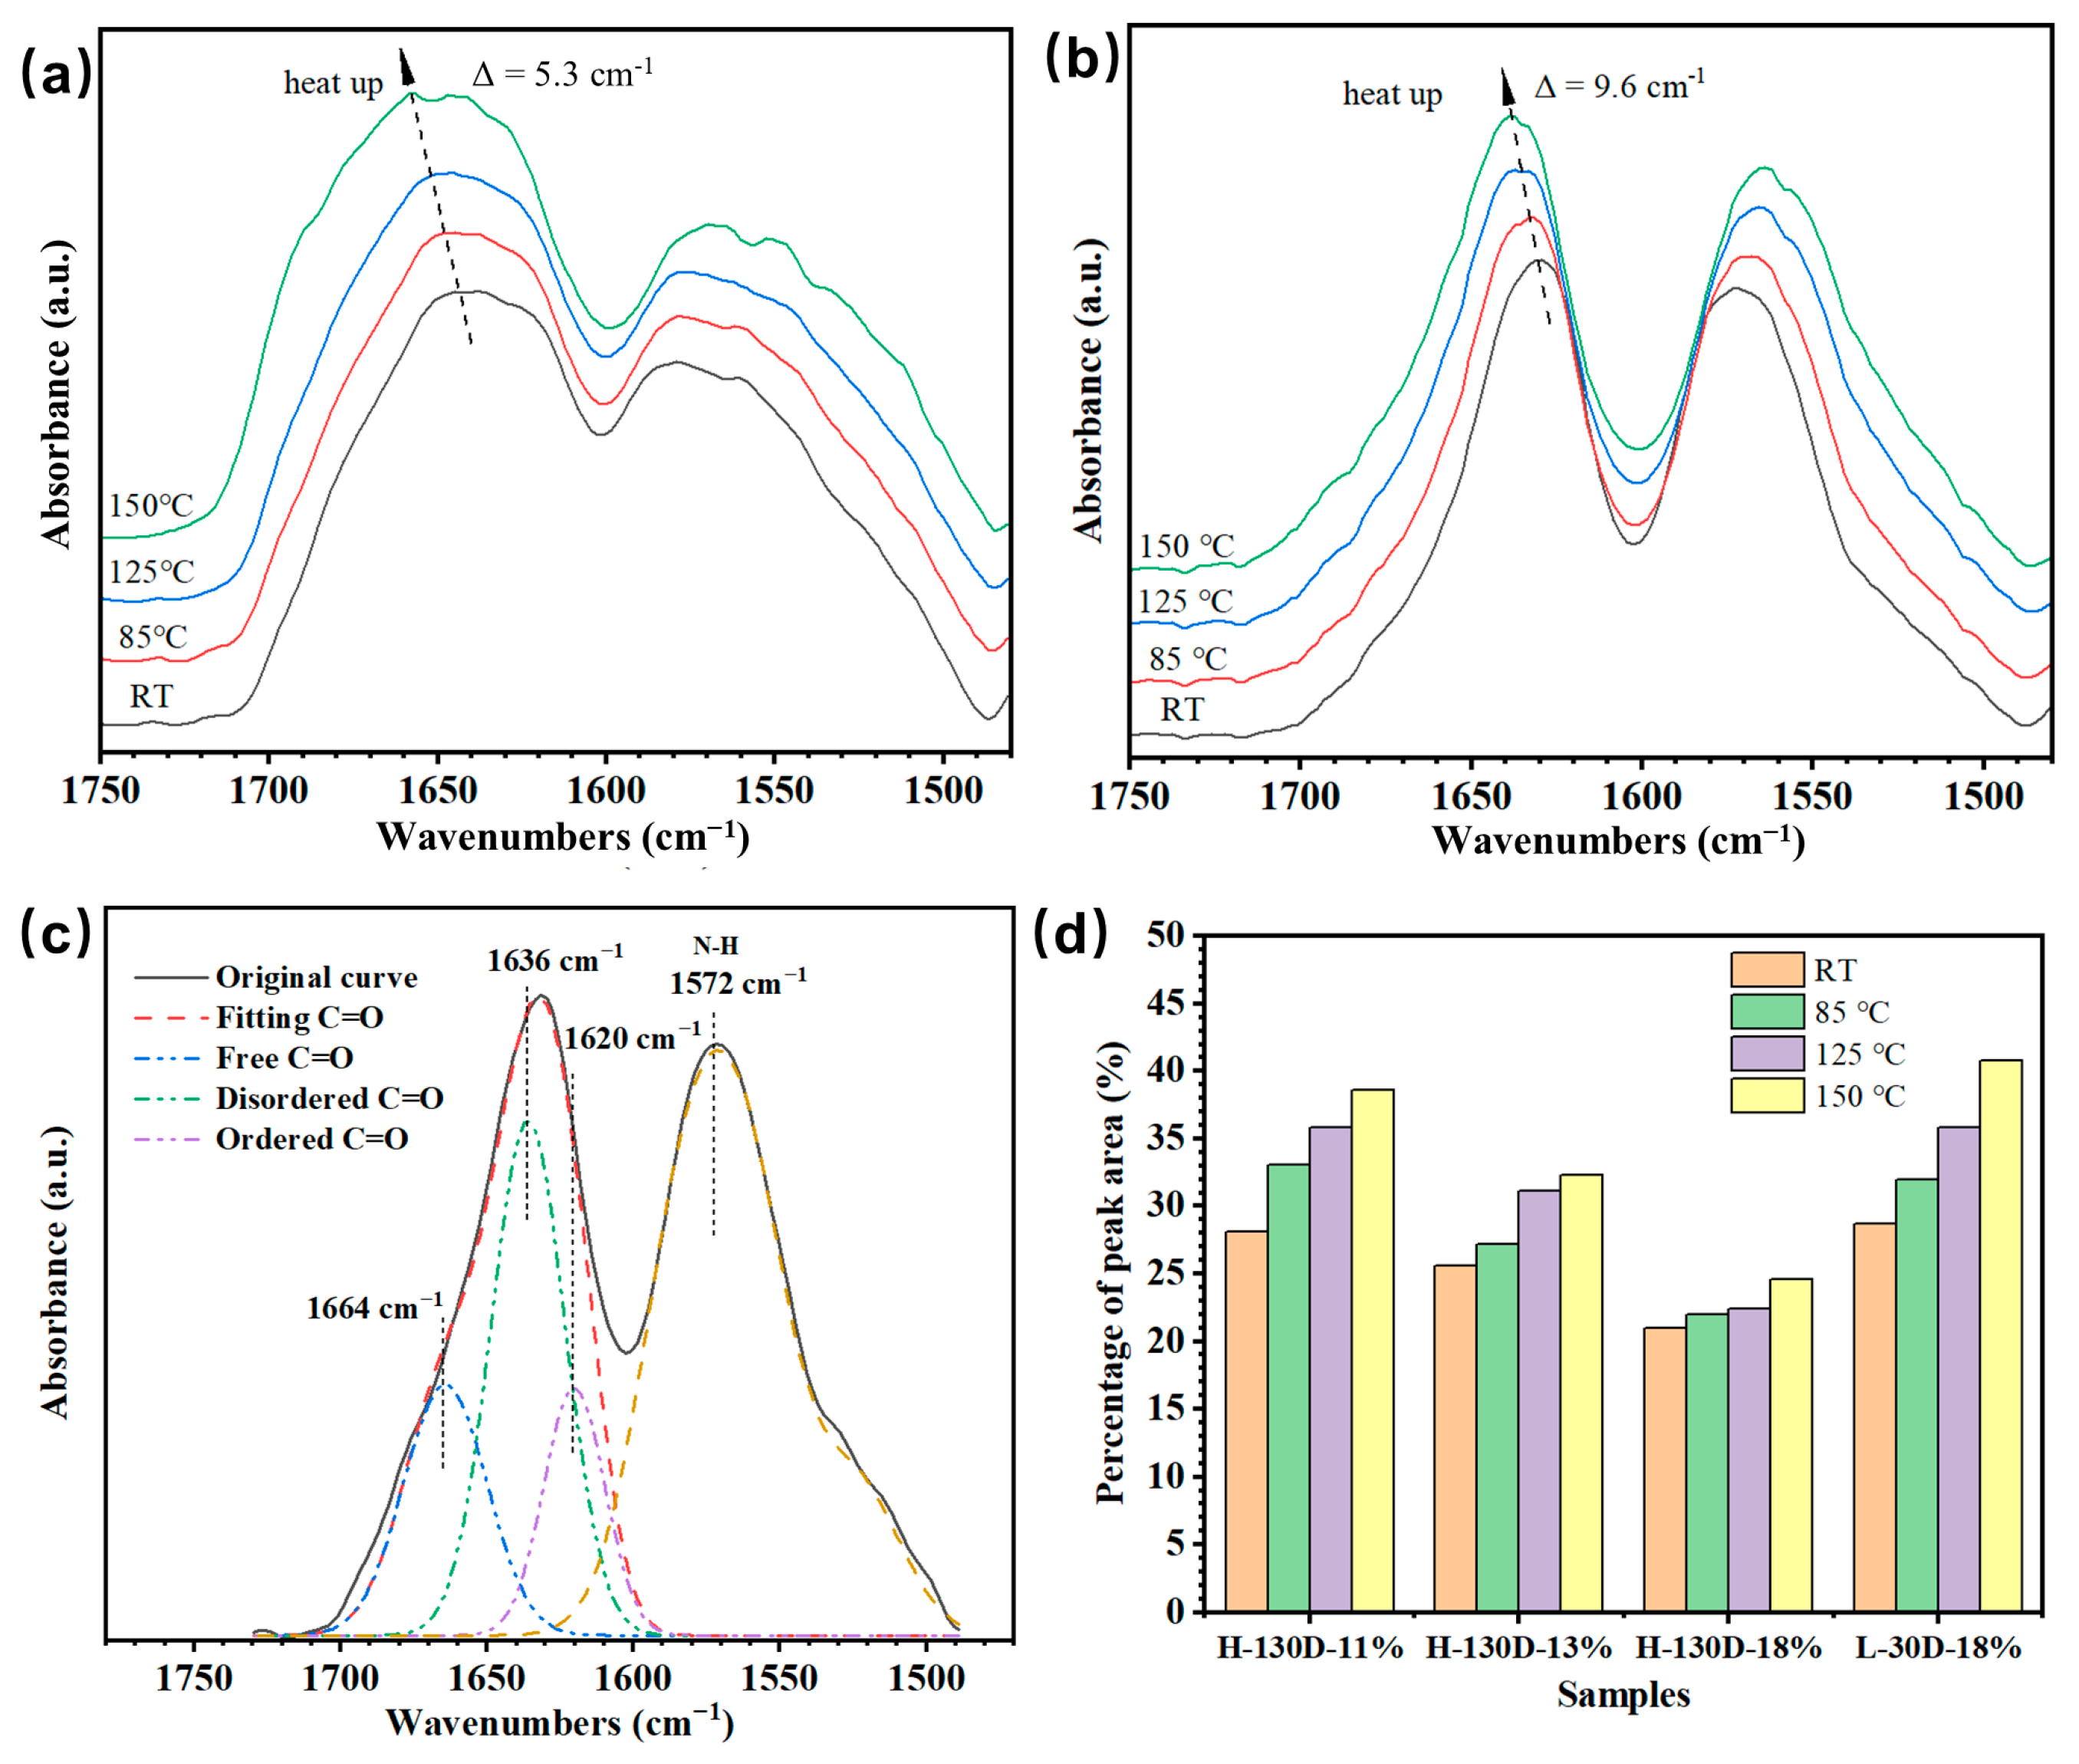
32]. Based on this theory, when the films were heated from room temperature to 150 °C, the IR spectra were tested at various temperatures, with the change in carbonyl peaks presented in
Figure 9 and
Supplementary Figure S4. The carbonyl peaks in all copolymer samples exhibit a shift towards higher wavenumbers. The results suggest that the hydrogen bonding is dissipated upon heating, leading to an increasing amount of the free carbonyls.
Considering that the carbonyl peaks associated with three states are detected at various wavenumbers, the carbonyl peaks can be peak fitted, as shown in
Figure 9c. These results reveal that the free carbonyl peaks in all samples rise in percentage to various extents during heating. Notably, at the same temperature, the free carbonyl contents decline as the IPDI contents increase, certifying that the carbonyl with hydrogen bonding is enhanced in percentage. Furthermore, with the same IPDI amount (18%), the temperature-dependent IR spectra were detected for the samples using different oligomers. For the copolymer containing H-130D, the free carbonyl percentage at the same temperature is much lower than that of the copolymer using L-30D. It implies that the copolymers containing H-130D have stronger hydrogen bonding interaction.
The experimental evidence has exhibited the various performances of the films using L-30D and H-130D, which are correlated to the hydrogen bonding strength of the hard domains. The stronger hydrogen bonding may produce more separated hard domains, implying that the films using H-130D display more structures of heterogeneous phase (
Figure 5), which can explain the relatively low visible-light transmittance of the films (seen in
Figure 4b). As reported, the microphase separation of hard segments generally forms the physical crosslinking as the fixed phase in the TPU materials [
1,
2]. Obviously, the films containing L-30D display less cross-linking owing to the weaker interaction of the hydrogen bonding, which results in lower tensile strength and T
g, as well as better ductility with the elongation at break of more than 700%. Meanwhile, compared with the films containing H-130D, the films using L-30D show the visible stress yield within 100% strain (seen in
Figure 2a), which may be attributed to the unstable hard domains due to the relatively few hydrogen bonding. Moreover, the more separated hard domains can contribute to the better toughness of the films with H-130D. Additionally, the toughness of the TPU is also correlated to the entanglement of polymer chains.
The deformation of the hard domains may affect the elastic recovery rate and degree of the films. Meanwhile, heating the films can disrupt the hard domains by dissipating the hydrogen bonding. To study the recovery ability of the hydrogen bonding, the temperature-dependent IR spectra are utilized to analyze the changing rule of carbonyl peaks during cooling. The variation of carbonyl peaks is closely associated with the relaxation ability of the hard segments.
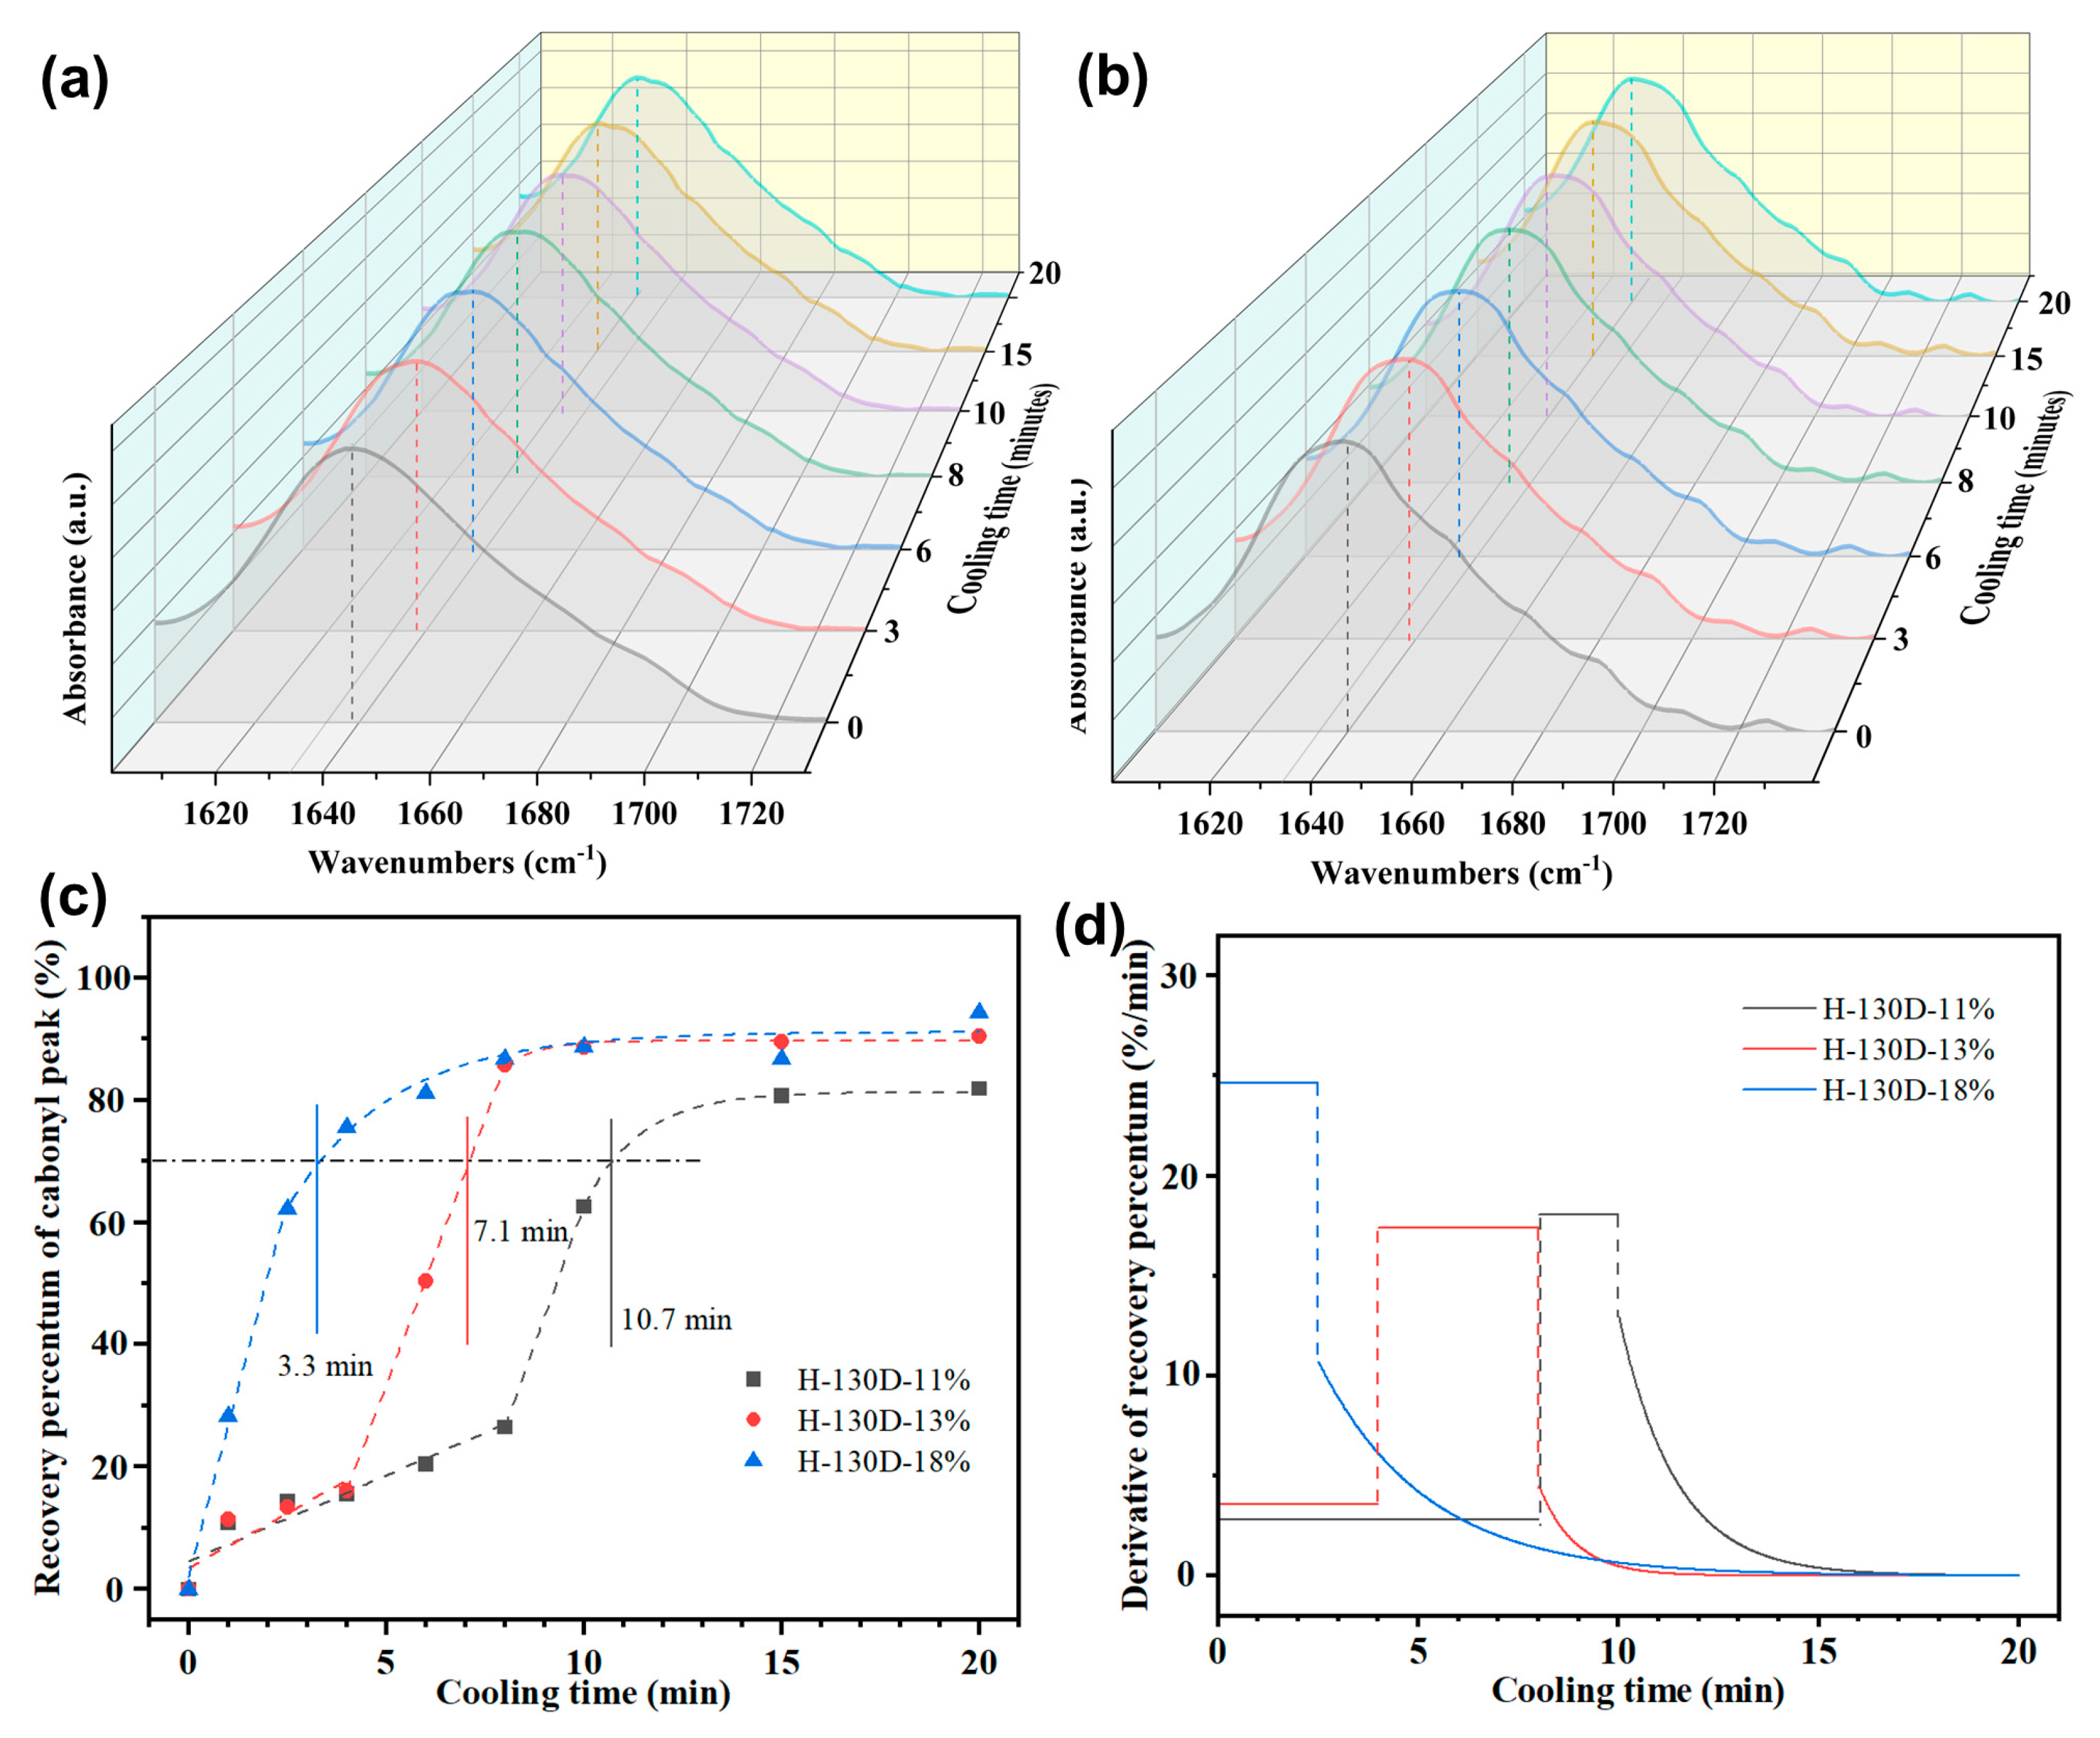
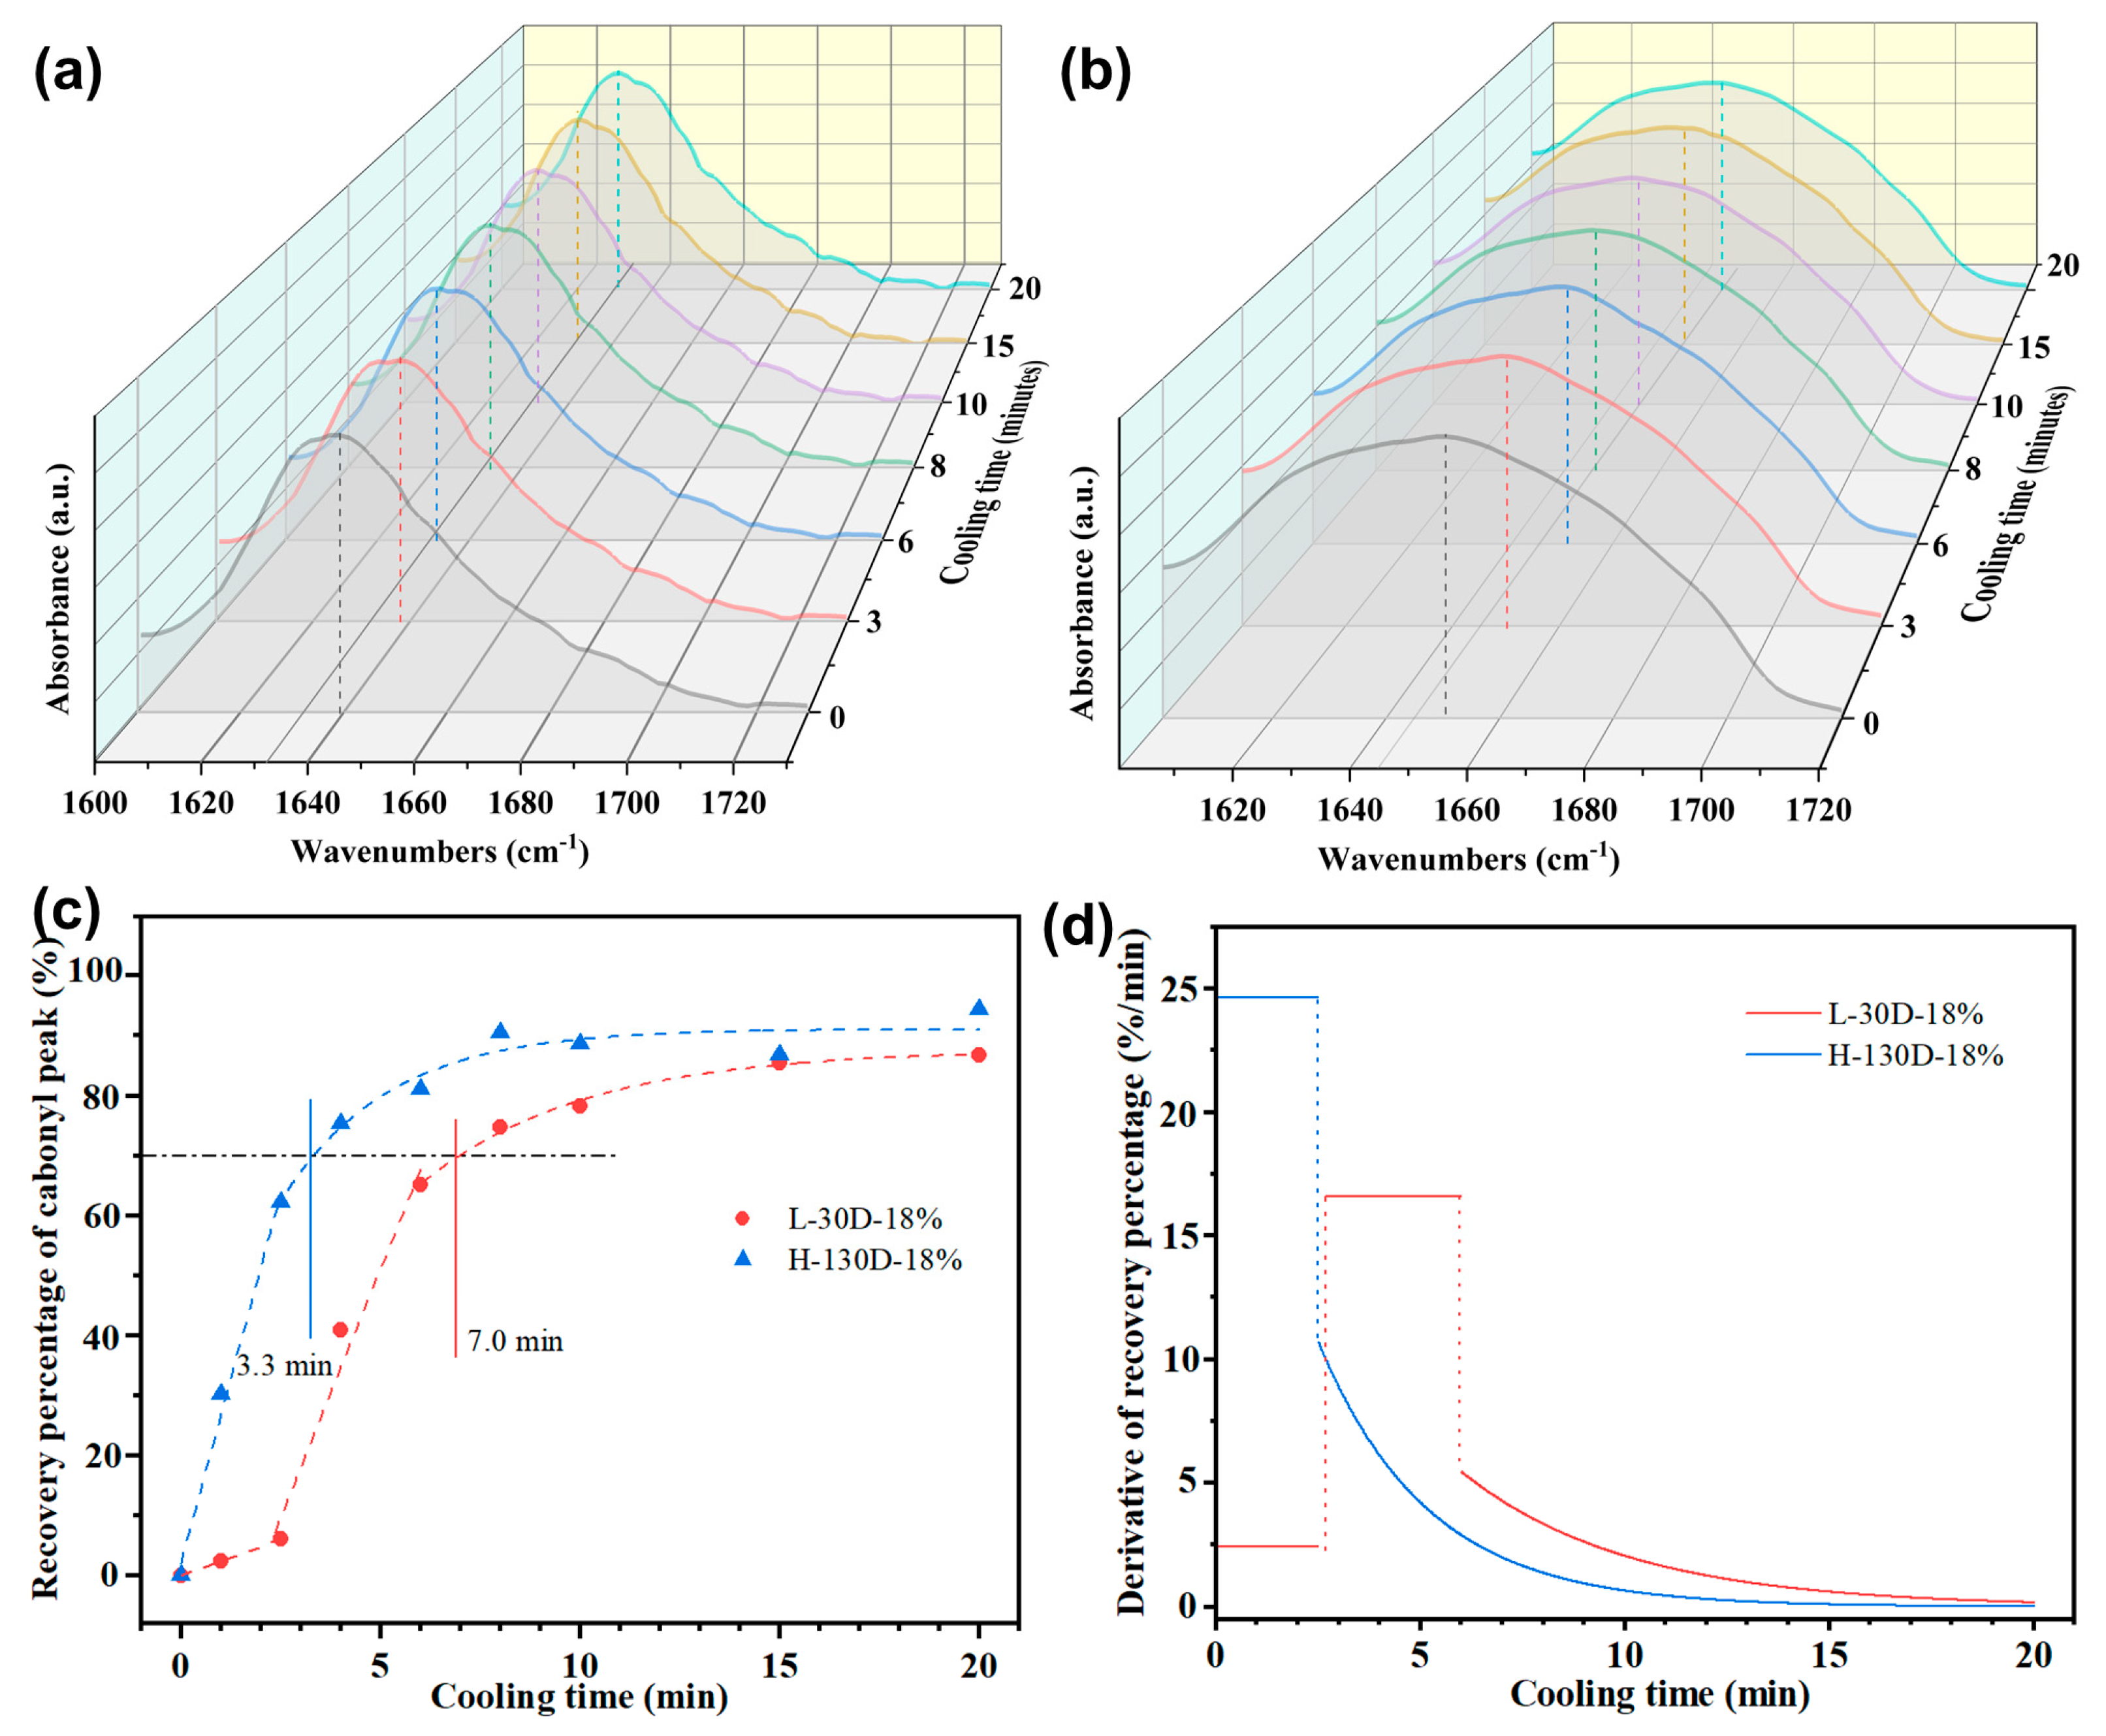
The films were heated to 150 °C under the same condition and then cooled naturally. The IR spectra were recorded at various cooling times to observe the change in carbonyl peaks, as shown in
Figure 10 and
Figure 11. The results indicate that the carbonyl peak of each film shifts toward lower wavenumbers during cooling, implying the hydrogen bonding recovery. The recovery percentage (
φ) of carbonyl peaks is defined using the following formula.
where
λ0,
λt represent the wavenumbers of carbonyl peaks at the start of cooling and after t minutes of cooling, respectively, and
λRT is the wavenumber of carbonyl peaks at room temperature. Herein,
φ can qualitatively describe the recovery degree of hydrogen bonding.
Figure 10c presents the recovery percentage curves for the films using different IPDI contents, with the oligomer being H-130D. It is evident that
φ increases with the higher IPDI contents, exhibiting more obvious differences at the beginning of cooling. Based on the time to need for reaching 70% (
φ = 70%) of the original carbonyl peak (t
0.7), the macroscopic recovery rate of the hydrogen bonding can be compared quantitatively. As shown in
Table 4, the required time (t
0.7) for the samples declines from 10.7 min to 3.3 min, as the IPDI content increases from 11% to 18%.
According to Formula (5) [
6,
33], we have calculated the
of the hard segment chains, i.e.,
.
where
Ms represents the
Mw of the polysiloxane oligomers, and
is the ratio of the mass of the hard segments consisting of isocyanates and extenders to the total mass of the reactants.
M0 takes the value of 16 g/mol, which indicates
Mn of the amino (-NH
2) group in the urea group at the two ends of the hard segment chain.
Table 4 presents the
of the polyurea copolymers synthesized with H-130D and various IPDI contents. It is observed that the
is negatively related to the t
0.7, meaning that the required time of recovery declines with the higher
. In theory, it is more possible to aggregate the polymer chains with higher
Mn. Therefore,
is a significant factor that influences the hydrogen bonding recovery.
To further study the hydrogen bonding recovery, the derivative of the
φ against t curves is calculated to obtain the function relation of
φ′ (
dφ/
dt) and cooling time, which represents the instantaneous recovery rate. As for the H-130D-18% film, the hydrogen bonding rapidly reverts during cooling, followed by a decrease in the recovery rate. Separately, the other copolymers containing H-130D display a very low
φ′ within 8 min, indicating minimal hydrogen bonding recovery at the start of cooling; afterward, a relatively high constant rate is observed, followed by a gradual slowdown. Based on these results, the hydrogen bonding recovery can be categorized into three stages: the initial stage, with a very low
φ′; the second stage, having a constant rate; and the third state, with a declining rate. The duration of the initial stage varies for each film, and the retention time for the H-130D-18% films can be regarded as zero.
Figure 10d illustrates that when the IPDI contents increase from 11% to 18%, the sample retention time in the initial stage decreases from 7.2 min to 0 min. Furthermore, the recovery rates at the second stage are nearly identical. Based on the above results, it can be concluded that the notable difference in the initial stage of
φ′ leads to variations in the recovery time (t
0.7). The polymers with higher molecular weight have a greater tendency to aggregate, thereby the retention time at the initial stage should be influenced by the
for the copolymer. Moreover, the T
g also impacts the relaxation time of the polymer chains, indicating that the recovery of the hydrogen bonding may be influenced by both the hard segments and T
g.
Additionally, at the same IPDI contents of 18%, the synthetic films using L-30D and H-130D were characterized by the temperature-dependent IR spectra during cooling. The relation curves of
φ′ and t are analyzed as before, with the results shown in
Figure 11. The copolymer films with L-30D require a longer recovery time, with a difference in t
0.7 between the two samples of 4 min. Moreover, the calculated
of the L-30D copolymer is 701 g/mol, which is far less than that of the films using H-130D. The result still agrees with the negative correlation of the
and t
0.7.
During the tensile process at large strain, the breakage of hydrogen bonding occurs in the deformation of hard domains, leading to energy dissipation [
34]. Similar to the heating and cooling process, the dissipation and recovery of the hydrogen bonding occur during the cyclic tensile process, indicating the deformation and reorganization of the hard domains. For the films containing H-130D, the stronger hydrogen bonding and the faster recovery rate reflect less irreversible deformation of the hard domains, reflecting less energy dissipation (
Table 2). The rule is also suitable for the films using the same oligomer with higher IPDI contents. Moreover, the film resilience is determined by the relaxation of polymer chains, which are mainly influenced by the recovery rate of the deformed hard domains. Evidently, the films using H-130D show faster recovery rates of the hydrogen bonding, consistent with their better resilience (
Supplementary Figure S3).

