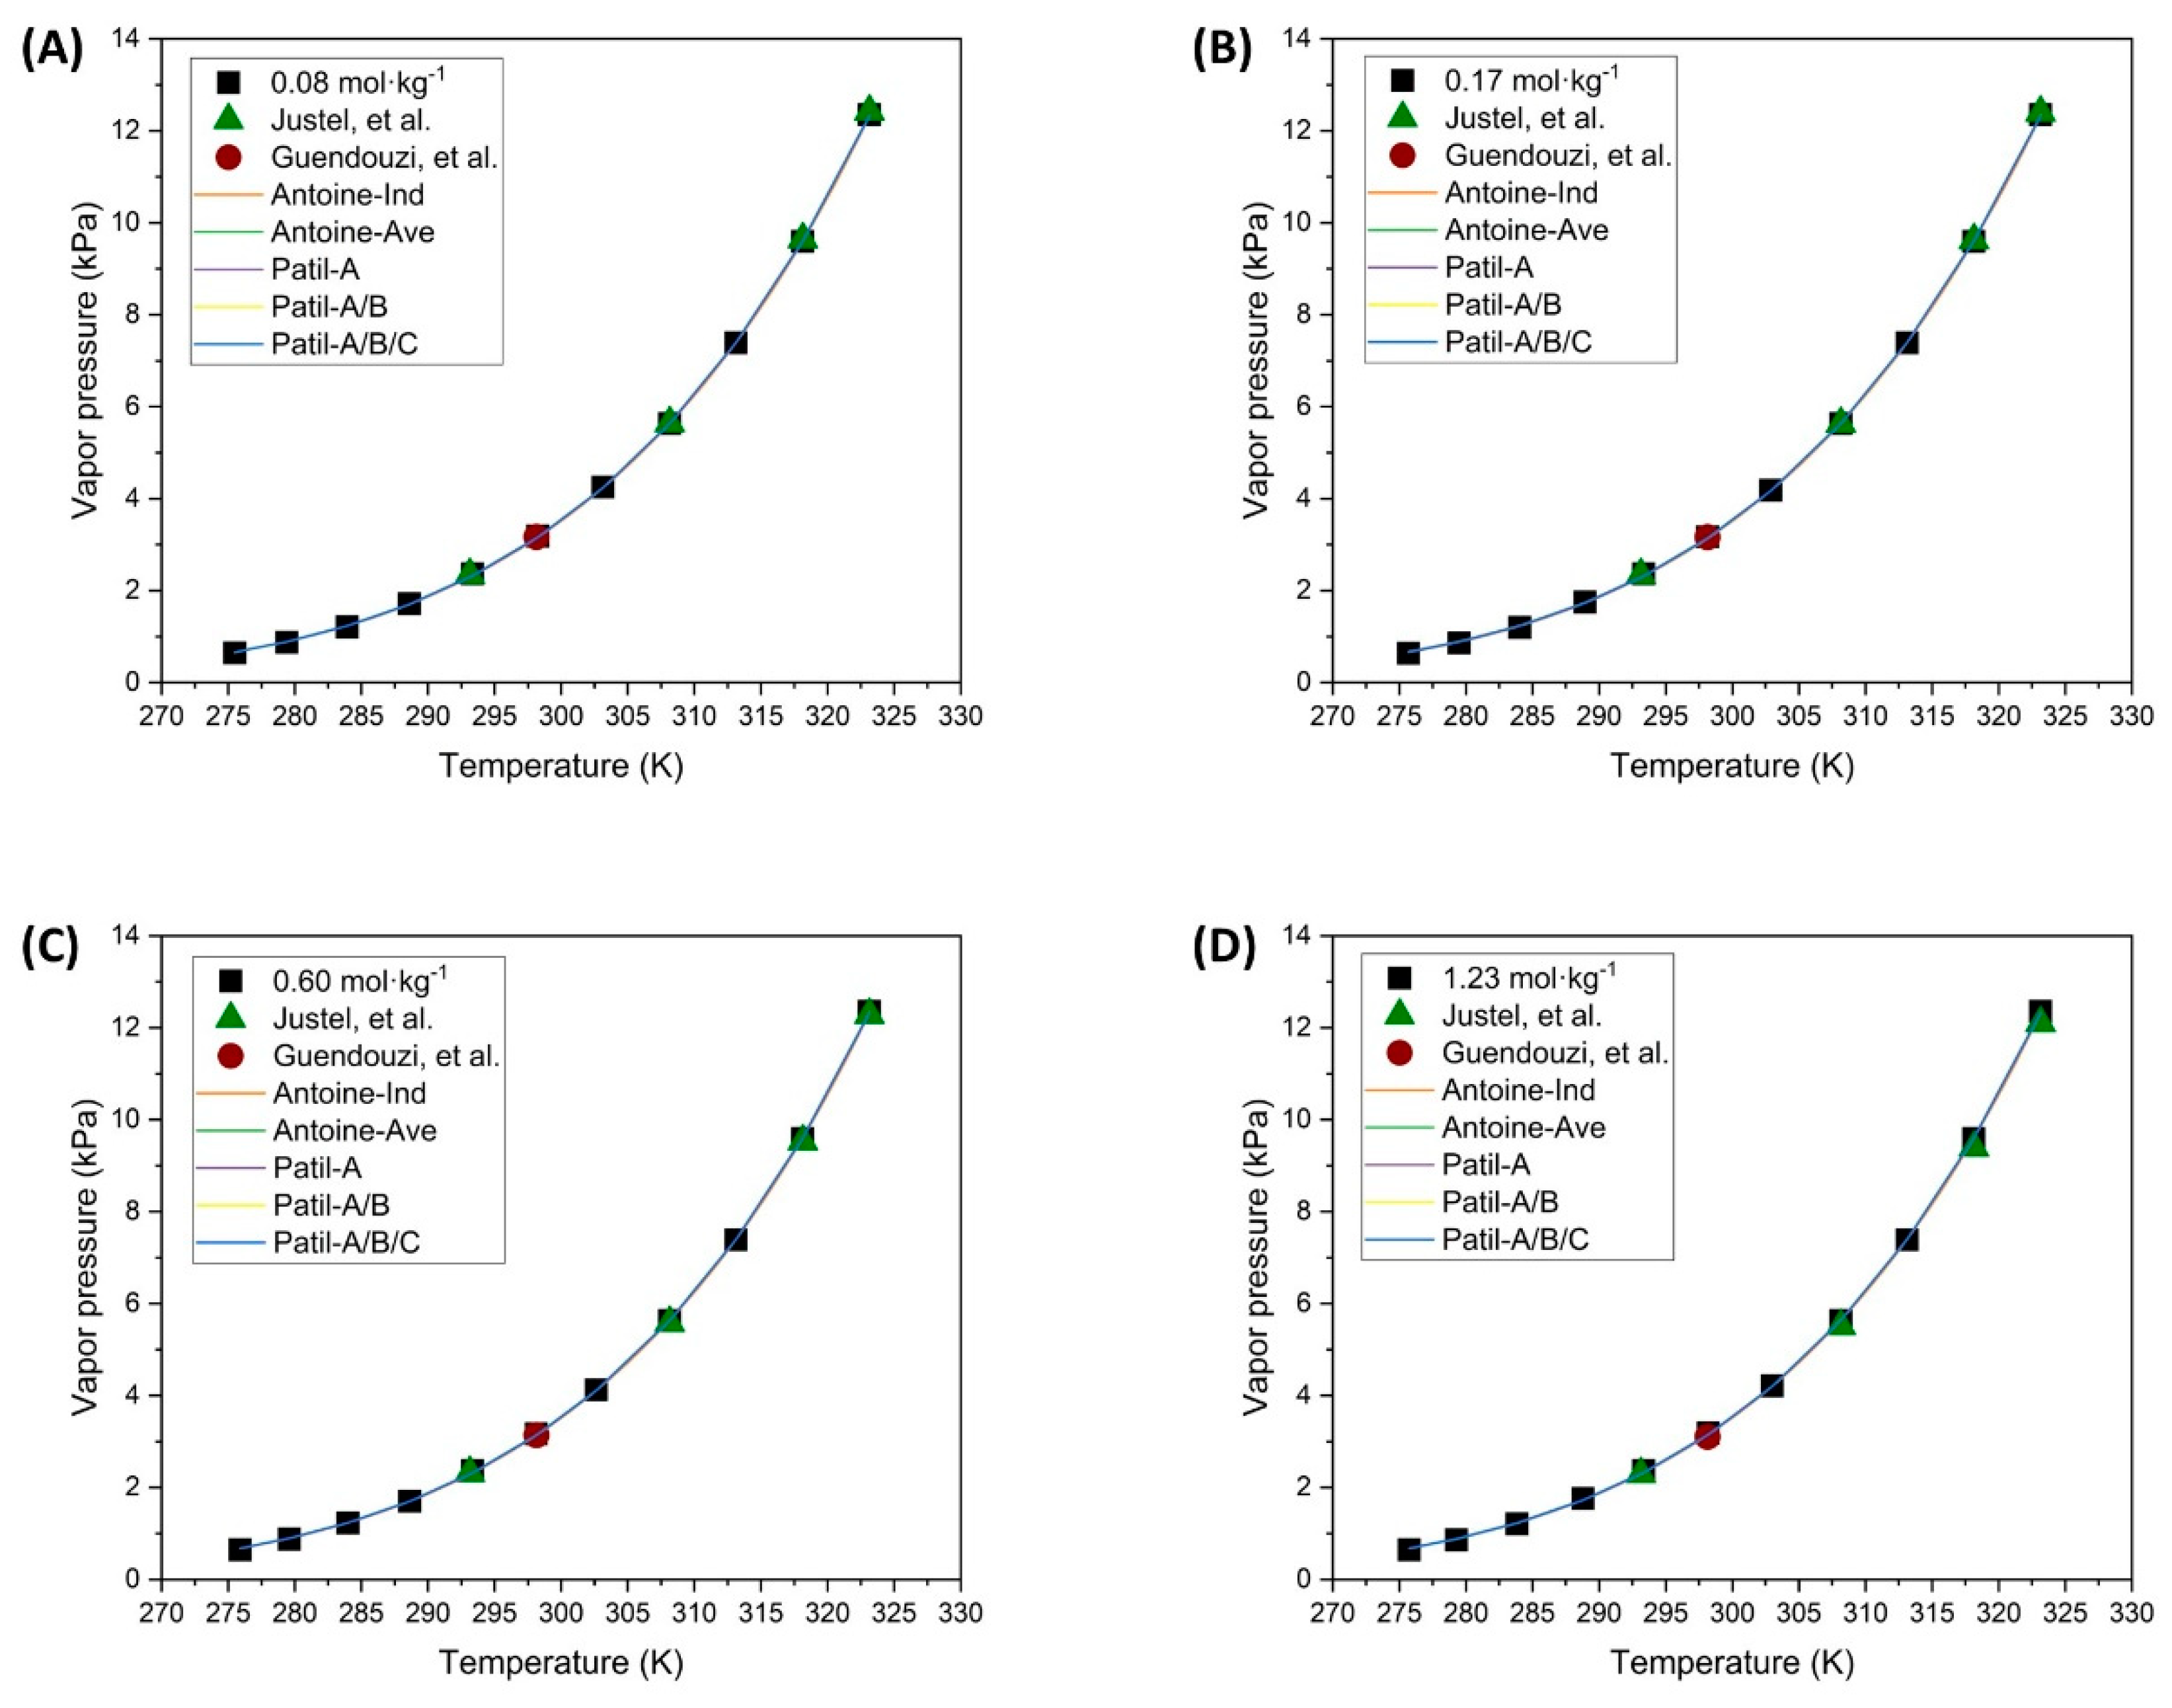
3.1. Vapor Pressure of Saturated Salt Solutions
The results of the determination of vapor pressures for saturated salt solutions are shown in
Figure 3, and the values of the fitted parameters of Equation (3) can be seen in
Table 3.
As shown in
Figure 3, the experimental results obtained in this study align closely with those reported in the literature by other researchers who have determined the vapor pressures of saturated salt solutions.
The authors have observed that the application of Equation (2) results in values very similar to those obtained in the previous literature, as cited in the following references. These highly accurate results have been obtained with the salts Ca(OH)
2 and NaHCO
3. On the other hand, some salts do not show as much similarity with previously published results. These errors, ranging from 3% to 8%, are observed in the samples of MgSO
4·7H
2O, NaNO
3, and KNO
3 salts in
Figure 3D–F, respectively. These differences in vapor pressure measurements become more pronounced at temperatures above 35 °C. In this study, the vapor pressures determined are slightly higher than those reported by other authors. These discrepancies could be attributed to variations in the experimental equipment used or the determination of
Pv,sat as shown in Equation (2). Despite these deviations, the values determined are considered accurate.
The vapor pressures of Ca(OH)
2 and NaHCO
3 solutions have been poorly studied. The saturated NaHCO
3 solution exhibits high solubility within the temperature range investigated in this study, as noted by Ozcan and Miller [
40]. Leon-Hidalgo et al. [
41] determined the vapor pressure of a saturated sodium bicarbonate solution using an indirect hygrometer measurement at 25 °C, obtaining a value of 3.18 kPa. The present work has recorded a vapor pressure value of 3.08 kPa at 25.1 °C, closely matching Leon-Hidalgo’s results. Knuutila et al. [
42] investigated the sodium bicarbonate solution at the equilibrium point where sodium carbonate (Na
2CO
3) forms without reaching saturation. The values across the different concentration ranges are similar to those obtained for the saturated NaHCO
3 solution.
Finally, the Ca(OH)
2 solution has been scarcely studied due to its low solubility in water within the working temperature range. Duchesne and Reardon [
43] compiled data from other authors indicating that the solubility of the Ca
2+ ion was around 0.02 m, thus highlighting its low solubility level. Other researchers have increased the solubility of this salt by using bases, such as NaOH, at high concentrations and 25 °C, as investigated by Pallagi et al. [
44]. Another study by Konno et al. [
45] explored the solubility of this salt with varying concentrations of NaOH and temperatures of 25, 50, and 75 °C. The present study observed that due to this low solubility, the saturated Ca(OH)
2 solution exhibited relative humidity values above 95% at a temperature of 15 °C, indicating that its vapor pressure closely approximates that of pure water as the temperature increases.
The parameter fitting of Equation (3), corresponding to Antoine’s equation, has demonstrated a good overlap with the experimental data, resulting in a low fitting error for all the salt solutions tested. Leon-Hidalgo et al., [
41] conducted studies with both saturated and unsaturated saline solutions, fitting the saturated solutions to an Antoine-type expression. The parameters that were fitted in their study are similar to those obtained in the present research.
3.3. Evaporation of Saturated Salts on Different Free Evaporating Surfaces
Figure 8 presents the results for the natural evaporation of a saturated NaCl solution across different evaporation surfaces:
S1 (141.2 mm
2),
S2 (1683.7 mm
2), and
S3 (3452.4 mm
2). The data show that surface
S1 exhibits distinct behavior in evaporation per unit area and requires a longer time to fully evaporate the water compared to
S2 and
S3, with
S1 requiring approximately 180 days to complete the process. For surfaces
S2 and
S3, the difference in evaporation per unit area becomes noticeable only after the complete evaporation of the water, as indicated by the plateau in the curves. Initially, the slopes for
S2 and
S3 are identical, indicating that the evaporation surface area does not significantly impact the evaporation rate. Instead, increasing the surface area results in a higher total mass of water evaporated, but does not alter the evaporation per unit area.
The other salts studied for natural evaporation exhibited similar behavior to that shown in
Figure 8, so this figure is presented primarily to illustrate the experimental test conducted. To compare the results of the different saturated salt solutions, the slopes of the evaporation curves during the initial linear evaporation phase, corresponding to the first days of evaporation, were analyzed. These results are displayed in
Figure 9, which compares the evaporation rates of all solutions tested in this research, including distilled water.
The results indicate no significant difference in the evaporation rates between surfaces S2 and S3, as their values are nearly identical across all study cases, with any minor differences likely attributable to measurement errors. However, a notable difference is observed between these larger surfaces (S2 and S3) and surface S1, with a reduction in the evaporation rate ranging from 82.7% to 92.2%. In contrast, despite having twice the evaporation area, S2 and S3 exhibit similar evaporation rates, suggesting that there may be a critical surface area at which the evaporation rate stabilizes regardless of further increases in surface area.
Assouline et al. [
50] experimented to determine water evaporation in two tanks. A black polypropylene plate covered the surface of one of the tanks with evenly distributed square perforations. This design allowed the use of different evaporation areas in the experiment. Assouline et al. demonstrated that with a very small evaporation surface, the evaporation rate deviates from the ideal trend. As the surface area increases, it approaches the maximum evaporation rate. Therefore, it can be concluded that there is a limiting surface area, beyond which further increases do not affect the evaporation rate. This effect may explain the behavior observed for surface
S1, which deviates from the ideal evaporation trend. In contrast, surfaces
S2 and
S3 exhibit the maximum possible evaporation rate.
The different salts’ evaporation rates depend mainly on their vapor pressure in equilibrium with the air temperature. In
Section 3.1, the vapor pressures of these saturated solutions are determined. Comparing the vapor pressure results with the evaporation rate experiments confirms a good correlation between both variables. The CuSO
4·5H
2O and MgSO
4·7H
2O solutions exhibit the highest evaporation rates due to their hydration equilibrium state, which allows them to eliminate excess water molecules from the solution at a higher rate regardless of their vapor pressure. It should be noted that when calculating the evaporation rates in the linear evaporation interval, these solutions have the highest values. However, as they reach equilibrium with the ambient humidity, they do not completely evaporate the water from their structure and can even gain mass if the environmental humidity increases. This effect is evident when these solutions have almost no apparent liquid left in the vessel and salt deposits become noticeable. In contrast, other solutions with high vapor pressures dried out completely during the experiment, maintaining a constant evaporation rate throughout the trial. The evaporation rate of these hydrated salts drops drastically once they reach equilibrium with the environment. Genceli, F. E. et al. [
51] investigated MgSO
4·nH
2O salt in different hydration states, determining that at room temperature and depending on the relative humidity it can overhydrate up to 11 times. This demonstrates that these hydrated salts can retain water in their crystalline structure.
KNO3 shows a slightly higher evaporation rate than NaHCO3 and Ca(OH)2, while lower evaporation rates characterize NaCl and NaNO3. Comparing all these results with those of distilled water, it can be seen that this shows the highest evaporation rate since it evaporates on a free film, and its rate is influenced primarily by environmental conditions such as temperature and relative humidity.
This experimental test is used to determine the evaporation rates of salts in the saturated state, representing the worst possible concentration conditions for the evaporation of the water present in the solutions. Gilron et al. [
25] determined an evaporation rate for the volume reduction of waste from brackish water, where they obtained values of evaporation rates from the free surface of water of 0.0796 kg·m
−2·h
−1. This value approximates the results obtained for the solutions in the present investigation. More recent studies by Gilron et al. [
52], investigating evaporation rates for brines concentrated to a state of ZLD or almost no liquid, found an approximate evaporation rate of 0.0459 kg·m
−2·h
−1, for the water-free film. This is similar to the values obtained in the present study for the saturated NaCl solution, with an average evaporation rate of 0.0496 kg·m
−2·h
−1.
3.4. Evaporation of NaCl and CuSO4·5H2O Saturated Solutions in Fabrics
As previously mentioned, evaporation studies on natural and synthetic fabrics have been carried out using saturated NaCl and CuSO
4·5H
2O solutions on samples with a 50 mm × 75 mm surface area and an effective evaporation area of 50 mm × 60 mm. These two salts were chosen for determining evaporation rates due to their distinct properties: NaCl, with the lowest vapor pressure, and CuSO
4·5H
2O, which is a structurally larger salt in its hydrated state.
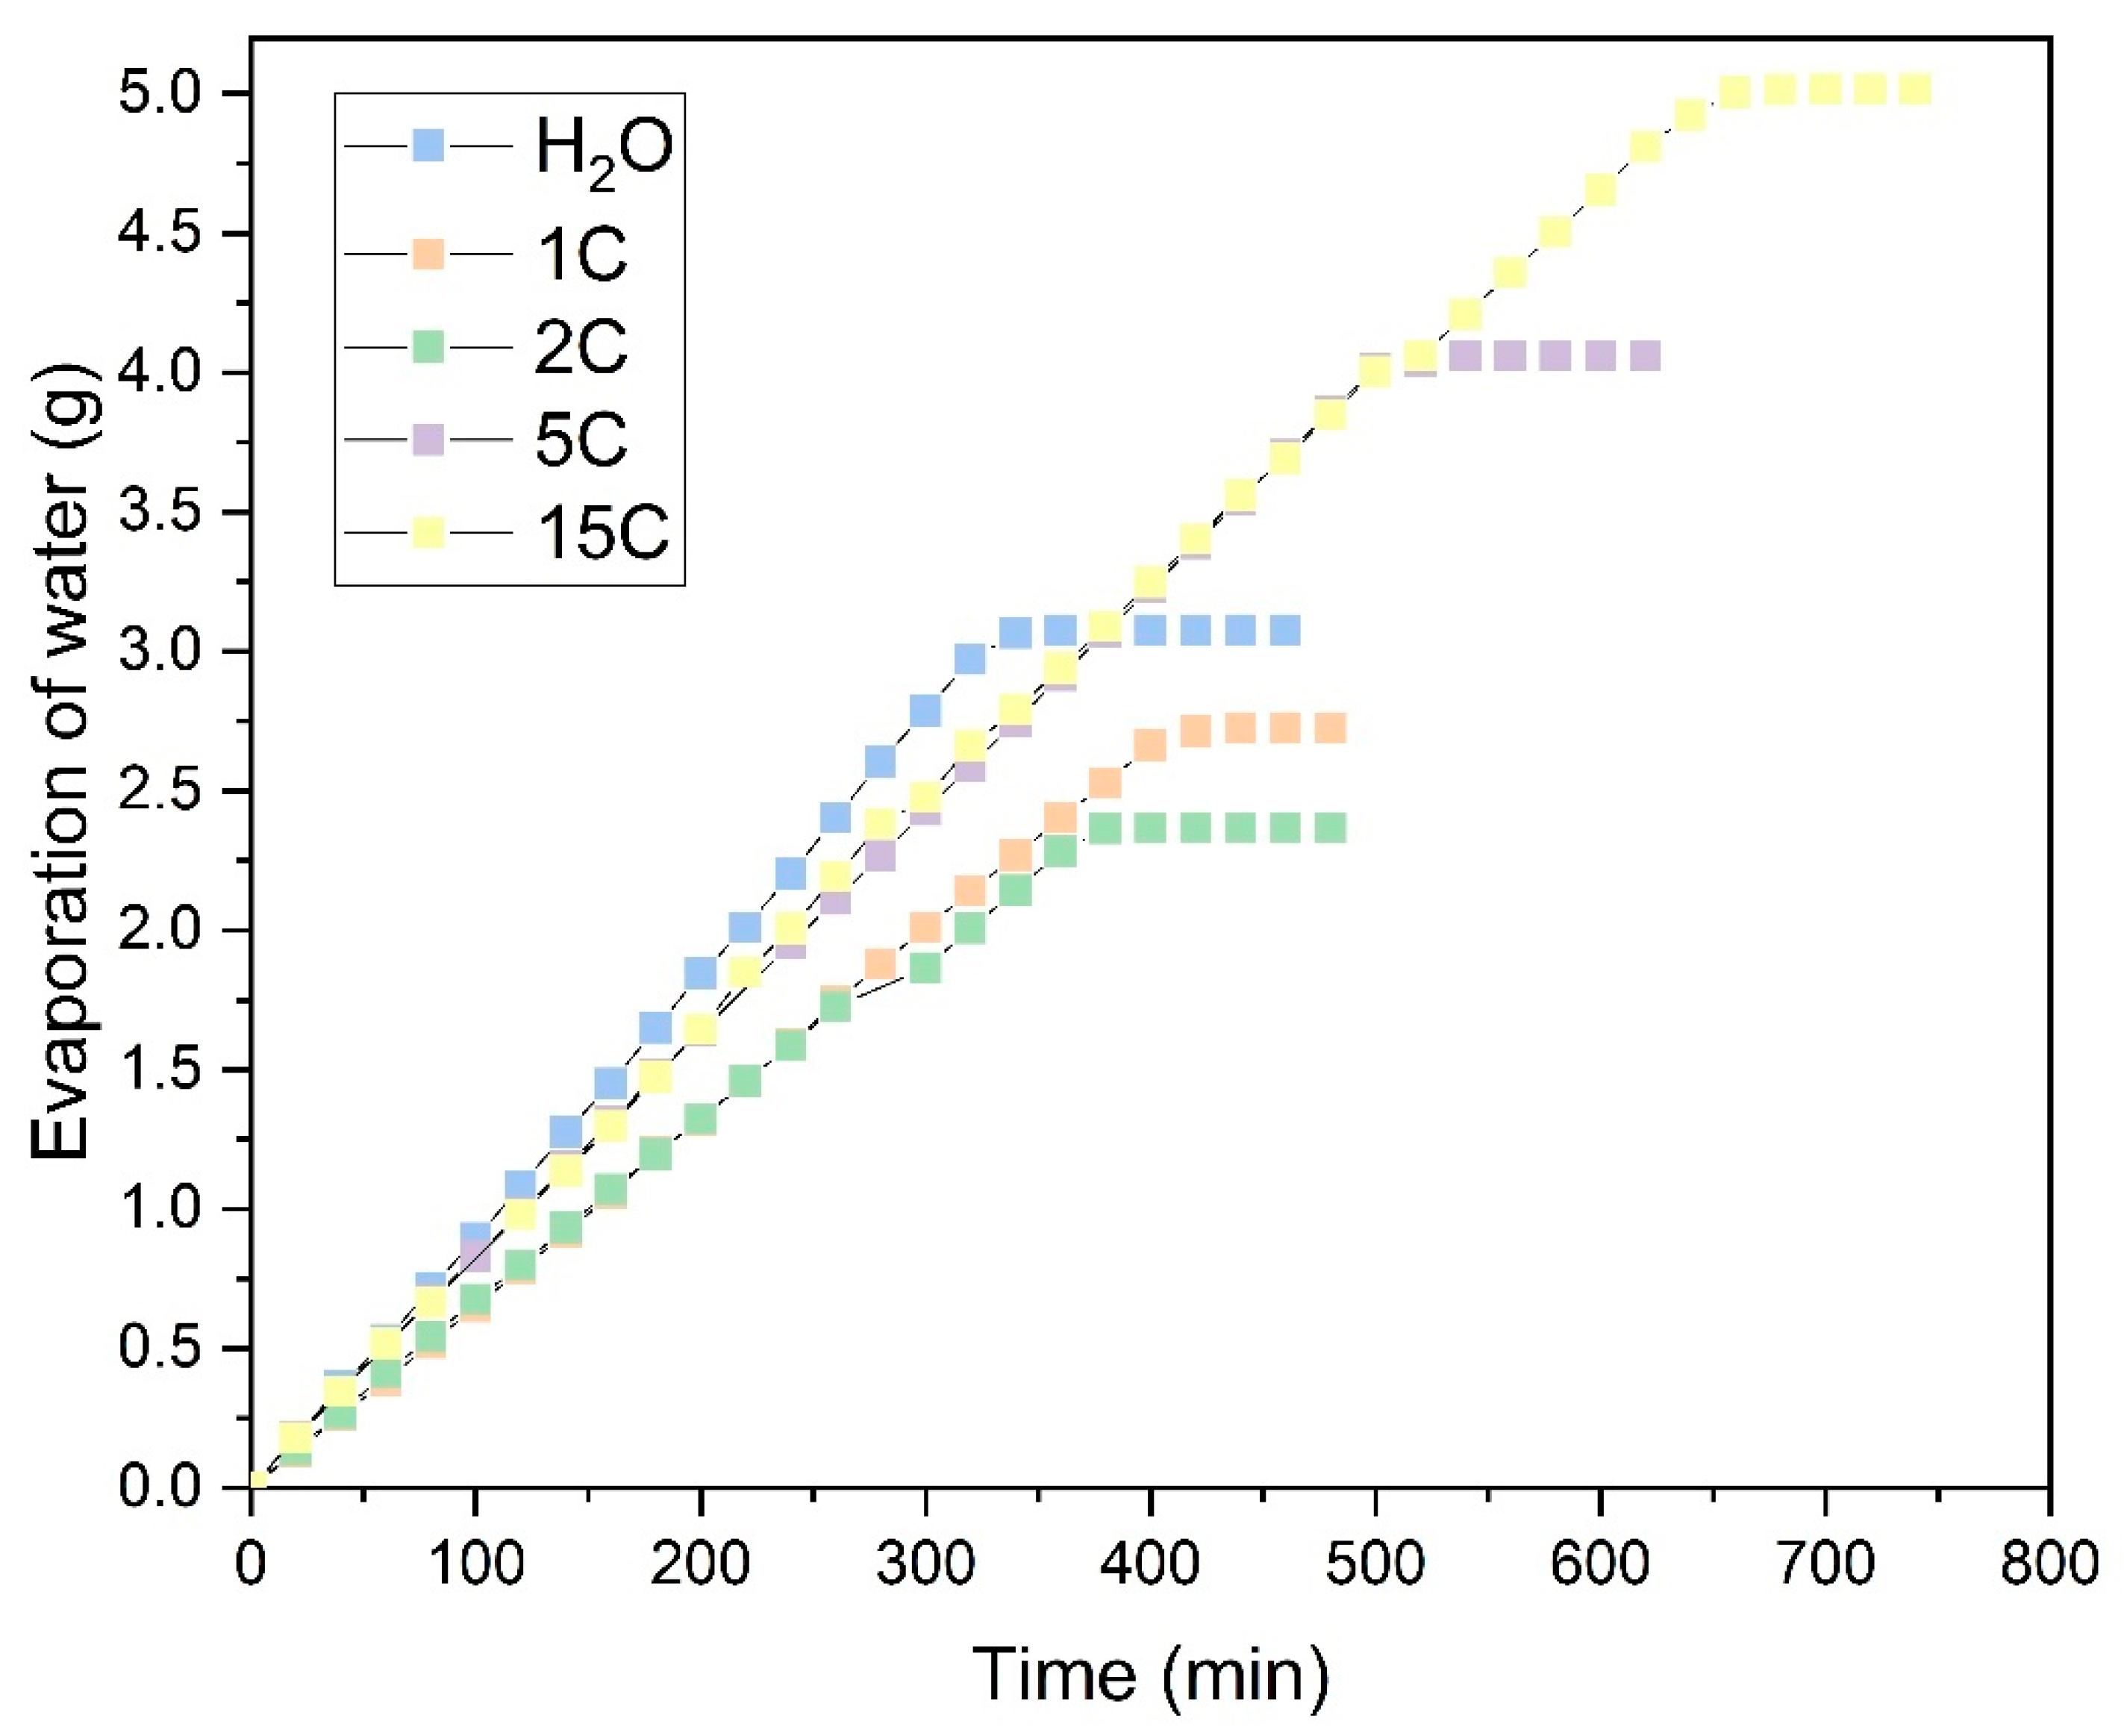
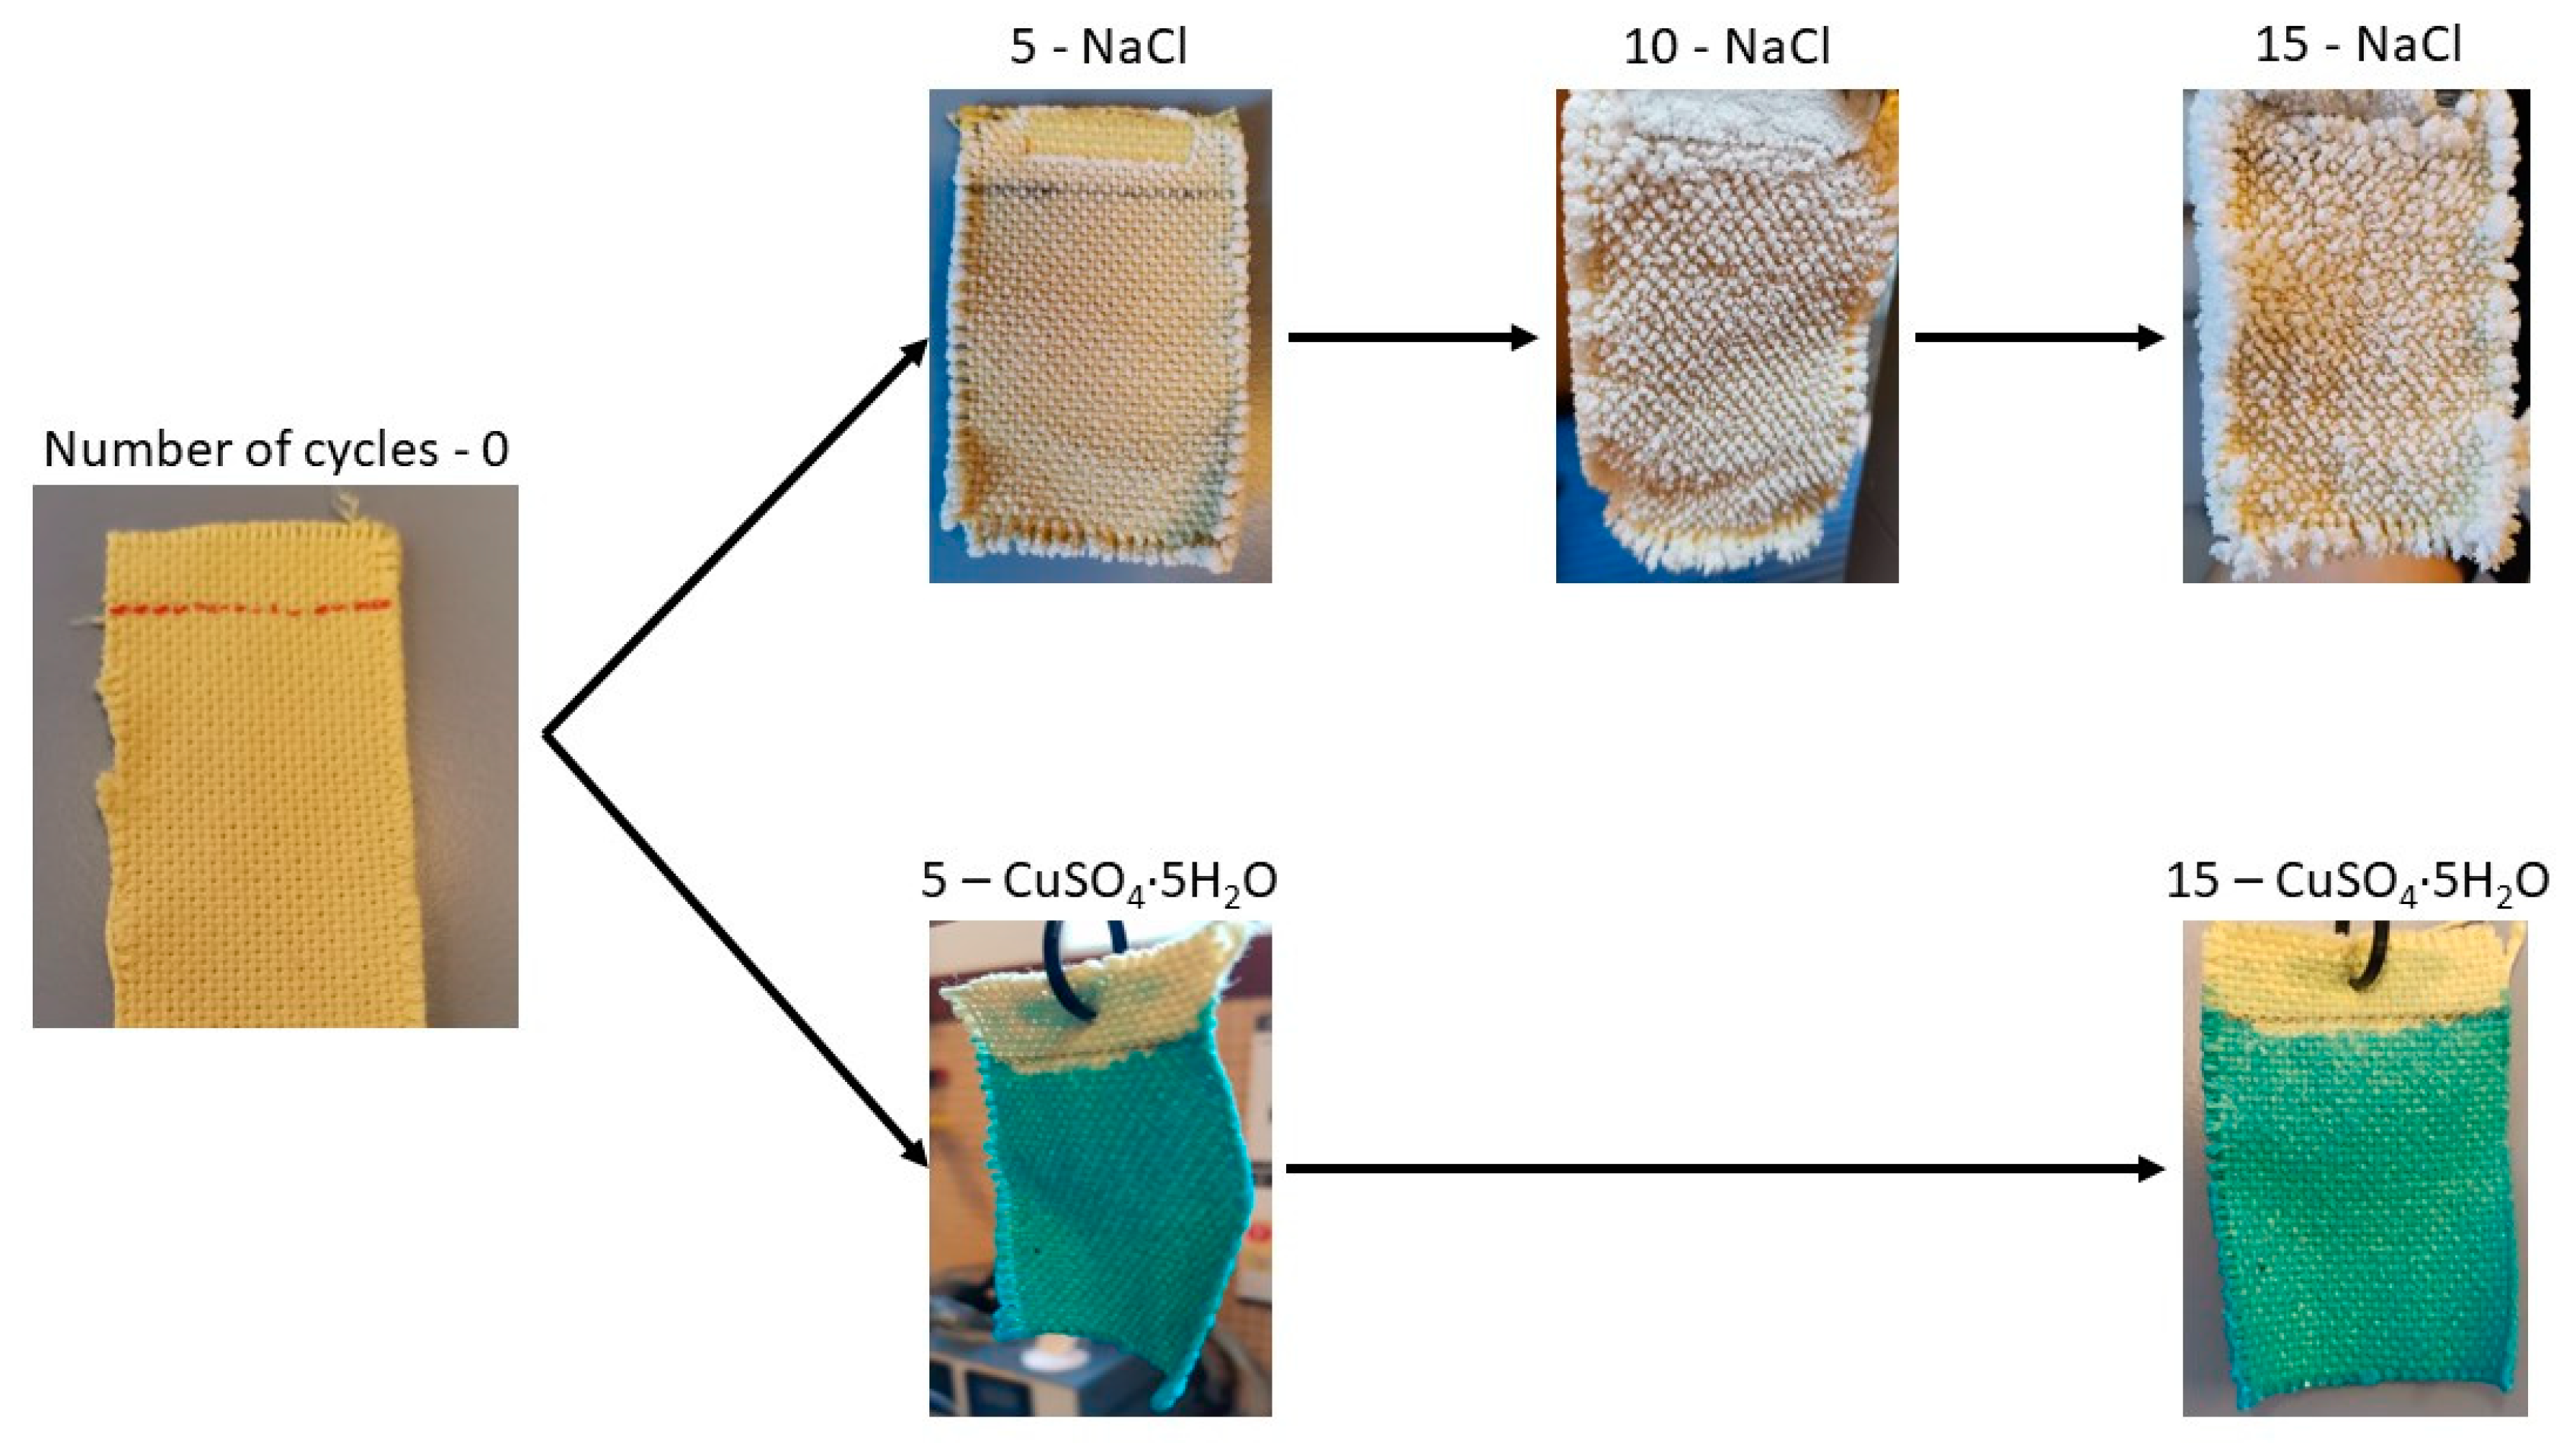
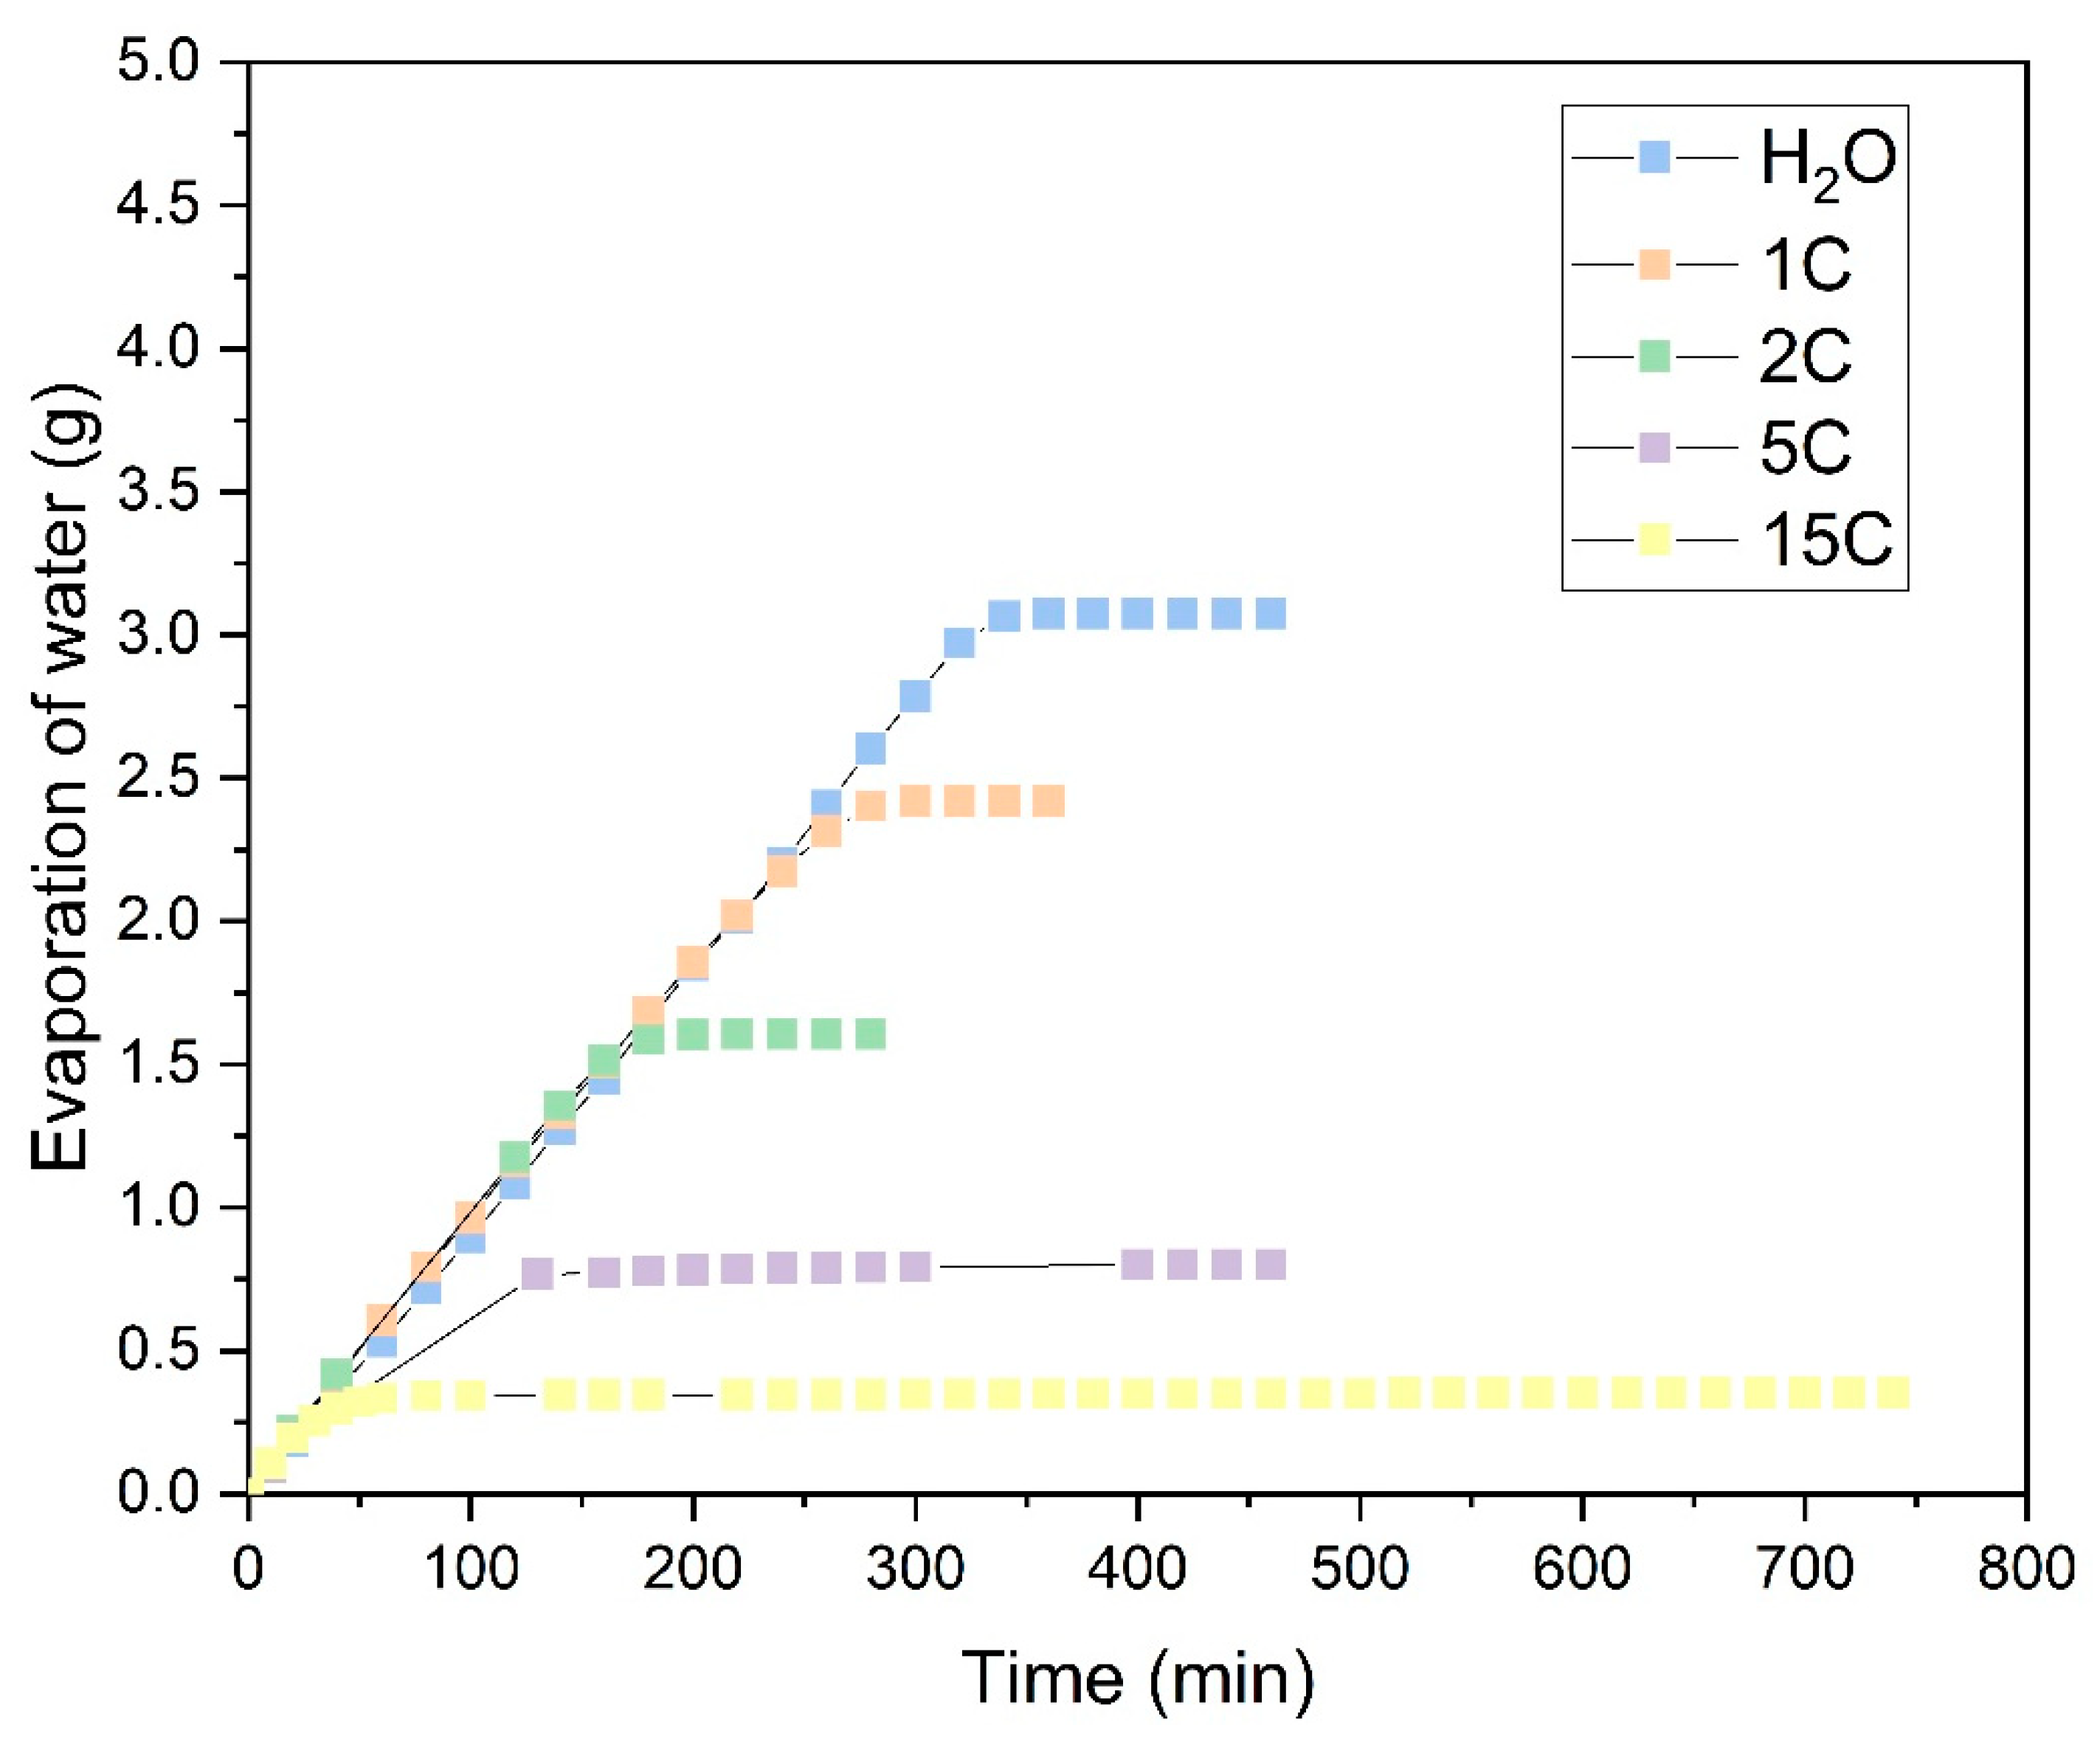
Figure 10 shows the evaporation process for the Ara sample in NaCl solution across different evaporation cycles.
In these tests, only the evaporation of water was accounted for, with the salts precipitated on the fabric as the water evaporated being discounted. The graphs compare the evaporation per cycle of each saturated solution with that measured in distilled water. In the NaCl solution, shown in
Figure 10, it can be observed that during the first few operation cycles (1C and 2C), the water absorbed by the fabric and measured in evaporation is similar to that of distilled water. This suggests that salt precipitation does not initially affect evaporation. As the number of evaporation cycles increases, NaCl precipitates within the fabric structure. This effect is illustrated in
Figure 11, showing NaCl crystals growing perpendicularly to the fabric surface, particularly at the edges of the sample. This salt precipitation causes an increase in water absorption due to the combined effects of the fabric’s inherent absorption and the hydration of the precipitated crystals. This results in increased liquid absorption and, consequently, higher total water evaporation, as seen in
Figure 10.
Figure 12 shows the tests conducted with CuSO
4·5H
2O salt and highlights a completely different behavior compared to the NaCl salt observed previously. As can be seen, compared to evaporation with distilled water, the absorption capacity reduces from the first cycle onwards and continues to decline with subsequent evaporation cycles. This reduction is likely due to the pentahydrated nature of the salt and to the formation of CuSO
4 crystals. As shown in
Figure 11, these crystals do not grow in the same manner as NaCl crystals, with little difference between the 5C and 15C cycles. The precipitation of CuSO
4 forms a dense, solid layer that prevents the solution from penetrating into the fabric structure during each operation cycle and inhibits the fabric’s ability to retain water. From cycle 5C onwards, the mass of salt precipitated on the fabric remains consistent at approximately 0.1 g, indicating that the saturated CuSO
4·5H
2O solution is retained only on the CuSO
4·5H
2O crystals already precipitated in the previous cycle.
Only the graphs showing the water evaporation over time for the Ara sample are presented, as its trend mirrors that of the other fabrics tested. Next, the evaporation rates for all samples are analyzed during each work cycle, focusing on the range where the evaporation rate is at its maximum. In this zone, a linear evaporation trend with a constant slope has been observed, as indicated in the previous figures, until complete evaporation is achieved.
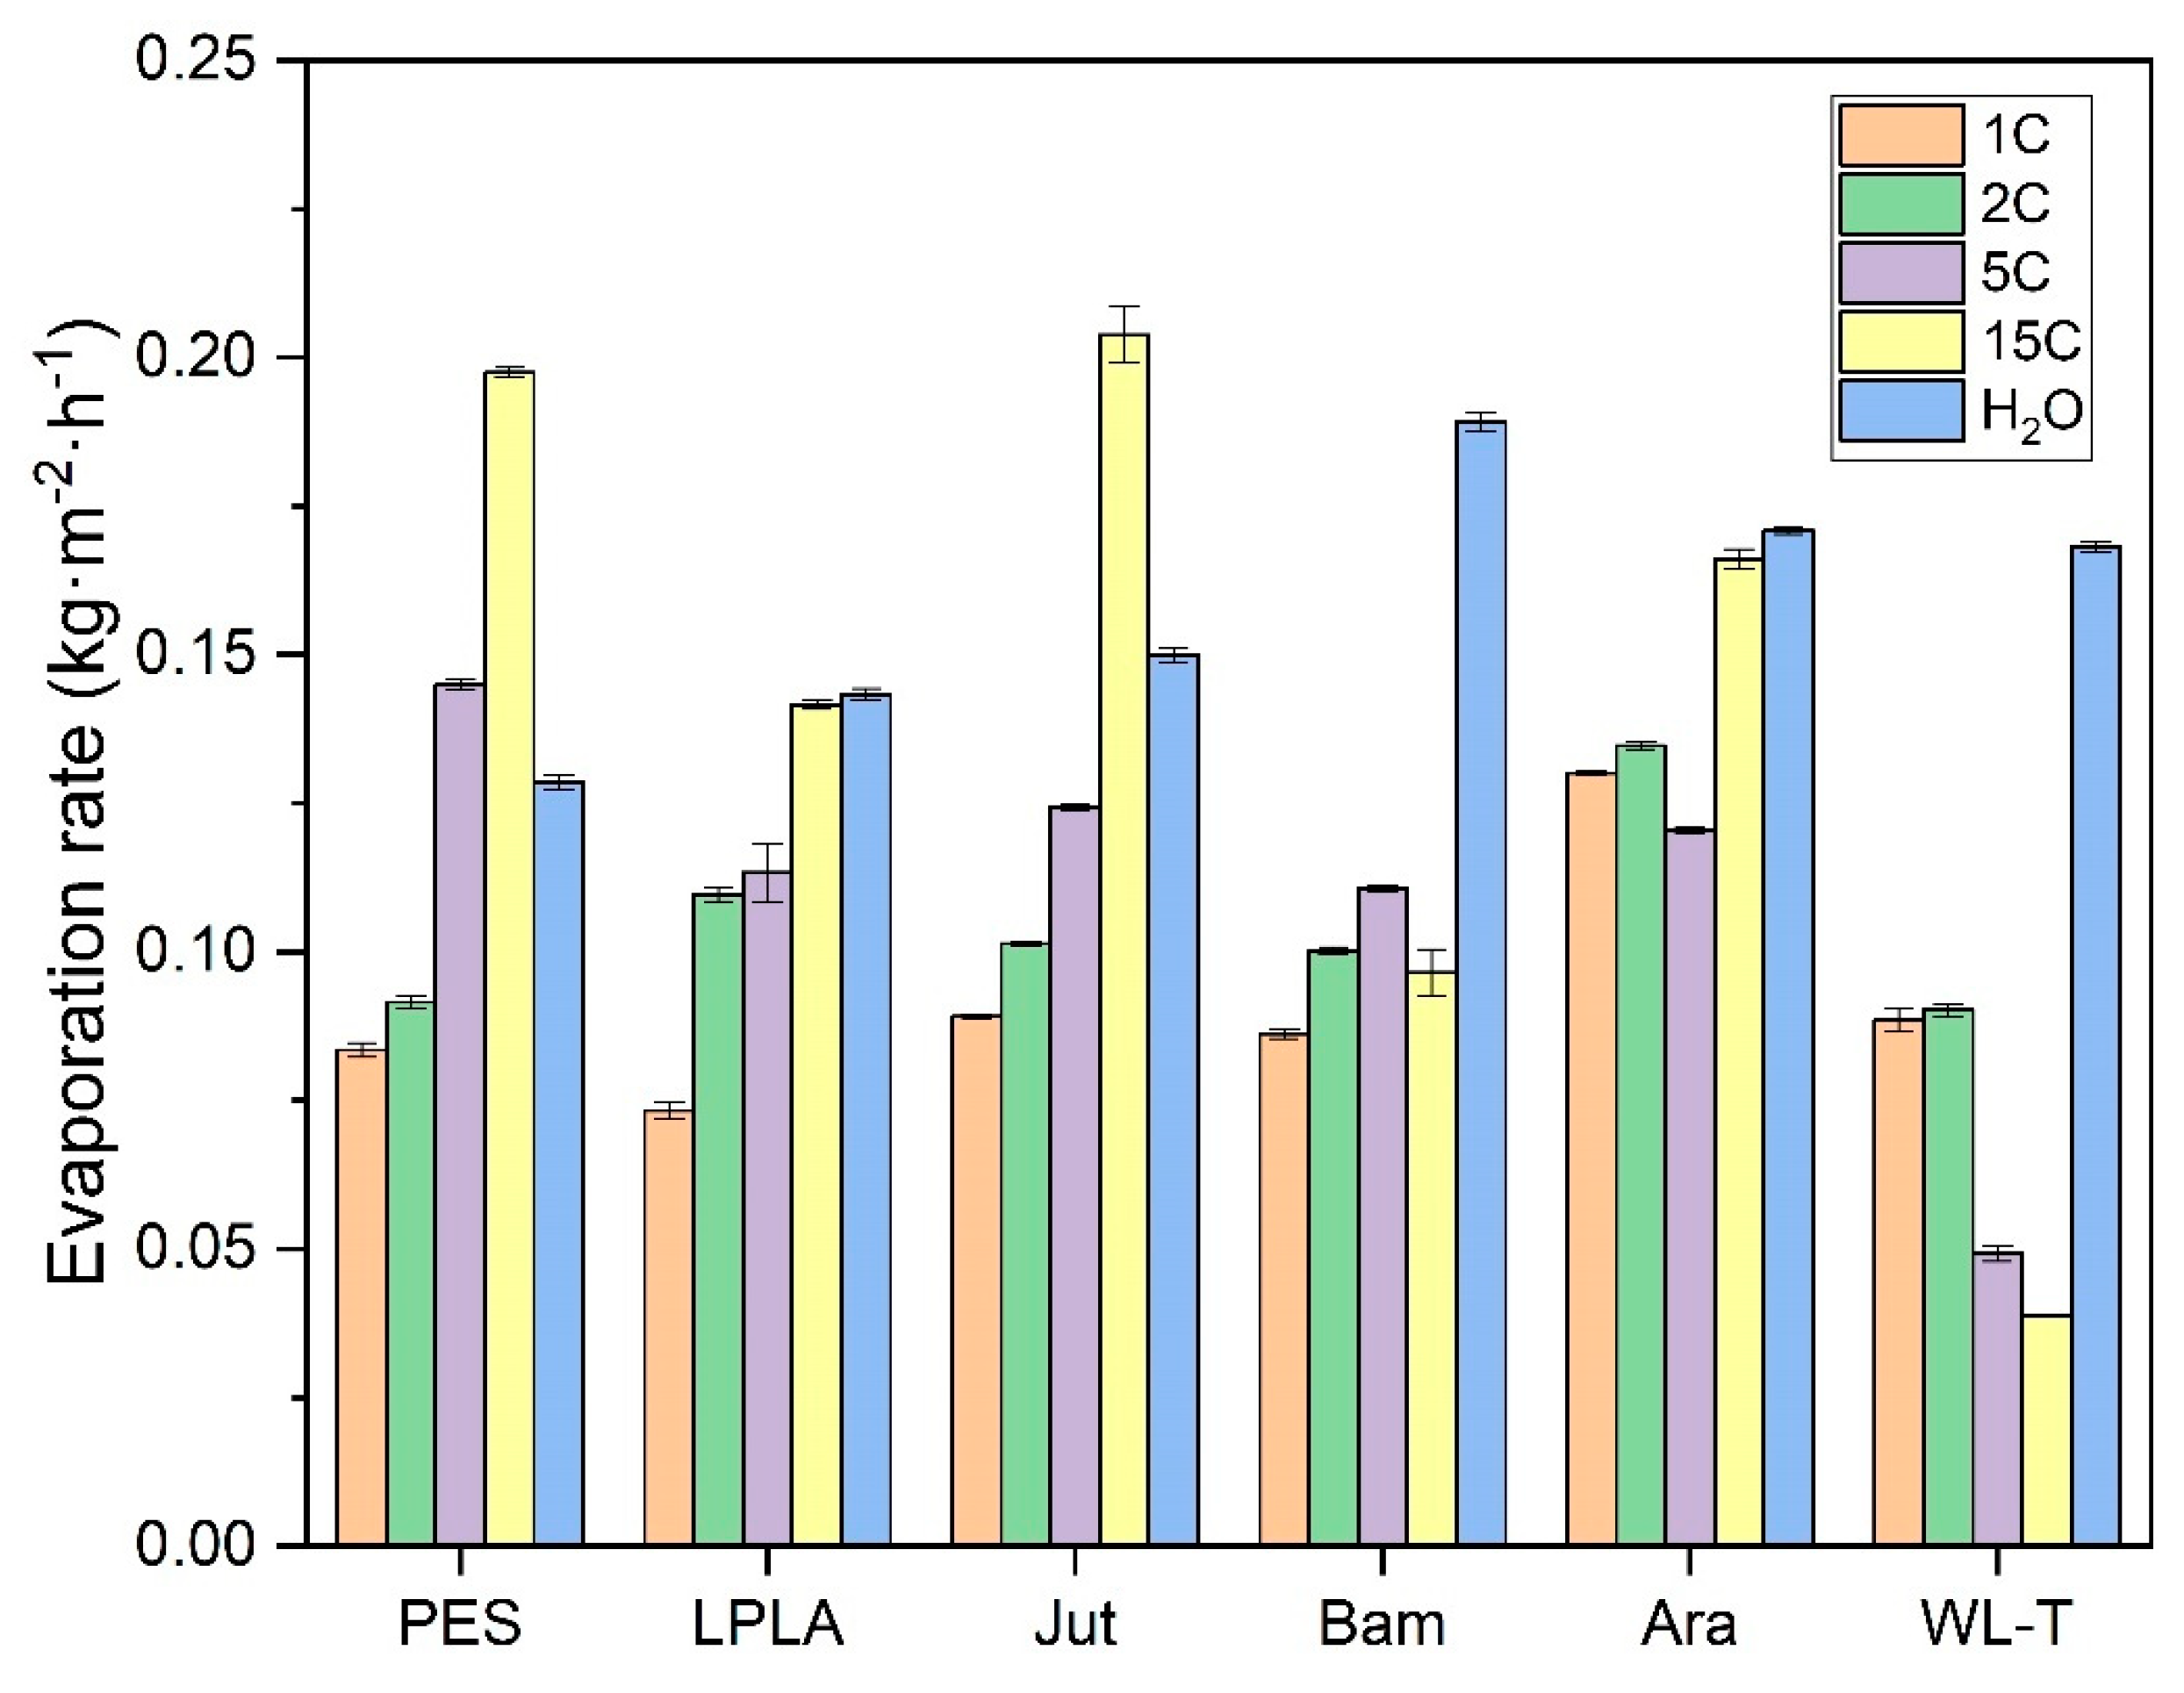
The results for the saturated NaCl solution are shown in
Figure 13. The general trend observed is consistent with that of the Ara sample. Both natural and synthetic fabrics exhibit an increase in evaporation rate as the number of cycles increases, with some fabrics even surpassing the evaporation rate of distilled water (PES and Jut). Two natural fabrics, Bam and WL-T, display different behaviors. The Bam sample, with a very low fabric weight of 0.2193 g, shows minimal salt retention, making the effect of additional hydration as evaporation cycles increase less noticeable. In contrast, the WL-T fabric exhibits a decreasing trend in evaporation rate as the cycles progress. This reduction may be attributed to the interaction between the saturated NaCl solution and the palm fibers, which could occlude voids between the fibers and increasingly restrict water evaporation from the fabric to the environment.
Observing the results obtained in these initial experiments with the NaCl saturated solution, the most promising fabrics for long-term evaporation cycles are PES, LPLA, Jut, and Ara. At around 15 evaporation cycles, these fabrics exhibit an increased evaporation rate, often surpassing that of distilled water due to the hydration of NaCl crystals deposited on their structure. Conversely, the Bam fabric stands out for applications requiring low salt retention. Despite its stable evaporation rate throughout the cycles, its salt retention is significantly lower than that of the other tested fabrics.
In the present investigation, it has been observed that evaporation rates for distilled water range between 0.1285 to 0.1892 kg·m
−2·h
−1 under ambient laboratory conditions, with a temperature range of 20 ± 2 °C, relative humidity of 40 ± 5 % and zero air velocity. Authors such as Shokri Kuehni et al. [
53] state that environmental conditions of temperature and relative humidity significantly affect the evaporation rate from porous media. Shokri Kuehni et al. conducted tests at a constant temperature with increasing relative humidity and observed a decrease in the evaporation rate. Conversely, evaporation is favored at constant relative humidity with an increase in temperature.
Liu et al. [
54] determined evaporation rates for polyester fabrics under conditions simulating human skin, at a temperature of 36 °C, relative humidity of 40%, and a wind speed of 0.3 m·s
−1. Because these conditions are more favorable than those tested in the present study, evaporation rates of 0.2544 to 0.3078 kg·m
−2·h
−1 were obtained, approximately twice the values reported in this paper. This difference is explained by the temperature and wind speed variations at which the experimental tests were conducted.
Some authors who have worked under similar conditions include Fourt et al. [
55], who studied hand-made fabrics at a temperature of 21 °C and a relative humidity of 65%, obtaining evaporation rates of 0.045 to 0.072 kg·m
−2·h
−1. On the other hand, Gurudatt et al. [
56] carried out tests in ambient conditions of 25 °C and relative humidity of 64%, obtaining evaporation rates of 0.1062 to 0.1158 kg·m
−2·h
−1. In the present work, slightly higher evaporation rates than those shown by the other authors have been measured at a lower relative humidity of 40%.
Alternatively, the studies of Wu et al. [
57], who investigated evaporation in saline media with surface-treated cotton fabrics, are worth mentioning. They worked at temperatures of 25 °C and relative humidities of 35 to 55%, obtaining evaporation rates of 0.166 kg·m
−2·h
−1. These values are more similar to those obtained in the present research, with a difference of 12%, although they are different solutions.
In the previous cases analyzed, only the environmental factors of temperature and relative humidity, which critically affect the evaporation rate, have been compared. Other factors influencing the evaporation rate may include the weight of the fabrics, as indicated by Chau et al. [
58]. These authors suggest that as the grammage of a fabric increases, the evaporation rate is reduced. Crow and Osczevski [
59] showed that fabrics can absorb more liquids if their thickness is increased and that the drying time of the samples depends on the grammage and thickness, as these factors directly influence the fabric’s ability to retain more liquids in their structure.
Figure 13 also shows that during the evaporation cycles for the saturated solution of NaCl, some of the fabrics exhibit an evaporation rate higher than that of water. This effect sounds counterintuitive, as the vapor pressure of this salt is quite low and, therefore, should not exceed that of distilled water. Shokri-Kuehni et al. [
60] demonstrated in their experiments that the mass loss over days in a porous medium for a concentrated NaCl solution was lower than when it was more diluted. In their research, Norouzi Rad and Shokri [
61] observed that adding NaCl in a porous medium up to a concentration of approximately 1.5 mol·kg
−1 decreased the evaporation rate. However, above this point, increasing the concentration caused an increase in the evaporation rate. This effect of increasing the evaporation rate in a porous medium was also demonstrated by Sghaier and Prat [
62], who observed that the evaporation rate for a saturated NaCl solution was higher than that of pure water in the first hours of evaporation, until the crystallization phase of the salt crystals was reached.
Subsequently, the same type of fabrics were used for evaporation tests in a saturated CuSO
4·5H
2O solution. The values of the evaporation rates determined in the zone of maximum evaporation can be seen in
Figure 14. Although the time for complete evaporation after five cycles of operation increases dramatically compared to the saturated NaCl solution tests, the evaporation rate shows higher average values than the NaCl solution. This effect is mainly due to the vapor pressure of each solution at the temperature at which each test was performed. In this case, the vapor pressure associated with CuSO
4·5H
2O is higher than that of NaCl at the same temperature. This effect causes the evaporation rate of the water to be faster until it reaches the crystallization state of the salts, where the time for complete evaporation of the CuSO
4·5H
2O salt is higher than that of NaCl at the same temperature.
As seen in the results obtained, the maximum evaporation rate obtained in the first cycles of the tests carried out for the CuSO4·5H2O salt is not drastically affected, like the NaCl salt, showing a reduction as the evaporation cycles increase. The Bam sample stands out due to its small weight, causing the CuSO4·5H2O salt to crystallize within the fabric structure and completely block the gaps between the fibers, which reduces its evaporation rate. This is because it absorbs little solution and quickly moves to the crystallization phase. On the other hand, the WL-T fabric slightly increases its evaporation rate because the fibers on its surface are not completely blocked and the surface roughness is able to retain some more solution in its structure without reaching the crystallization phase.
Although the drying times for the fabrics in the presence of the saturated CuSO
4·5H
2O solution are longer, we focused on the initial evaporation phase, where the salt has not yet precipitated, and the evaporation rates remain stable initially, decreasing in the later cycles. This is due to the high vapor pressure of CuSO
4·5H
2O, which is similar to that of pure water at temperatures of 20–25 °C until the nucleation phase. De Castelnuovo et al. [
63] and Saig et al. [
64] explain the dehydration mechanisms of CuSO
4·5H
2O in equilibrium with CuSO
4·3H
2O + 2H
2O, highlighting that at high temperatures, excess water converts to gas and reabsorbs to maintain equilibrium. This could explain the slow drying observed in experiments with high evaporation cycles. Additionally, Donkers et al. [
65] demonstrated through thermal decomposition by thermogravimetric analysis (TGA) that CuSO
4·5H
2O is highly stable with its five water molecules, indicating that excess water can be eliminated while decomposition does not occurs, achieving high evaporation rates.
It was decided to compare the evaporation rates between cycles and saturated salts used in the different fabrics in the first cycle (1C), the last cycle (15C), and in comparison with distilled water (
Table 9).
As can be observed, the tendency in the NaCl cycles is to increase the evaporation rate due to the increase in water absorption, even surpassing the evaporation rate of the CuSO4·5H2O solution despite having a lower vapor pressure than this solution. In contrast, the CuSO4·5H2O solution shows a slight reduction in its evaporation rate over the fifteen cycles calculated in the zone of the highest evaporation rate.
In view of the results obtained from the evaporation tests using natural and synthetic fabrics, a summary of the conditions that most affect the evaporation rate has been compiled. These factors are listed in
Table 10 in order of importance, considering that the evaporation tests were conducted with negligible or no air velocity.
When treating wastewater or saline water with a significant presence of salts, the factors mentioned in
Table 10 should be considered to select the fabric that best performs the process under study.


 ,
, 


 Experimental data;
  Apelblat, et al. [31,32,33,34,35];
  O’Brien, F. [36], Diesnis, M. [37], Adams, J.R. and A.R. Merz [38], Wexler, A. and S. Hasegawa [39];
  Antoine fitting curve).

 Chirife, J. and S.L. Resnik [46];
  Individual fitting;
  Average fitting;
  Patil-A;
  Patil-A/B;
  Patil-A/B/C;
  Shibue).
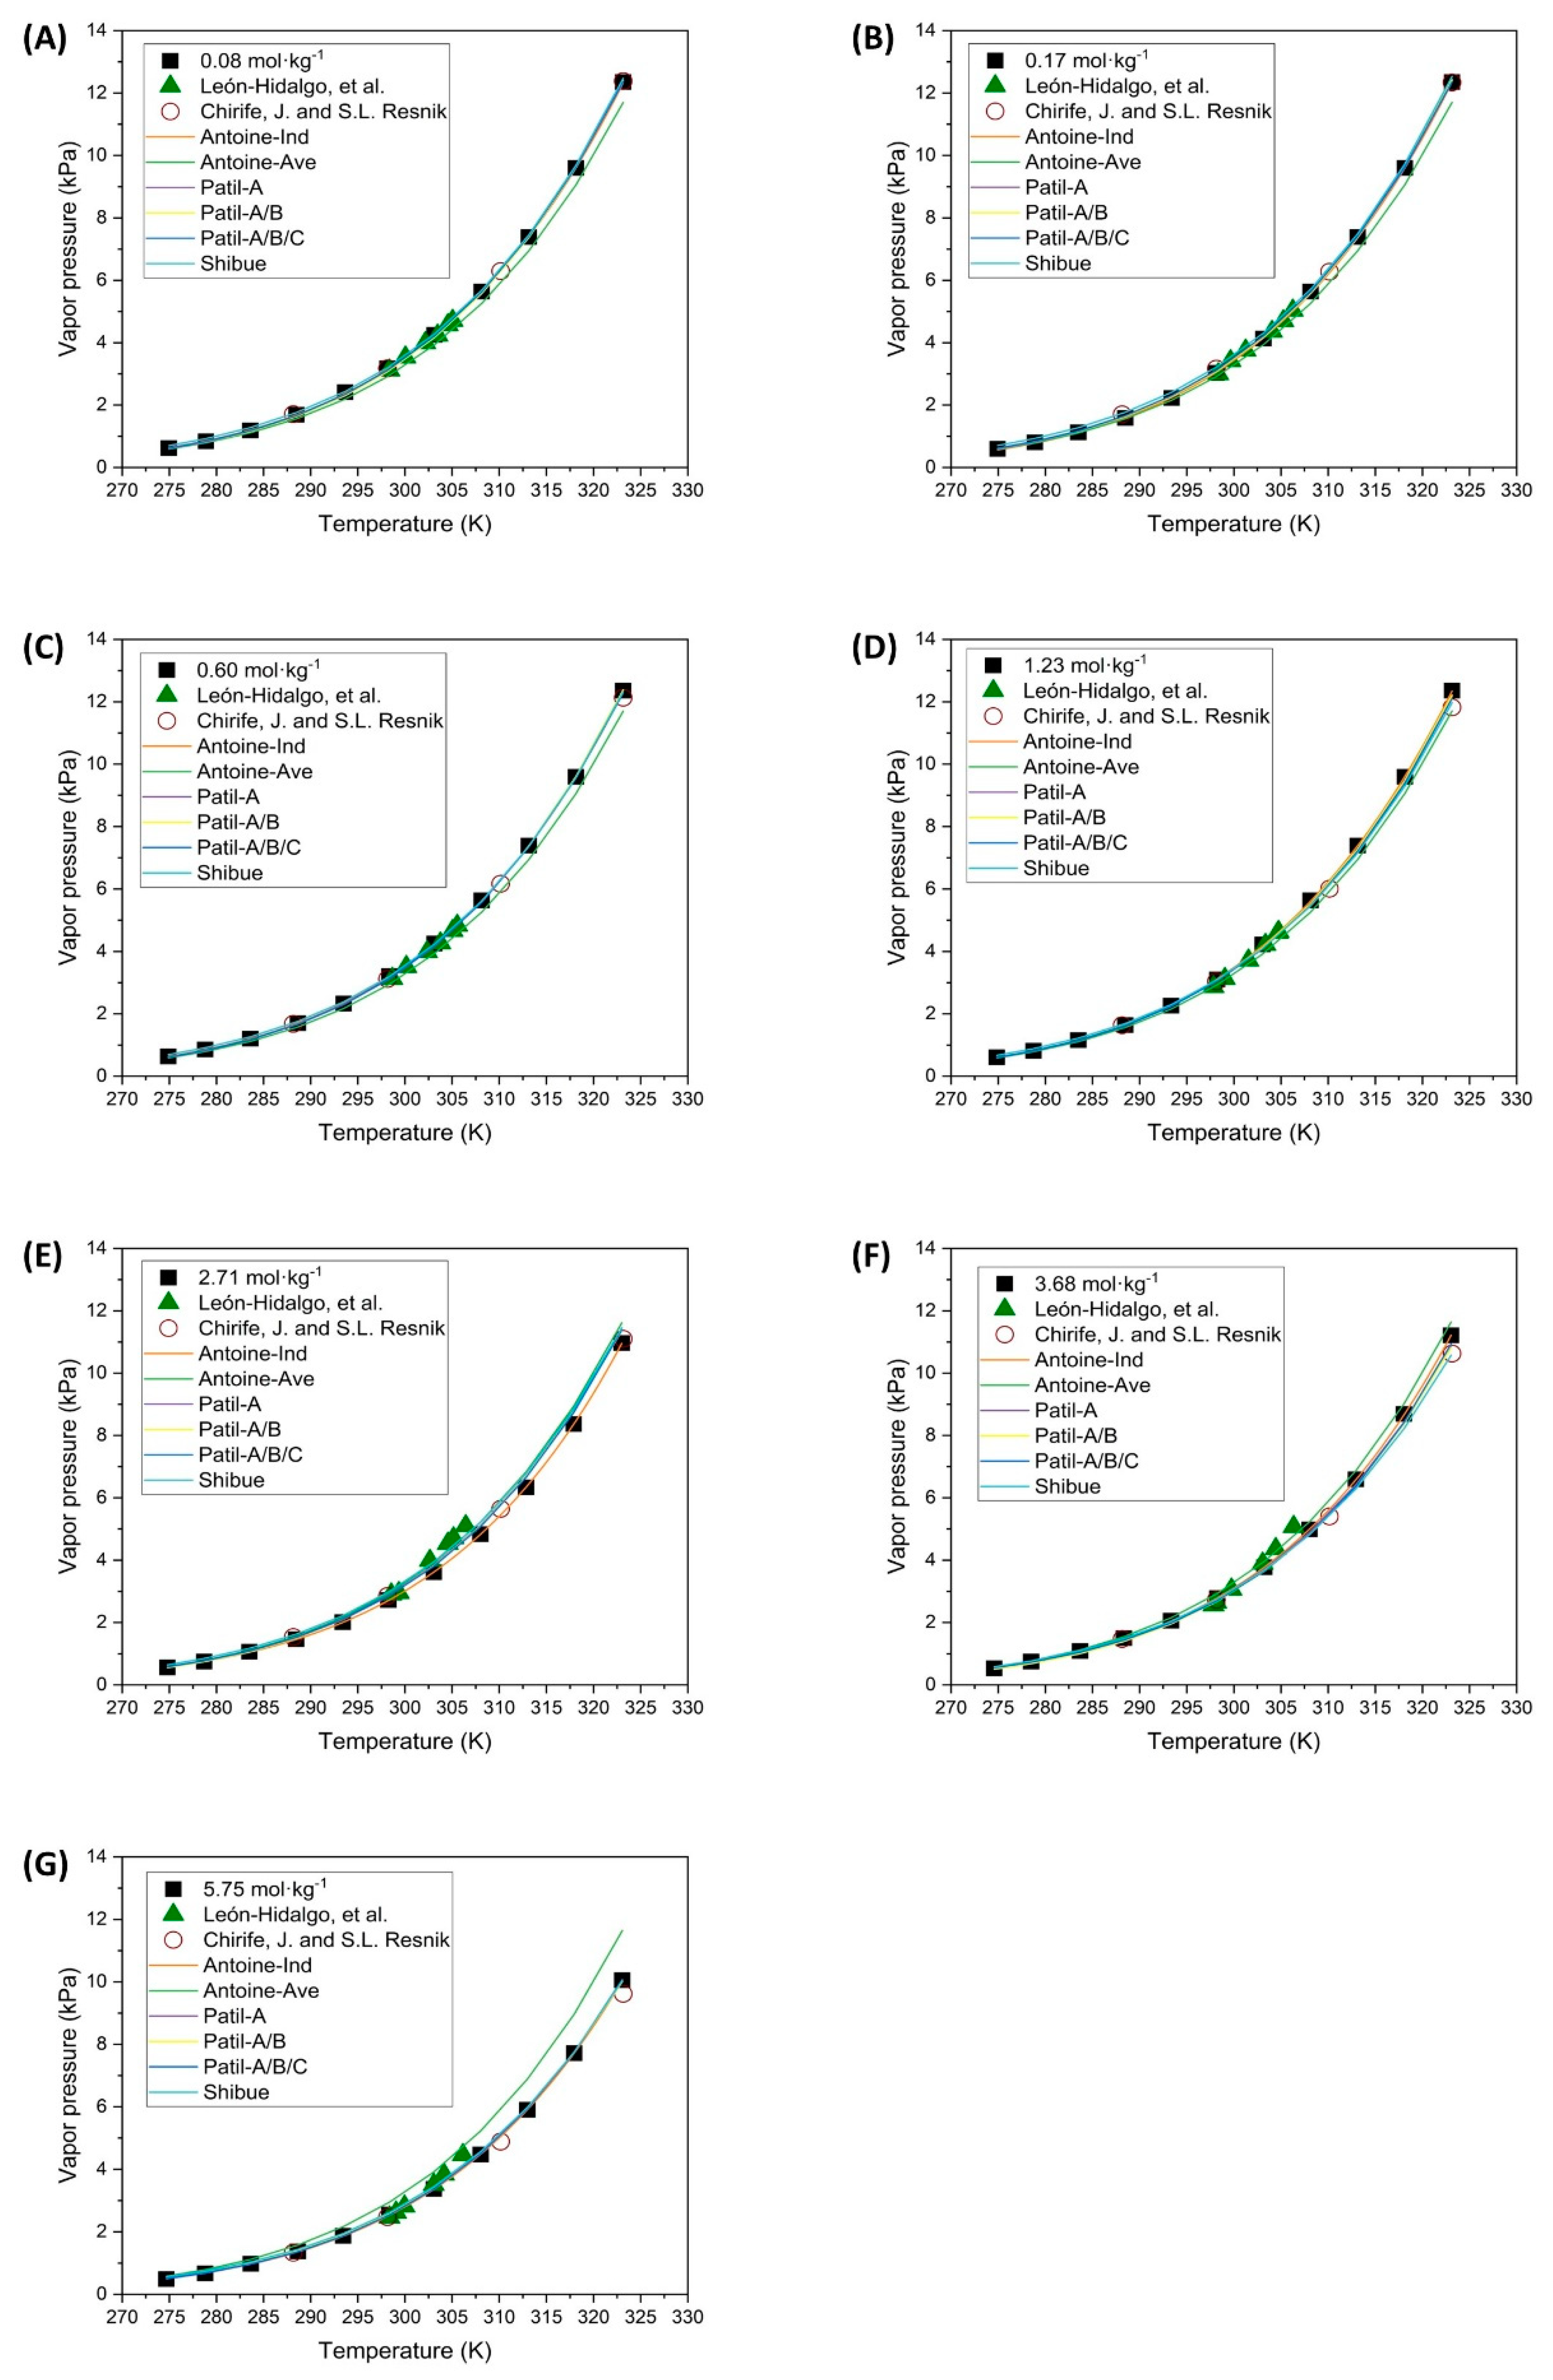
 Guendouzi, et al. [48]).
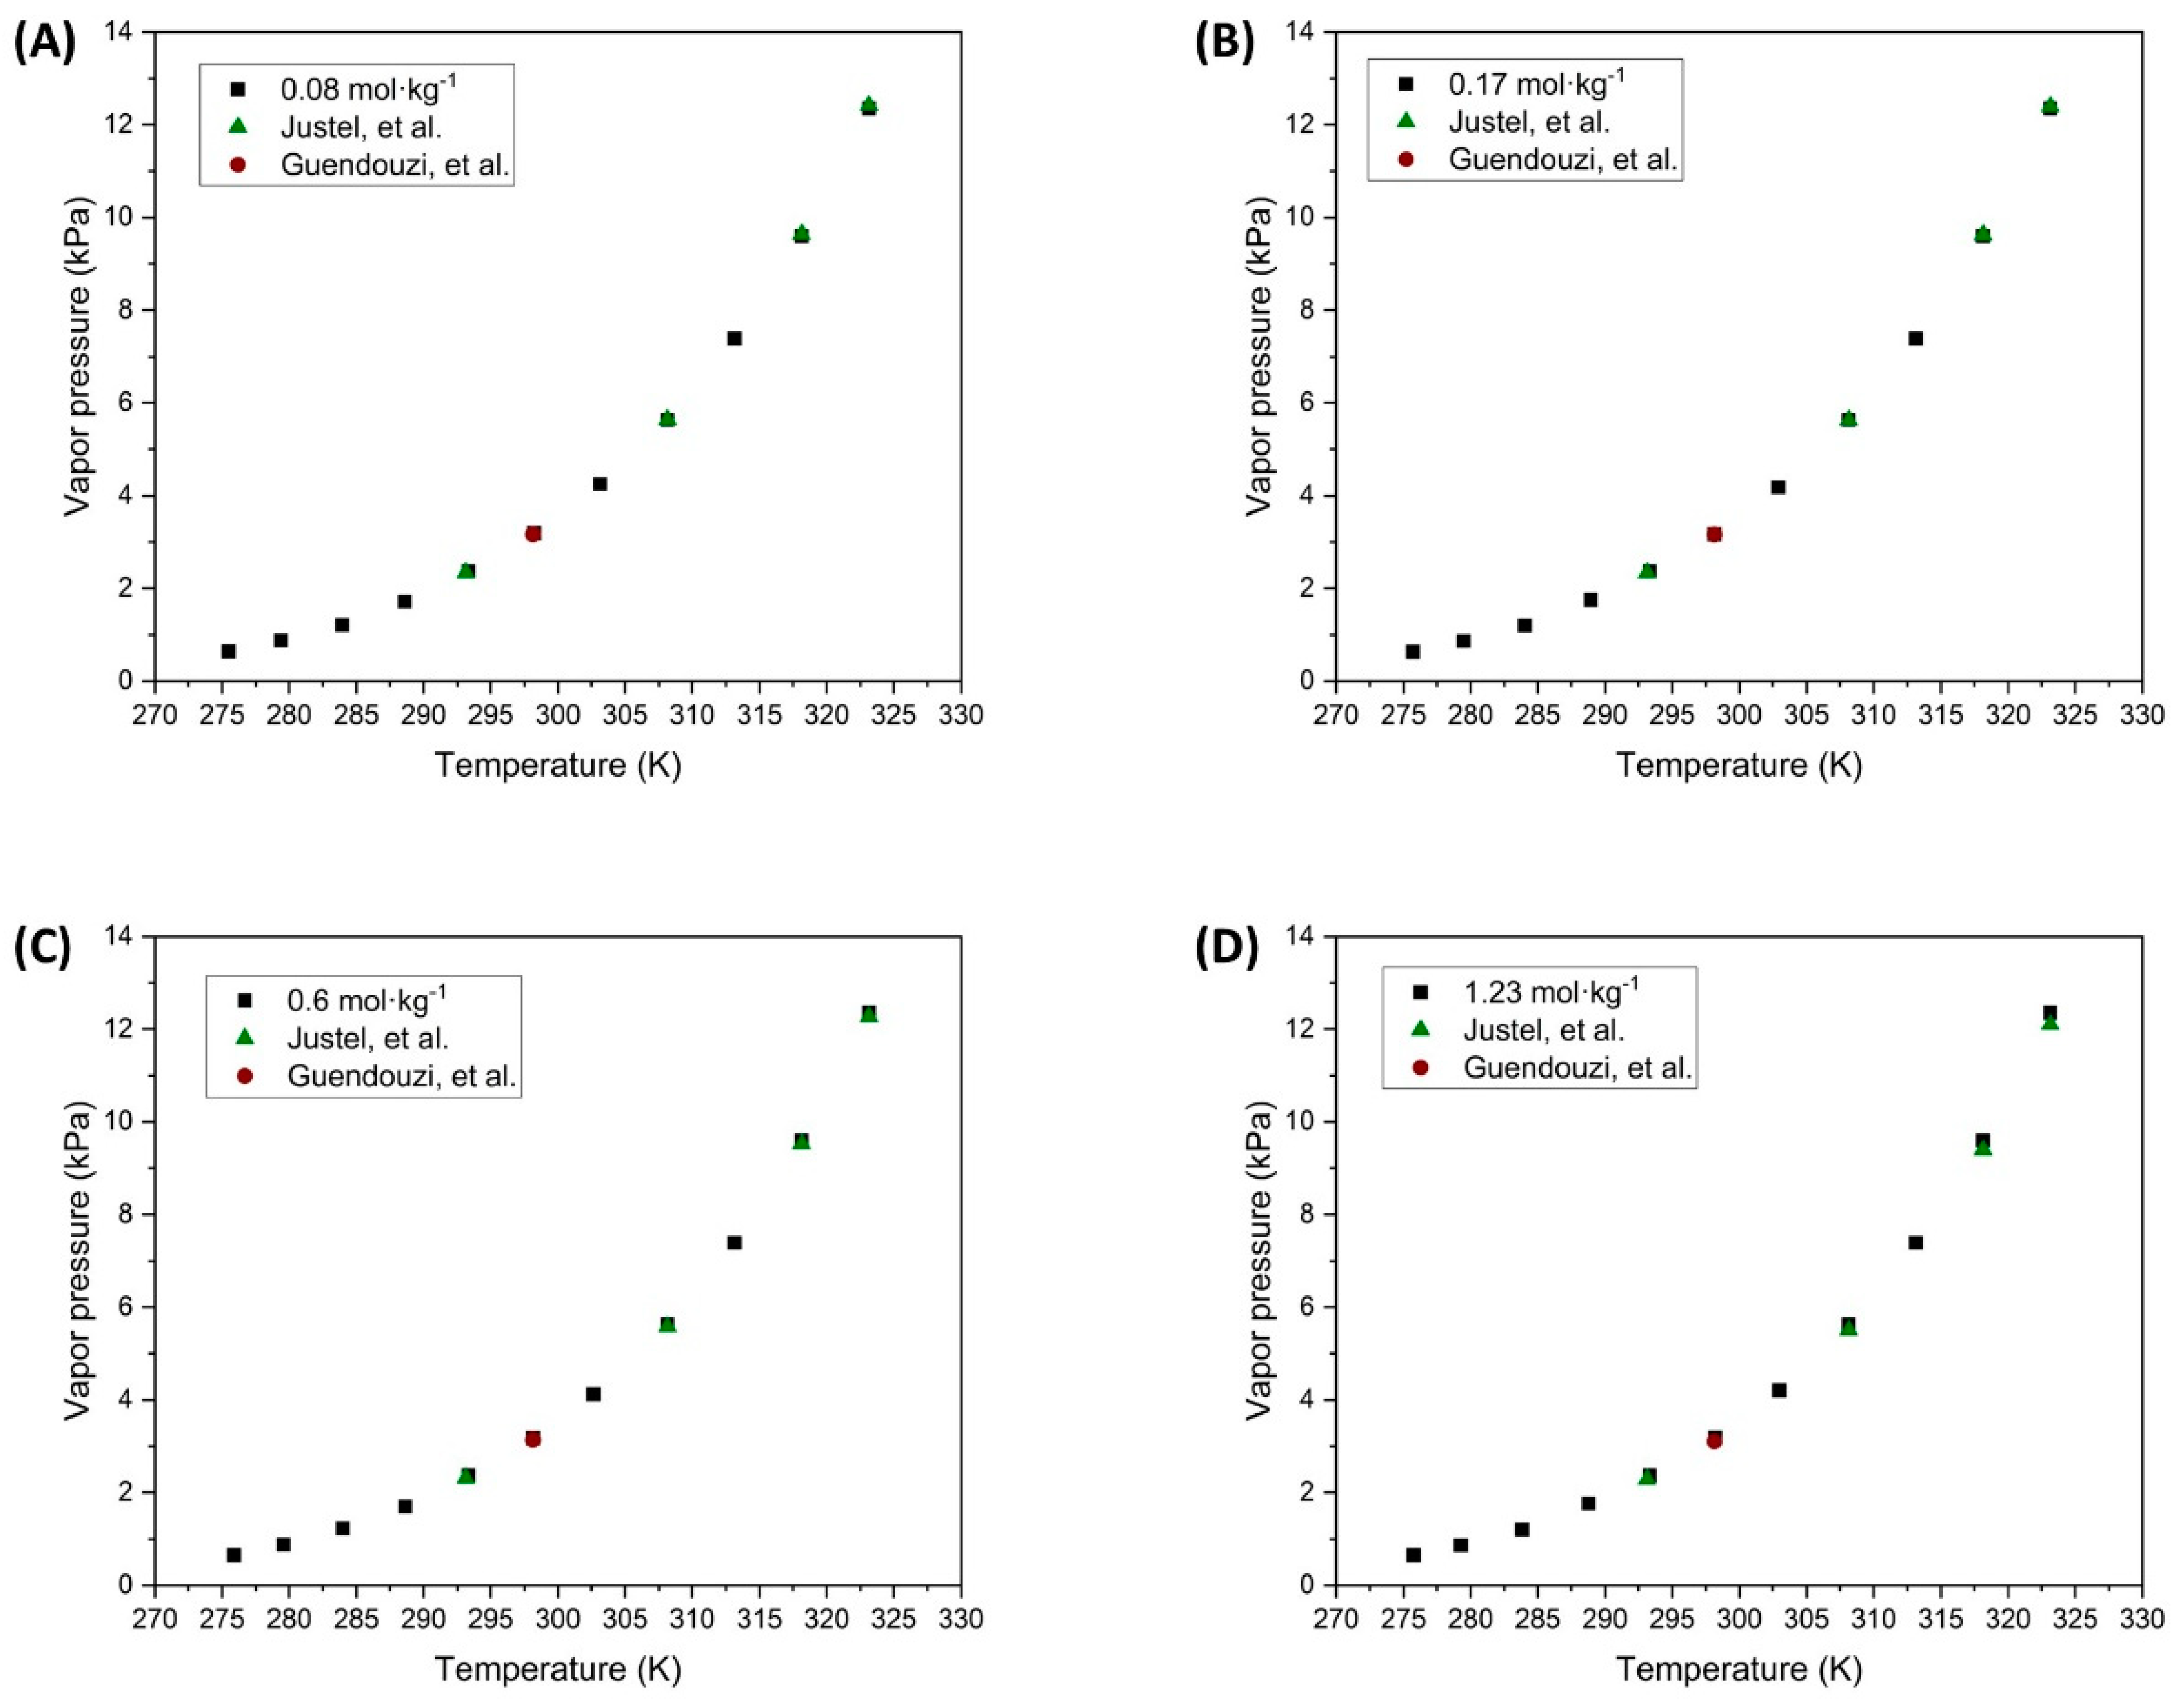
 S1 (141.2 mm2);
  S2 (1683.7 mm2);
  S3 (3452.4 mm2)).

 S1 (141.2 mm2);
  S2 (1683.7 mm2);
  S3 (3452.4 mm2)).
 Distilled water; Evaporation cycles
  15C).
15C).

