

Study of Injection Molding Process to Improve Geometrical Quality of Thick-Walled Polycarbonate Optical Lenses by Reducing Sink Marks


Abstract
1. Introduction
2. Materials and Methods
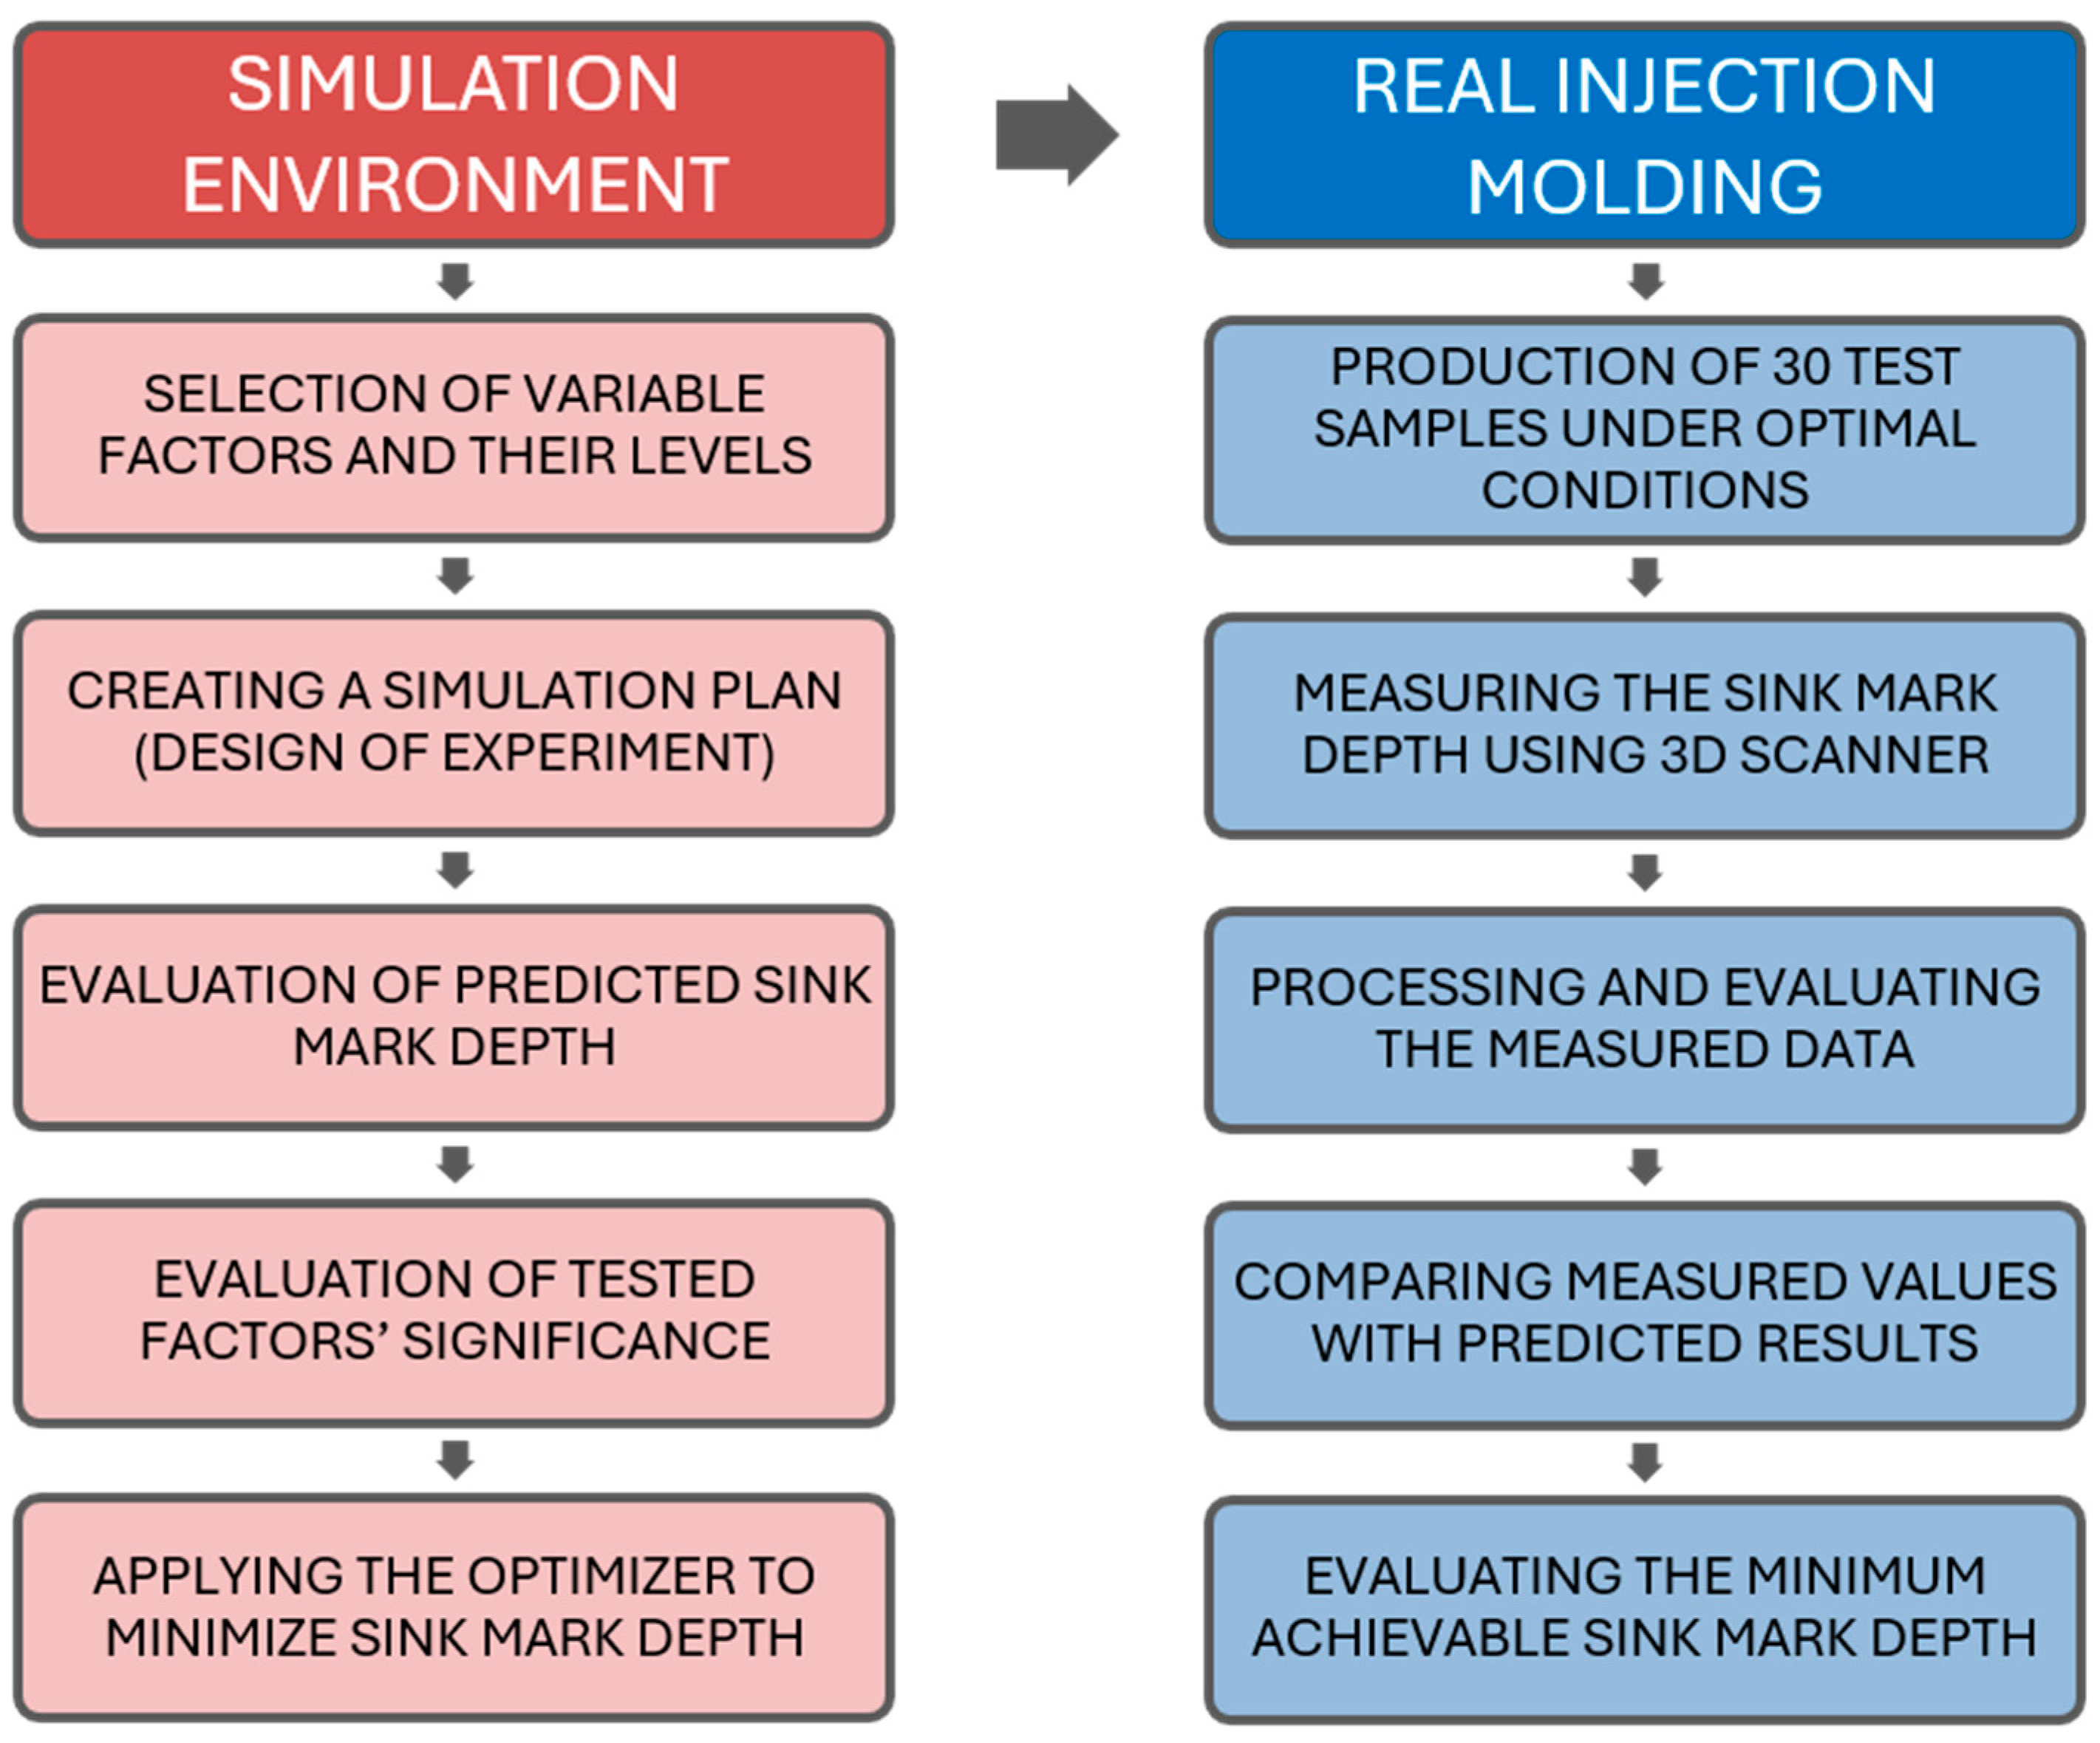
2.1. Overview of the Experiment
2.2. Materials
2.3. Software Tools and Technical Equipment
2.4. Design of Test Samples
2.5. Experimental Injection Mold
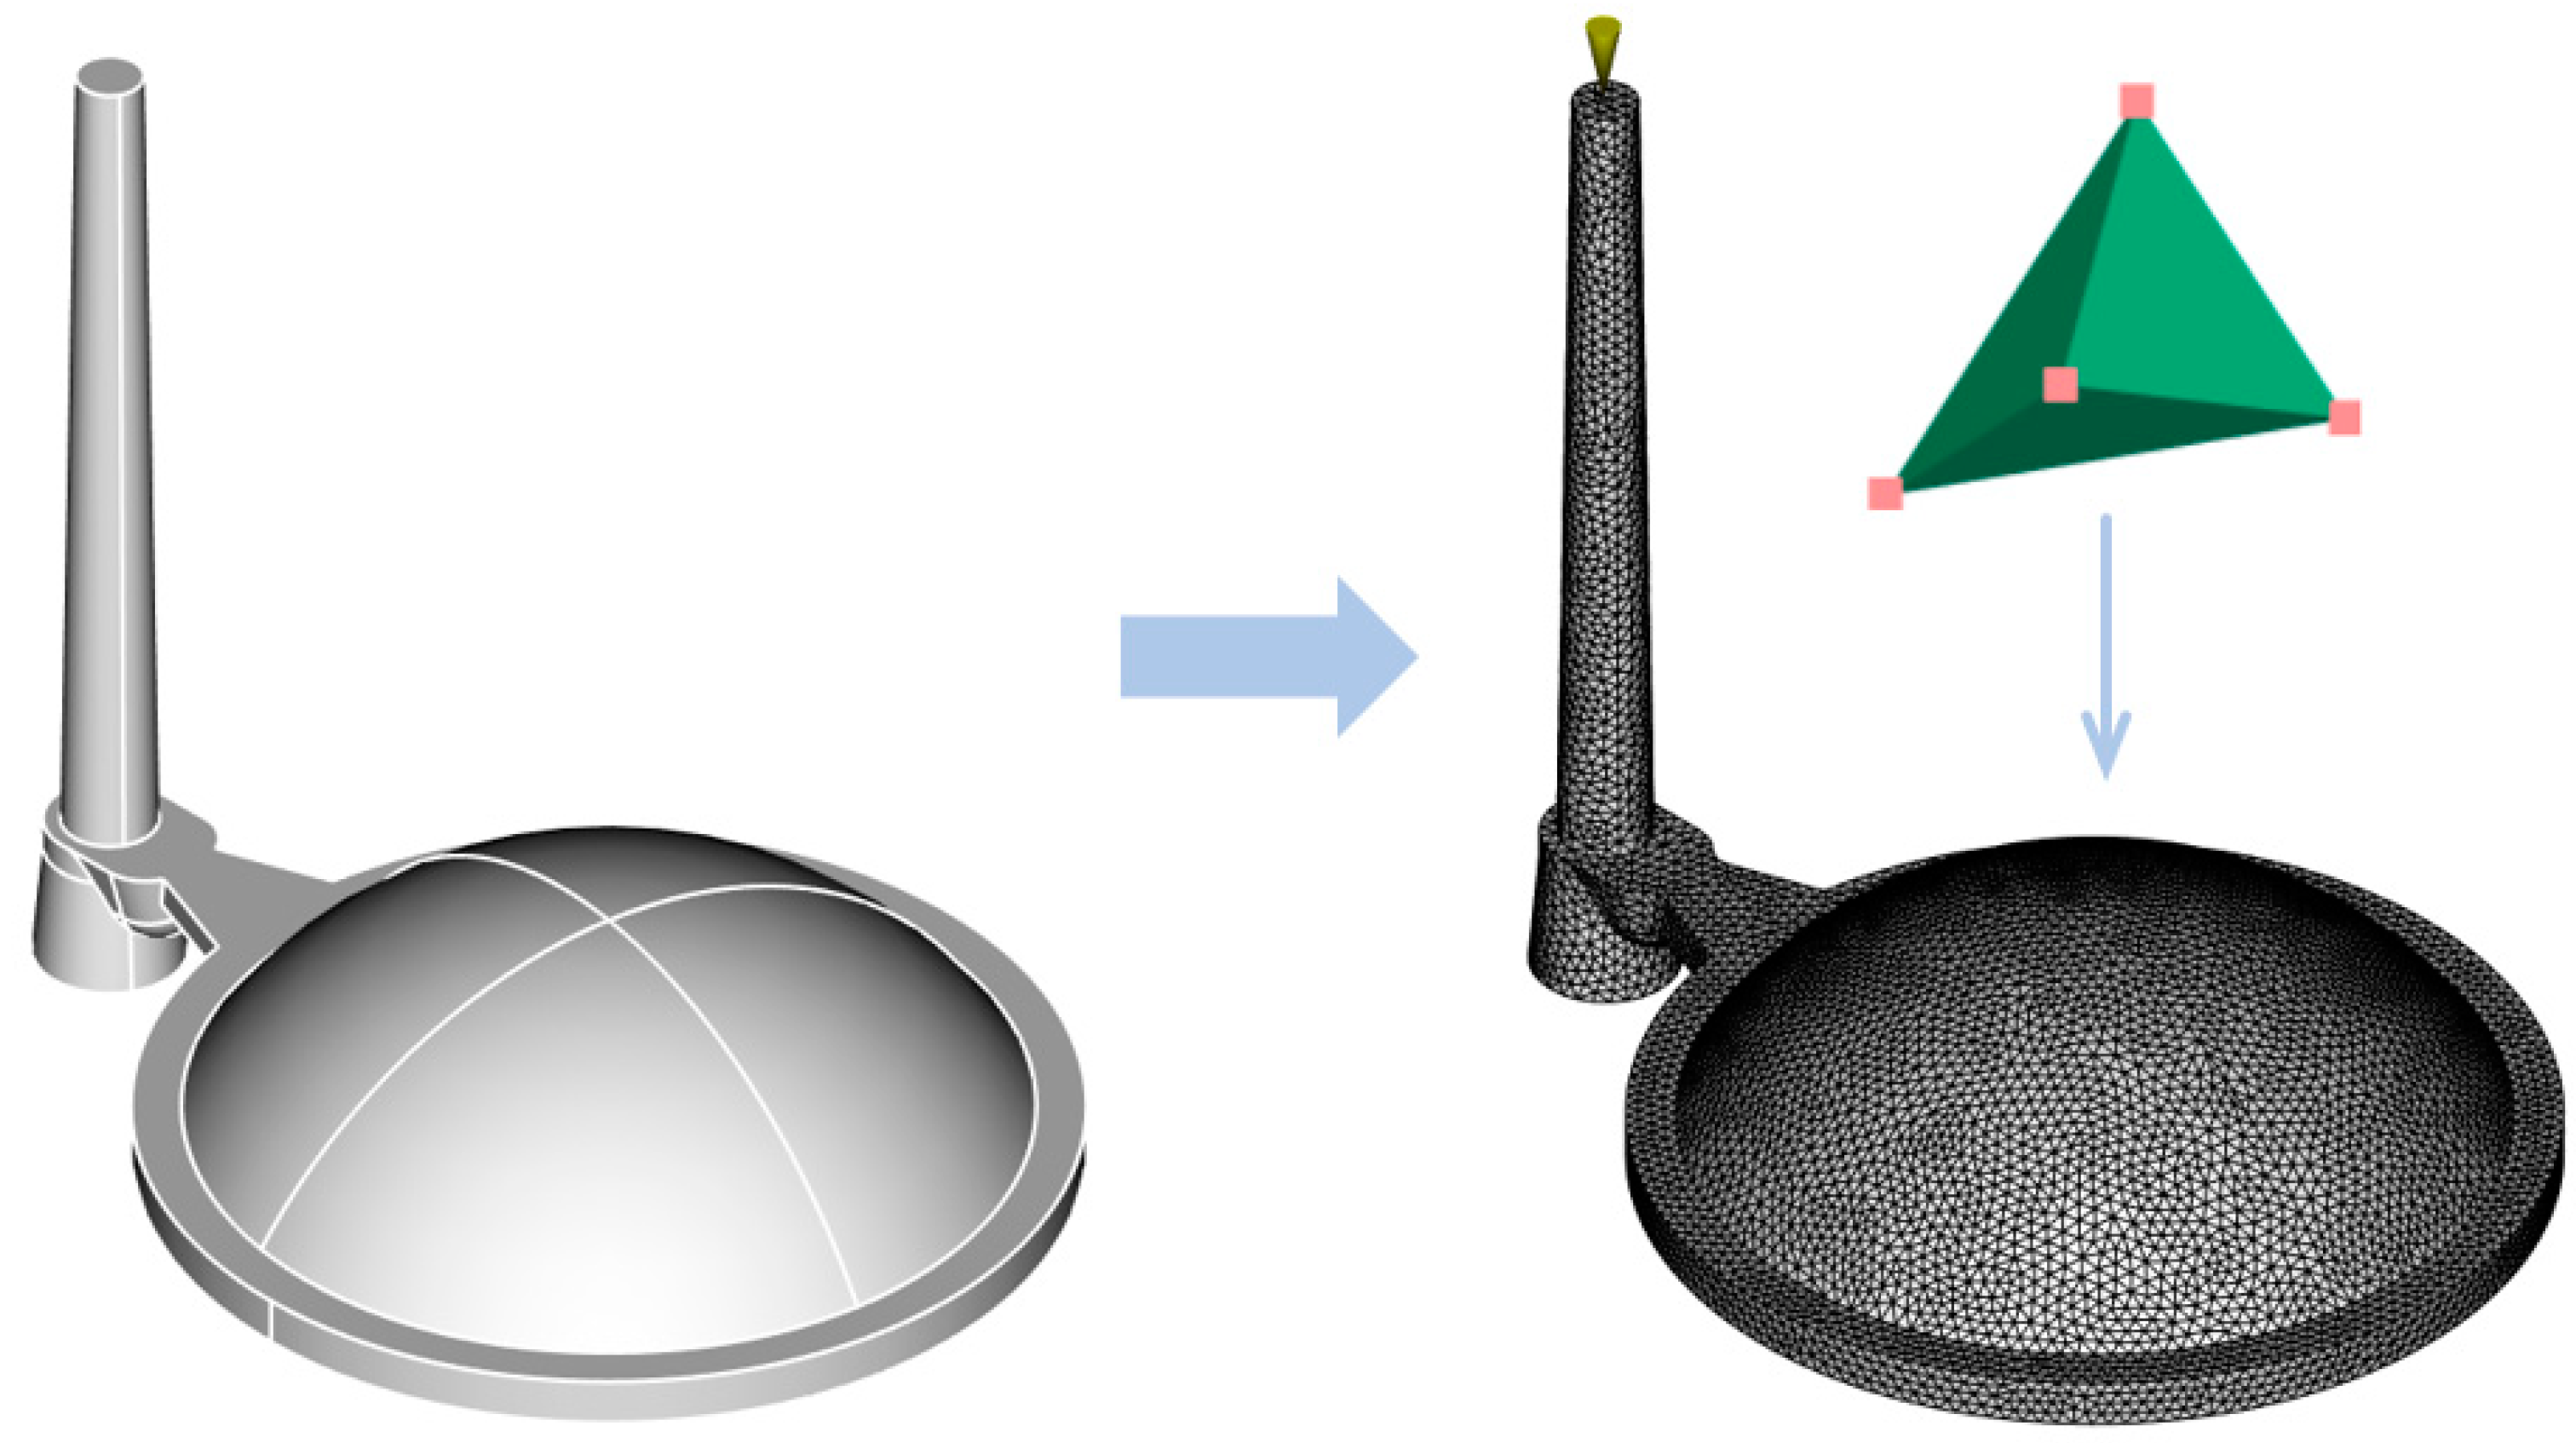
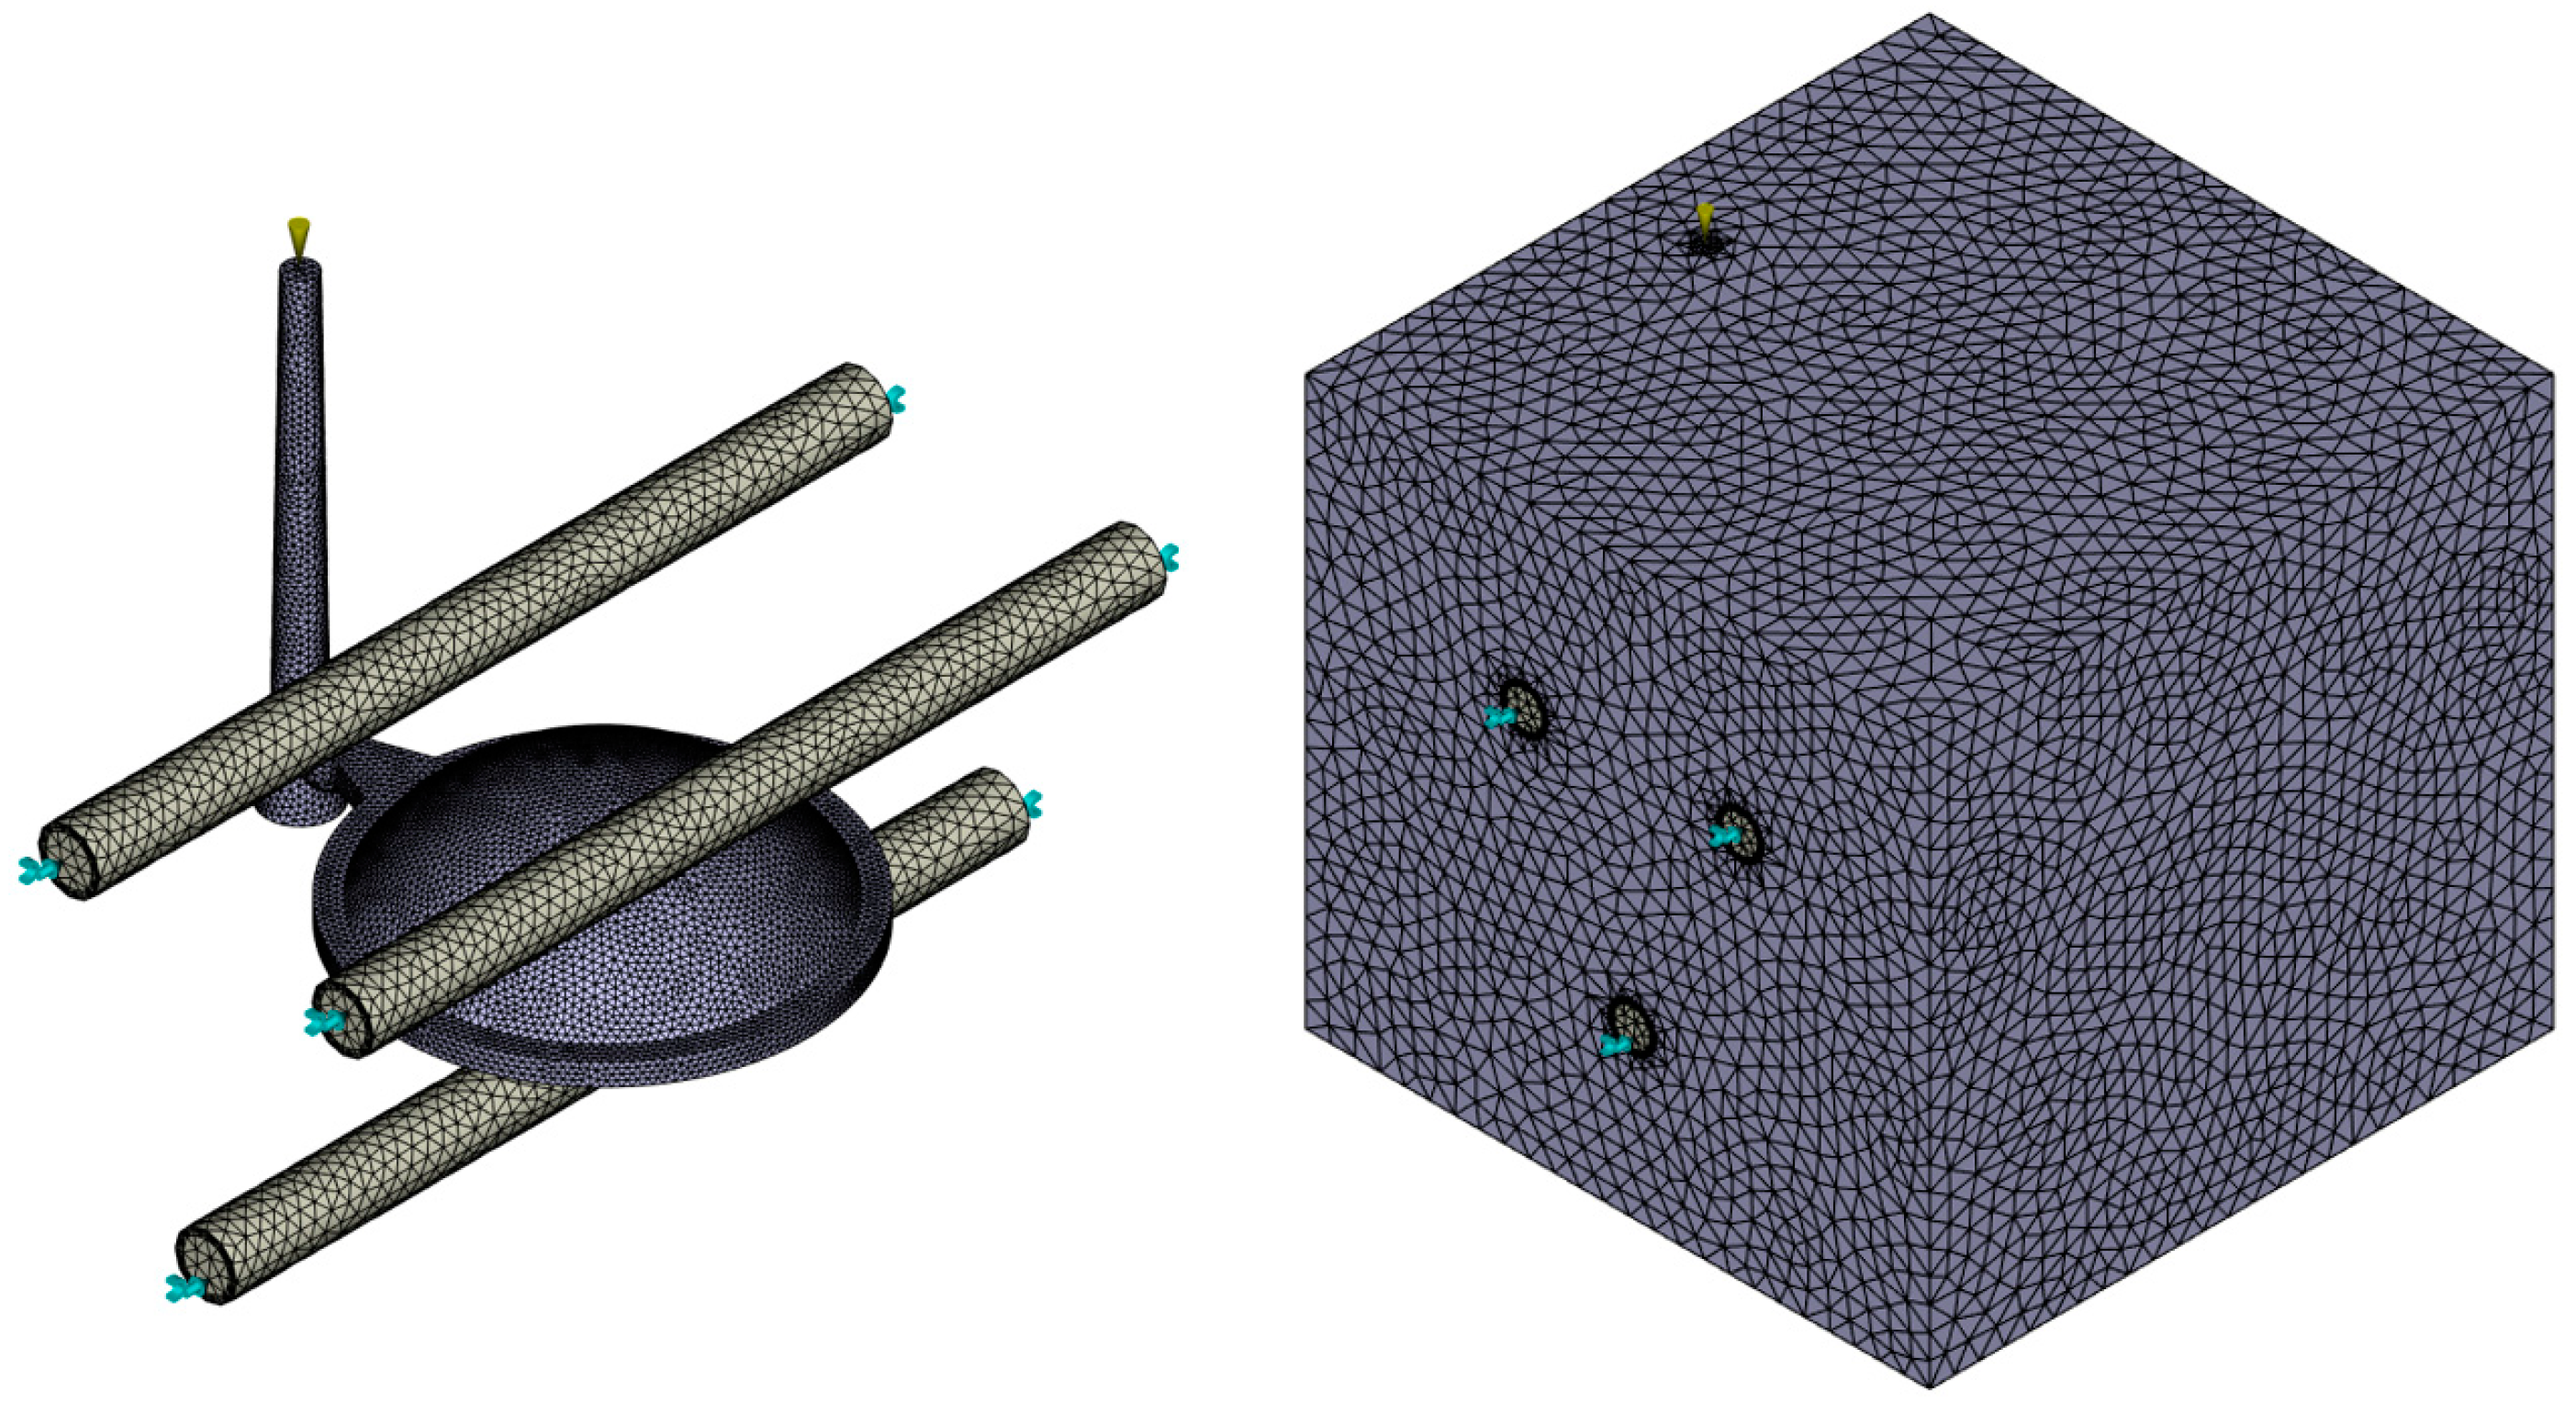
2.6. Preparation of Injection Molding Simulations
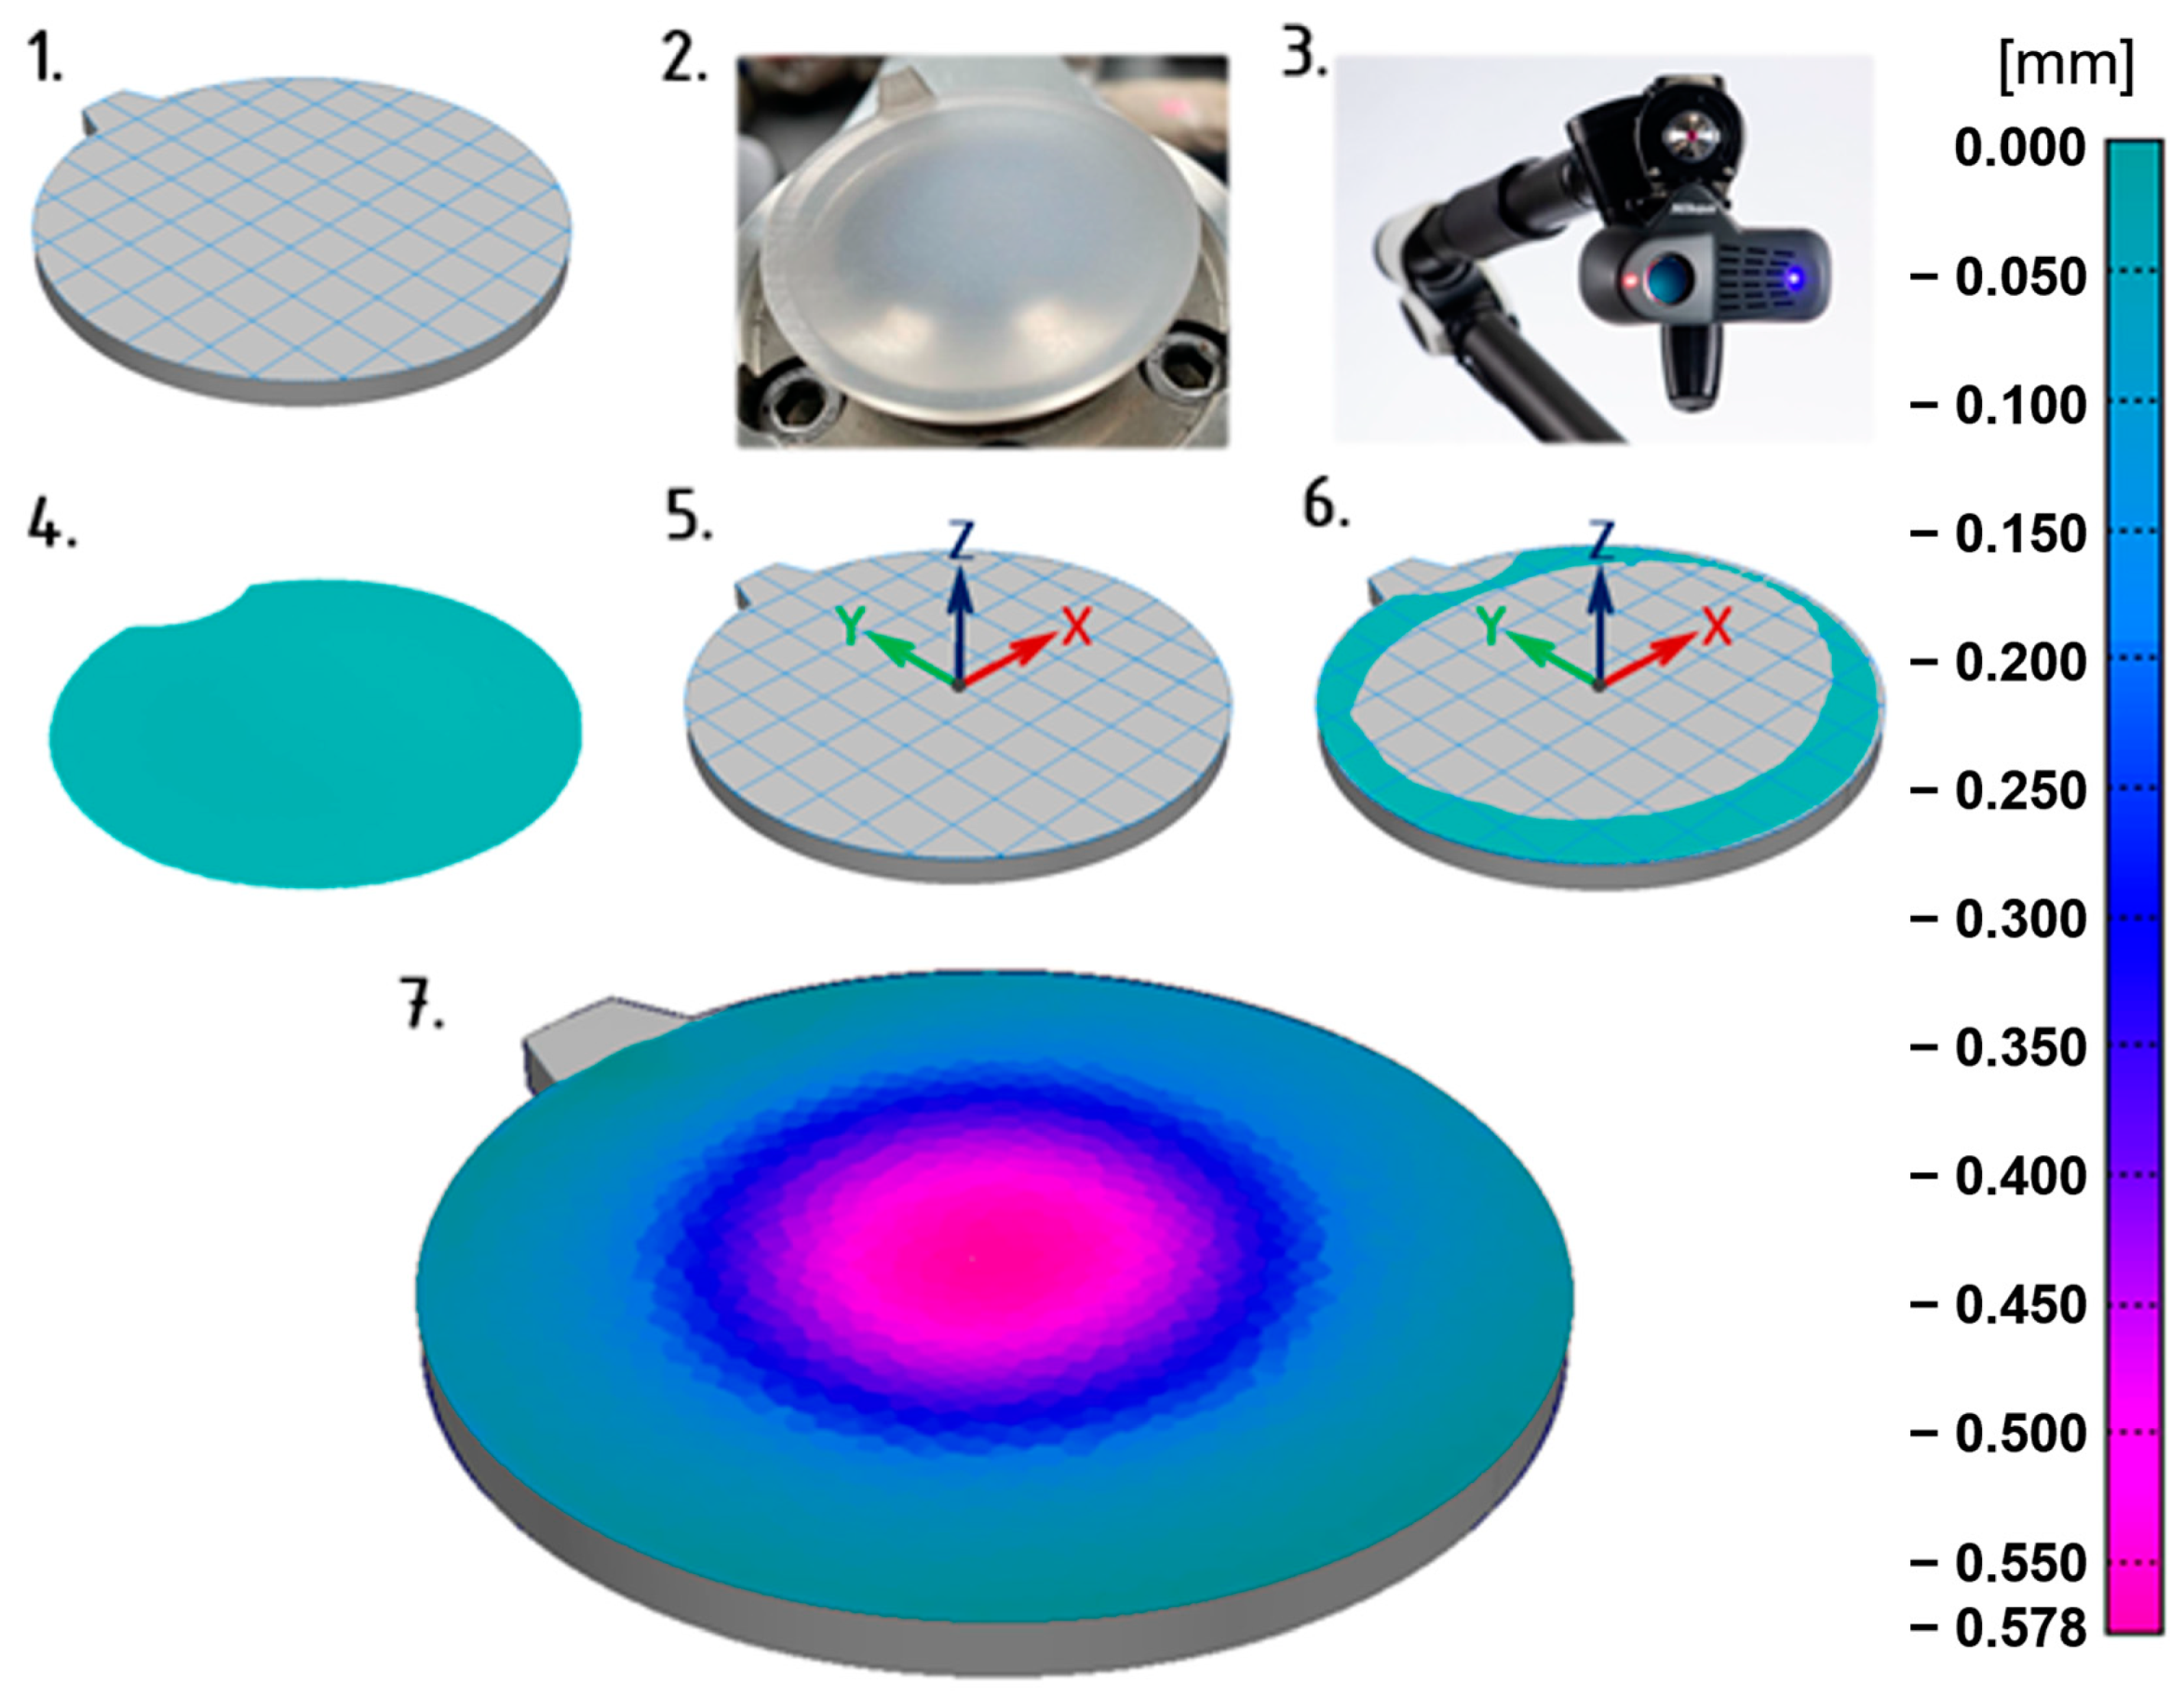
2.7. Procedure of 3D Scanning and Dimensional Inspection
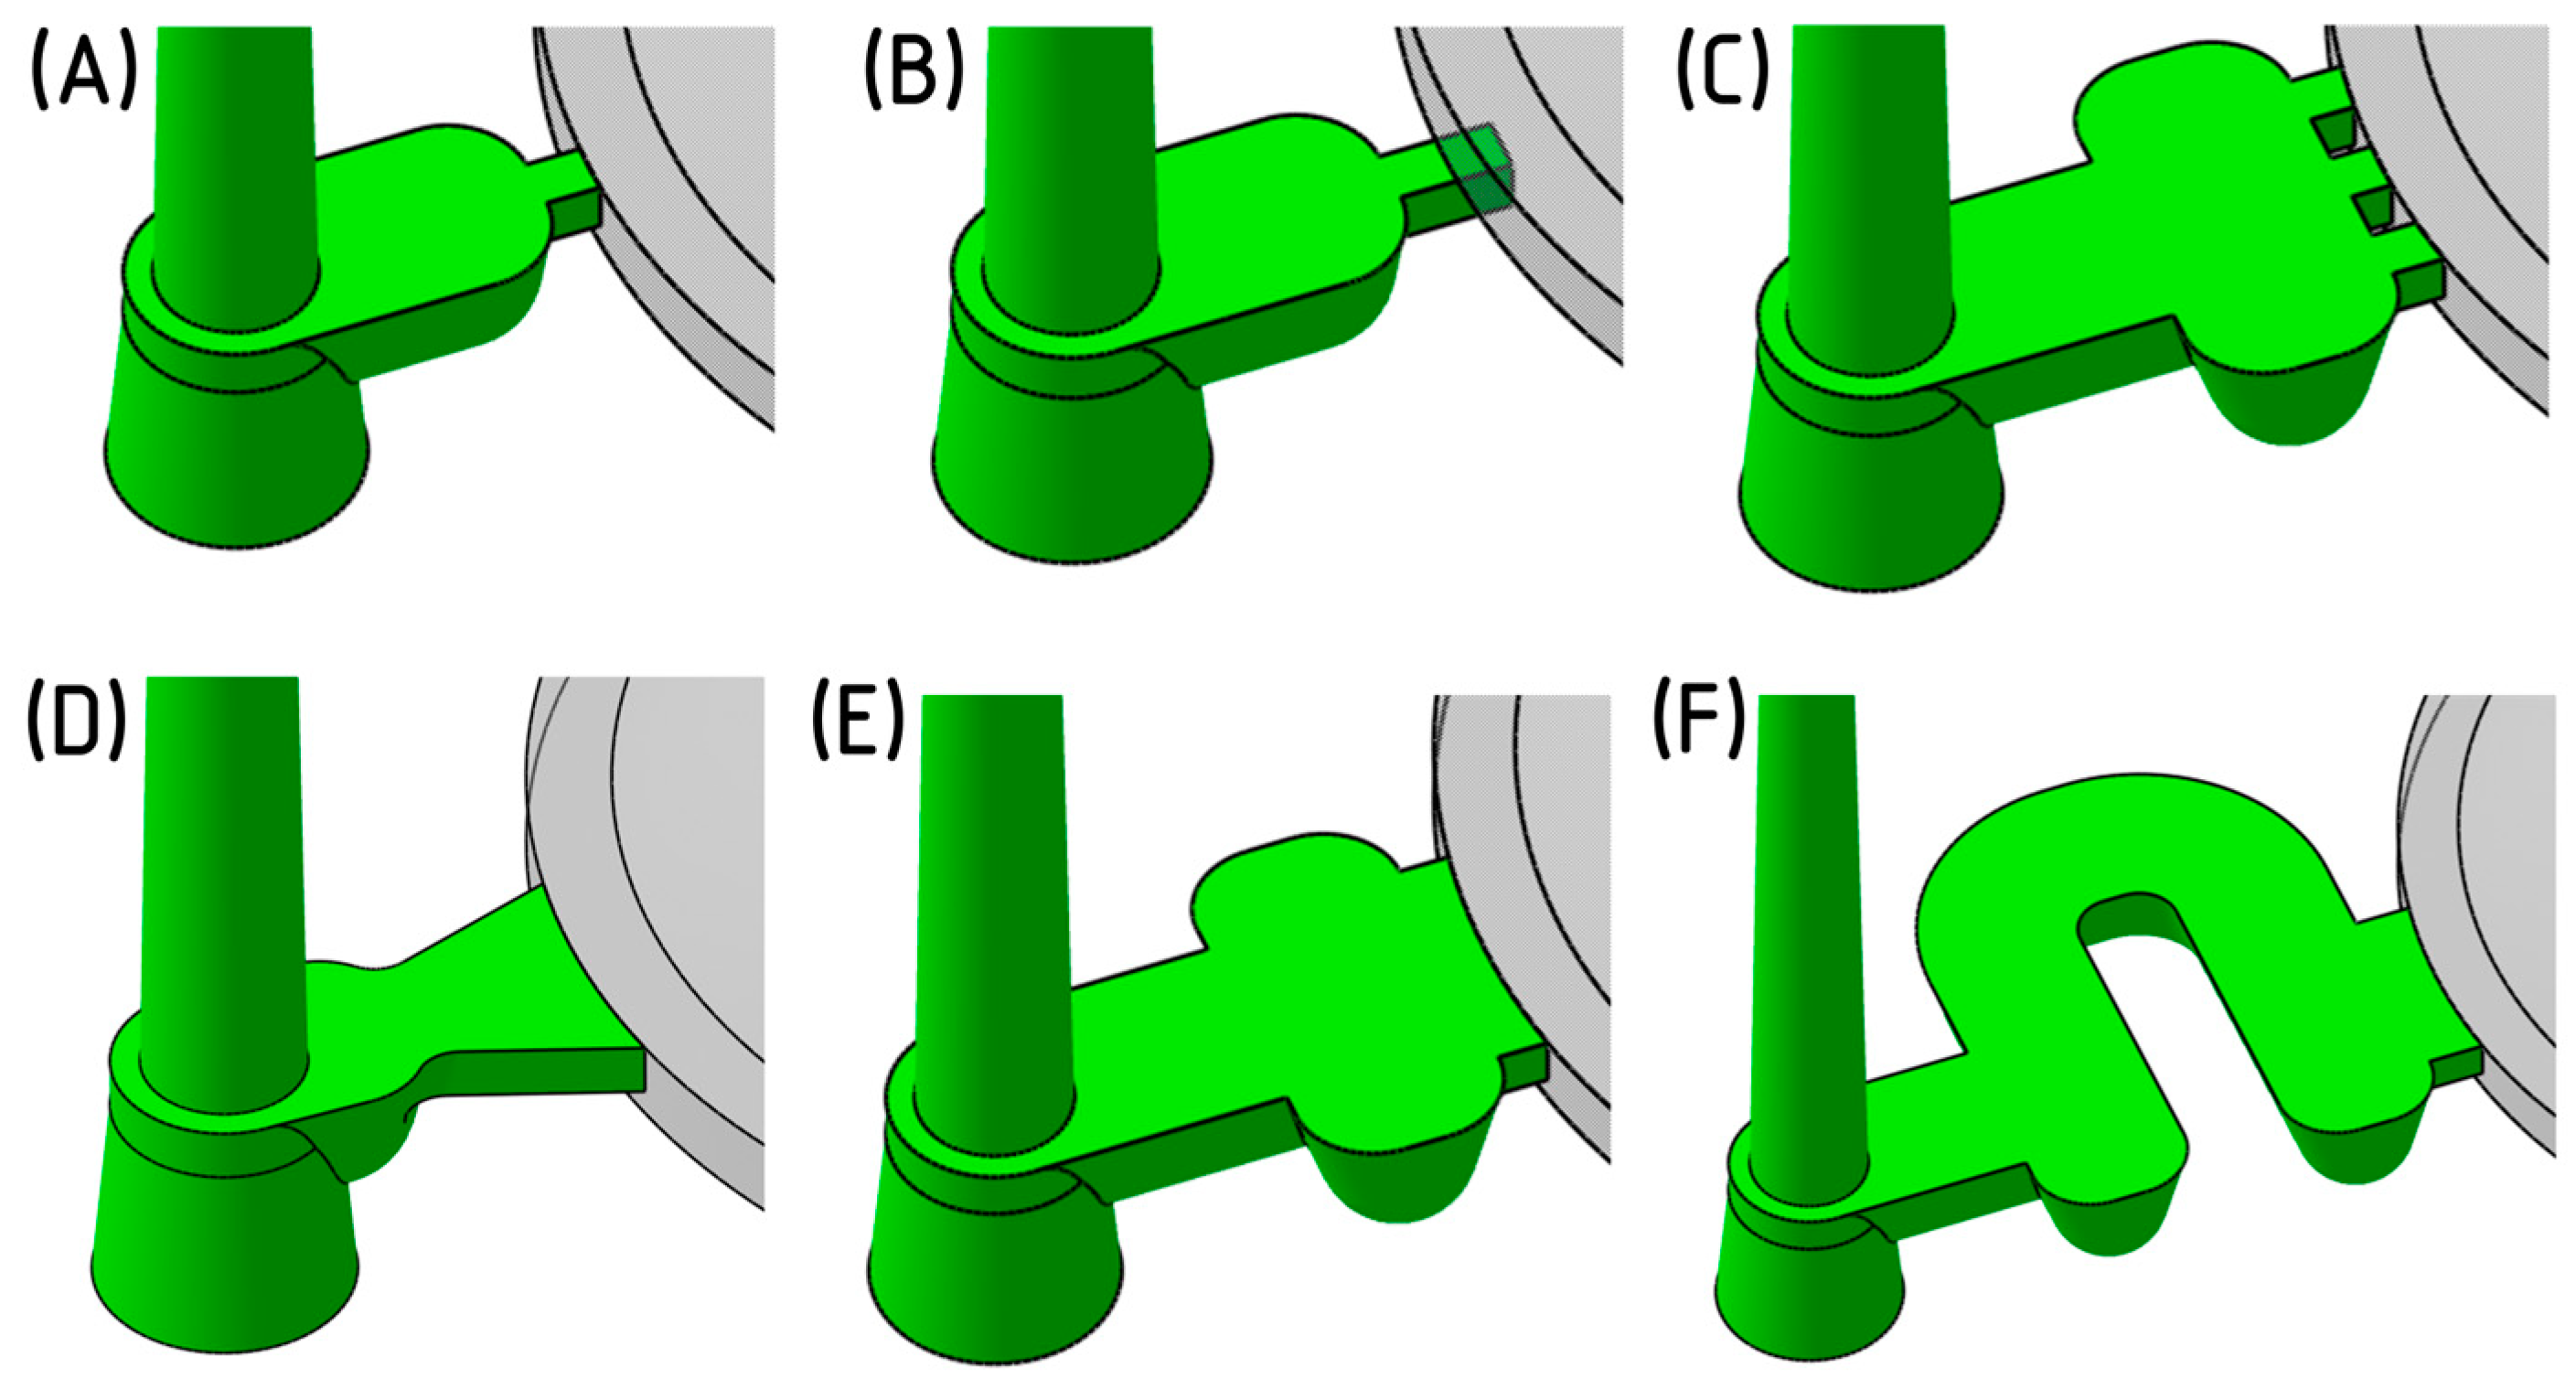
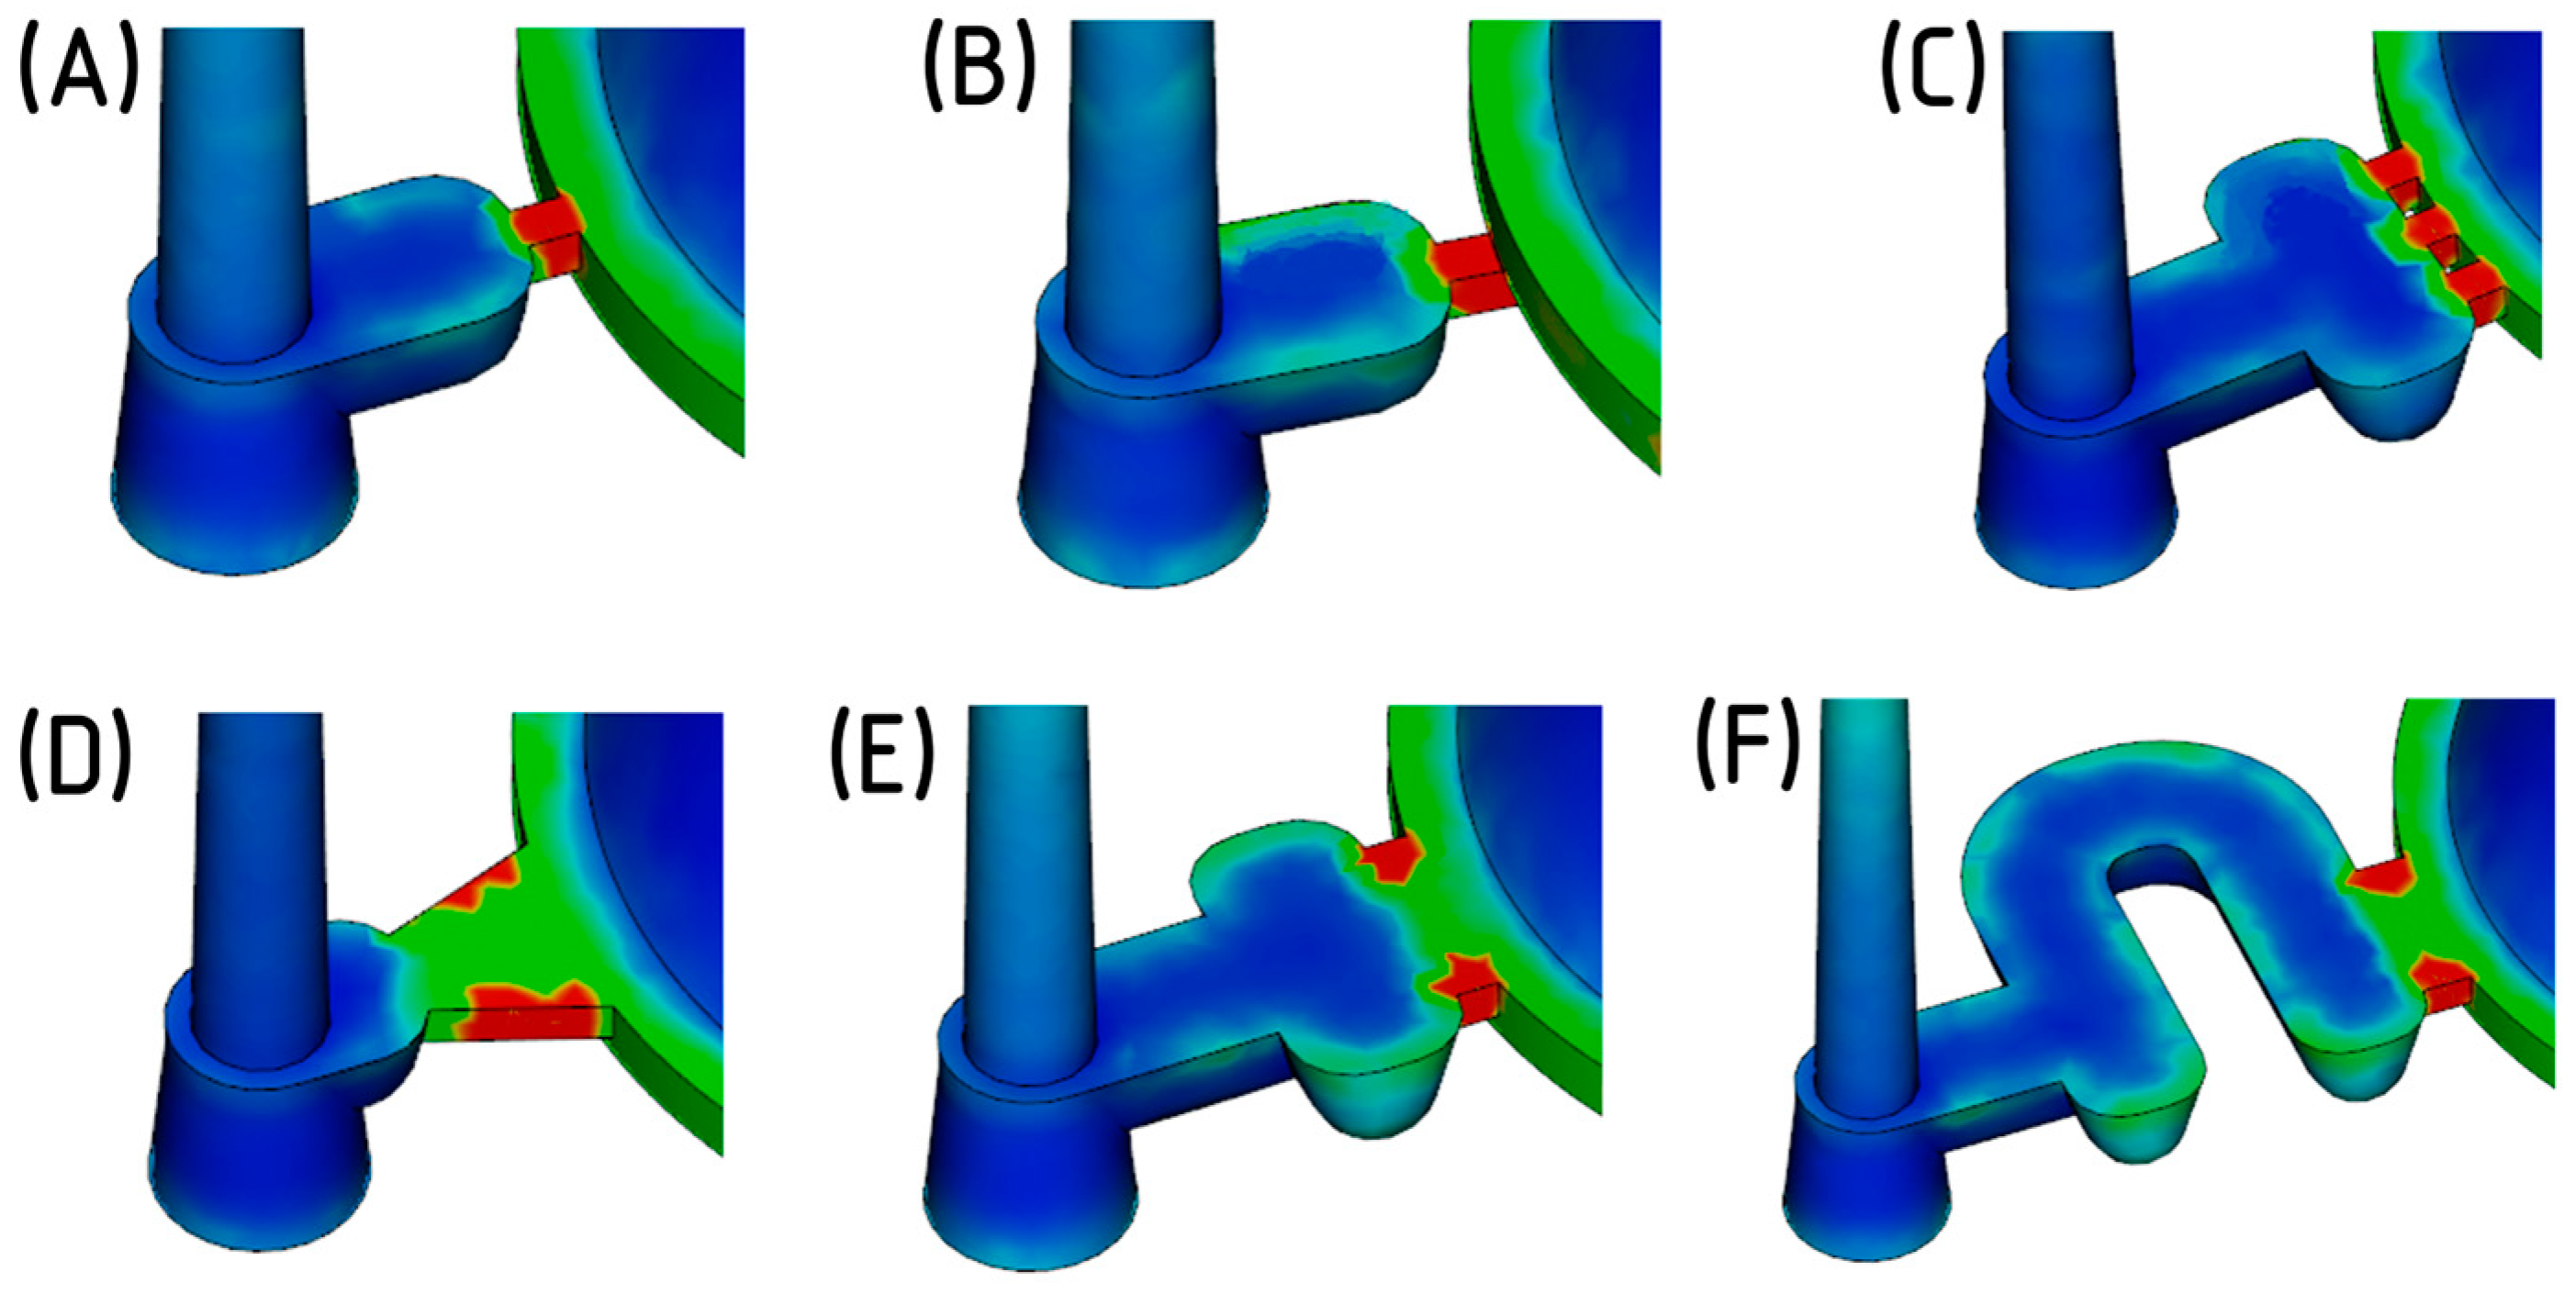
2.8. Evaluation and Selection of the Gate Geometry
3. Results
3.1. Initial Simulation Study
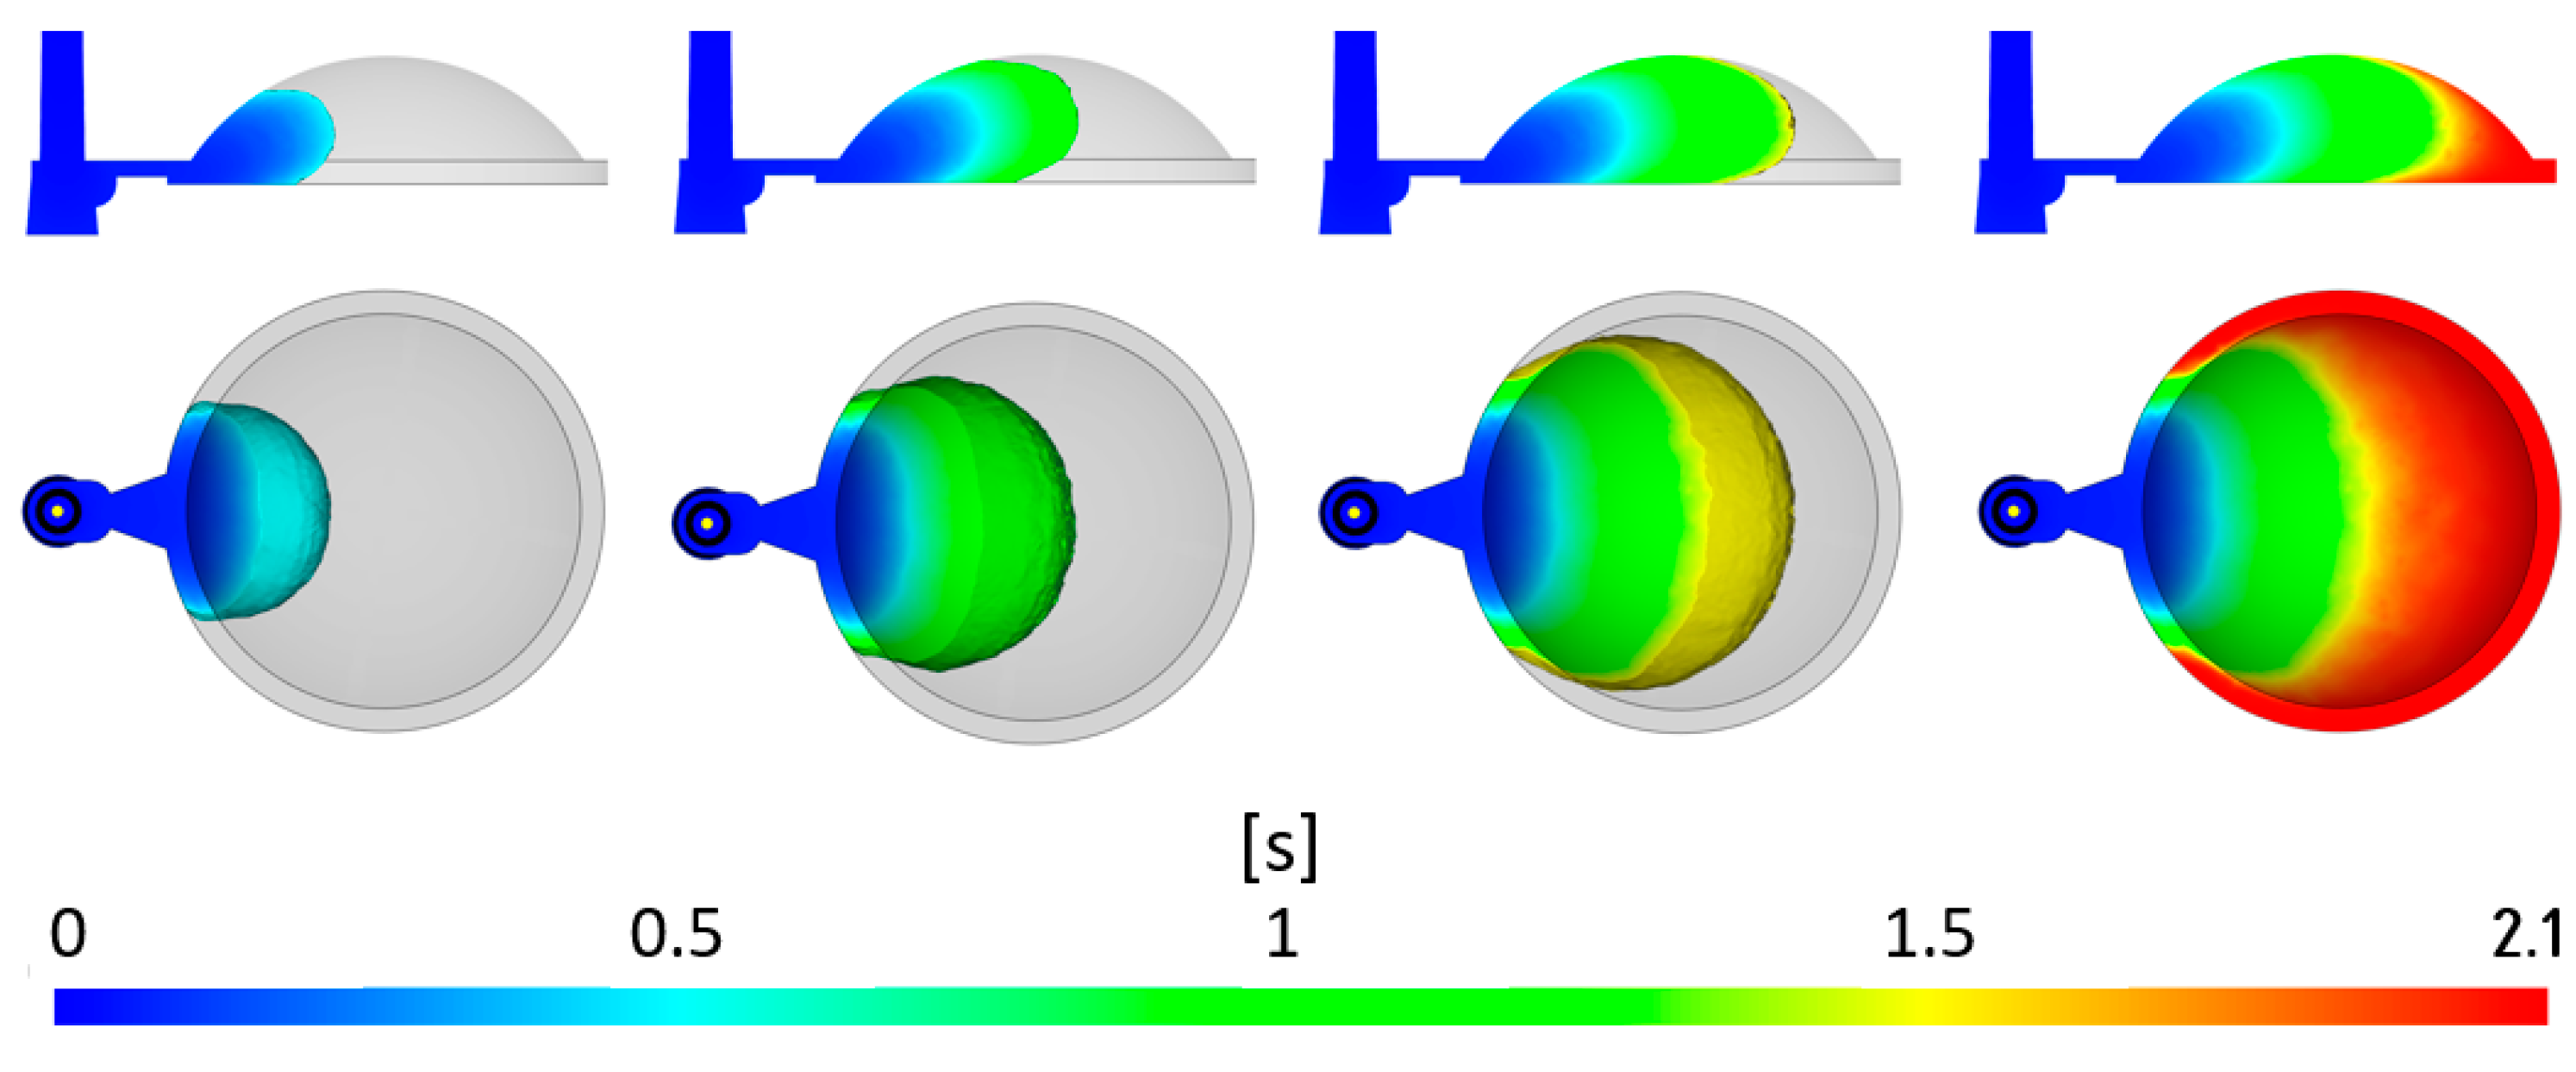
3.1.1. Fill Time
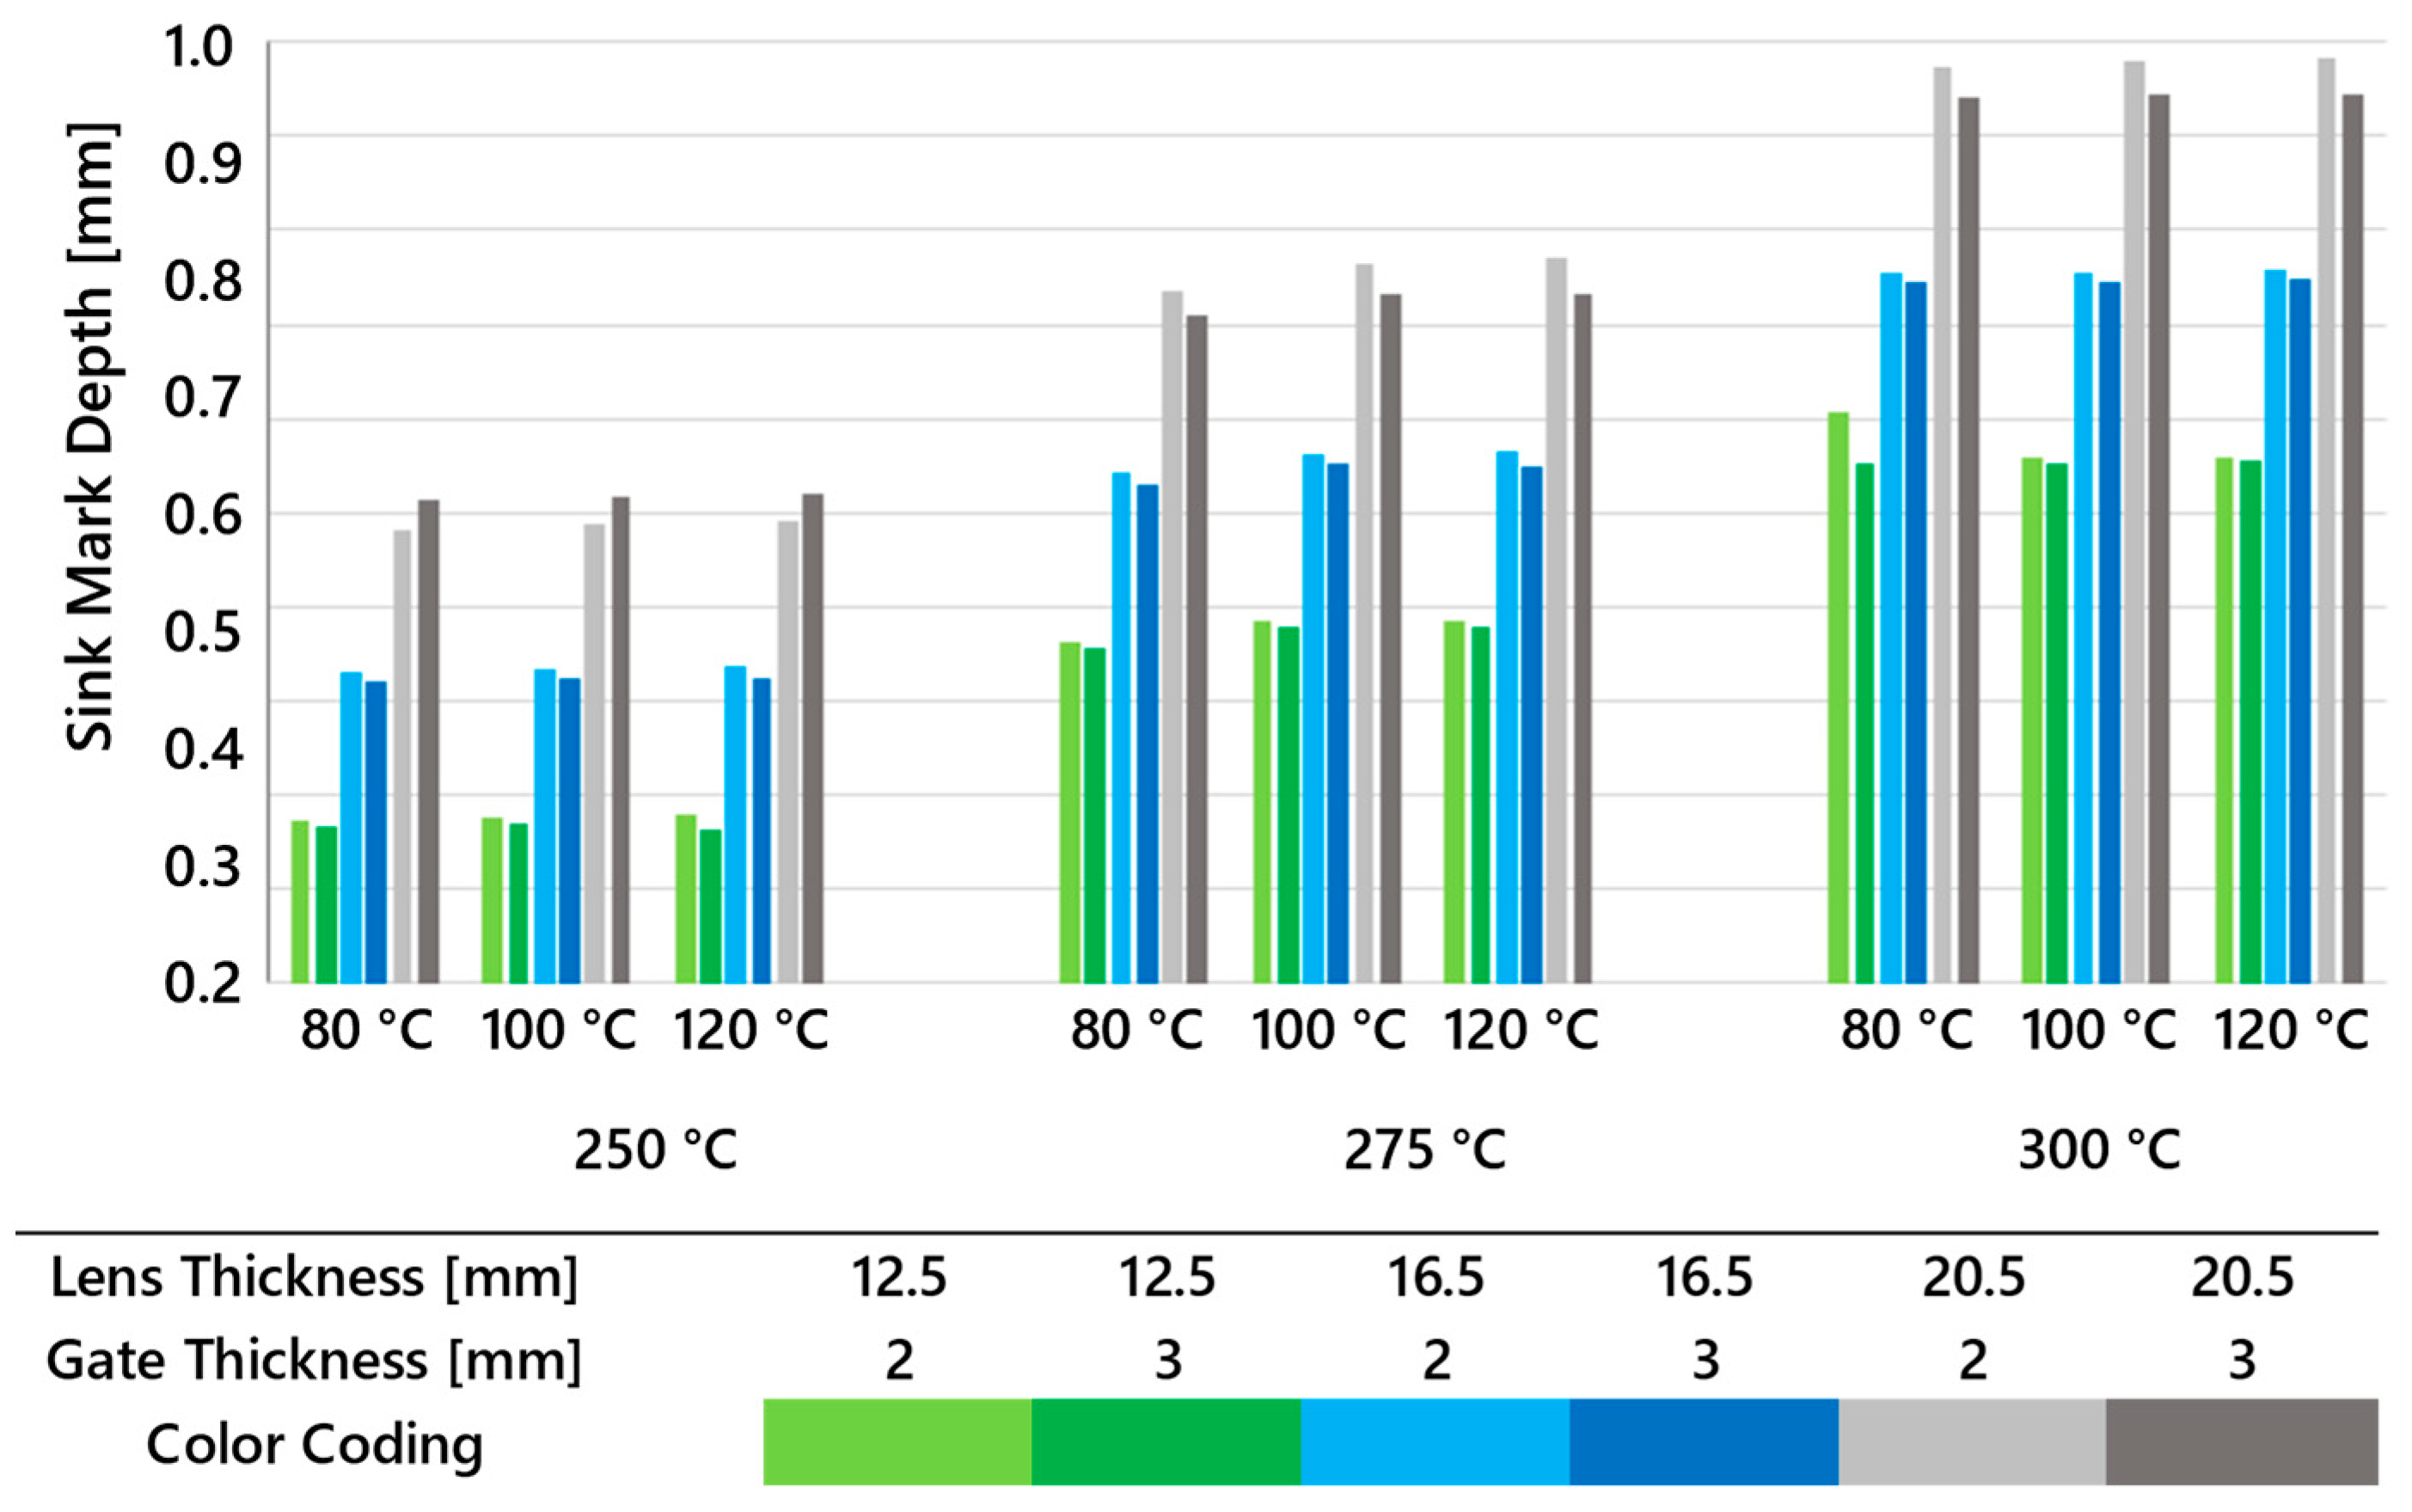
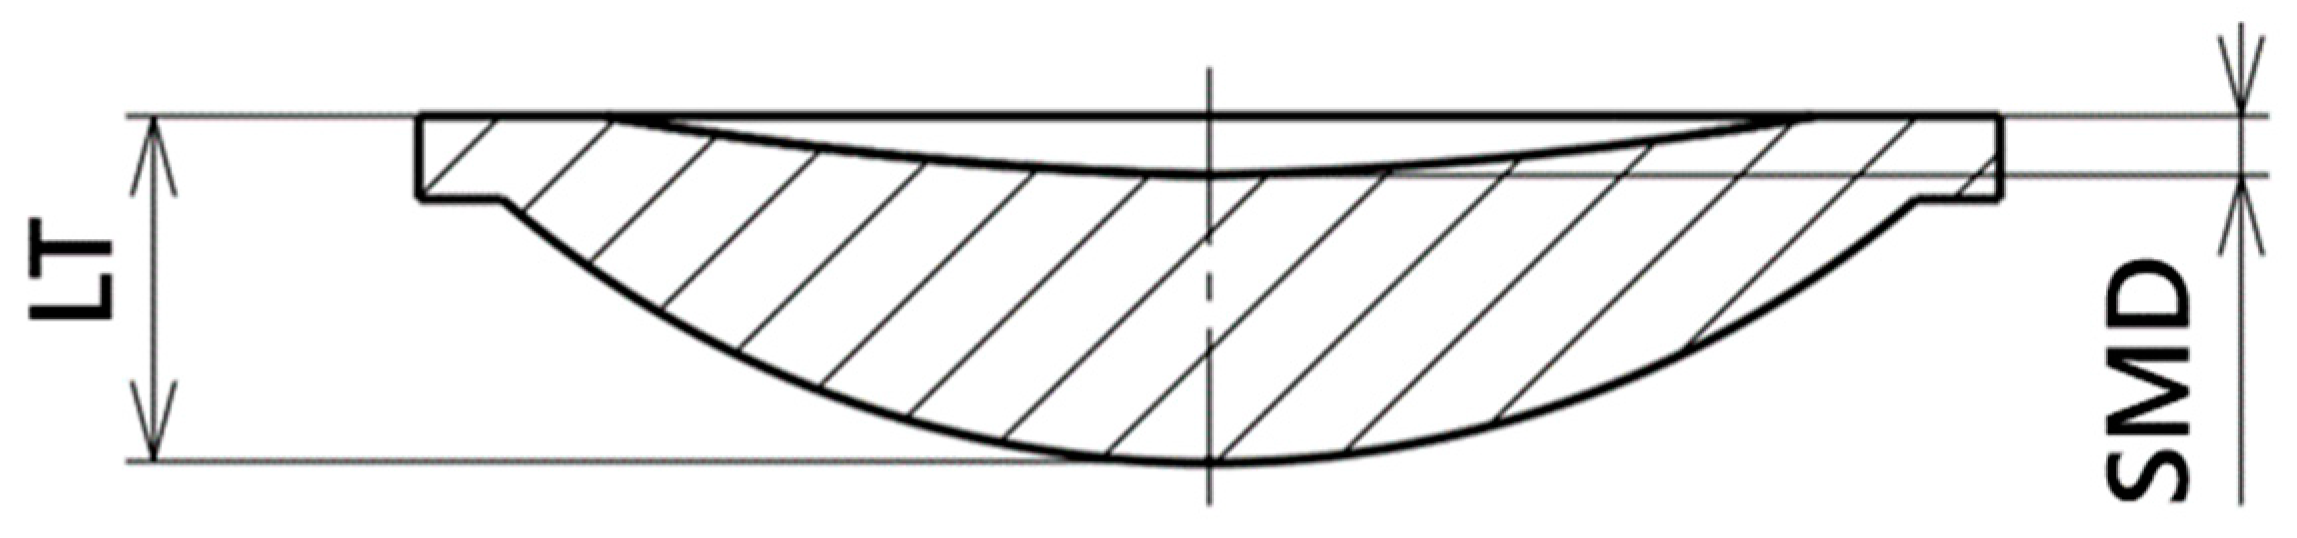
3.1.2. Sink Marks
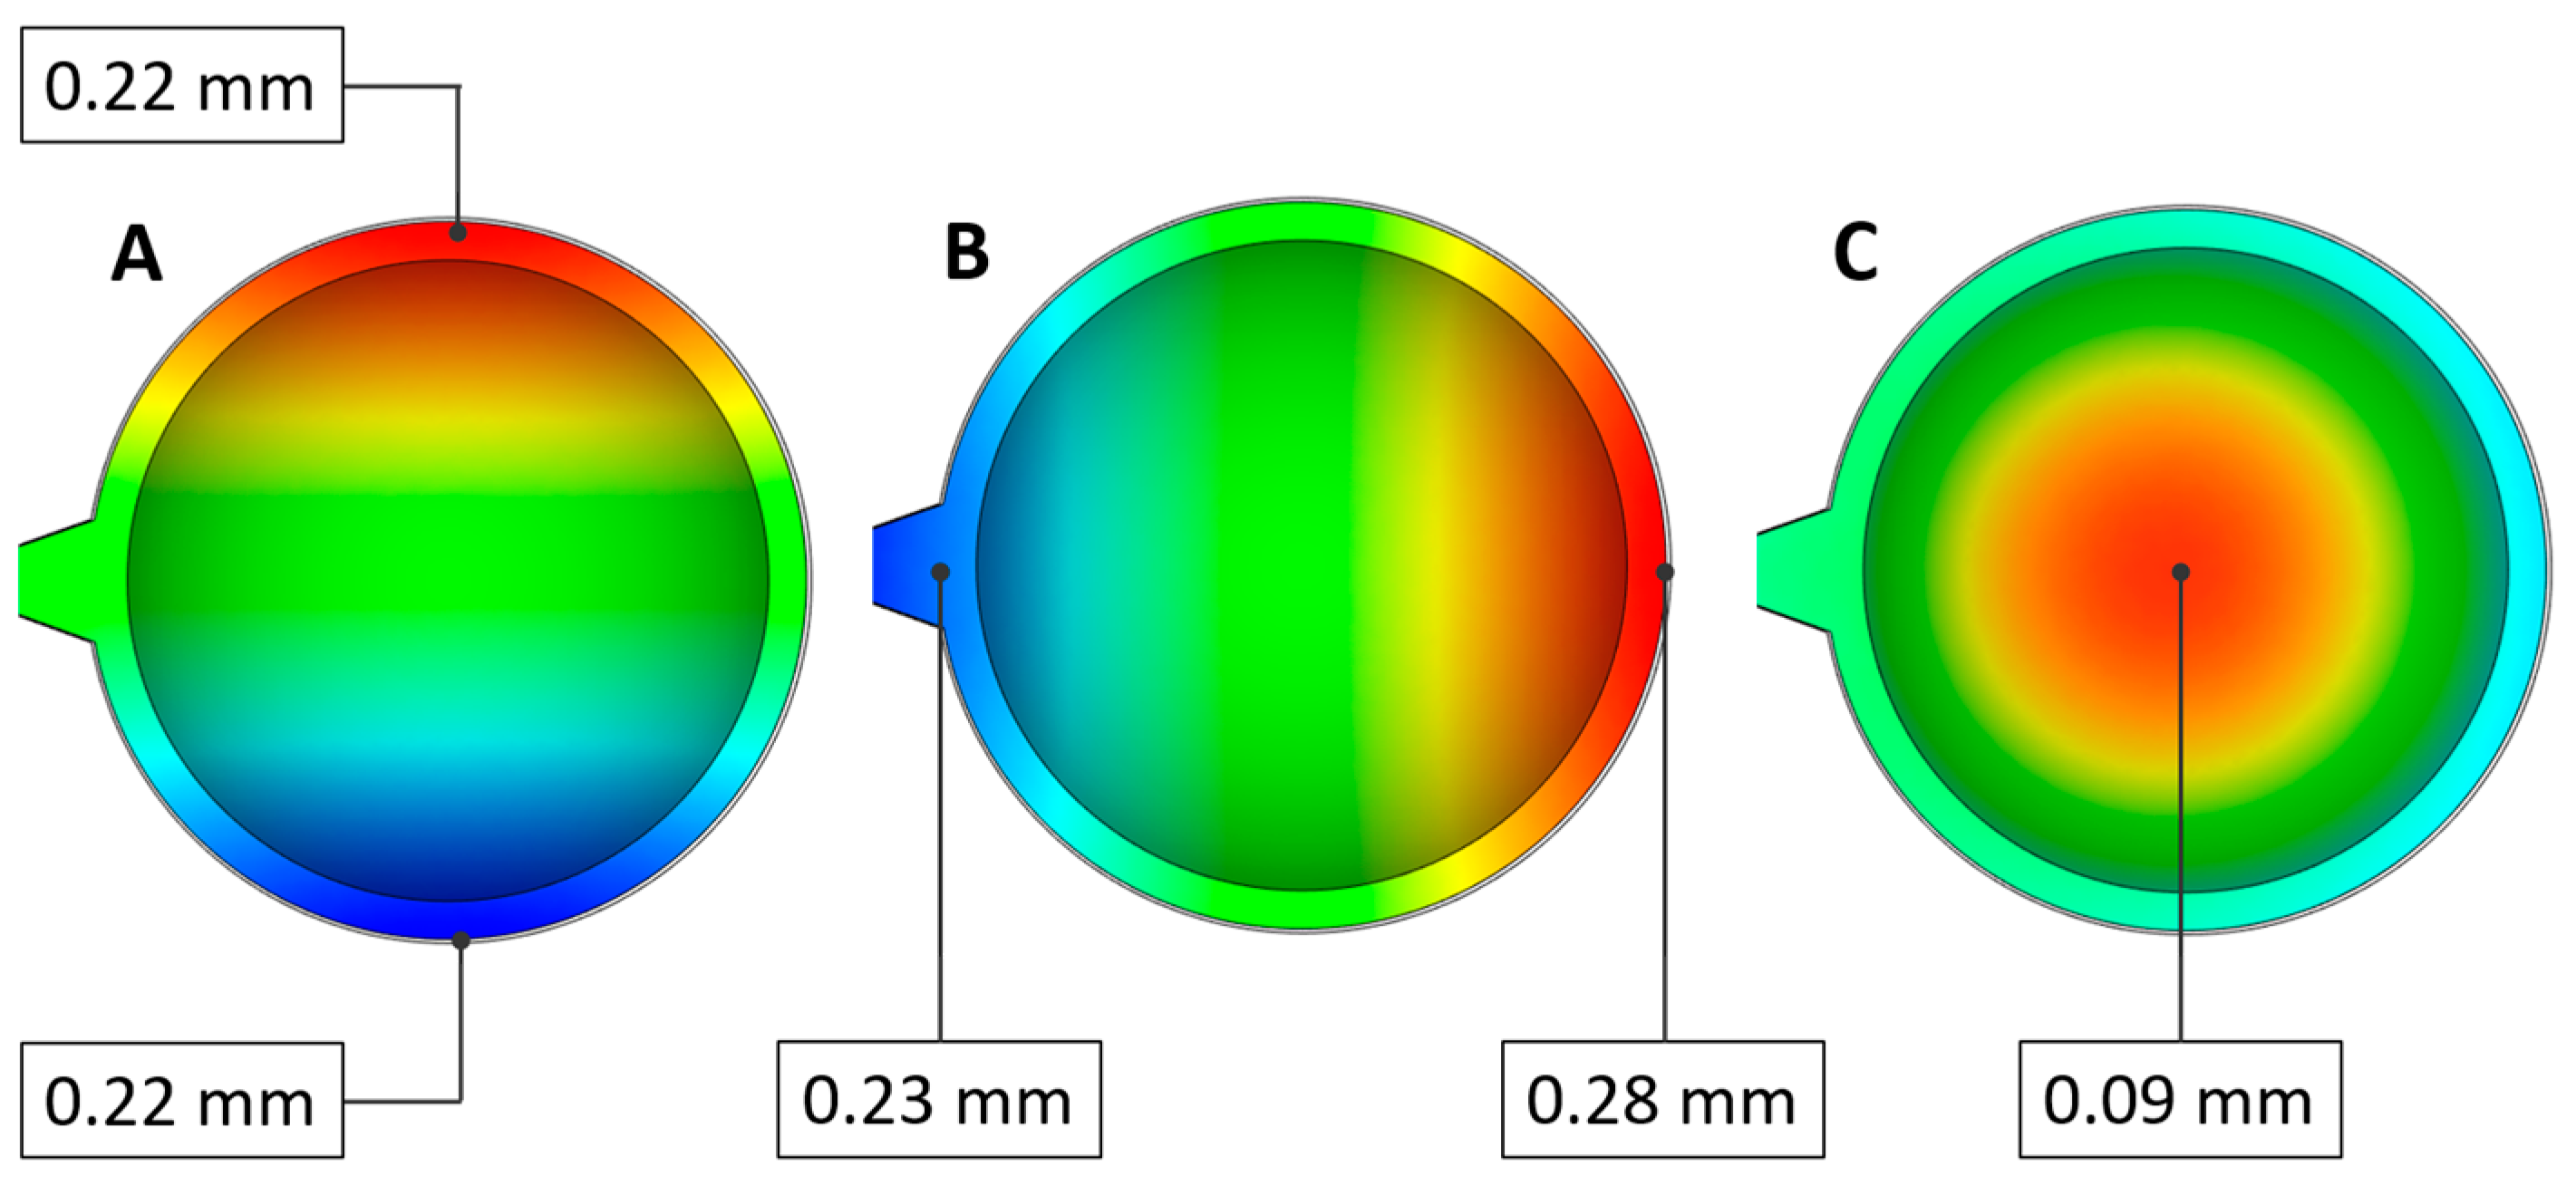
3.1.3. Deflection
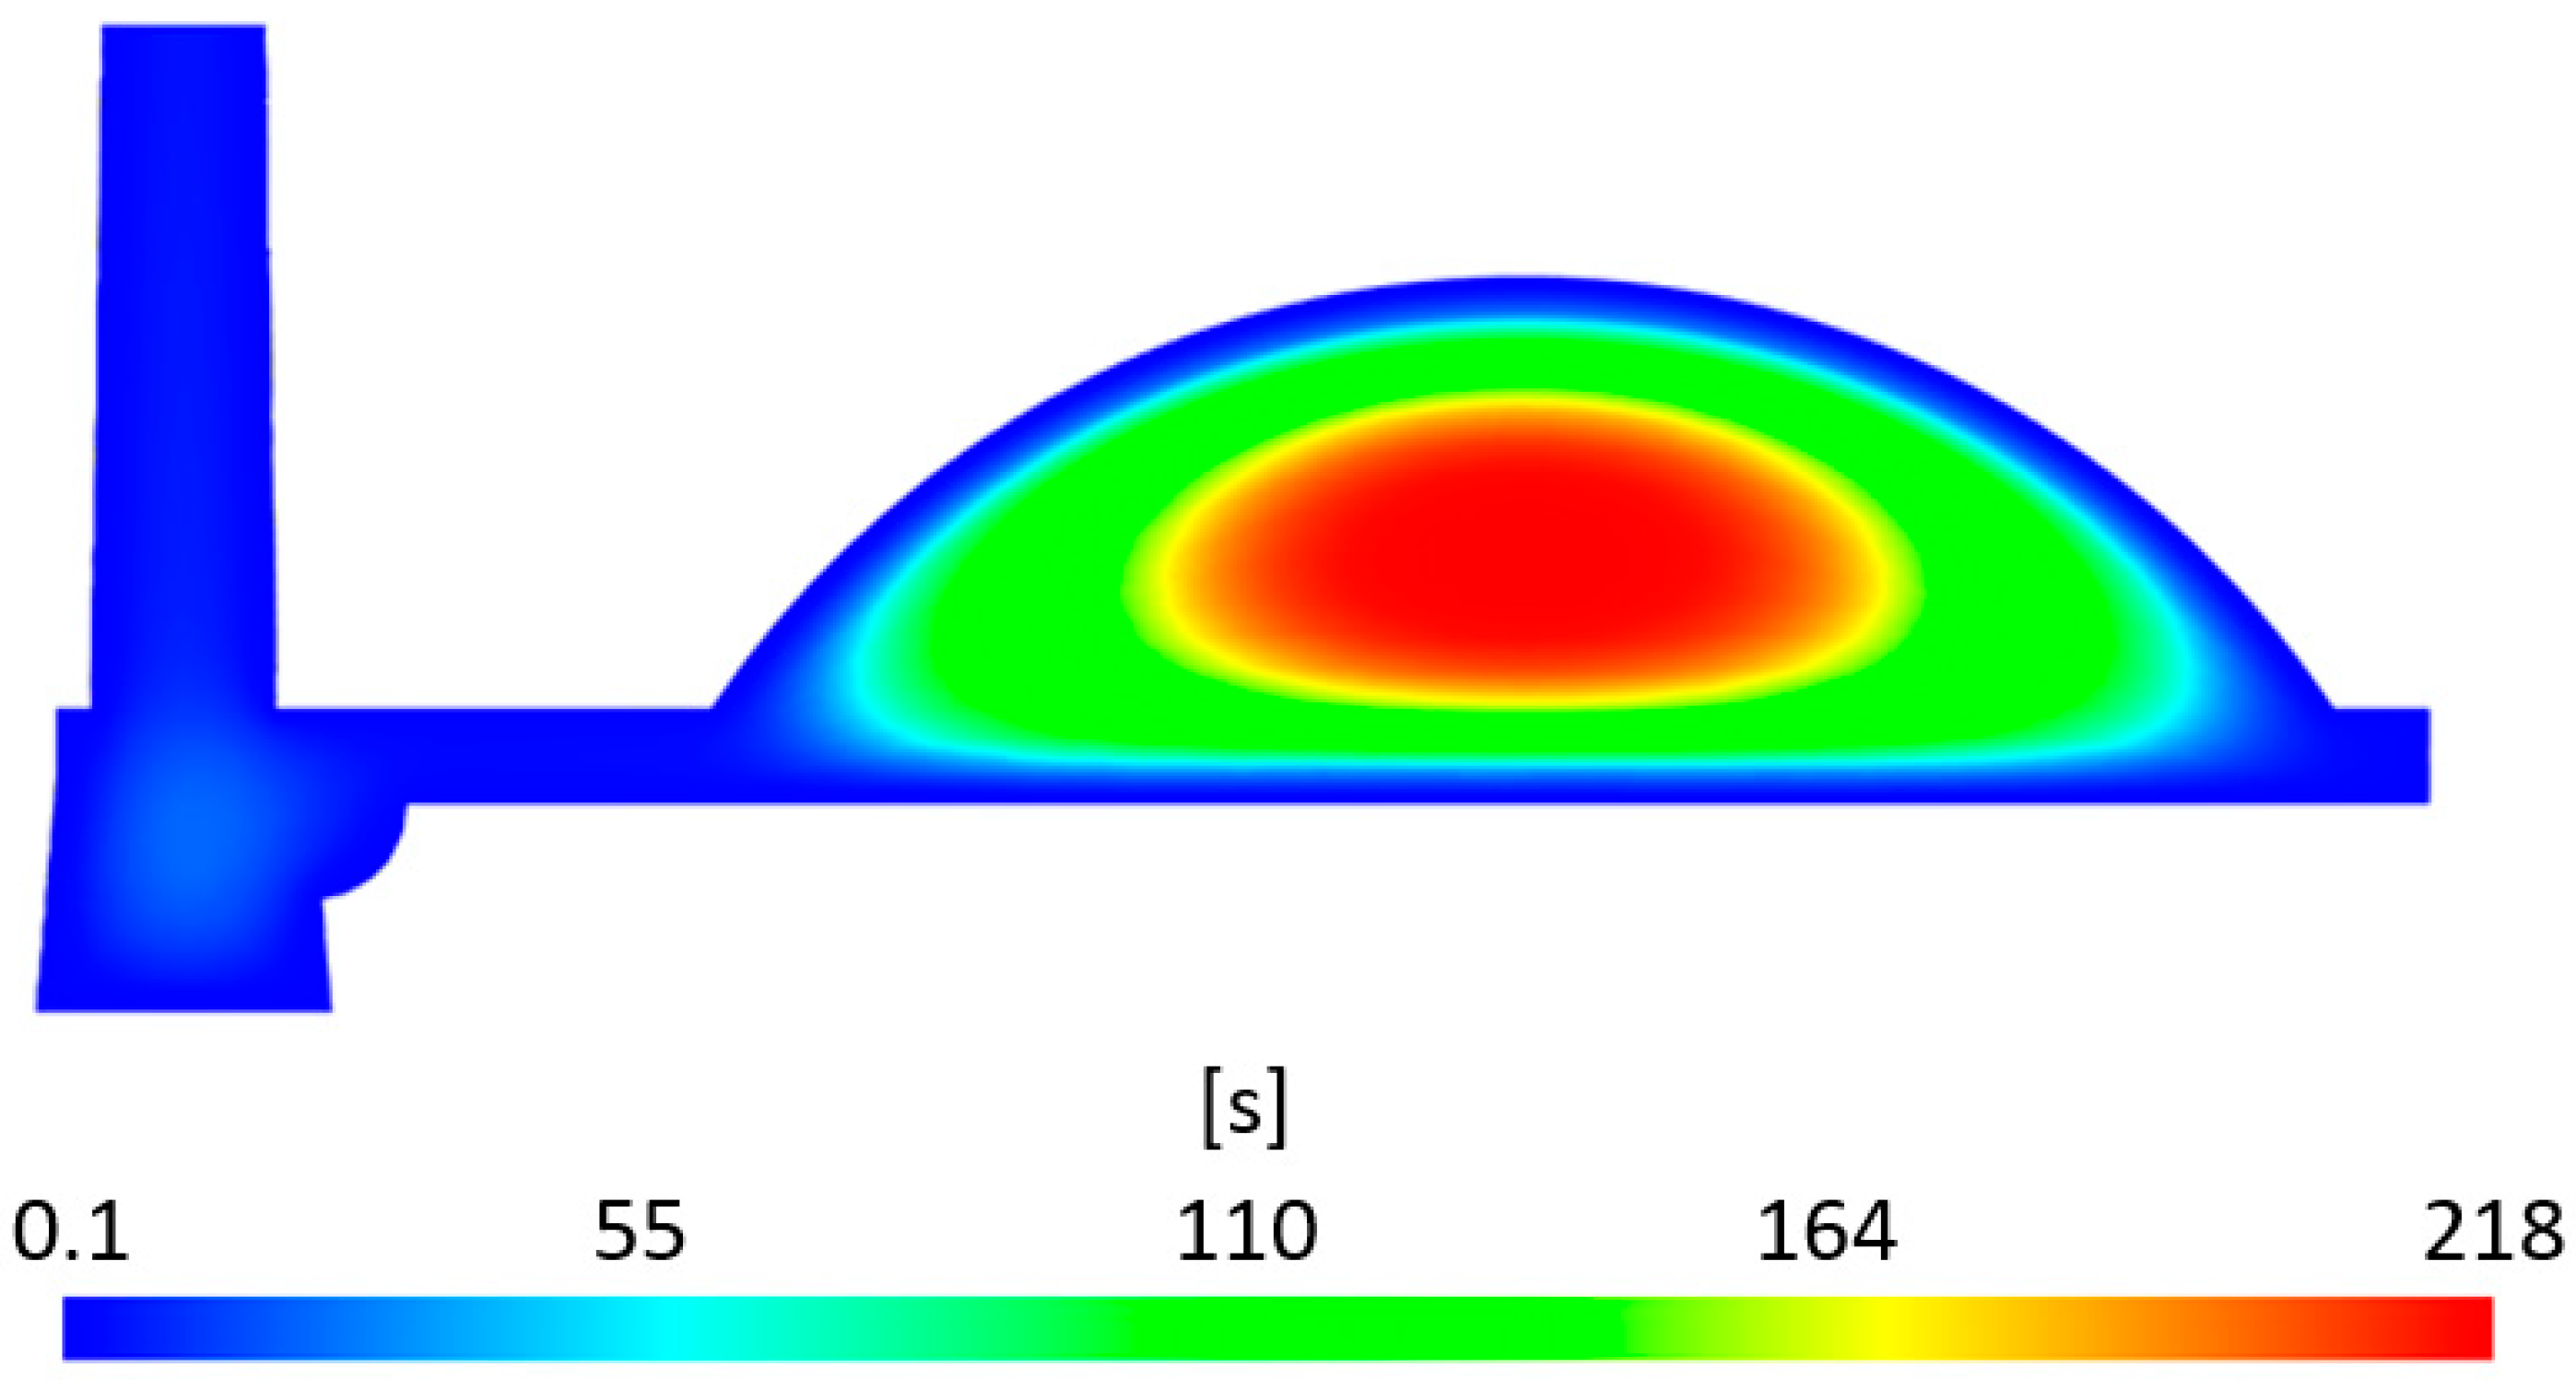
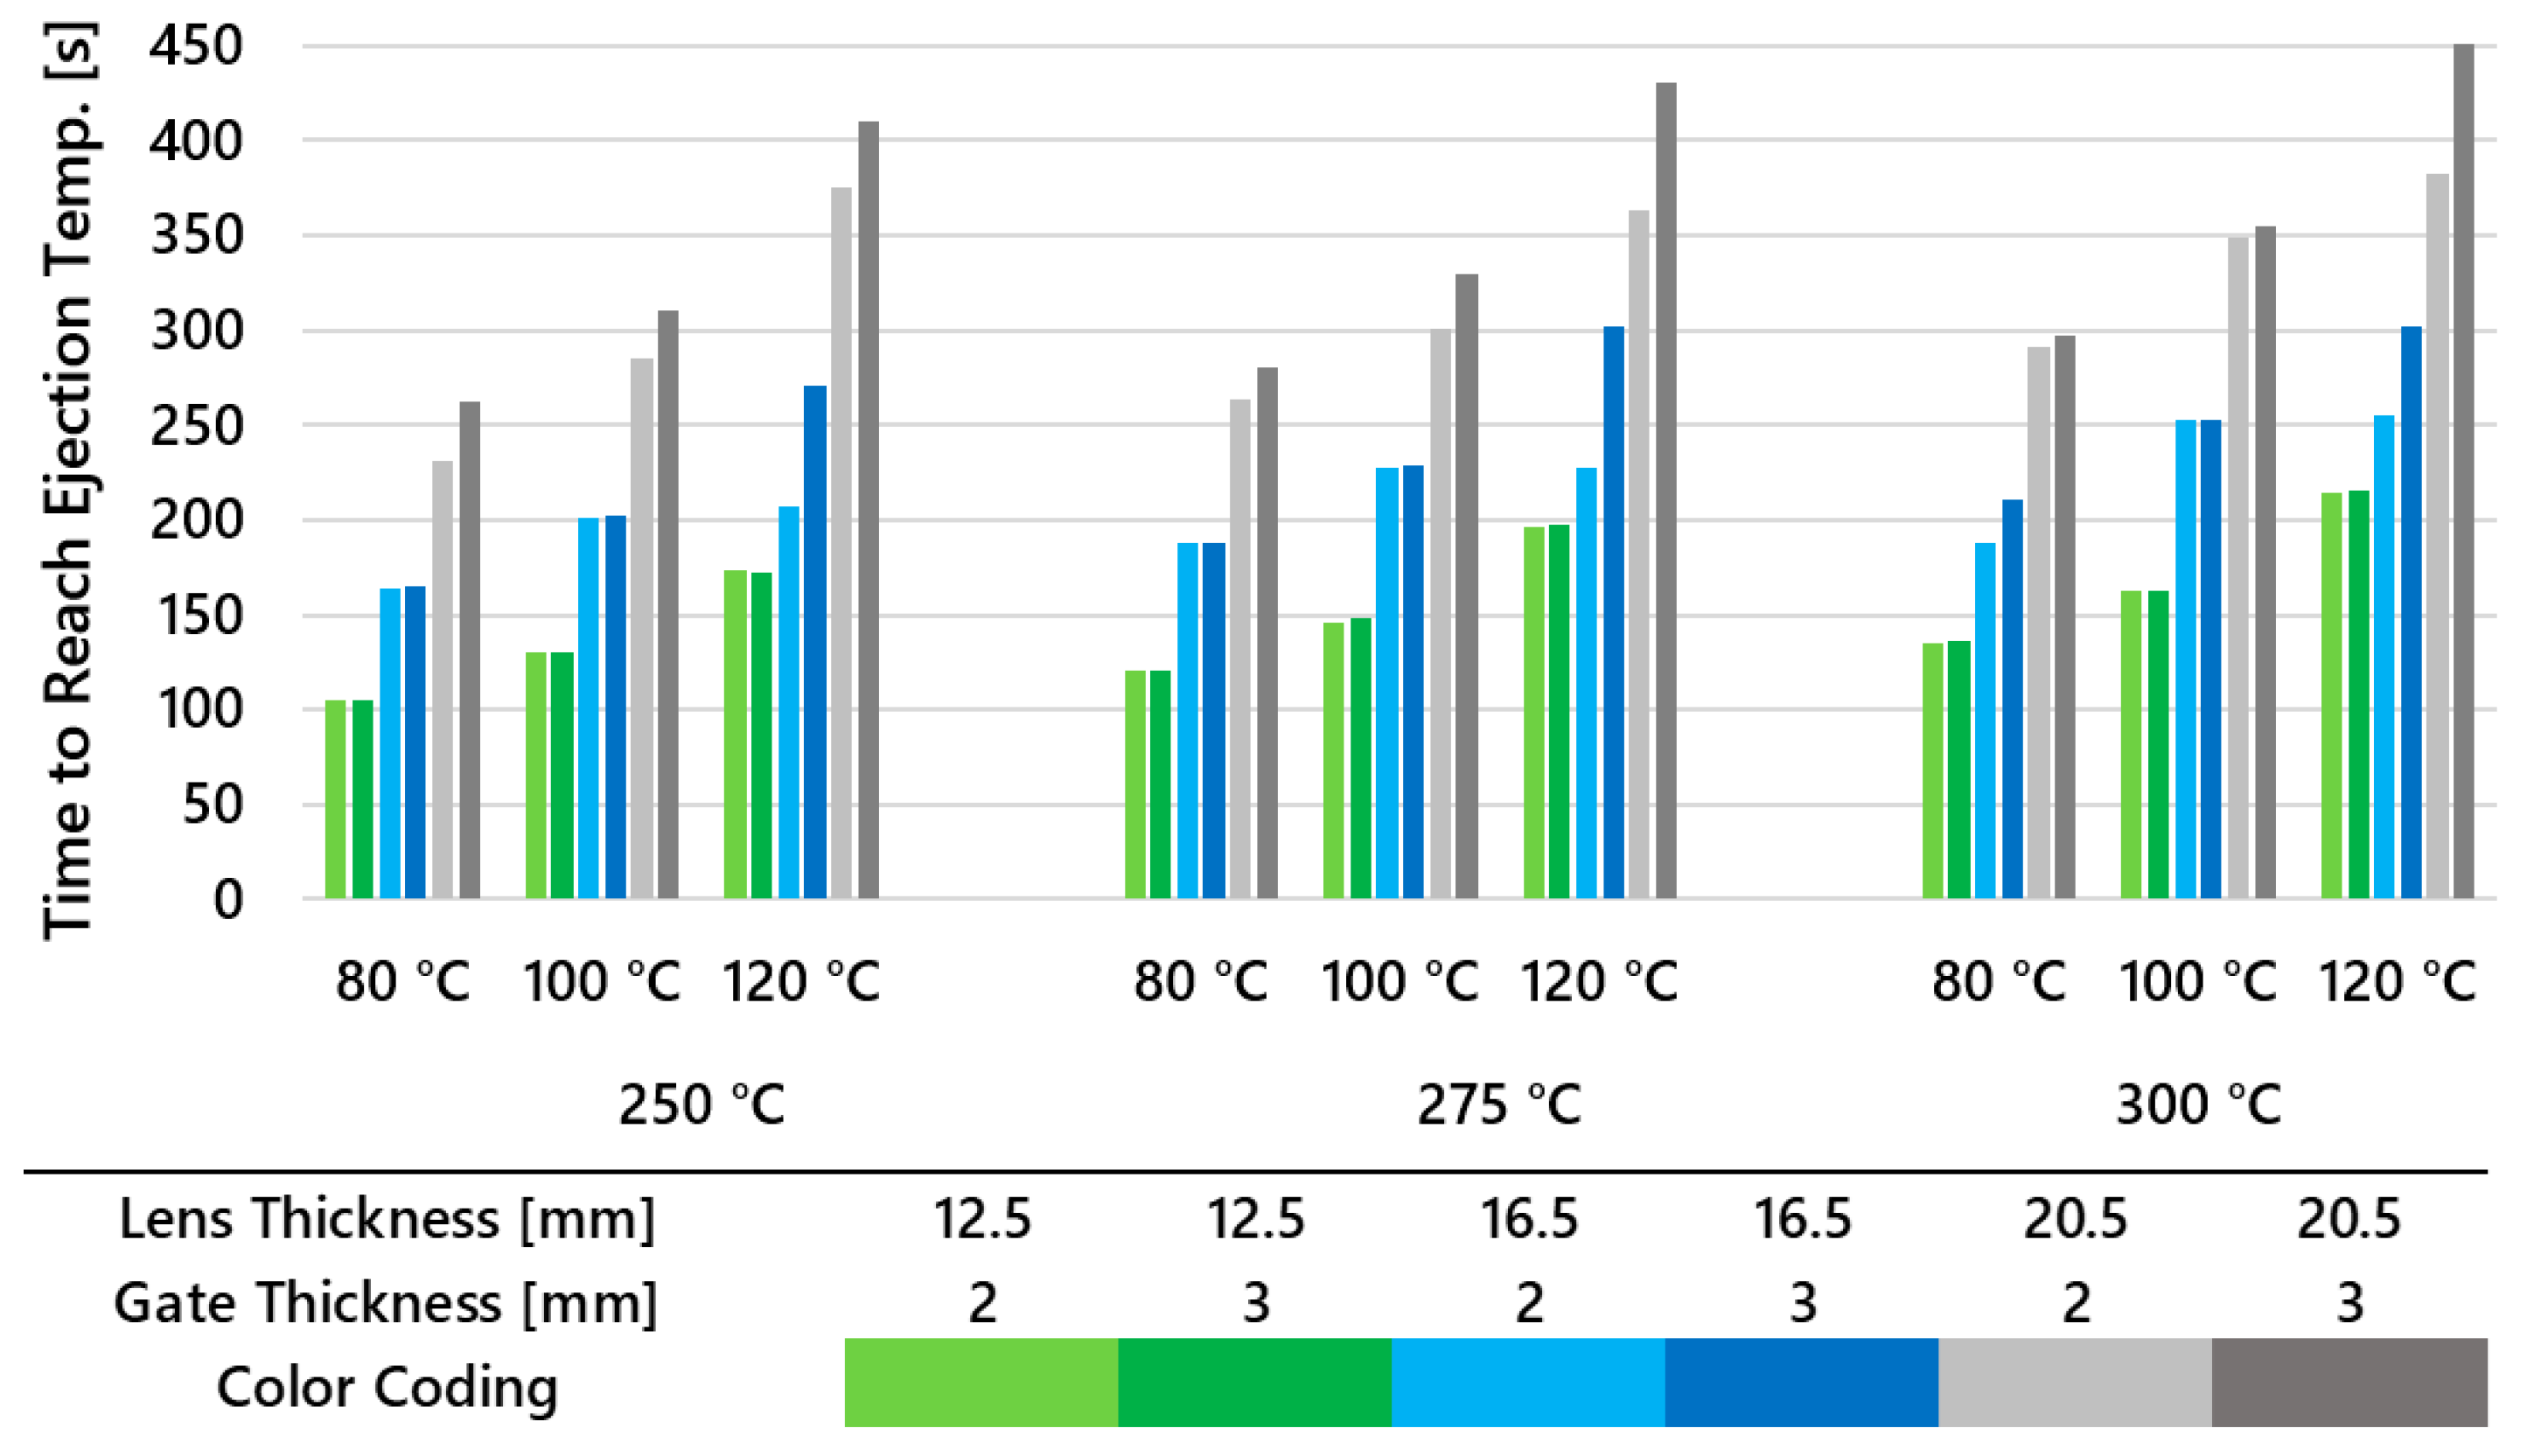
3.1.4. Time to Reach Ejection Temperature
3.1.5. Summary of Initial Simulation Study
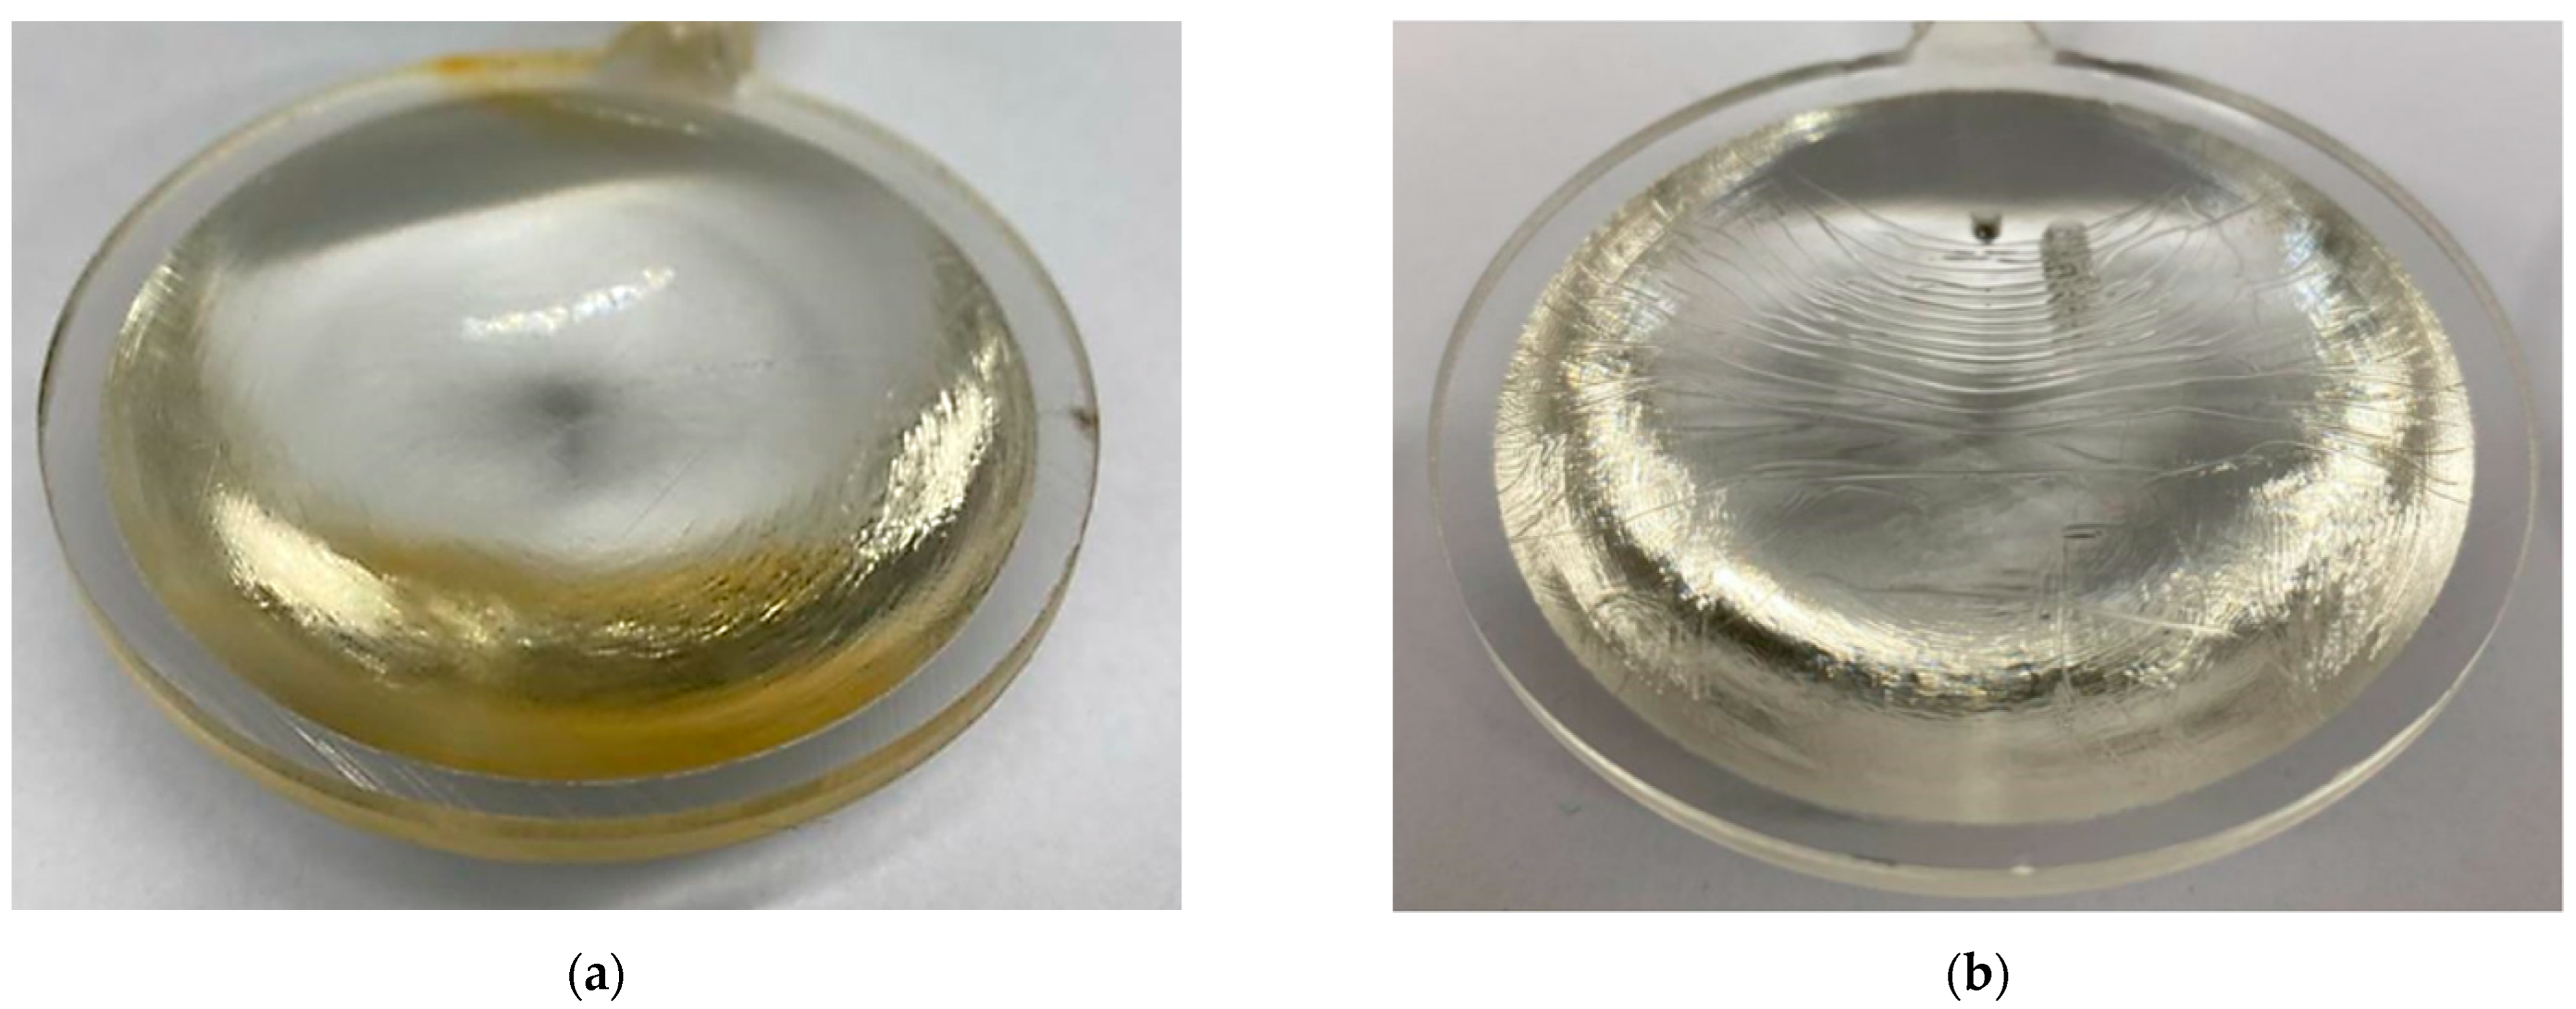
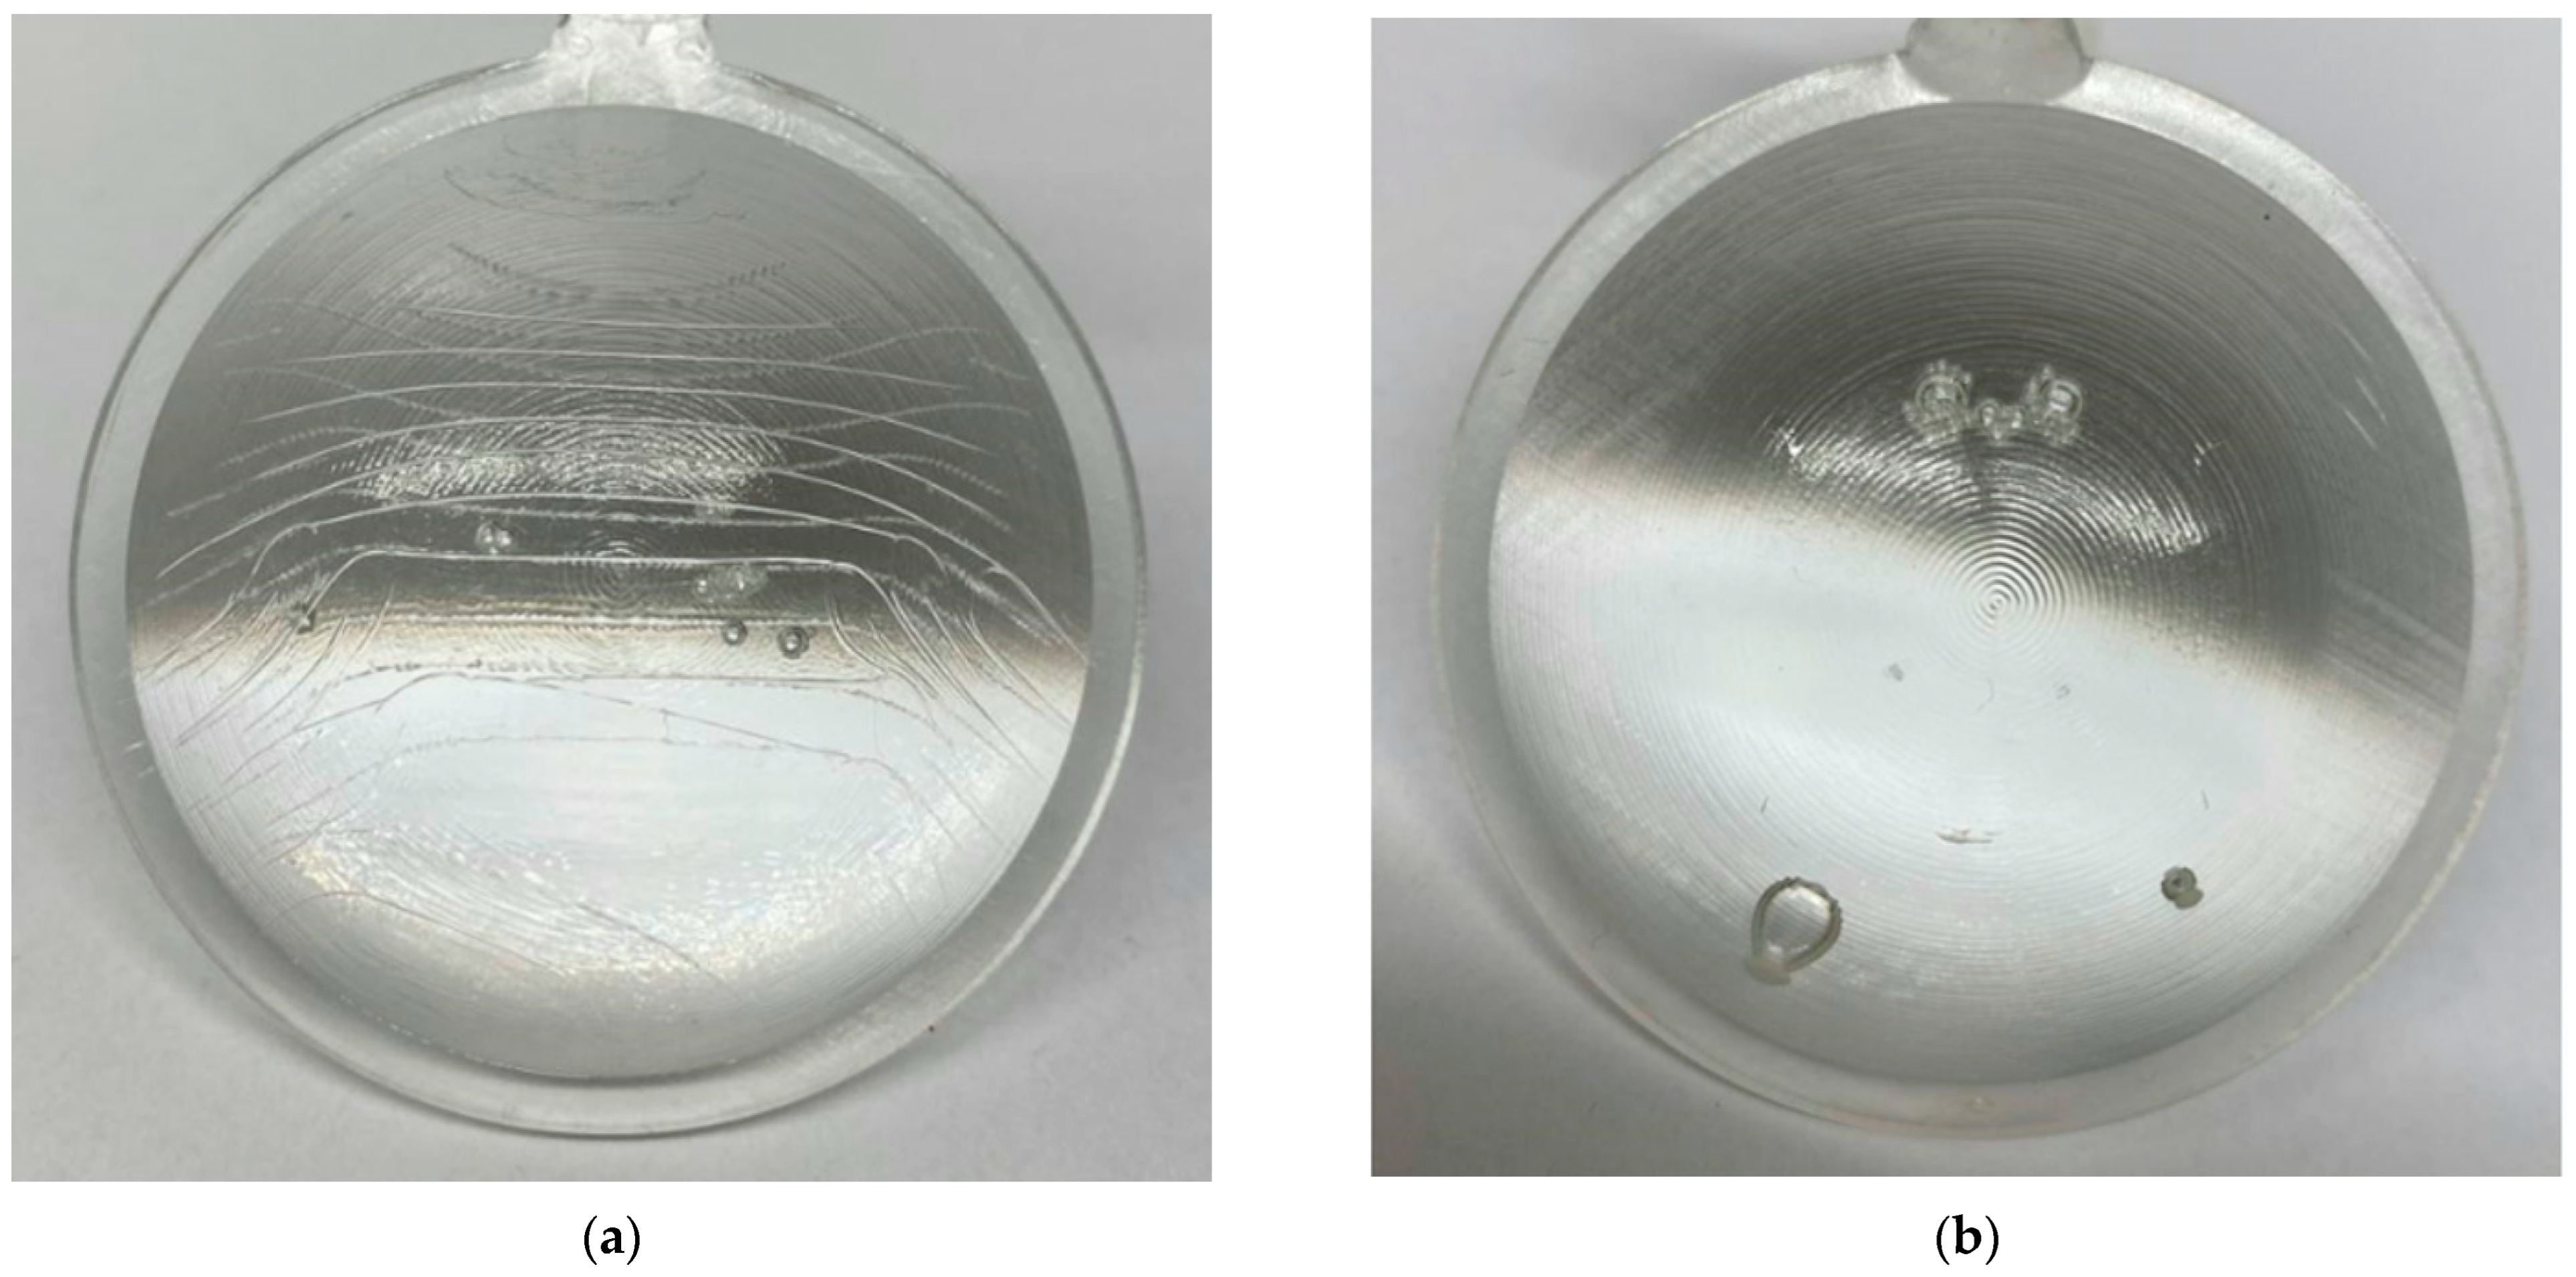
3.2. Reduction in Apparent Defects during Test Sample Preparation
3.3. Specification of Tested Process Parameter Ranges
3.4. Design of Experiment (DOE)
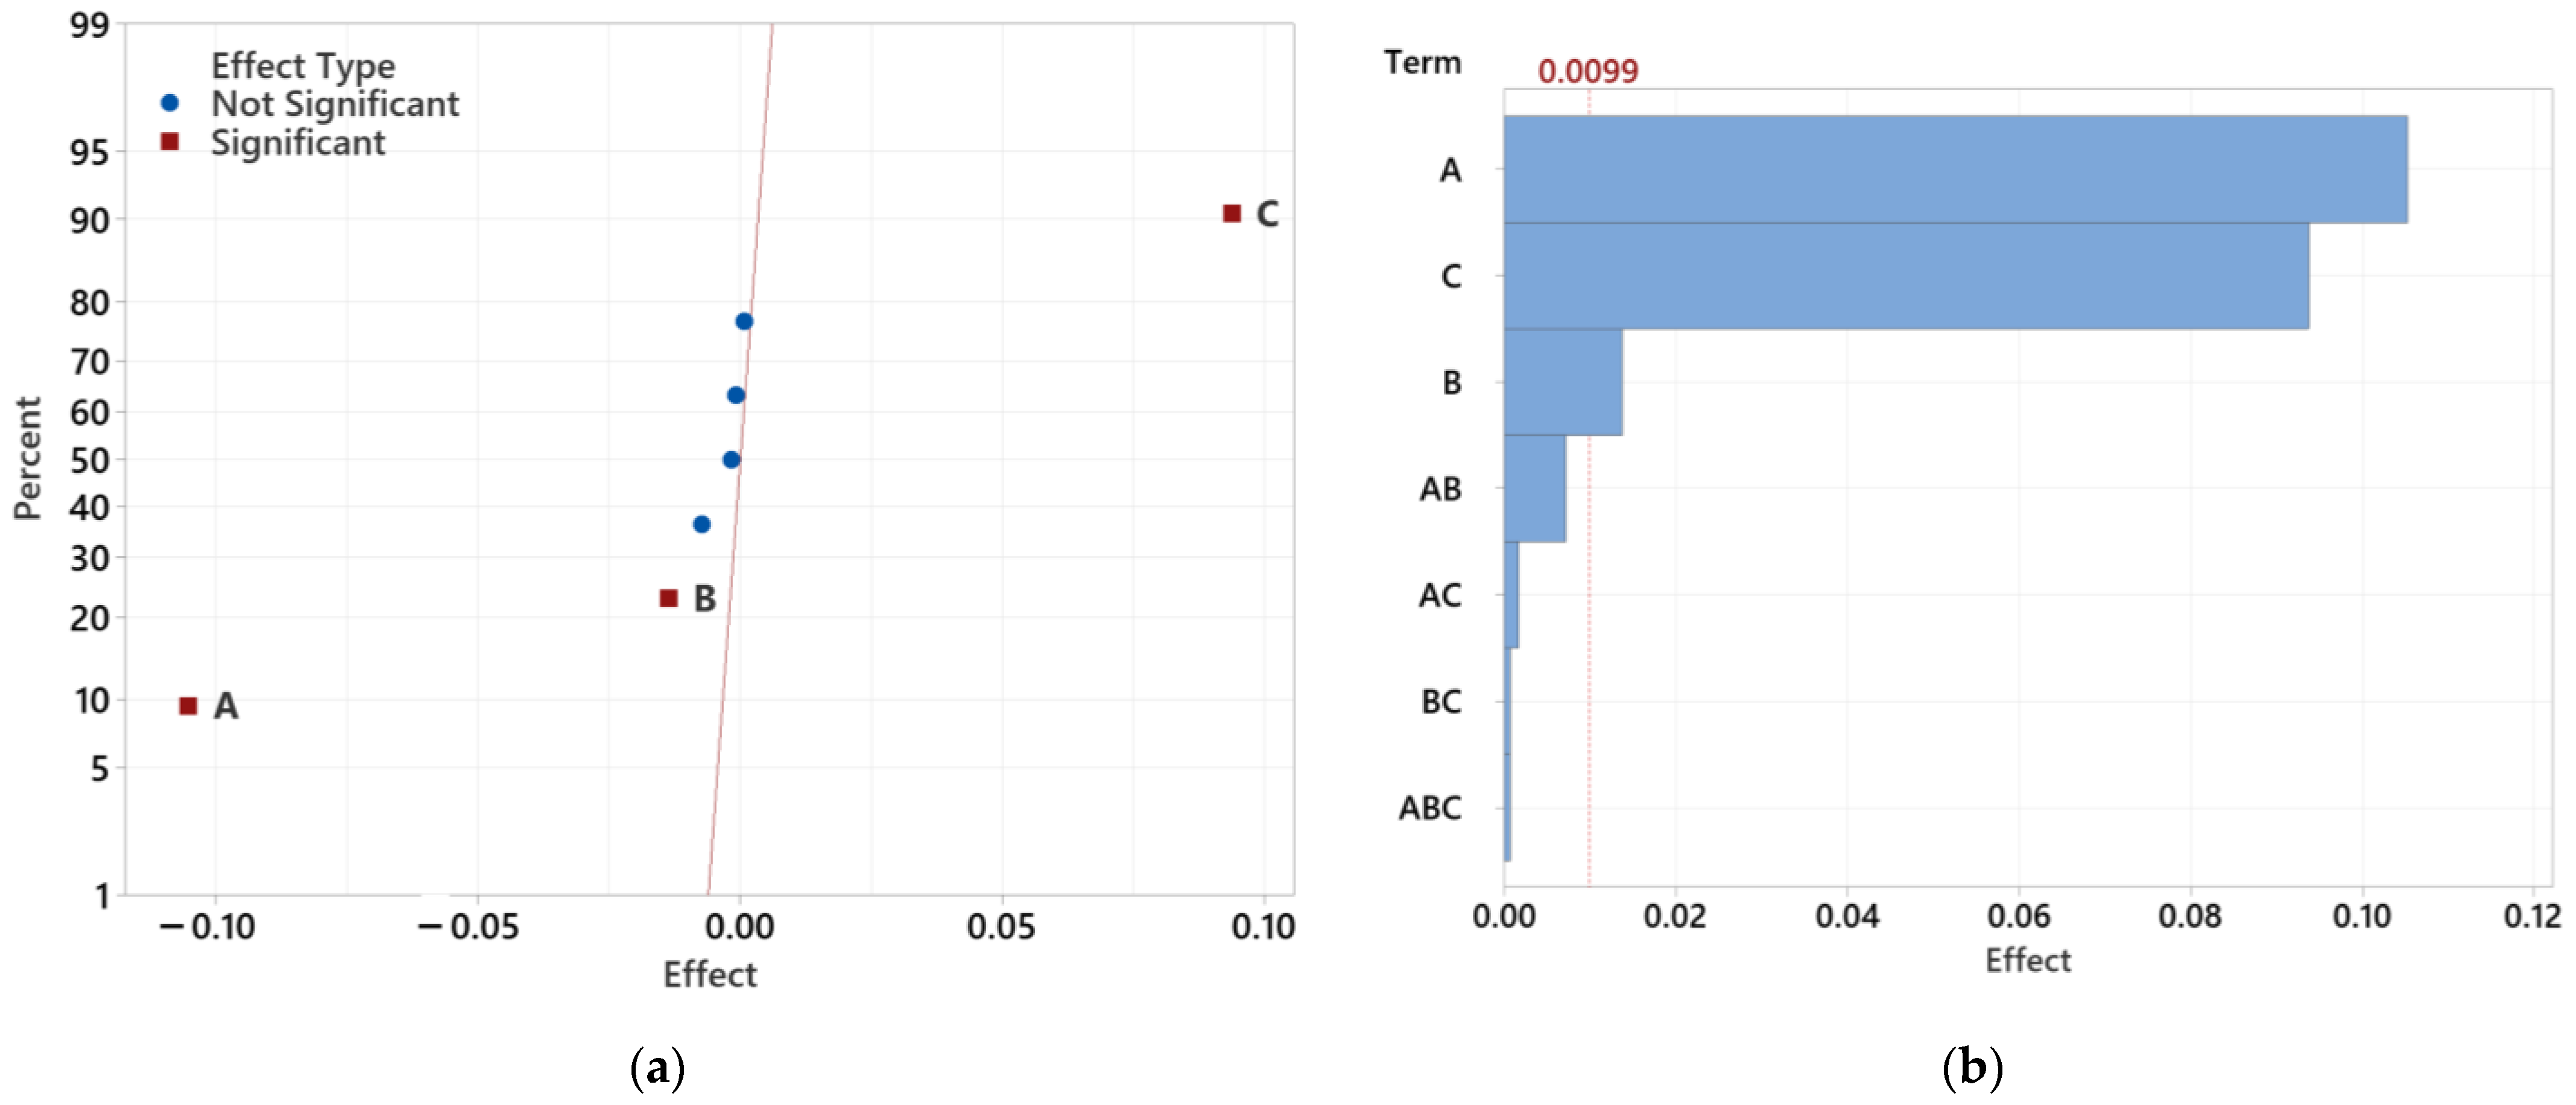
3.4.1. Determining the Significance of Individual Tested Factors
3.4.2. Overview of DOE Findings
3.5. Statistical Evaluation of the Experiment
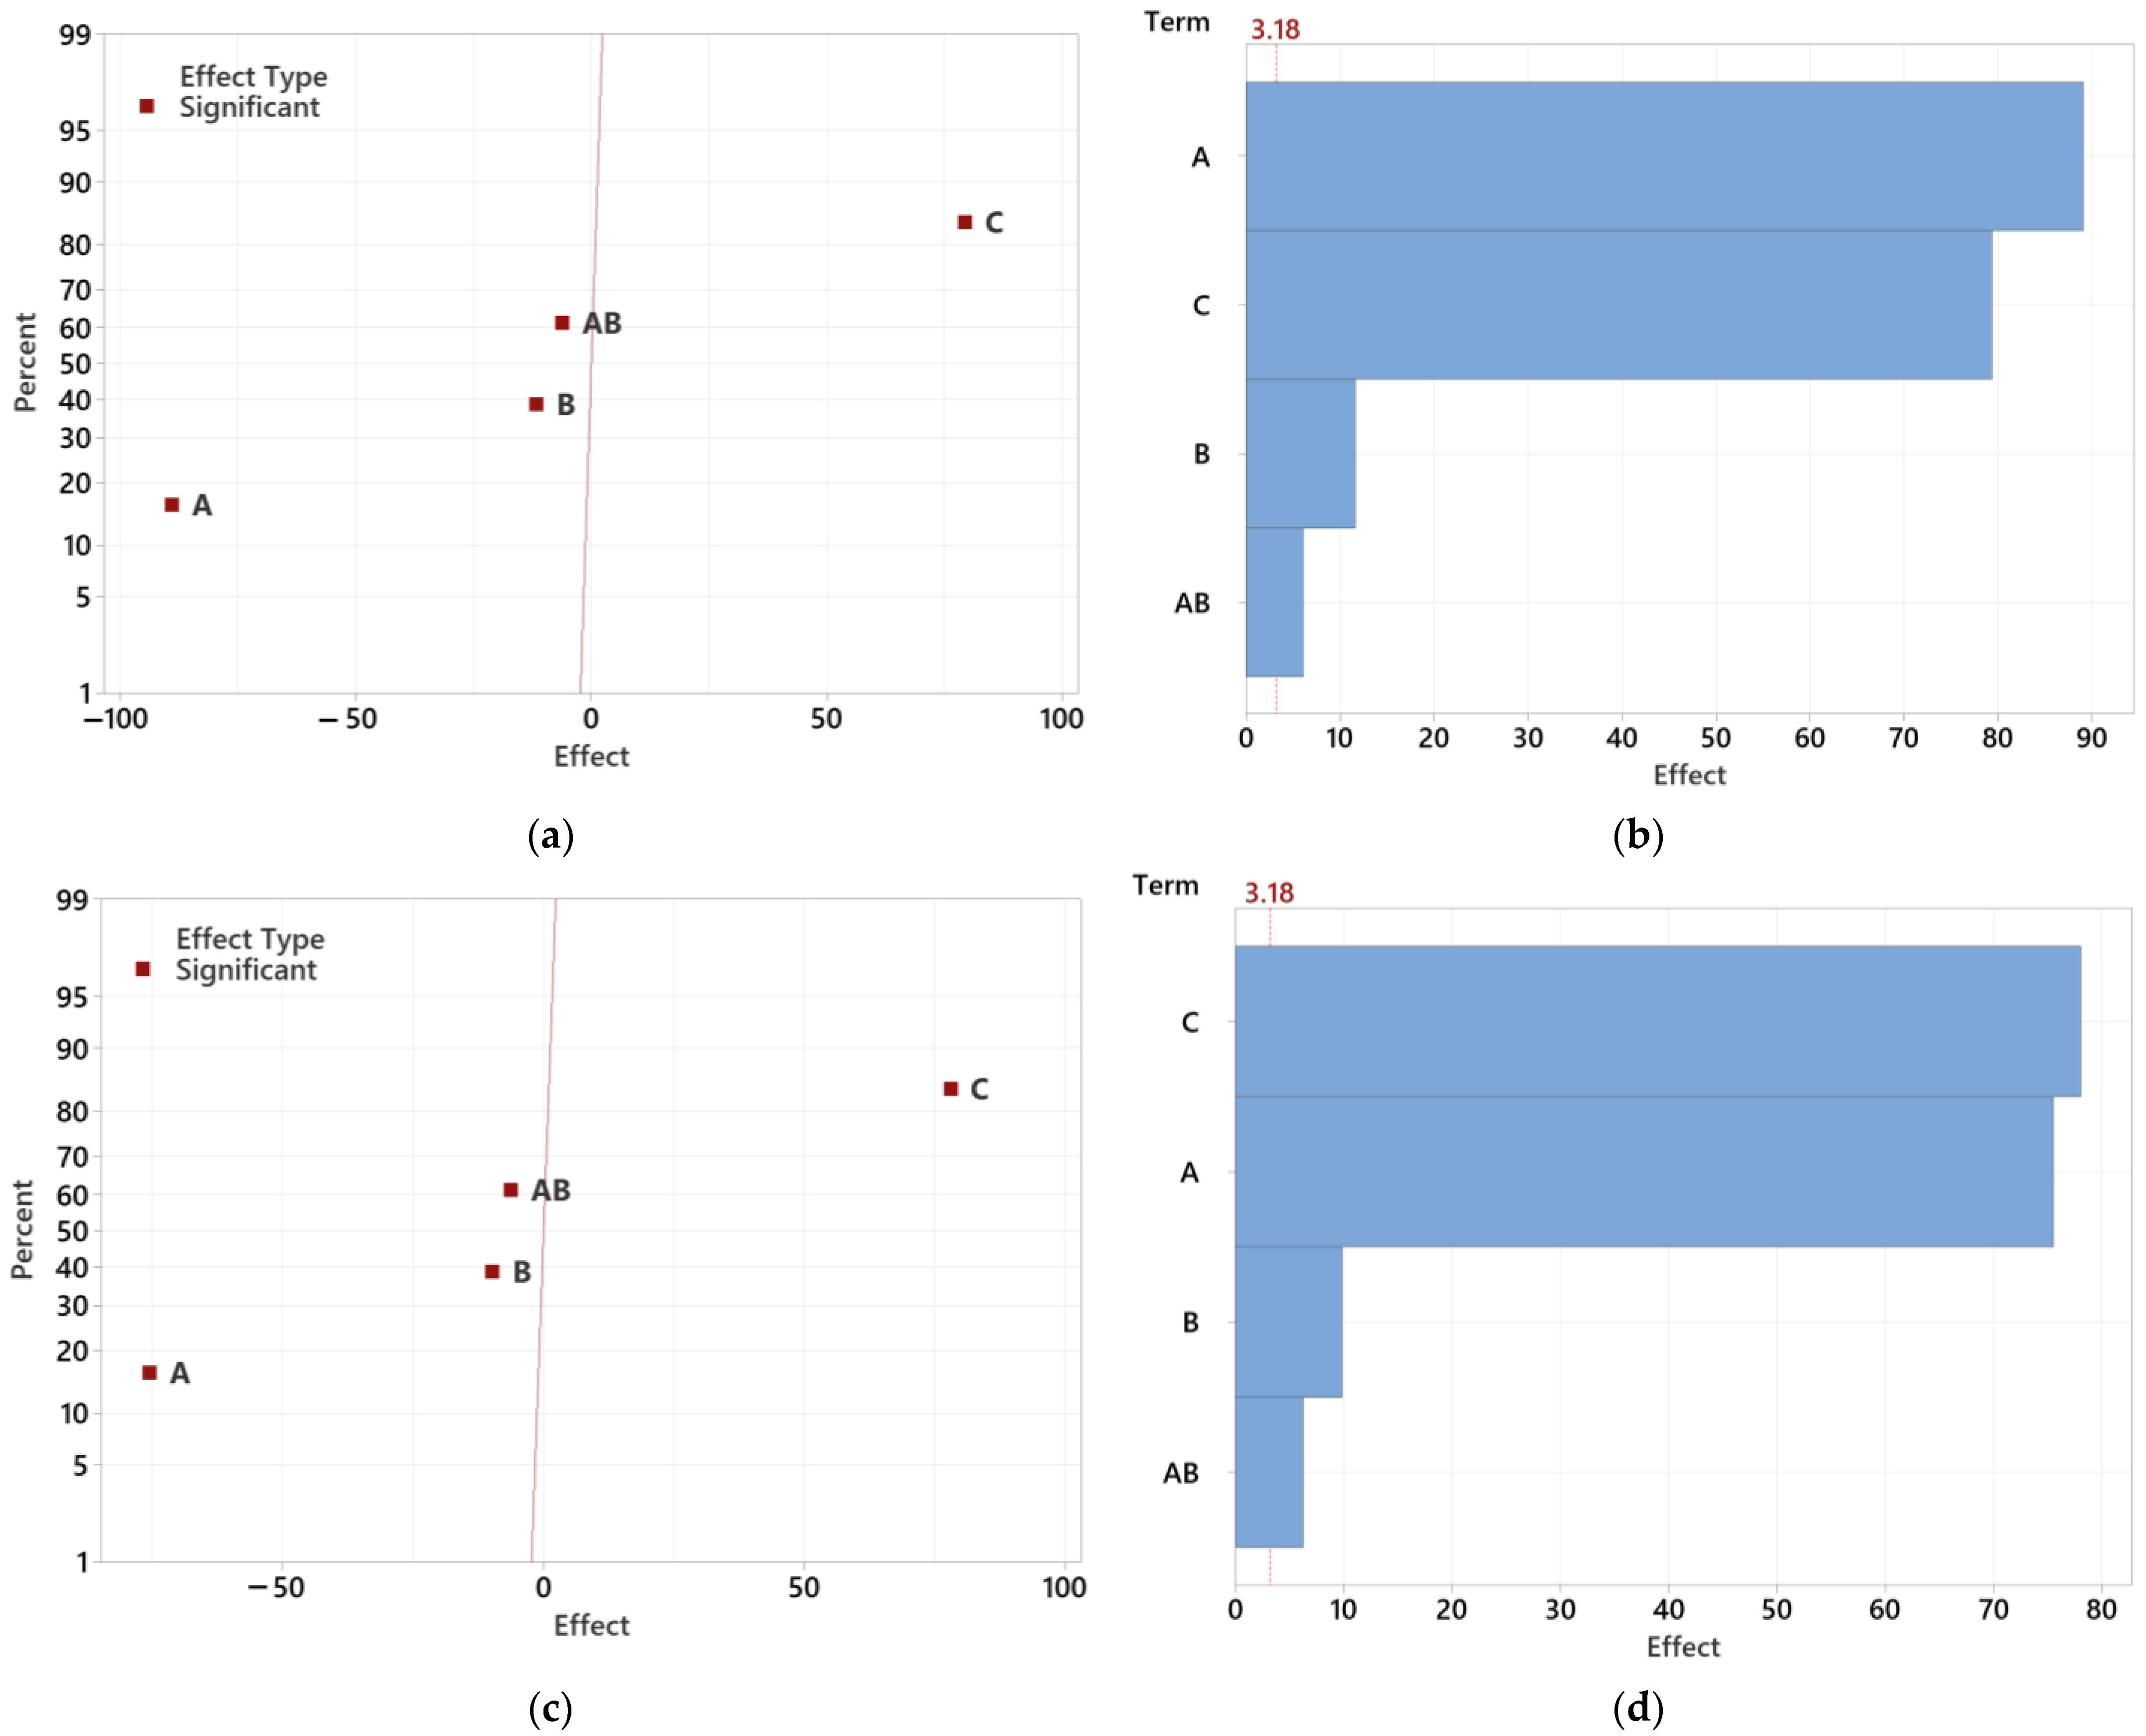
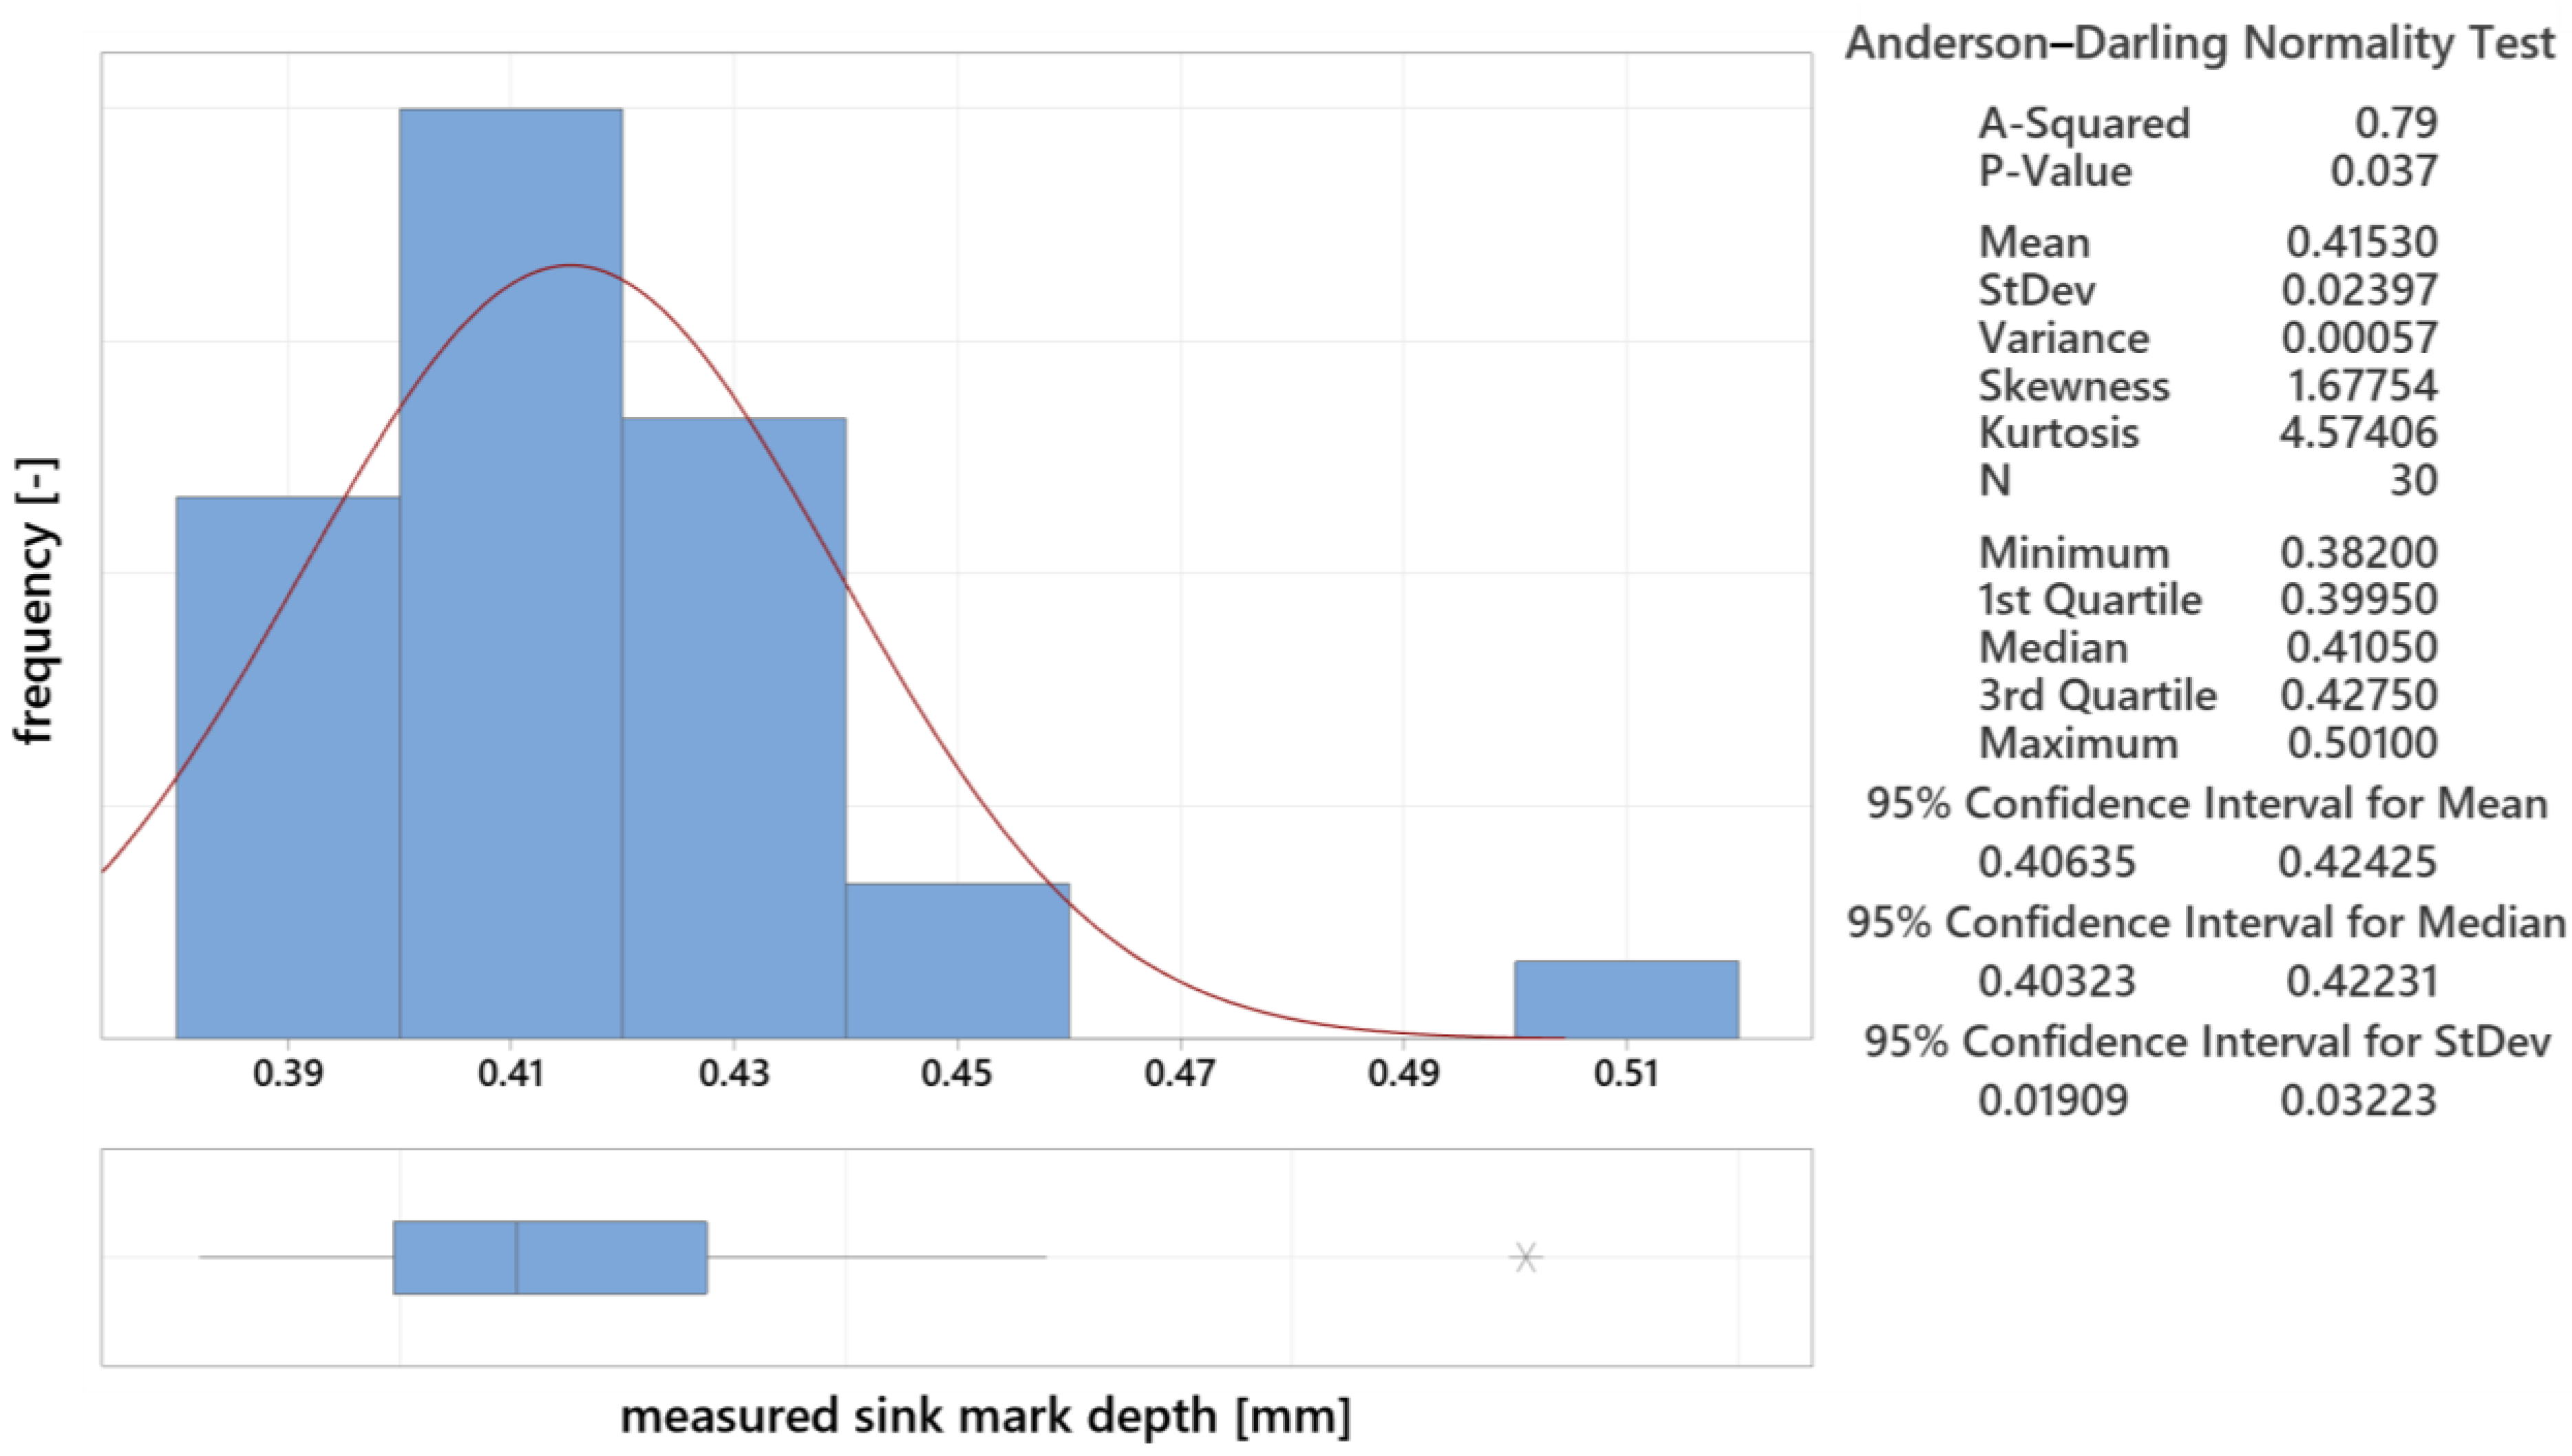
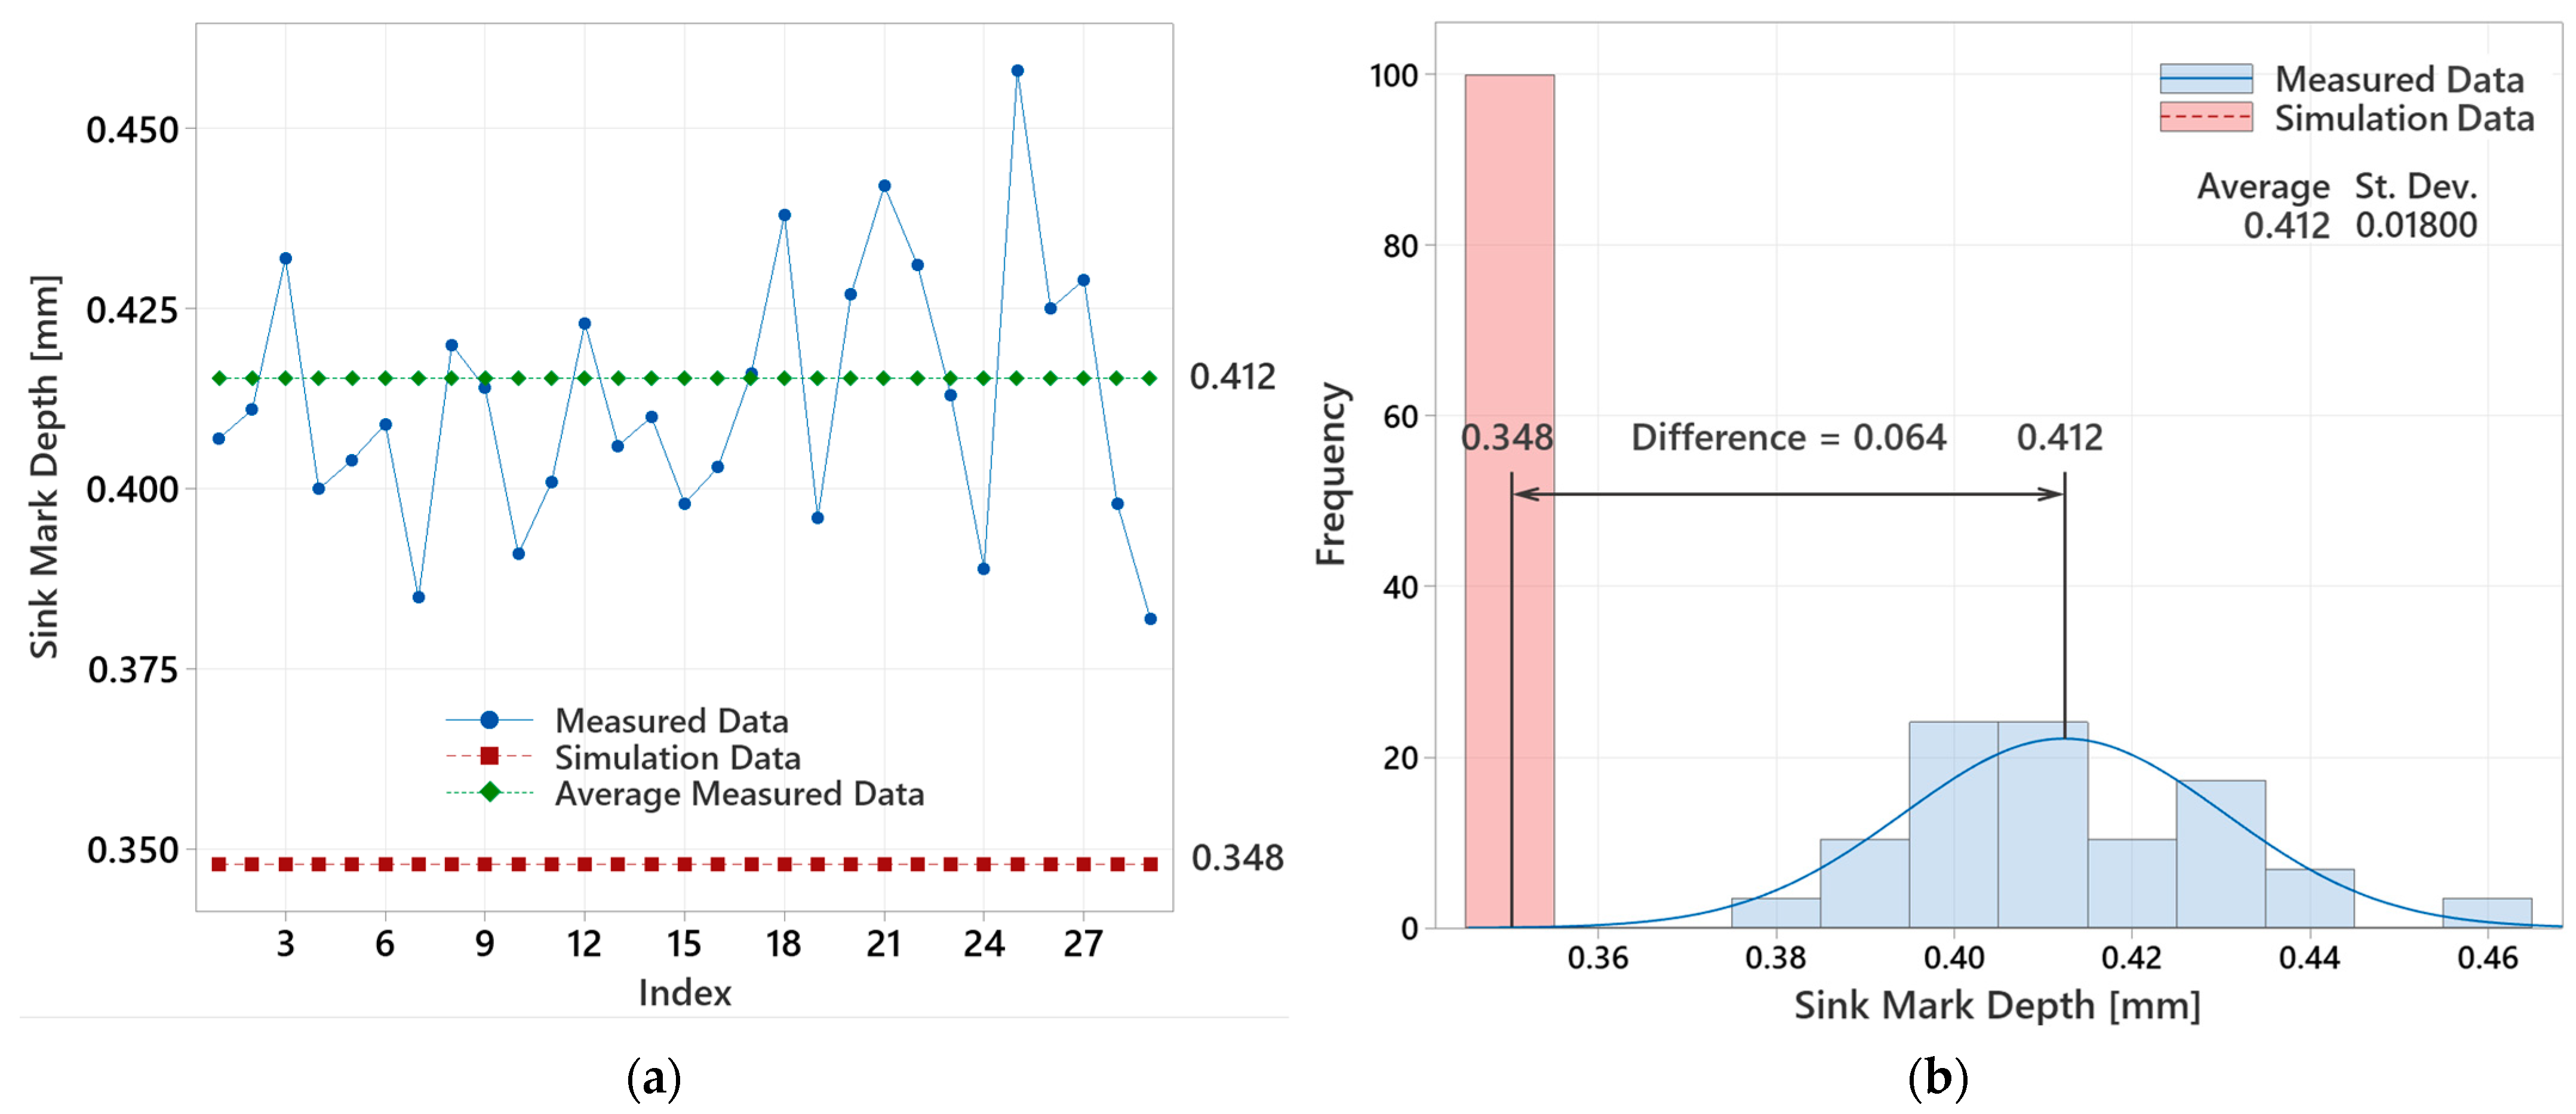
3.5.1. Analysis of Statistical Data for 12.5 mm Thick Lens
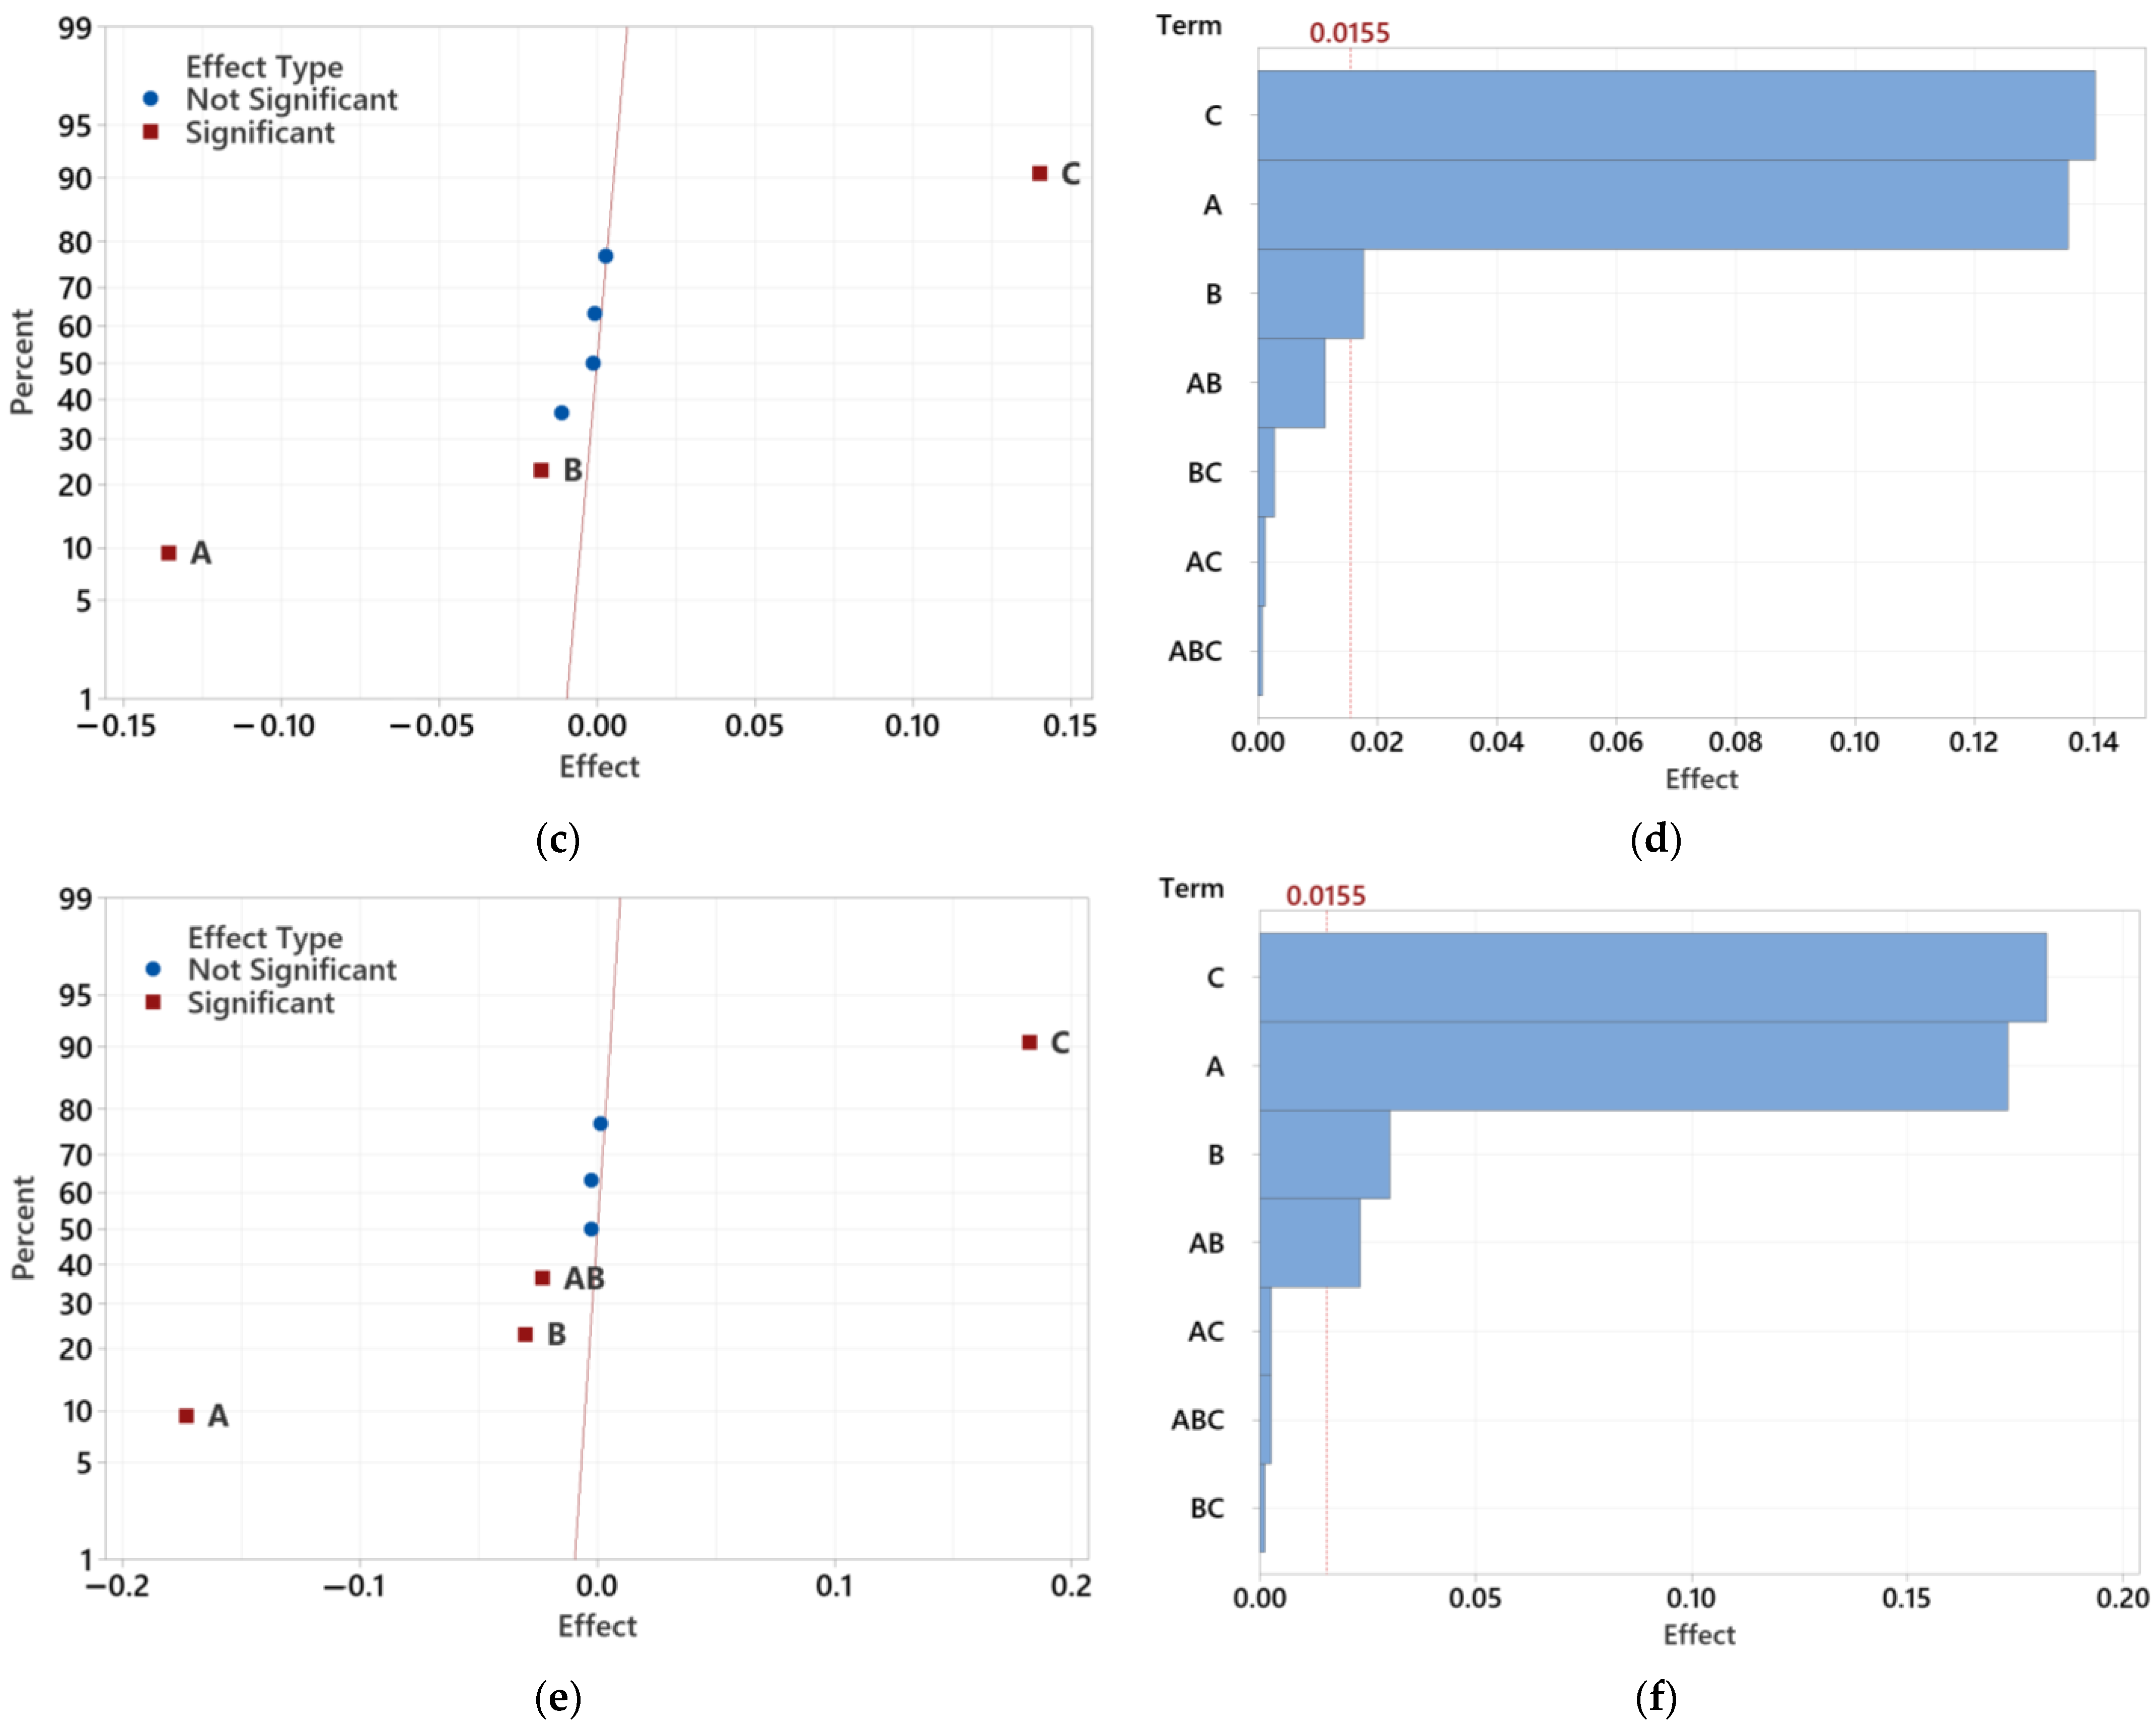
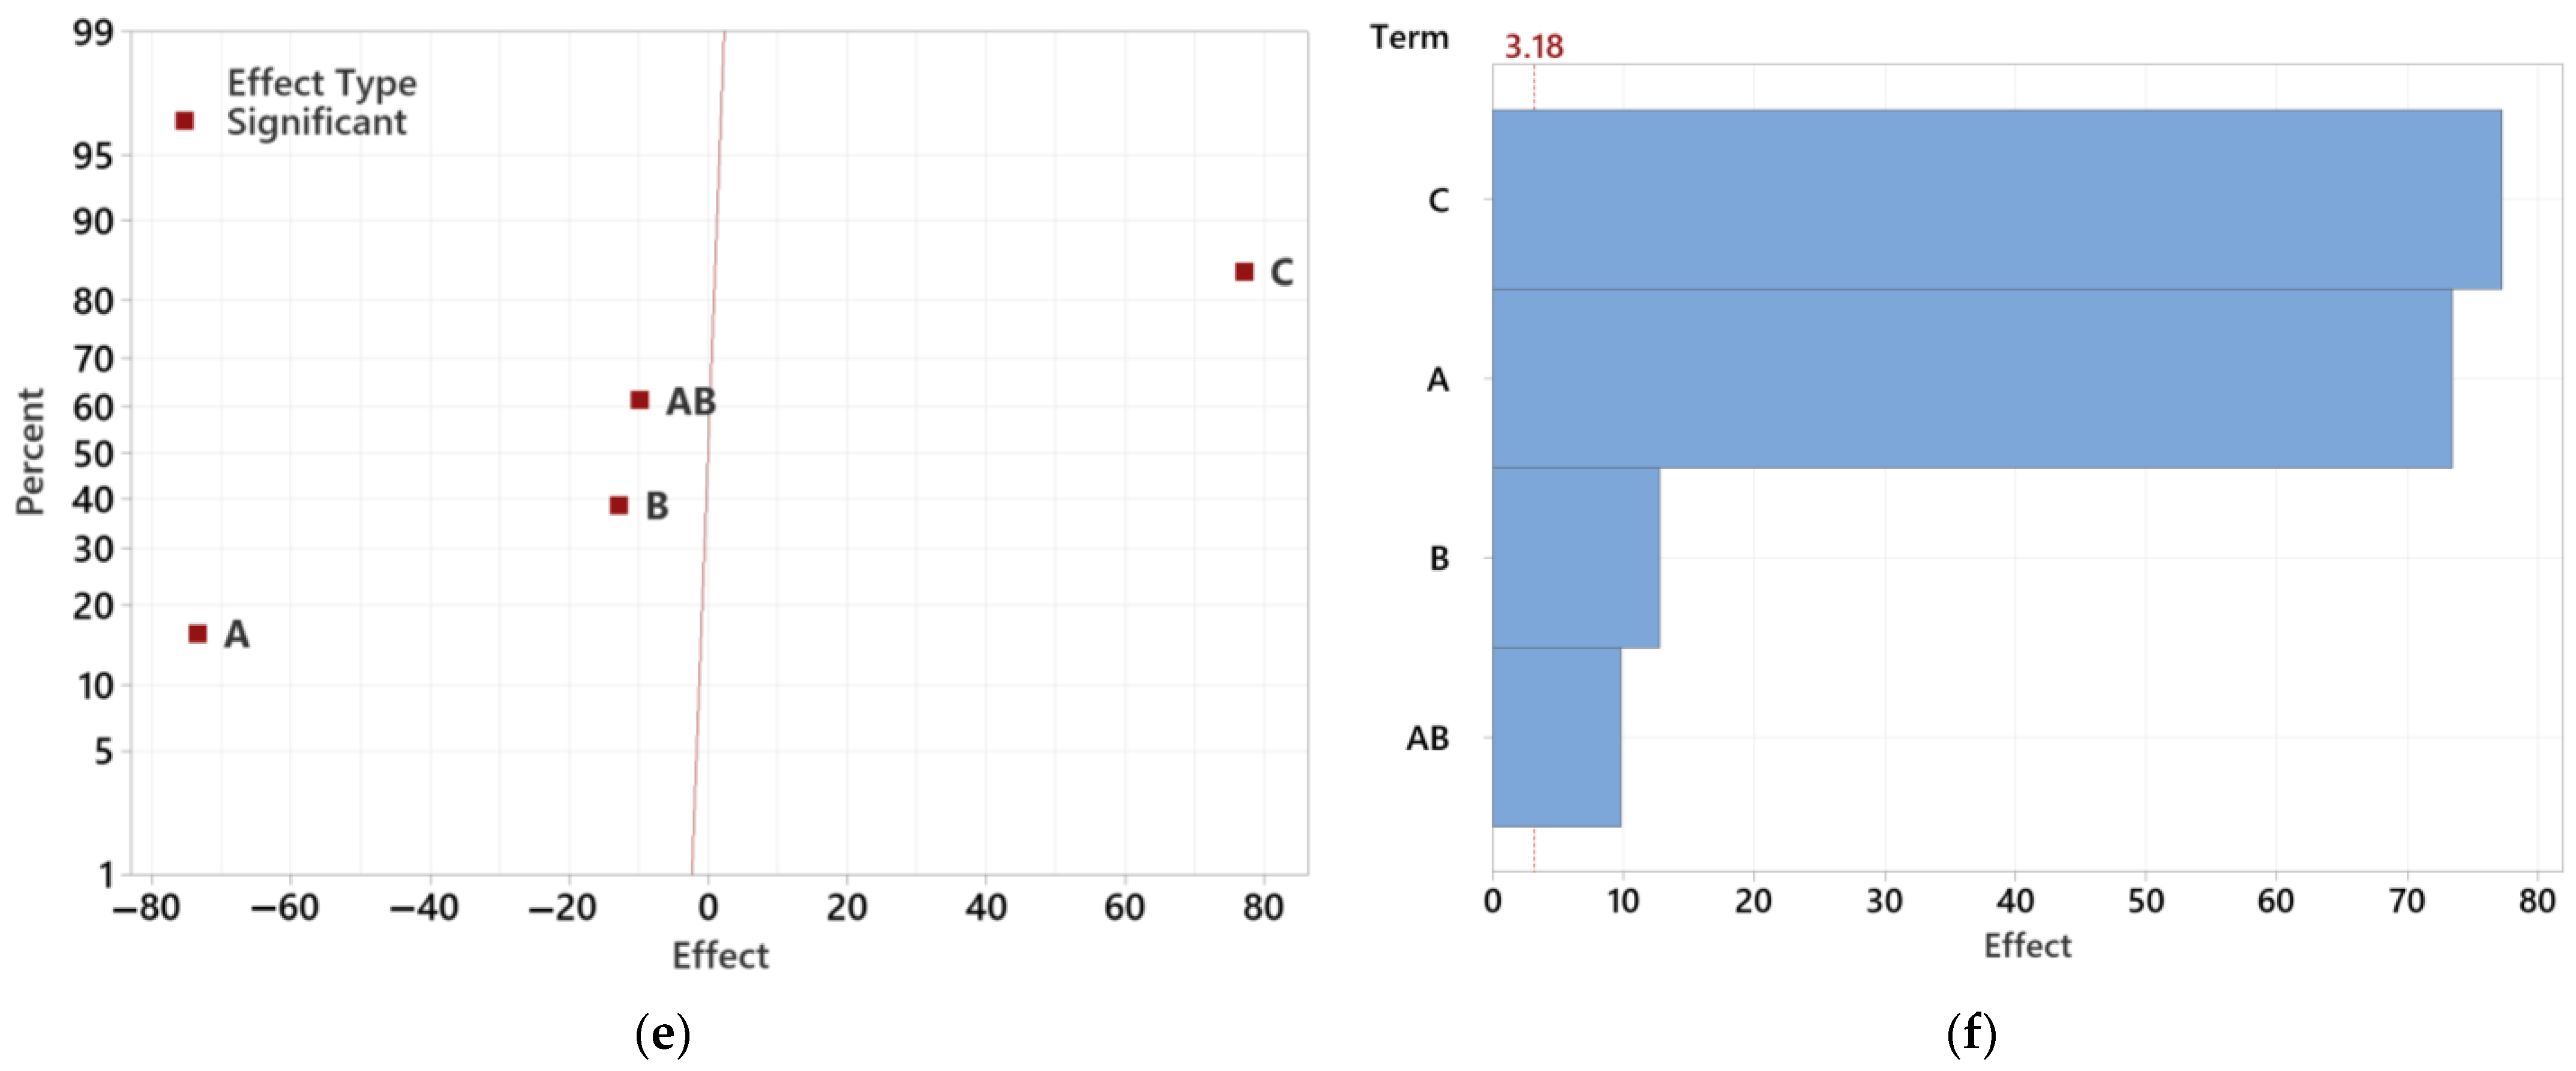
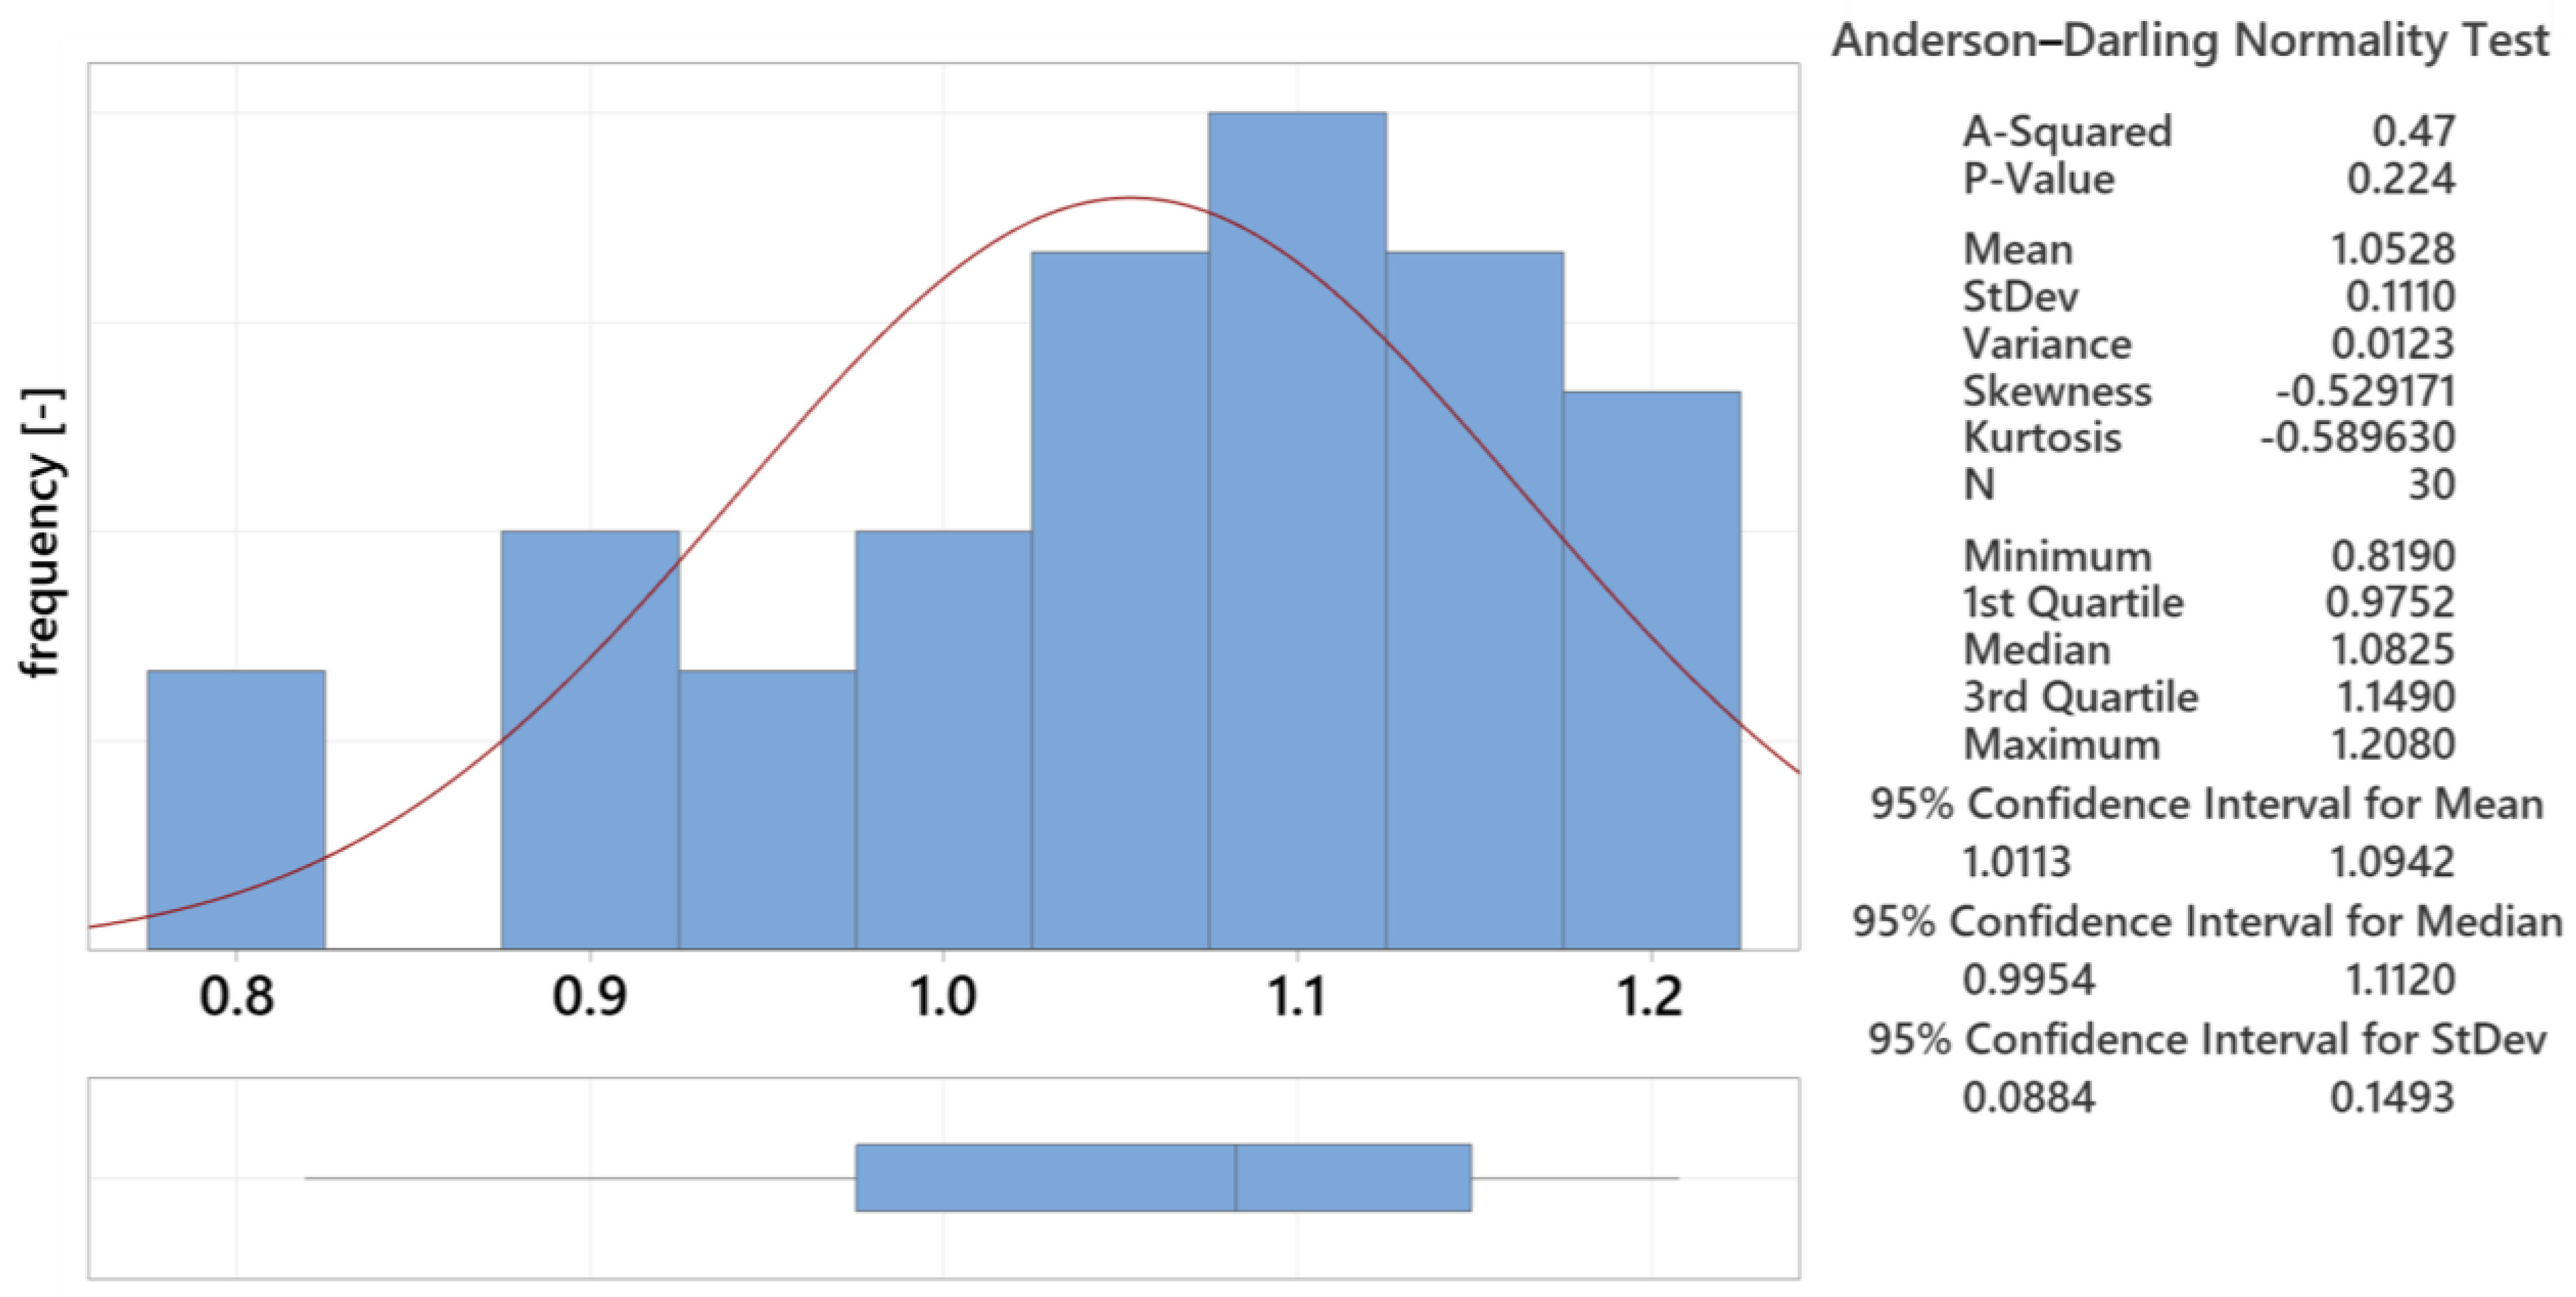
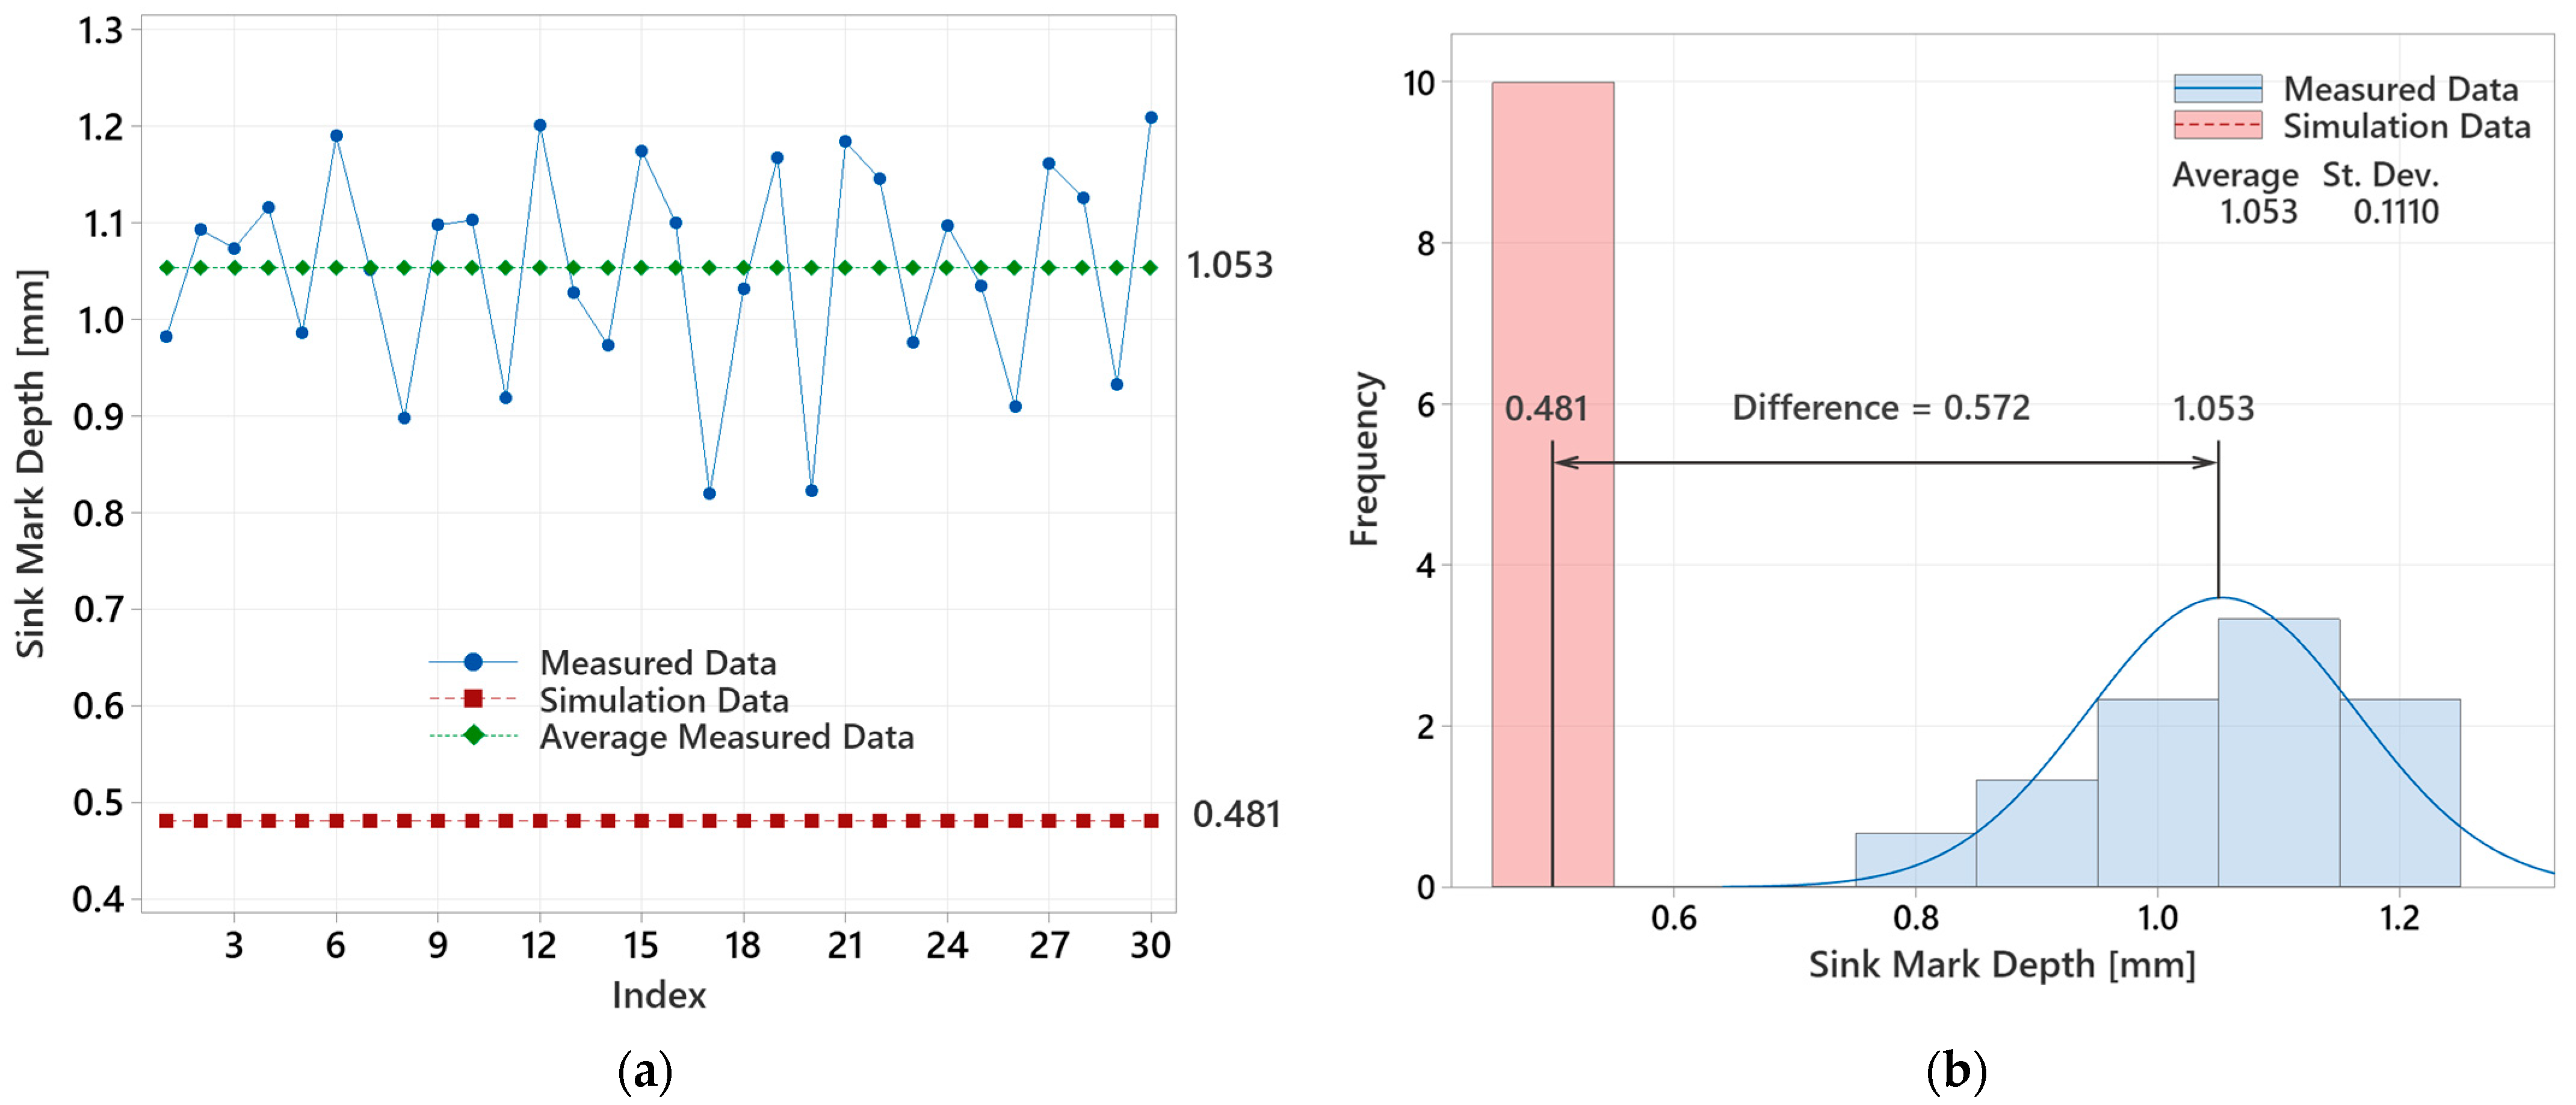
3.5.2. Analysis of Statistical Data for 16.5 mm Thick Lens
3.5.3. Analysis of Statistical Data for 20.5 mm Thick Lens
3.5.4. Summary of Statistical Evaluation
4. Discussion
5. Conclusions
Author Contributions
Funding
Institutional Review Board Statement
Data Availability Statement
Acknowledgments
Conflicts of Interest
References
- Thick-Walled Lenses: Efficient Production. Available online: https://en.kunststoffe.de/a/specialistarticle/thick-walled-lenses-efficient-production-263942 (accessed on 28 March 2023).
- Hopmann, C.; Robig, M. Application of a multilayer injection molding process for thick-walled optical components. J. Polym. Eng. 2016, 36, 557–562. [Google Scholar] [CrossRef]
- Nian, S.; Zhao, X.; Jiang, Z.; Xu, Y.; Yang, Y. Multilayer injection molding of high-profile convex lens. J. Appl. Polym. Sci. 2020, 137, e48600. [Google Scholar] [CrossRef]
- Liemann, S.; Schneider, J.; Reger, K.; Niendorf, T.; Ahorn, M.; Luger, S. Reducing Production Cycle Times of Thick Lenses by Applying Simulation and Multi-Layer Technology. In Proceedings of the 4th International LED Professional Symposium + Expo, Bregenz, Austria, 30 September–2 October 2014. [Google Scholar]
- Wang, M.W.; Liu, J.; Li, H.; Wang, X. Modeling and Analysis of Multi-Shot Injection Molding of Blu-Ray Objective Lens. J. Mech. Sci. Technol. 2018, 32, 4839–4849. [Google Scholar] [CrossRef]
- Han, S.R.; Kim, H.S.; Cho, Y.S.; Lee, S.J.; Jung, Y.G.; Park, S.J.; Choi, J.H. Numerical and experimental studies of injection compression molding process for thick plastic gas valve stem. Int. J. Adv. Manuf. Technol. 2016, 89, 651–660. [Google Scholar] [CrossRef]
- Motegi, A.; Iwai, Y.; Takahashi, H.; Suzuki, N.; Miyatake, T.; Kobayashi, T. Restraint of Voids Generated Inside Injection Molded Products by In-Mold Pressing Method. Int. J. Autom. Technol. 2018, 12, 930–943. [Google Scholar] [CrossRef]
- Zhao, J.; Yang, Z.; Xiong, J.; Li, X.; Liang, J.; Zhai, W. Preparation of polypropylene-based thermally conductive composites via multiple injection compression molding method. Compos. Commun. 2022, 31, 101331. [Google Scholar] [CrossRef]
- Dick, L.; Brock, P.; Herges, R.; Hildenbrand, M.; Lang, A.; Löser, M.; Schmitt, A.; Steinhauer, T.; Völkel, R. Injection Molded High Precision Freeform Optics for High Volume Applications. Adv. Opt. Technol. 2012, 1, 43–50. [Google Scholar] [CrossRef]
- Speck, A.; Poltavtsev, D.; Marquart, L.; Neumann, T.; Reithmeier, E. Deflectometric Analysis of High Volume Injection Molds for Production of Occupational Eye Wear. Z. Med. Phys. 2013, 23, 314–323. [Google Scholar] [CrossRef]
- Huang, M.S.; Chen, T.J.; Chang, P.L.; Chen, J.T. Quality Monitoring of Micro-Shrinkage Defects in Thick-Walled Injection Molded Components. Measurement 2022, 201, 111733. [Google Scholar] [CrossRef]
- Wu, C.; Li, Z.; Wang, H.; Zhang, W. Optimization of Compression Molding for Double-Concave Lenses. Int. J. Adv. Manuf. Technol. 2023, 125, 5089–5099. [Google Scholar] [CrossRef]
- Liu, Y.; Zhang, X.; Jiang, L.; Luo, X. Multi-Layer Counter-Pressure Injection Molding for Thick-Walled Optical Lens. Int. Polym. Process. 2021, 36, 131–136. [Google Scholar] [CrossRef]
- Gotlih, J.; Petrovic, Z.; Smoljanic, J. Influence of Injection Molding Process Parameters on Part Quality. In Proceedings of the International Conference on New Technologies, Development and Application, Sarajevo, Bosnia and Herzegovina, 28–30 June 2018. [Google Scholar]
- Hopmann, C. Investigation of an Inverse Thermal Injection Mould Design Methodology in Dependence of the Part Geometry. Int. J. Mater. Form. 2021, 14, 309–321. [Google Scholar] [CrossRef]
- Solanki, B.S.; Gupta, A.K.; Jha, A.K.; Pathak, H.; Awasthi, A. Modeling and Analysis of Cavity Modification Effect on Quality of Injection Molded Polymer Gear. Int. J. Interact. Des. Manuf. 2022, 16, 1615–1632. [Google Scholar] [CrossRef]
- Park, H.S.; Dang, P. Development of a Smart Plastic Injection Mold with Conformal Cooling Channels. In Proceedings of the 45th SME North American Manufacturing Research Conference, Los Angeles, CA, USA, 4–8 June 2017; Elsevier Science BV: Amsterdam, The Netherlands, 2017; Volume 10, pp. 48–59. [Google Scholar] [CrossRef]
- Torres-Alba, A.; Mercado-Colmenero, J.M.; Catalan-Requena, J.; Martin-Doñate, C. Application of New Triple Hook-Shaped Conformal Cooling Channels for Cores and Sliders in Injection Molding to Reduce Residual Stress and Warping in Complex Plastic Optical Parts. Polymers 2021, 13, 2944. [Google Scholar] [CrossRef] [PubMed]
- Mercado-Colmenero, J.M.; Torres-Alba, A.; Catalan-Requena, J.; Martin-Doñate, C. A New Conformal Cooling System for Plastic Collimators Based on the Use of Complex Geometries and Optimization of Temperature Profiles. Polymers 2021, 13, 2744. [Google Scholar] [CrossRef] [PubMed]
- Kuo, C.-C.; Lin, P.-H.; Xu, J.-Y.; Lin, Z.-X.; Wang, Z.-H.; Lai, Z.-J.; Huang, S.-H. Development of a Silicone Rubber Mold with an Innovative Waterfall Cooling Channel. Polymers 2024, 16, 256. [Google Scholar] [CrossRef] [PubMed]
- Hanzlik, J.; Vanek, J.; Pata, V.; Senkerik, V.; Polaskova, M.; Kruzelak, J.; Bednarik, M. The Impact of Surface Roughness on Conformal Cooling Channels for Injection Molding. Materials 2024, 17, 2477. [Google Scholar] [CrossRef]
- Yang, B.; Wang, C.; Li, D. 3D Simulation of Shrinkage Behaviour of Injection-Molded Poly(lactic acid): Effect of Processing Parameters and Part Thickness. Asian J. Chem. 2014, 30, 1337–1340. [Google Scholar] [CrossRef]
- Studer, M.; Ehrig, F. Minimizing Part Warpage in Injection Molding by Optimizing Wall Thickness Distribution. Adv. Polym. Technol. 2014, 33, 21454. [Google Scholar] [CrossRef]
- Nasir, S.M.; Wahab, M.S.; Harun, Z.; Mamat, A.M.I. Evaluation of Shrinkage and Weld Line Strength of Thick Flat Part in Injection Moulding Process. J. Braz. Soc. Mech. Sci. Eng. 2021, 43, 452. [Google Scholar] [CrossRef]
- Roslan, N.; Ahmad, M.; Sahrim, A.; Omar, N.A.; Hassan, Z.F. Optimisation of Shrinkage and Strength on Thick Plate Part Using Recycled LDPE Materials. Materials 2021, 14, 1795. [Google Scholar] [CrossRef] [PubMed]
- Lai, H.E.; Wang, P.J. Study of Process Parameters on Optical Qualities for Injection-Molded Plastic Lenses. Appl. Opt. 2008, 47, 2017–2027. [Google Scholar] [CrossRef] [PubMed]
- Tsai, K.M.; Tang, B.H. Determination of Injection Molding Process Window Based on Form Accuracy of Lens Using Response Surface Methodology. Int. J. Adv. Manuf. Technol. 2014, 75, 947–958. [Google Scholar] [CrossRef]
- Lin, C.M.; Chen, W.C. Optimization of Injection-Molding Processing Conditions for Plastic Double-Convex Fresnel Lens Using Grey-Based Taguchi Method. Microsyst. Technol. 2020, 26, 2575–2588. [Google Scholar] [CrossRef]
- Wang, M.W.; Shen, Y.K.; Kuo, Y.C. The Study of Optimal Molding of a LED Lens with Grey Relational Analysis and Molding Simulation. Period. Polytech. Mech. Eng. 2019, 63, 278–294. [Google Scholar] [CrossRef]
- Lin, C.M.; Chen, Y.W. Grey Optimization of Injection Molding Processing of Plastic Optical Lens Based on Joint Consideration of Aberration and Birefringence Effects. Microsyst. Technol. 2019, 25, 621–631. [Google Scholar] [CrossRef]
- Lin, C.M.; Wang, C.K. Processing Optimization of Optical Lens in the Injection Molding. Adv. Mater. Res. 2013, 813, 161–164. [Google Scholar] [CrossRef]
- Bensingh, R.; Rajalingam, S.; Kesavan, M.; Muthuraman, G. Minimization of Variation in Volumetric Shrinkage and Deflection on Injection Molding of Bi-Aspheric Lens Using Numerical Simulation. J. Mech. Sci. Technol. 2016, 30, 5143–5152. [Google Scholar] [CrossRef]
- Liu, F.; Pang, J.; Xu, Z. Multi-Objective Optimization of Injection Molding Process Parameters for Moderately Thick Plane Lens Based on PSO-BPNN, OMOPSO, and TOPSIS. Processes 2023, 12, 36. [Google Scholar] [CrossRef]
- Lin, C.M.; Chen, W.C.; Wu, C.H.; Hsieh, H.T. Gate Design Optimization in the Injection Molding of the Optical Lens. Rapid Commun. Optoelectron. Adv. Mater. 2013, 7, 580–584. [Google Scholar]
- Vanek, J.; Stanek, M.; Ovsik, M.; Chalupa, V. Injection Molding of Polycarbonate Thick-Walled Parts Using a Tool with Variously Designed Gate Inserts. Mater. Tehnol. 2023, 57, 299–305. [Google Scholar] [CrossRef]
- Kwak, T.S.; Lee, K.S.; Kim, H.J.; Kim, S.Y. Application of Neural Network and Computer Simulation to Improve Surface Profile of Injection Molding Optic Lens. J. Mater. Process. Technol. 2005, 170, 24–31. [Google Scholar] [CrossRef]
- Liu, X.; Wu, Y.; Chen, Z.; Wang, Q. Fabrication of Plano-Concave Plastic Lens by Novel Injection Molding Using Carbide-Bonded Graphene-Coated Silica Molds. J. Manuf. Sci. Eng. 2019, 141, 081011. [Google Scholar] [CrossRef] [PubMed]
- Kovács, J.G. Construction of Pre-Deformed Shapes for Rapid Tooling in Injection Molding. Macromol. Symp. 2006, 239, 259–265. [Google Scholar] [CrossRef]
- Li, W.Z.; Wang, S.H. Pre-Deformed Design of Optical Lenses with Reverse Engineering and Virtual Manufacturing. Appl. Mech. Mater. 2014, 599–601, 391–395. [Google Scholar] [CrossRef]


| Parameters | Thickness of Test Sample | ||
|---|---|---|---|
| 12.5 mm | 16.5 mm | 20.5 mm | |
| Number of Elements | 220,265 | 324,226 | 489,055 |
| Connected Nodes | 33,924 | 59,362 | 86,800 |
| Maximum Element Aspect Ratio | 11.37 | 14.86 | 16.14 |
| Minimum Element Aspect Ratio | 1.04 | 1.05 | 1.03 |
| Average Element Aspect Ratio | 2.64 | 2.83 | 3.28 |
| Volume of Tetra Elements | 19.51 cm3 | 24.39 cm3 | 29.96 cm3 |
| Maximum Dihedral Angle | 172.7° | 173.1° | 173.5° |
| Selected Simulation Parameters | |
|---|---|
| Injection Molded Material | PC Makrolon LED 2245 (Covestro AG, Leverkusen, Germany) |
| Mold Material | Tool Steel P20 (1.2311) (Meusburger Georg GmbH + Co KG, Wolfurt, Austria) |
| Coolant | Oil (8 L/min) |
| Coolant Channel Diameter | 8 mm |
| Injection Molding Machine | Arburg Allrounder 470 E 1000-290 (Arburg GmbH + Co KG, Loßburg, Germany) |
| Melt Temperature Values | 250 °C, 275 °C, 300 °C |
| Mold Temperature Values | 80 °C, 100 °C, 120 °C |
| Ejection Temperature | 130 °C |
| Filling Time | 2 s |
| Injection Pressure | Automatically |
| Velocity/Pressure Switchover | at 99% of Cavity Volume Filled |
| Packing Pressure | 80% of injection pressure (48 or 80 MPa) |
| Packing Time | 10 s |
| Gate Type | Gate Freeze Time [s] | Shear Stress [MPa] | Shear Rate [1/s] |
|---|---|---|---|
| Point (A) | 5.9 | 0.93 | 9760 |
| Sub-gate (B) | 5.7 | 1.02 | 11,760 |
| Three-point (C) | 5.6 | 0.66 | 3690 |
| Fan gate (D) | 7.6 | 0.46 | 3780 |
| Film type 1 (E) | 7.7 | 0.49 | 3130 |
| Film type 2 (F) | 7.5 | 0.39 | 2670 |
| Input Factor | Process Parameter | Test Level 1 (Min. Value) | Test Level 2 (Max. Value) | Unit |
|---|---|---|---|---|
| A | Injection Pressure | 60 | 100 | MPa |
| B | Mold Temperature | 80 | 120 | °C |
| C | Melt Temperature | 250 | 300 | °C |
| Run Order | Injection Pressure [MPa] | Mold Temperature [MPa] | Melt Temperature [MPa] | Sink M. Depth Lens 12.5 [mm] | Sink M. Depth Lens 16.5 [mm] | Sink M. Depth Lens 20.5 [mm] |
|---|---|---|---|---|---|---|
| 1 | 60 | 80 | 250 | 0.466 | 0.636 | 0.802 |
| 2 | 100 | 80 | 250 | 0.369 | 0.512 | 0.652 |
| 3 | 60 | 120 | 250 | 0.458 | 0.626 | 0.791 |
| 4 | 100 | 120 | 250 | 0.348 | 0.481 | 0.600 |
| 5 | 60 | 80 | 300 | 0.560 | 0.774 | 0.983 |
| 6 | 100 | 80 | 300 | 0.461 | 0.649 | 0.833 |
| 7 | 60 | 120 | 300 | 0.555 | 0.771 | 0.980 |
| 8 | 100 | 120 | 300 | 0.440 | 0.622 | 0.778 |
| Order of Statistical Significance | Lens 12.5 mm | Lens 16.5 mm | Lens 20.5 mm |
|---|---|---|---|
| 1. | A | C | C |
| 2. | C | A | A |
| 3. | B | B | B |
| 4. | AB | AB | AB |
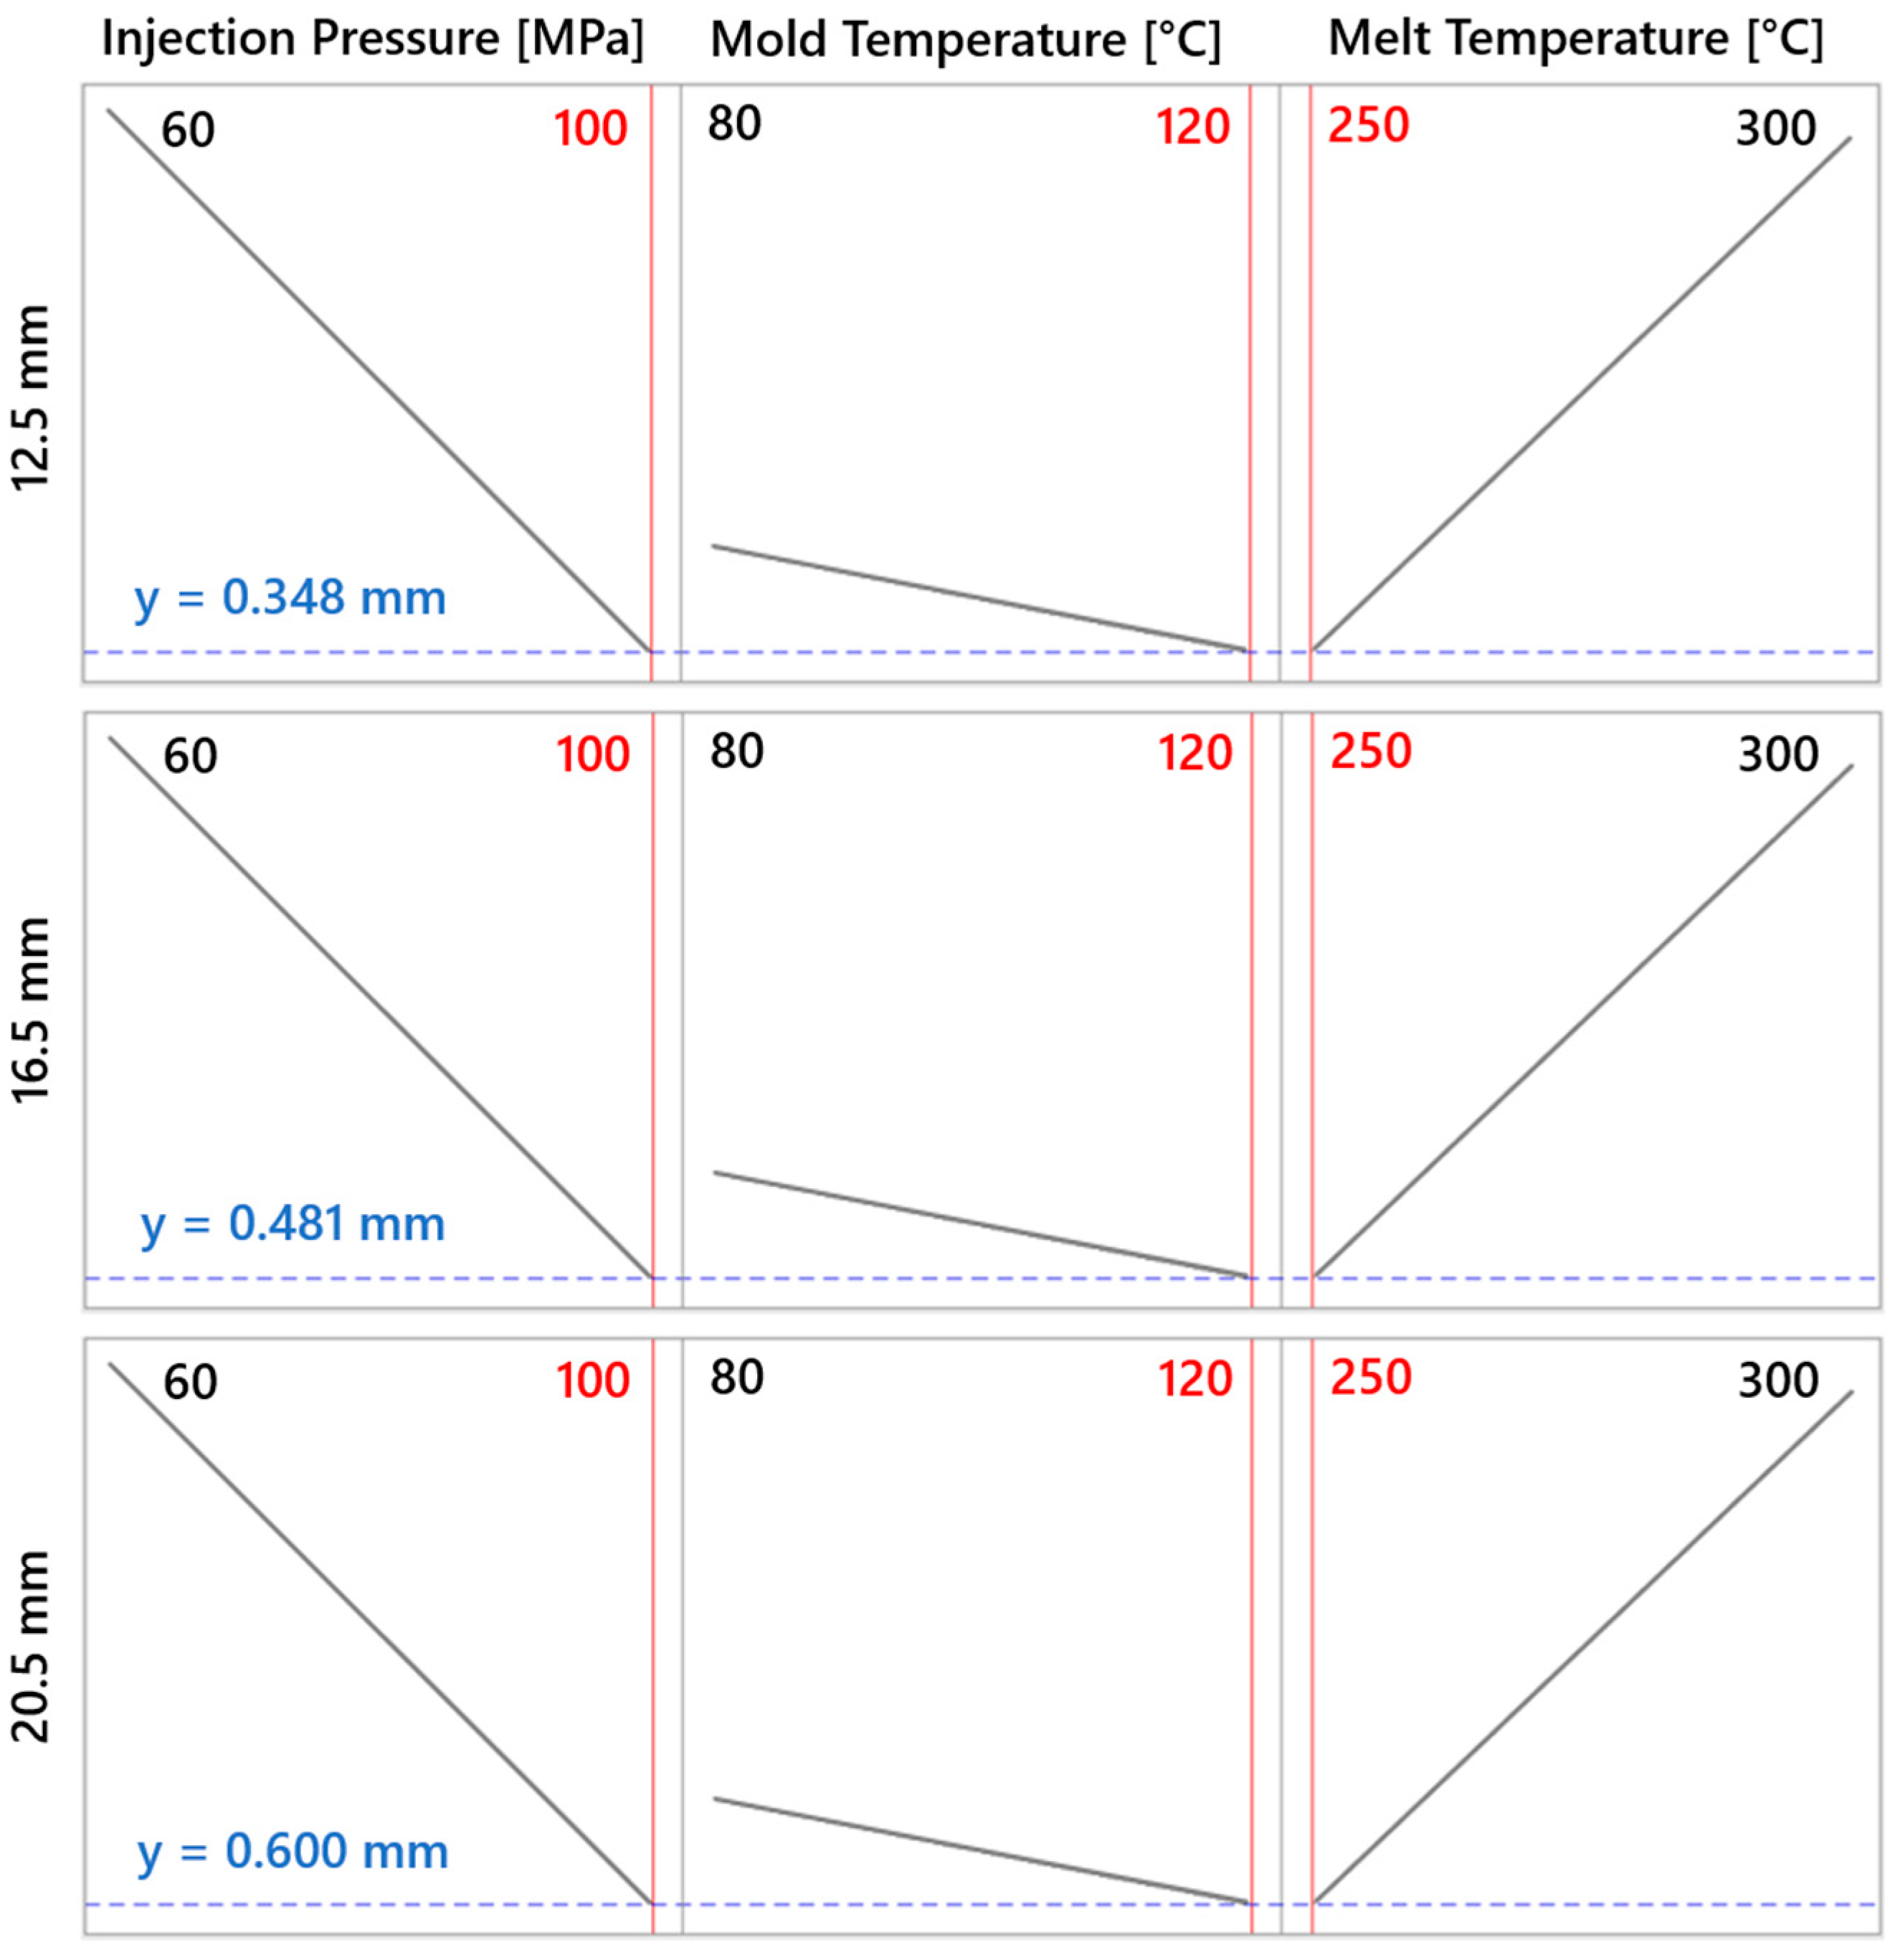
| Evaluated Parameter | Lens 12.5 mm | Lens 16.5 mm | Lens 20.5 mm |
|---|---|---|---|
| Min. Sink Mark Depth [mm] | 0.348 | 0.481 | 0.600 |
| Injection Pressure [MPa] | 100 | 100 | 100 |
| Mold Temperature [°C] | 120 | 120 | 120 |
| Melt Temperature [°C] | 250 | 250 | 250 |
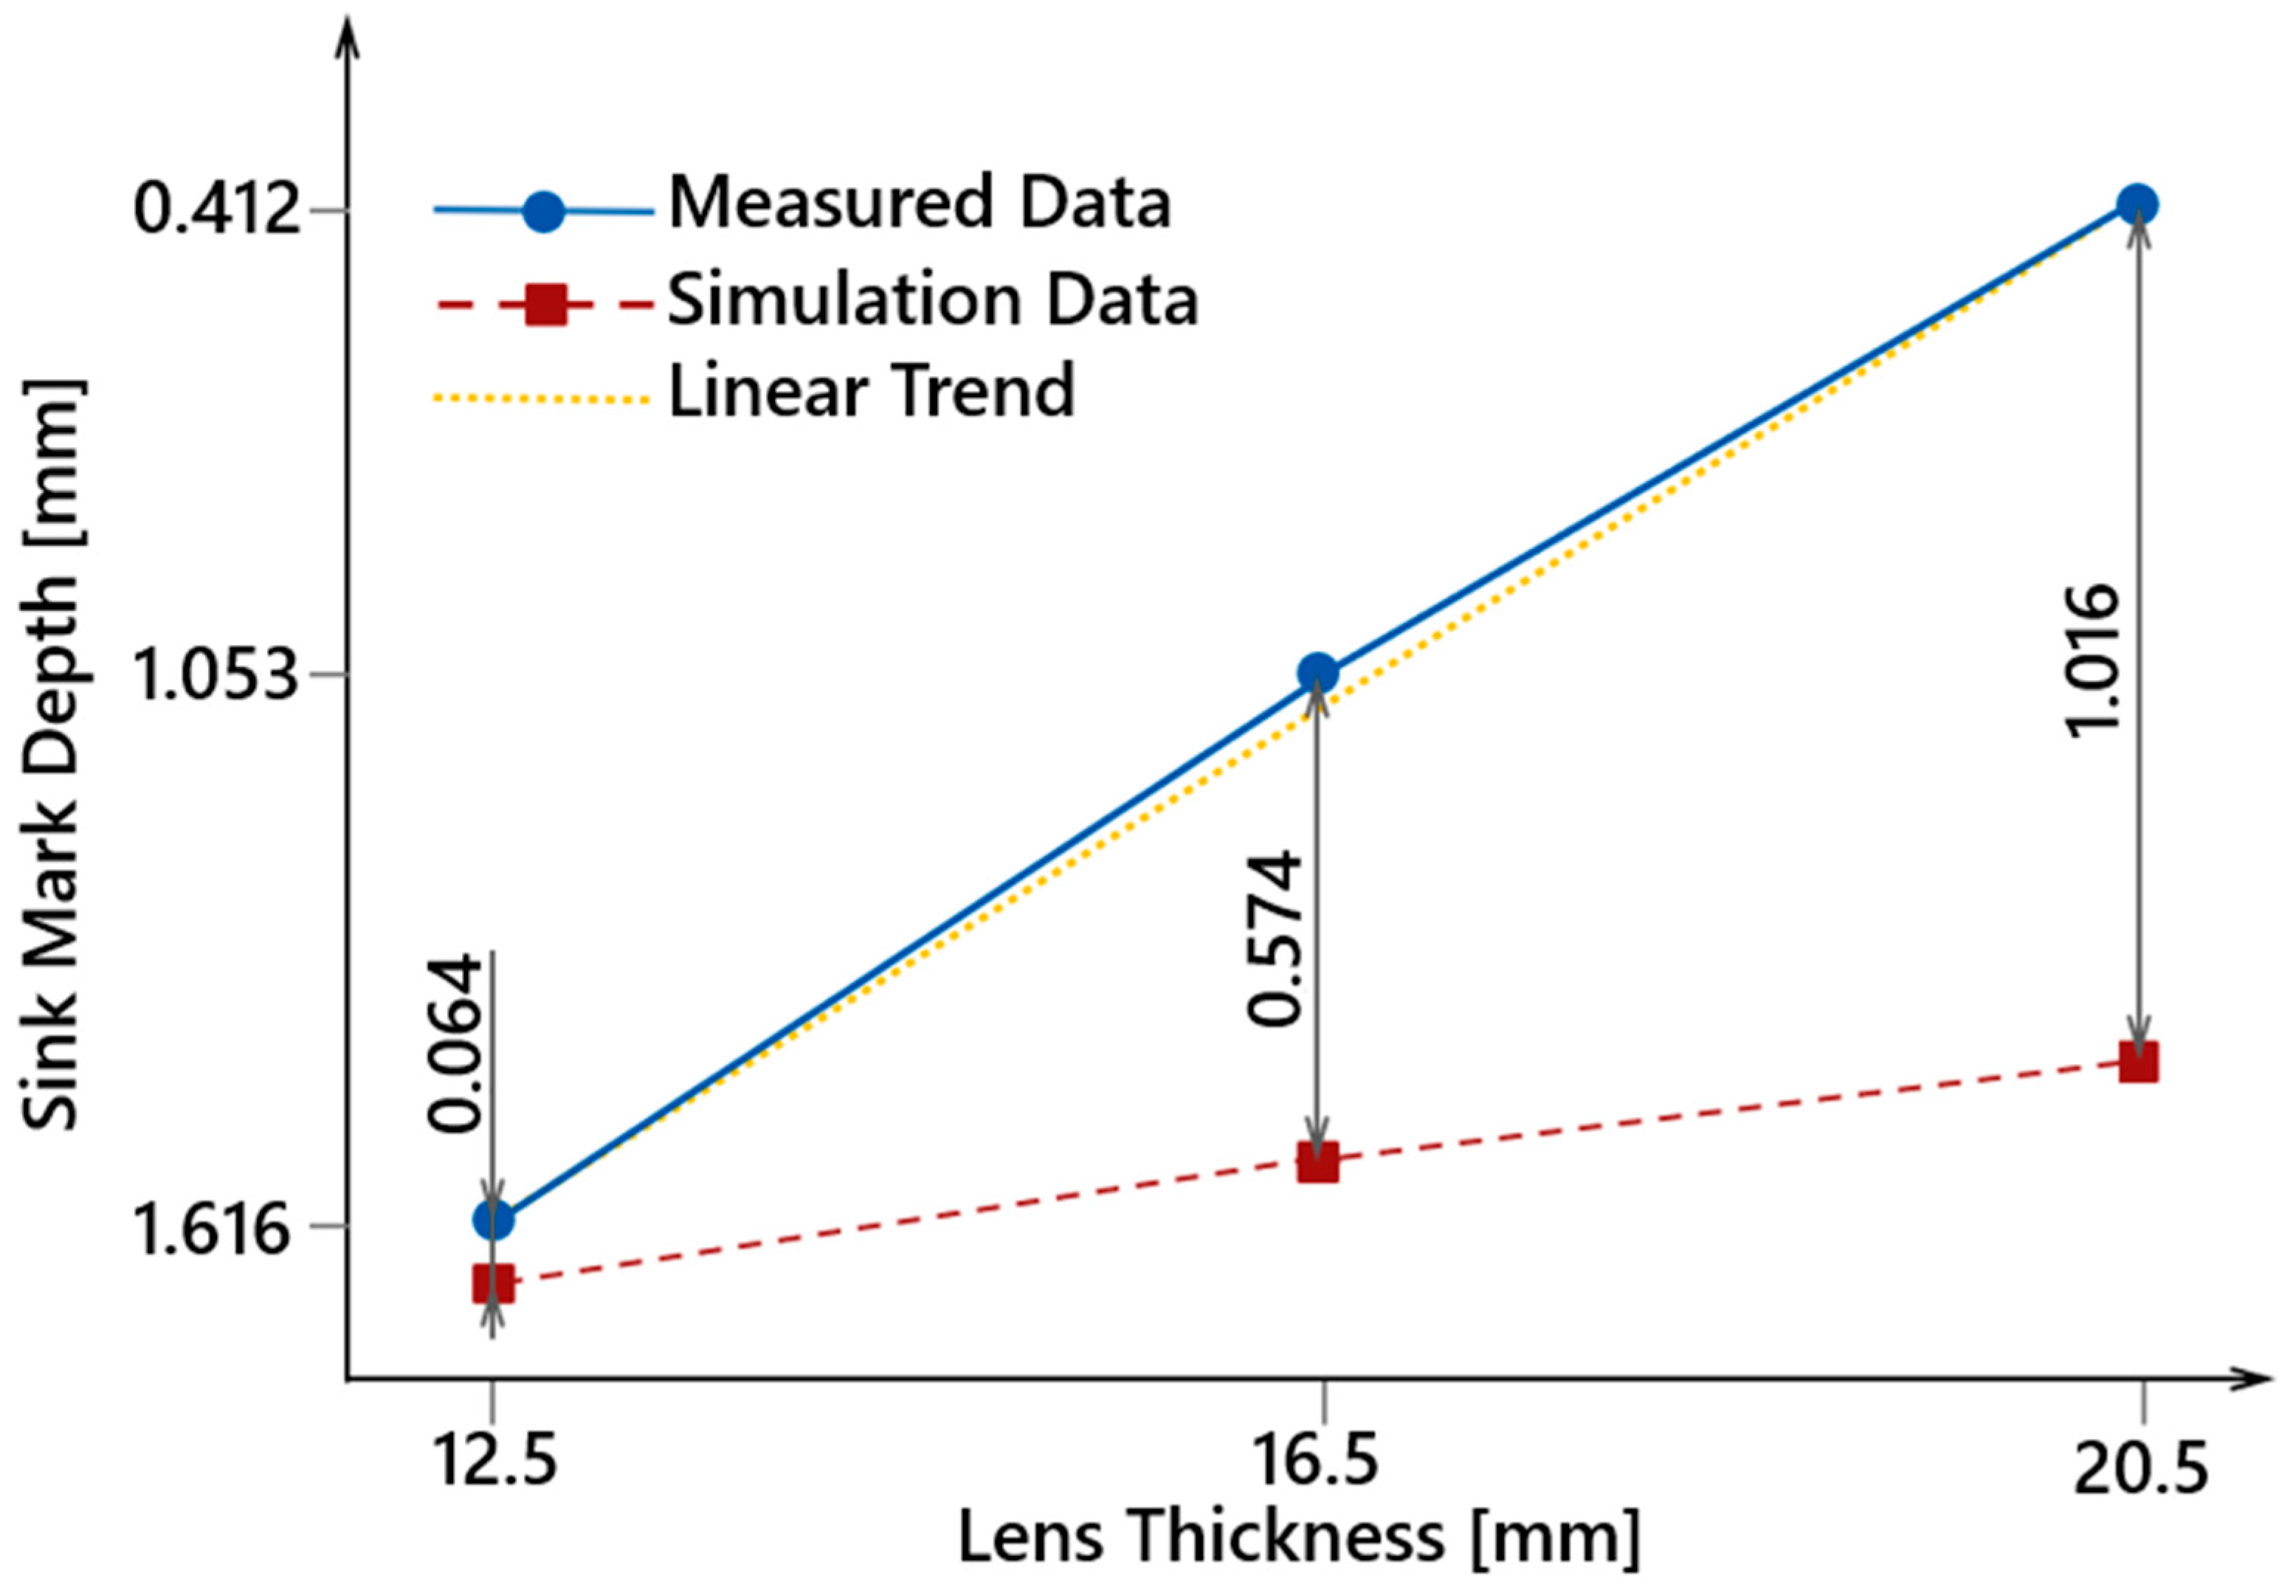
| Lens Thickness [mm] | Measured Sink Depth [mm] | Simulated Sink Depth [mm] | Difference [mm] |
|---|---|---|---|
| 12.5 | 0.412 ± 0.018 | 0.348 | 0.064 |
| 16.5 | 1.053 ± 0.111 | 0.481 | 0.572 |
| 20.5 | 1.616 ± 0.138 | 0.600 | 1.061 |
Disclaimer/Publisher’s Note: The statements, opinions and data contained in all publications are solely those of the individual author(s) and contributor(s) and not of MDPI and/or the editor(s). MDPI and/or the editor(s) disclaim responsibility for any injury to people or property resulting from any ideas, methods, instructions or products referred to in the content. |
© 2024 by the authors. Licensee MDPI, Basel, Switzerland. This article is an open access article distributed under the terms and conditions of the Creative Commons Attribution (CC BY) license (https://creativecommons.org/licenses/by/4.0/).
Share and Cite
Vanek, J.; Ovsik, M.; Stanek, M.; Hanzlik, J.; Pata, V. Study of Injection Molding Process to Improve Geometrical Quality of Thick-Walled Polycarbonate Optical Lenses by Reducing Sink Marks. Polymers 2024, 16, 2318. https://doi.org/10.3390/polym16162318
Vanek J, Ovsik M, Stanek M, Hanzlik J, Pata V. Study of Injection Molding Process to Improve Geometrical Quality of Thick-Walled Polycarbonate Optical Lenses by Reducing Sink Marks. Polymers. 2024; 16(16):2318. https://doi.org/10.3390/polym16162318
Chicago/Turabian StyleVanek, Jiri, Martin Ovsik, Michal Stanek, Jan Hanzlik, and Vladimir Pata. 2024. "Study of Injection Molding Process to Improve Geometrical Quality of Thick-Walled Polycarbonate Optical Lenses by Reducing Sink Marks" Polymers 16, no. 16: 2318. https://doi.org/10.3390/polym16162318
APA StyleVanek, J., Ovsik, M., Stanek, M., Hanzlik, J., & Pata, V. (2024). Study of Injection Molding Process to Improve Geometrical Quality of Thick-Walled Polycarbonate Optical Lenses by Reducing Sink Marks. Polymers, 16(16), 2318. https://doi.org/10.3390/polym16162318