Flexibility of Poly(alkyl methacrylate)s Characterized by Their Persistence Length Determined through Pyrene Excimer Formation
Abstract
1. Introduction
2. Materials and Methods
3. Results
3.1. Analysis of the Fluorescence Spectra
3.2. Fluorescence Decay Analysis
4. Discussion
5. Conclusions
Supplementary Materials
Author Contributions
Funding
Institutional Review Board Statement
Data Availability Statement
Conflicts of Interest
References
- Ngai, K.L. The Glassy State and the Glass Transition. In Physical Properties of Polymers, 3rd ed.; Mark, J., Ngai, K., Graessley, W., Mandelkern, L., Samulski, E., Koenig, J., Wignall, G., Eds.; Cambridge University Press: Cambridge, UK, 2004; pp. 72–152. [Google Scholar]
- Kawaguchi, T.; Kanaya, T.; Kaji, K. Fast Relaxations of Amorphous Polystyrene. Phys. B Condens. Matter 1995, 213–214, 510–512. [Google Scholar] [CrossRef]
- Faucher, J.A.; Koleske, J.V.; Santee, E.R.; Stratta, J.J.; Wilson, C.W. Glass Transitions of Ethylene Oxide Polymers. J. Appl. Phys. 1966, 37, 3962–3964. [Google Scholar] [CrossRef]
- Murthy, S.S.N. Liquid-Liquid Transition in Polymers and Glass-Forming Liquids. J. Polym. Sci. Part B Polym. Phys. 1993, 31, 475–480. [Google Scholar] [CrossRef]
- Casier, R.; Duhamel, J. The Effect of Glycine on the Local Conformation and Internal Backbone Dynamics of Polypeptides. Macromolecules 2021, 54, 8904–8912. [Google Scholar] [CrossRef]
- Casier, R.; Duhamel, J. Blob-Based Approach to Estimate the Folding Time of Proteins Supported by Pyrene Excimer Fluorescence Experiments. Macromolecules 2020, 53, 9823–9835. [Google Scholar] [CrossRef]
- Casier, R.; Duhamel, J. Synergetic Effects of Alanine and Glycine in Blob-Based Methods for Predicting Protein Folding Times. J. Phys. Chem. B 2023, 127, 1325–1337. [Google Scholar] [CrossRef] [PubMed]
- Morse, D.C. Viscoelasticity of Concentrated Isotropic Solutions of Semiflexible Polymers. 1. Model and Stress Tensor. Macromolecules 1998, 31, 7030–7043. [Google Scholar] [CrossRef]
- Morse, D.C. Viscoelasticity of Concentrated Isotropic Solutions of Semiflexible Polymers. 2. Linear Response. Macromolecules 1998, 31, 7044–7067. [Google Scholar] [CrossRef]
- Tassieri, M. Dynamics of Semiflexible Polymer Solutions in the Tightly Entangled Concentration Regime. Macromolecules 2017, 50, 5611–5618. [Google Scholar] [CrossRef]
- Daniel, W.F.M.; Burdynska, J.; Vatankhah-Varnoosfaderani, M.; Matyjaszewski, K.; Paturej, J.; Dobrynin, A.V.; Sheiko, S.S. Solvent-Free, Supersoft and Superelastic Bottlebrush Melts and Networks. Nat. Mater. 2015, 15, 183–190. [Google Scholar] [CrossRef]
- Schuldt, C.; Schnauß, J.; Händler, T.; Glaser, M.; Lorenz, J.; Golde, T.; Käs, J.A.; Smith, D.M. Tuning Synthetic Semiflexible Networks by Bending Stiffness. Phys. Rev. Lett. 2016, 117, 197801. [Google Scholar] [CrossRef]
- Eisenberg, B.M.; Flamberg, A.; Kinker, B.G. Polymethacrylate Viscosity Modifiers and Pour Point Depressants. In Lubricant Additives. Chemistry and Applications, 3rd ed.; Rudnick, L.R., Ed.; CRC Press: Boca Raton, FL, USA, 2017; pp. 247–262. [Google Scholar]
- Tricot, M. Chain Flexibility Parameter and Persistence Length of Various Poly(methacrylic acid) Esters. Macromolecules 1986, 19, 1268–1270. [Google Scholar] [CrossRef]
- Zhang, B.; Gröhn, F.; Pedersen, J.S.; Fischer, K.; Schmidt, M. Conformation of Cylindrical Brushes in Solution: Effect of Side Chain Length. Macromolecules 2006, 39, 8440–8450. [Google Scholar] [CrossRef]
- Kikuchi, M.; Nakano, R.; Jinbo, Y.; Saito, Y.; Ohno, S.; Togashi, D.; Enomoto, K.; Narumi, A.; Haba, O.; Kawaguchi, S. Graft Density Dependence of Main Chain Stiffness in Molecular Rod Brushes. Macromolecules 2015, 48, 5878–5886. [Google Scholar] [CrossRef]
- Li, Y.; Zhang, M.; Mao, M.; Turner, S.R.; Moore, R.B.; Mourey, T.H.; Slater, L.A.; Hauenstein, J.R. Chain Stiffness of Stilbene Containing Alternating Copolymers by SAXS and SEC. Macromolecules 2012, 45, 1595–1601. [Google Scholar] [CrossRef]
- Mourey, T.; Le, K.; Bryan, T.; Zheng, S.; Bennett, G. Determining Persistence Length by Size-Exclusion Chromatography. Polymer 2005, 46, 9033–9042. [Google Scholar] [CrossRef]
- Little, H.; Thoma, J.; Yeung, R.; D’Sa, A.; Duhamel, J. Persistence Length and Encounter Frequency Determination from Fluorescence Studies of Pyrene-Labeled Poly(oligo(ethylene glycol) methyl ether methacrylate)s. Macromolecules 2023, 56, 3562–3573. [Google Scholar] [CrossRef]
- Thoma, J.; Little, H.; Duhamel, J.; Zhang, L.; Leung, T. Persistence Length of PEGMA Bottle Brushes Determined by Pyrene Excimer Fluorescence. Polymers 2023, 15, 3958. [Google Scholar] [CrossRef]
- Kanagalingam, S. Segmental Dynamics of Hydrophobically Modified Water-Soluble Polymers in Solution. Ph.D. Thesis, University of Waterloo, Waterloo, ON, Canada, 2003; pp. 44–70. [Google Scholar]
- Muraih, J.K.; Harris, J.; Taylor, S.D.; Palmer, M. Characterization of Daptomycin Oligomerization with Perylene Excimer Fluorescence: Stochiometric Binding of Phosphatidylglycerol Triggers Oligomer Formation. Biochim. Biophys. Acta 2012, 1818, 673–678. [Google Scholar] [CrossRef] [PubMed]
- Kratky, O.; Porod, G. Röntgenuntersuchung Gelöster Fadenmoleküle. Rec. Trav. Chim. 1949, 68, 1106–1122. [Google Scholar] [CrossRef]
- Rathgeber, S.; Pakula, T.; Wilk, A.; Matyjaszewski, K.; Beers, K.L. On The Shape of Bottle-Brush Macromolecules: Systematic Variation of Architectural Parameters. J. Chem. Phys. 2005, 122, 124904. [Google Scholar] [CrossRef] [PubMed]
- Terao, K.; Takeo, Y.; Tazaki, M.; Nakamura, Y.; Norisuye, T. Polymacromonomer Consisting of Polystyrene. Light Scattering Characterization in Cyclohexane. Polym. J. 1999, 31, 193–198. [Google Scholar] [CrossRef]
- Fredrickson, G.H. Surfactant-Induced Lyotropic Behavior of Flexible Polymer Solutions. Macromolecules 1993, 26, 2825–2831. [Google Scholar] [CrossRef]
- Farhangi, S.; Weiss, H.; Duhamel, J. Effect of Side-Chain Length on the Polymer Chain Dynamics of Poly(alkyl methacrylate)s in Solution. Macromolecules 2013, 46, 9738–9747. [Google Scholar] [CrossRef]
- Press, W.H.; Flanery, B.P.; Tenkolsky, S.A.; Vetterling, W.T. Numerical Recipes in Fortran: The Art of Scientific Computing; Cambridge University Press: New York, NY, USA, 1992; pp. 523–528. [Google Scholar]
- Ingratta, M.; Mathew, M.; Duhamel, J. How Switching the Substituent of a Pyrene Derivative from a Methyl to a Butyl Affects the Fluorescence Response of Polystyrene Randomly Labeled with Pyrene. Can. J. Chem. 2010, 88, 217–227. [Google Scholar] [CrossRef]
- Rumble, J.R. Viscosity of Liquids. In CRC Handbook of Chemistry and Physics, 101st ed.; (Electronic ed.); CRC Press: Boca Raton, FL, USA; Taylor & Francis: Abingdon, UK, 1978; pp. 239–242. [Google Scholar]
- Little, H.; Patel, S.; Duhamel, J. Probing the Inner Local Density of Complex Macromolecules by Pyrene Excimer Formation. Phys. Chem. Chem. Phys. 2023, 25, 26515–26525. [Google Scholar] [CrossRef]
- Winnik, M.A. End-to-End Cyclization of Polymer Chains. Acc. Chem. Res. 1985, 18, 73–79. [Google Scholar] [CrossRef]
- Tuschl, T.; Gohlke, C.; Jovin, T.M.; Westhof, E.; Eckstein, F. A Three-Dimensional Model for the Hammerhead Rybozyme Based on Fluorescence Measurements. Science 1994, 266, 785–789. [Google Scholar] [CrossRef] [PubMed]
- Haas, E. The Study of Protein Folding and Dynamics by Determination of Intramolecular Distance Distributions and their Fluctuations Using Ensemble and Single-Molecule FRET Measurements. ChemPhysChem 2005, 6, 858–870. [Google Scholar] [CrossRef]
- Hofmann, H.; Soranno, A.; Borgia, A.; Gast, K.; Nettels, D.; Schuler, B. Polymer Scaling Laws of Unfolded and Intrinsically Disordered Proteins Quantified with Single-Molecule Spectroscopy. Proc. Natl. Acad. Sci. USA 2012, 109, 16155–16160. [Google Scholar] [CrossRef]
- Jacob, M.H.; D’Souza, R.N.; Lazar, A.I.; Nau, W.M. Diffusion-Enhanced Forster Resonance Energy Transfer in Flexible Peptides: From the Haas-Steinberg Partial Differential Equation to a Closed Analytical Expression. Polymers 2023, 15, 705. [Google Scholar] [CrossRef]
- Farhangi, S.; Duhamel, J. Probing Side Chain Dynamics of Branched Macromolecules by Pyrene Excimer Fluorescence. Macromolecules 2016, 49, 353–361. [Google Scholar] [CrossRef]
- Casier, R.; Duhamel, J. Pyrene Excimer Fluorescence as a Direct and Easy Experimental Means to Characterize the Length Scale and Dynamics of Polypeptide Foldons. Macromolecules 2018, 51, 3450–3457. [Google Scholar] [CrossRef]
- Ingratta, M.; Duhamel, J. Effect of Side-chain Length on the Side-chain Dynamics of α-Helical Poly(L-glutamic acid) as Probed by a Fluorescence Blob Model. J. Phys. Chem. B 2008, 112, 9209–9218. [Google Scholar] [CrossRef]
- Li, L.; Kim, D.; Zhai, X.; Duhamel, J. A Pyrene Excimer Fluorescence (PEF) Study of the Interior of Amylopectin in Dilute Solution. Macromolecules 2020, 53, 6850–6860. [Google Scholar] [CrossRef]
- Kim, D.; Duhamel, J. Interior of Glycogen Probed by Pyrene Excimer Fluorescence. Carbohydr. Polym. 2023, 299, 120205. [Google Scholar] [CrossRef]
- Thoma, J.L.; Duhamel, J. Characterization of the Local Volume Probed by the Side Chain Ends of Poly(oligo(ethylene glycol) 1-Pyrenemethyl ether methacrylate) Bottle Brushes in Solution Using Pyrene Excimer Fluorescence. Macromolecules 2021, 54, 9341–9350. [Google Scholar] [CrossRef]
- Patel, S.; McNelles, S.; Adronov, A.; Duhamel, J. Intra-Macromolecular Conformational Changes in Low Generation PAMAM Dendrimers Probed by Pyrene Excimer Formation. J. Phys. Chem. B 2023, 127, 8040–8048. [Google Scholar] [CrossRef]
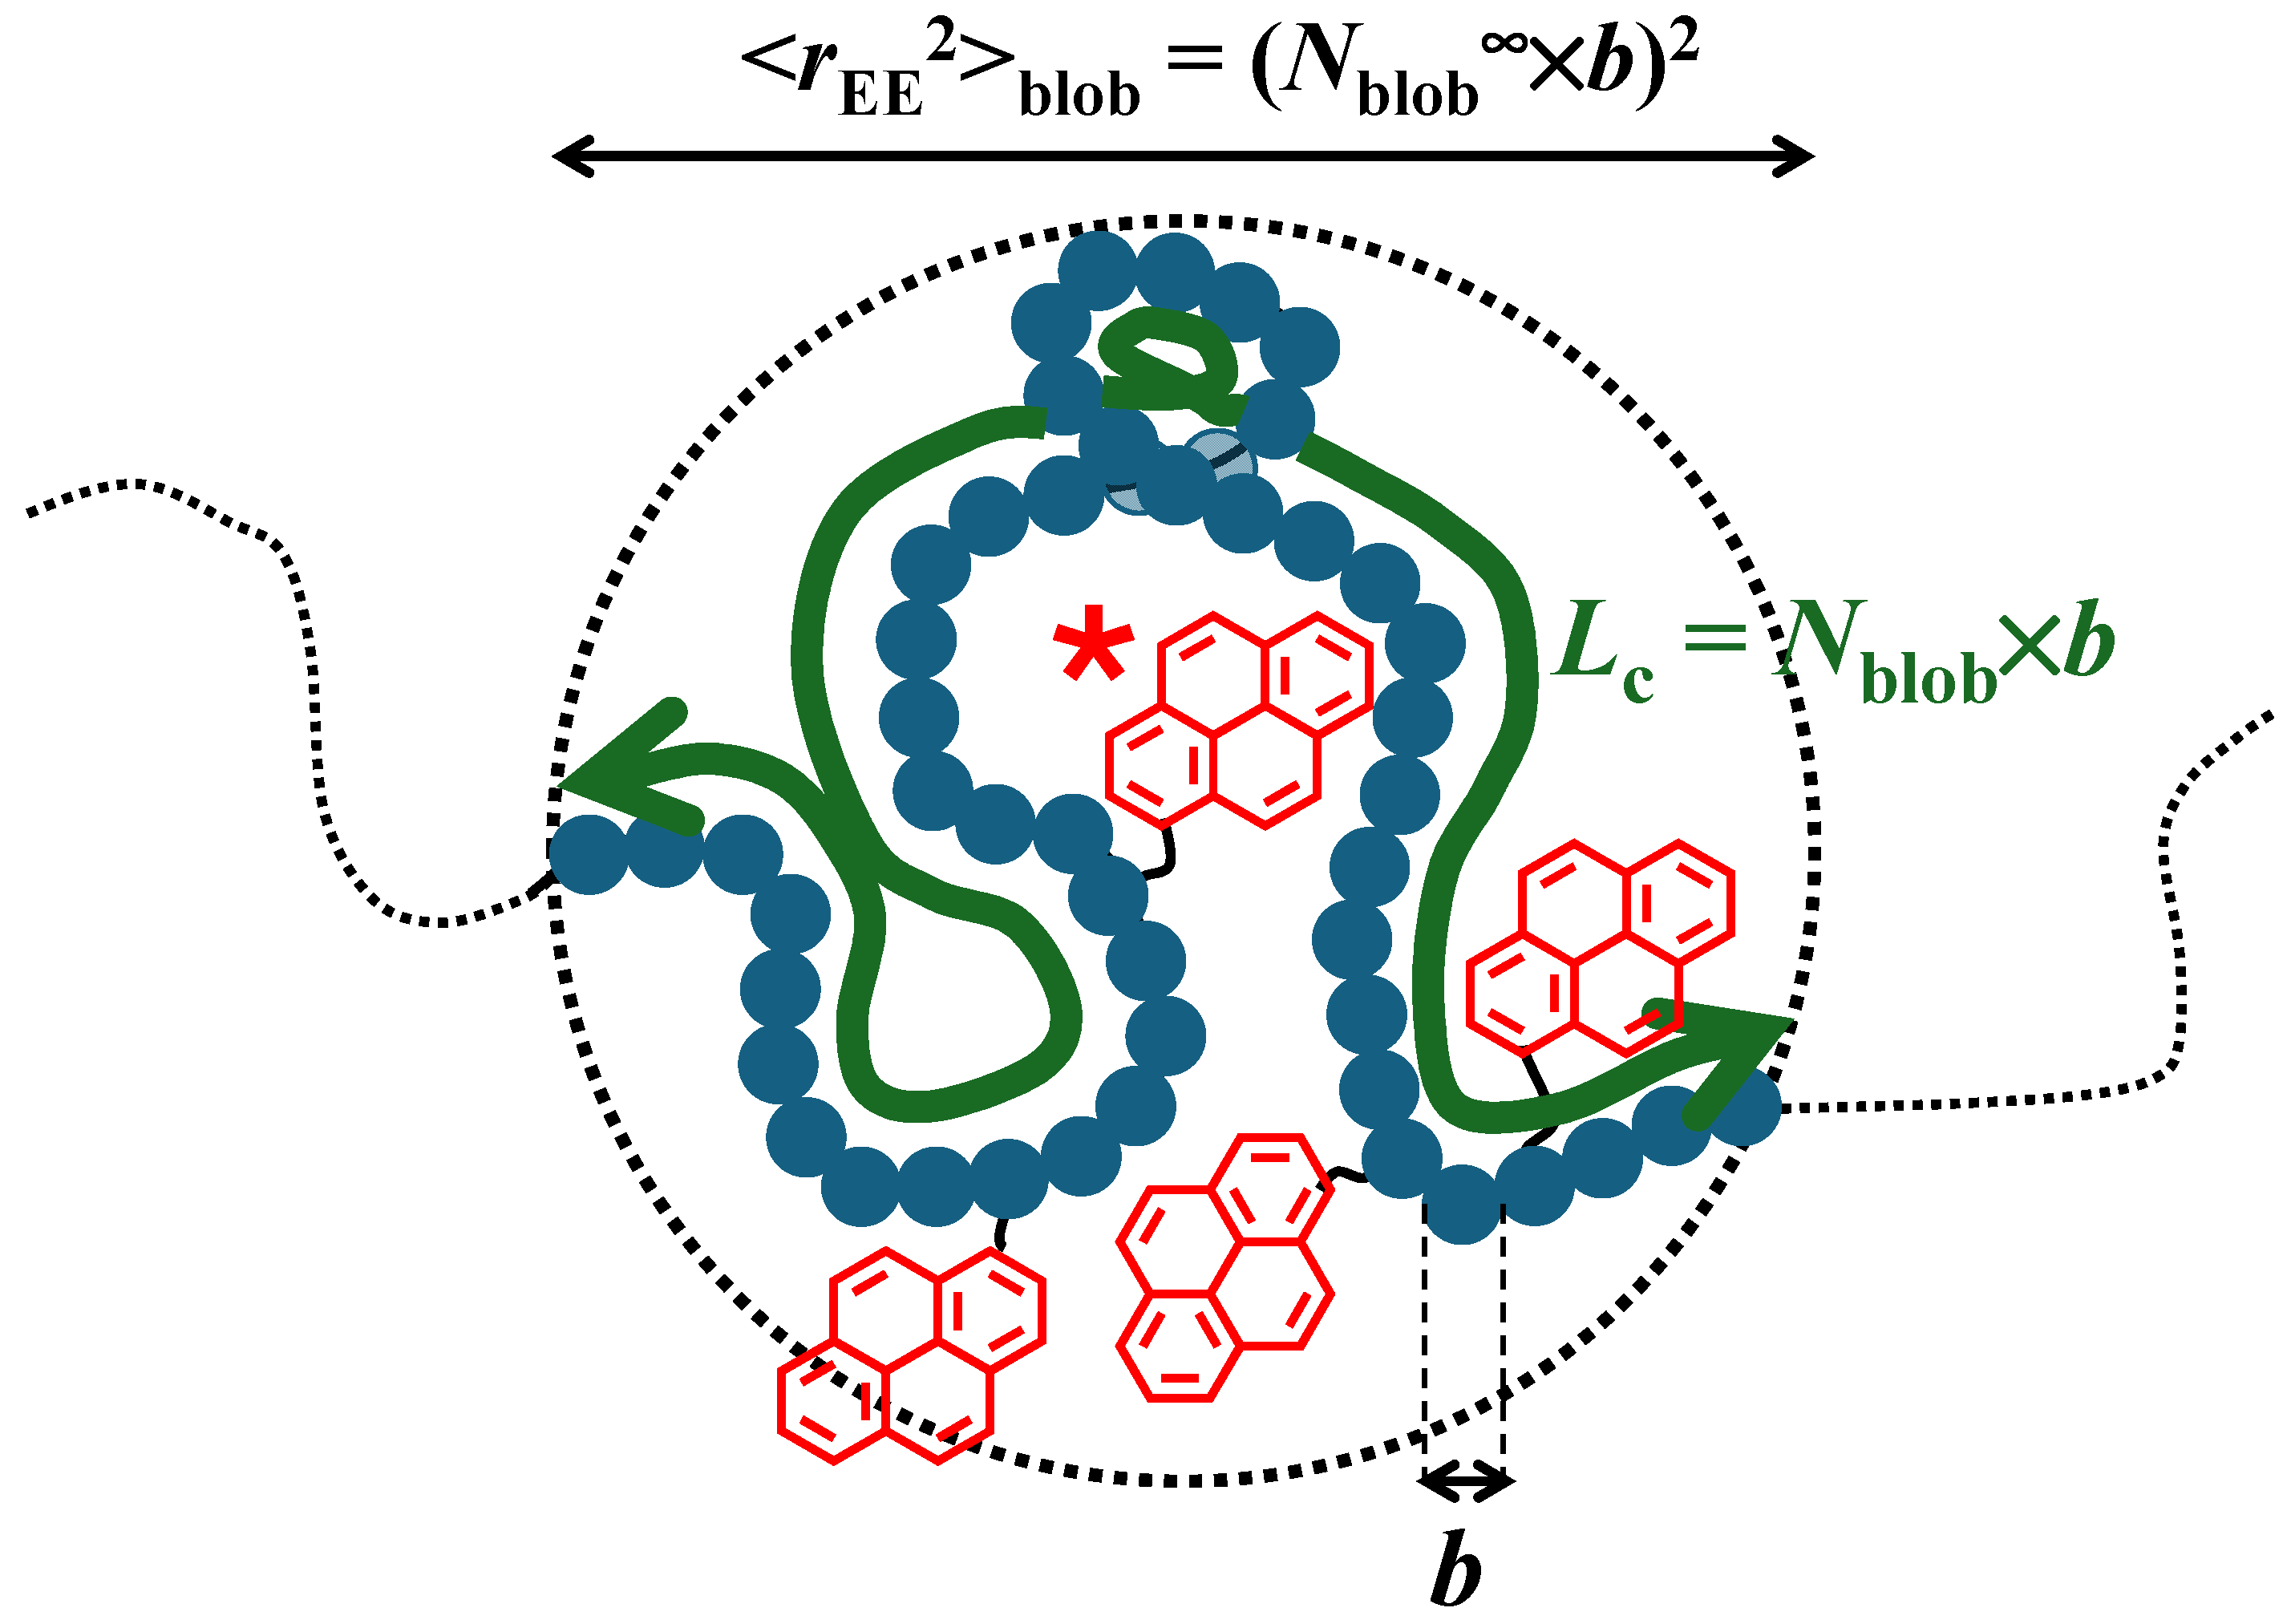
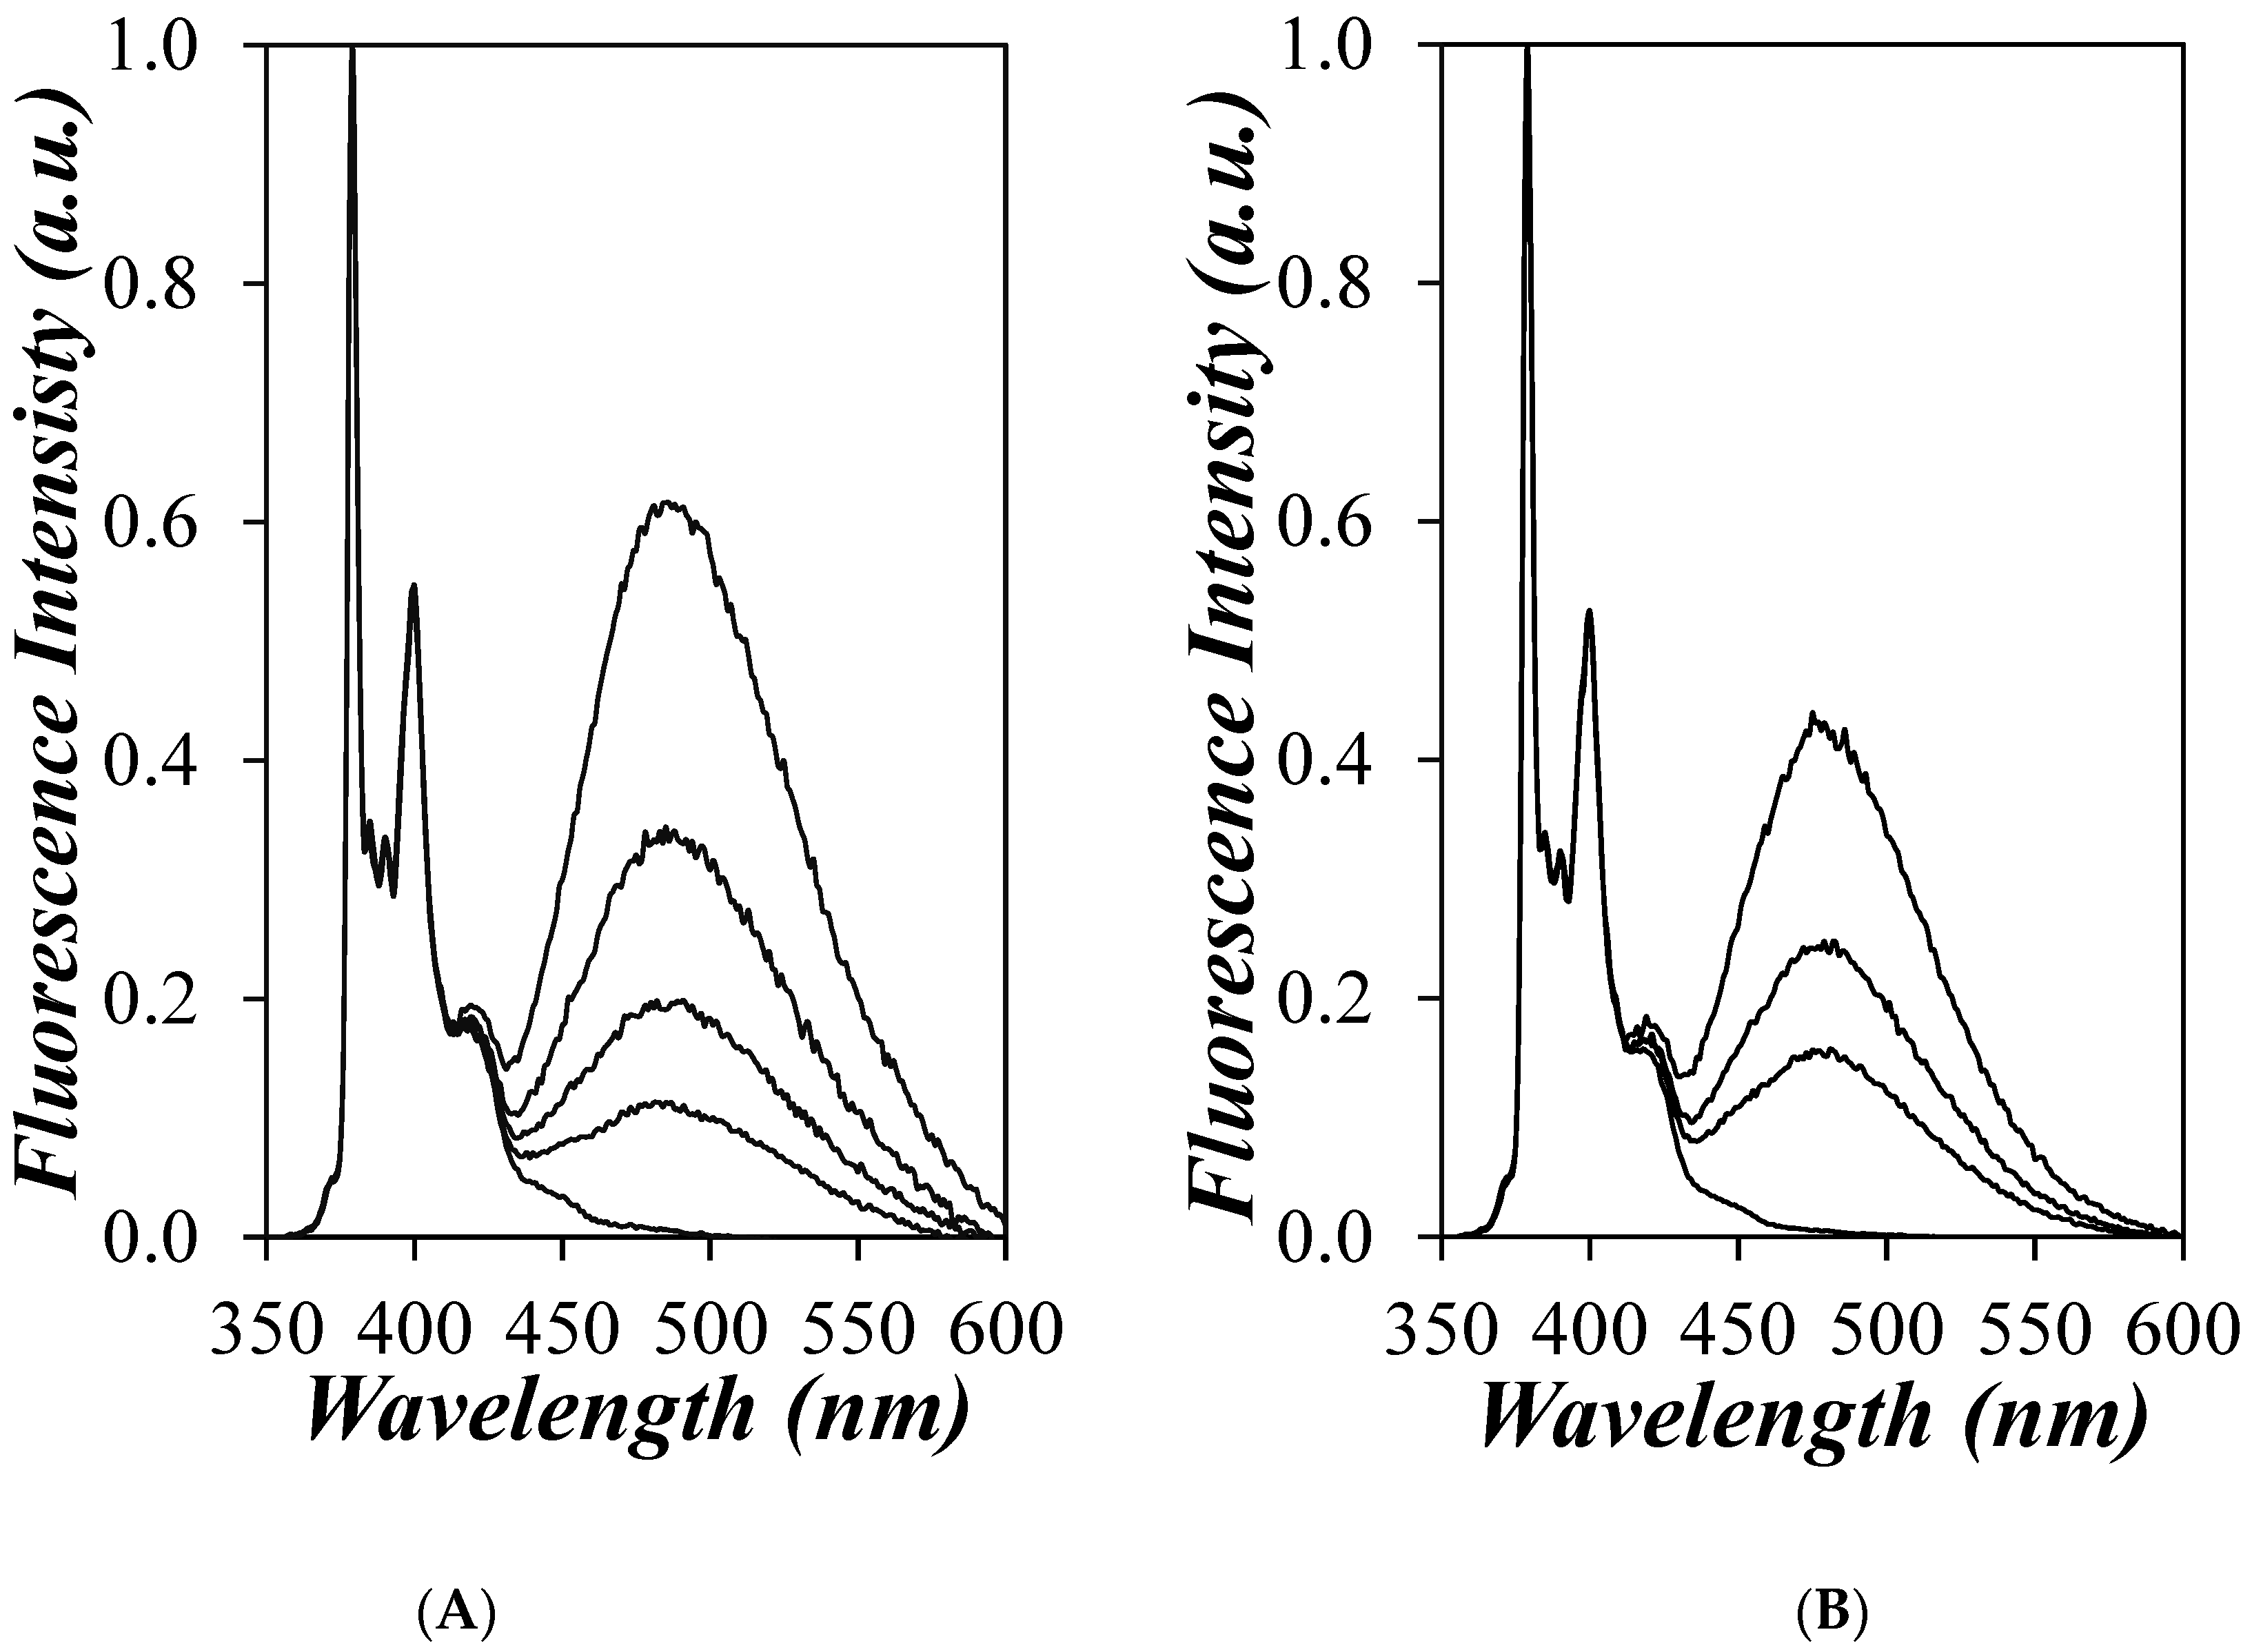
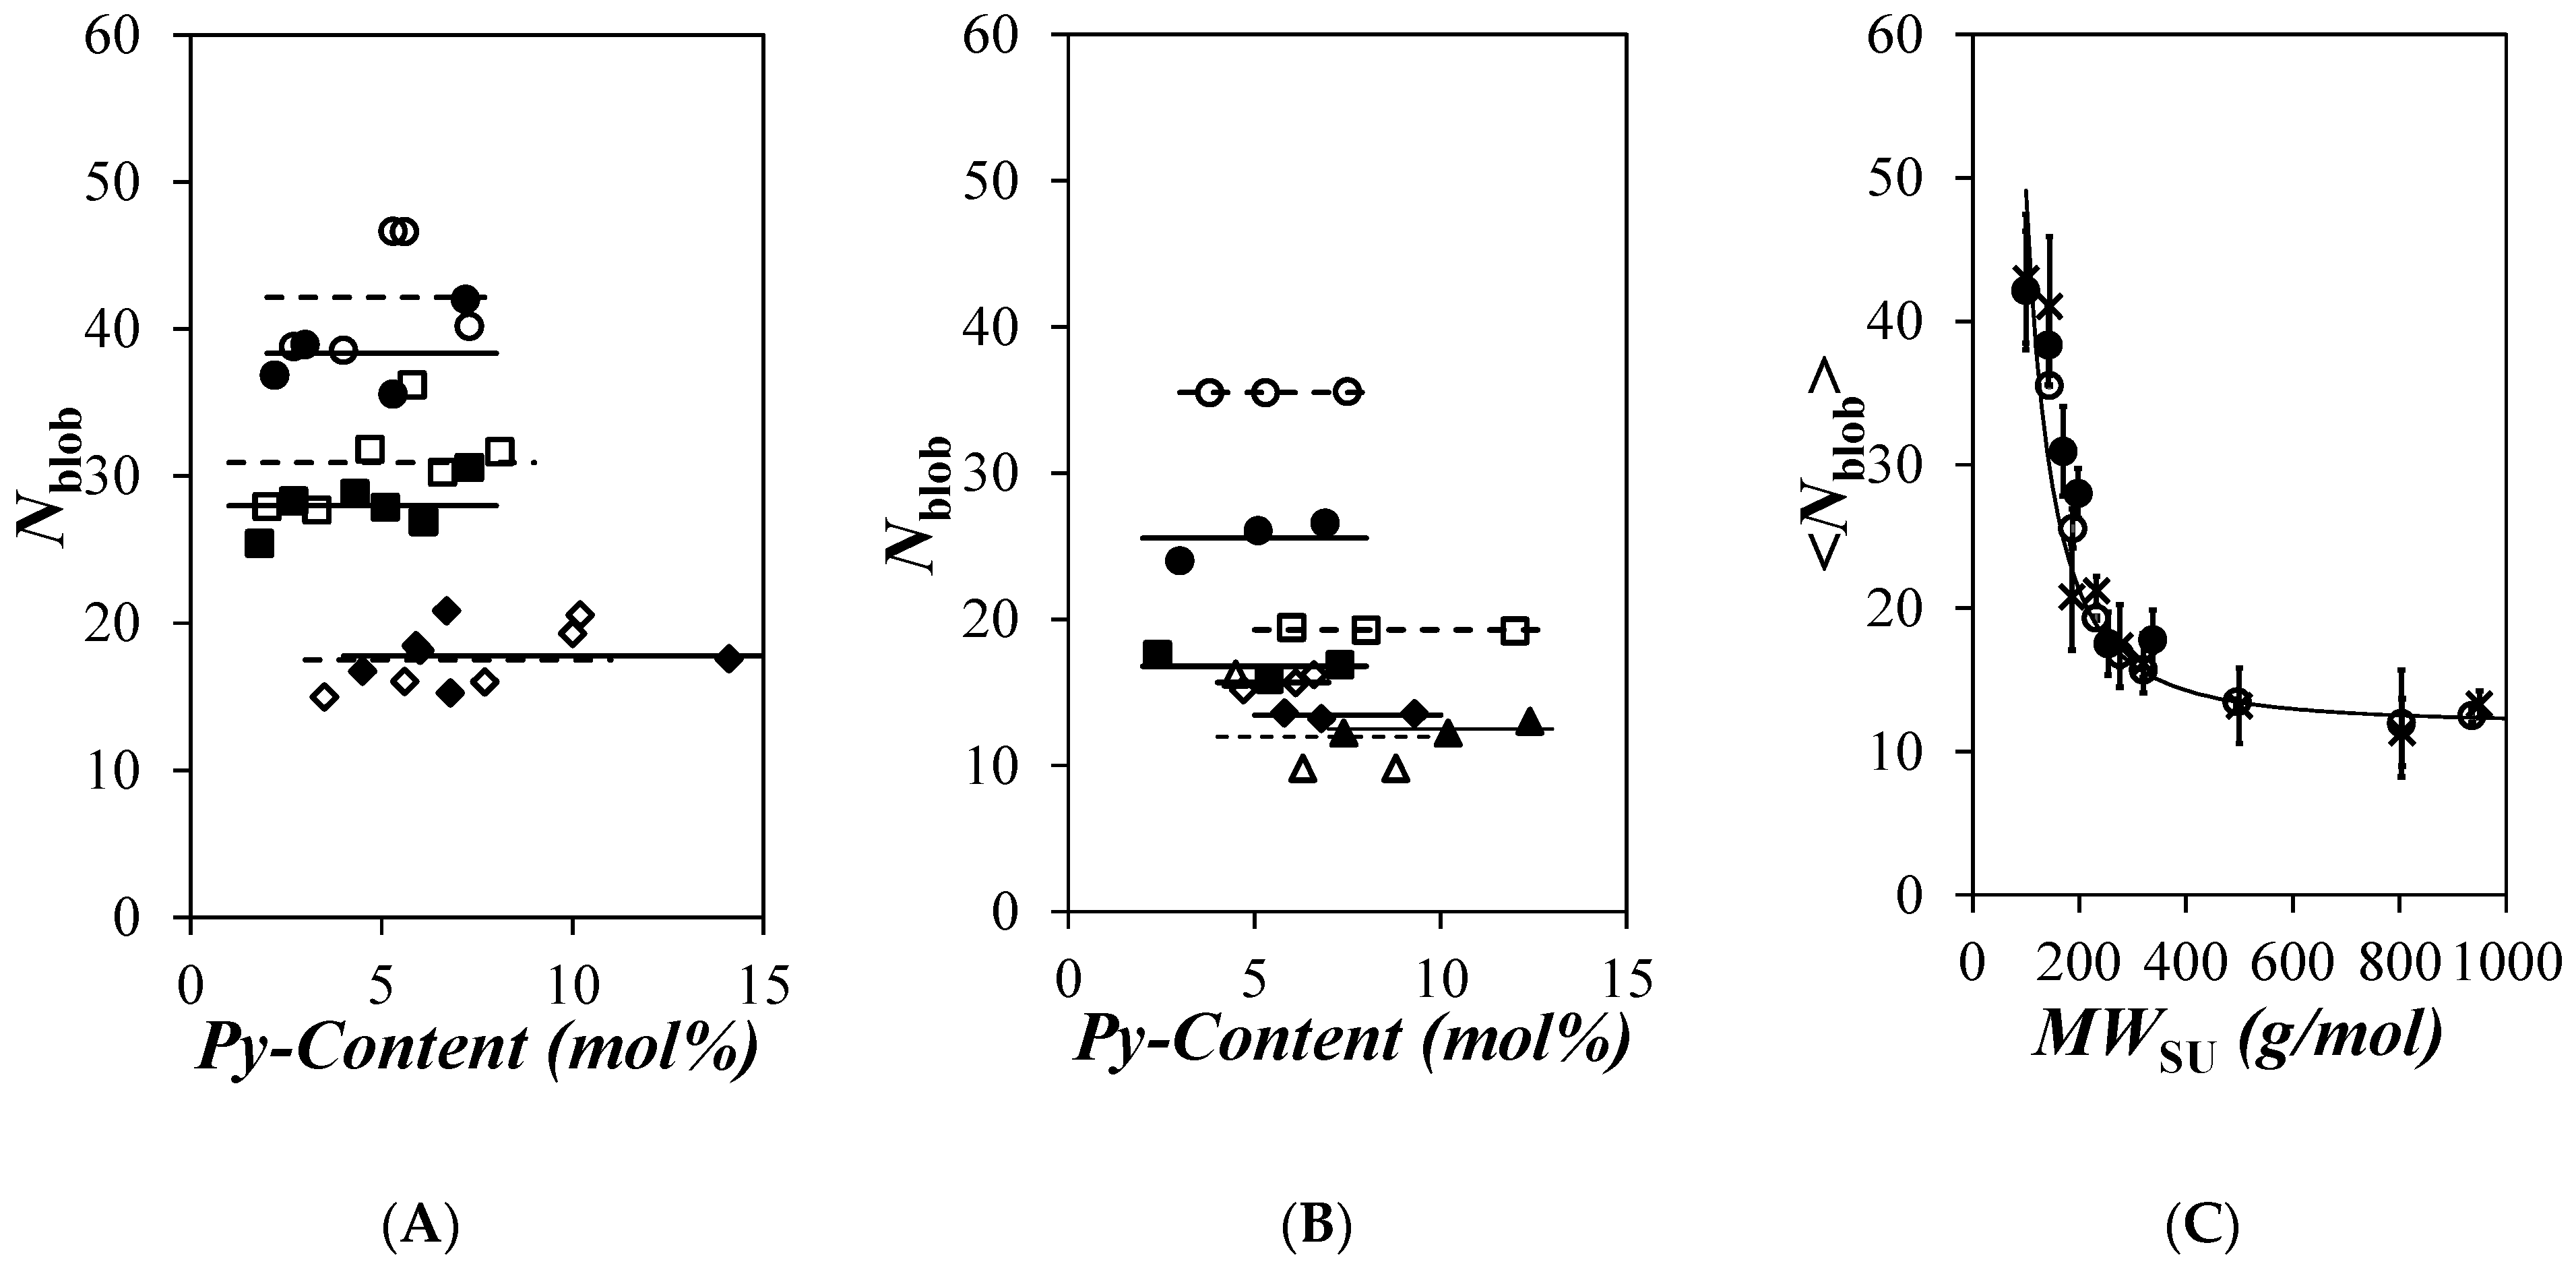
 ) 1, (
 ) 4, (
 ) 6, (
 ) 8, (
 ) 12, and (
 ) 18 and (B) the PyC4-PEGnMA samples for n = (×) 0, (
 ) 1, (
 ) 2, (
 ) 3, (
 ) 4, (
 ) 5, (
 ) 9, (
 ) 16, and (
 ) 19 in o-xylene and (C) EPEF as a function of the molecular weight of a structural unit (MWSU) for the (
 ) PyC4-PCnMA and (
 ) PyC4-PEGnMA samples.
 ) 1, (
 ) 4, (
 ) 6, (
 ) 8, (
 ) 12, and (
 ) 18 and (B) the PyC4-PEGnMA samples for n = (×) 0, (
 ) 1, (
 ) 2, (
 ) 3, (
 ) 4, (
 ) 5, (
 ) 9, (
 ) 16, and (
 ) 19 in o-xylene and (C) EPEF as a function of the molecular weight of a structural unit (MWSU) for the (
 ) PyC4-PCnMA and (
 ) PyC4-PEGnMA samples.
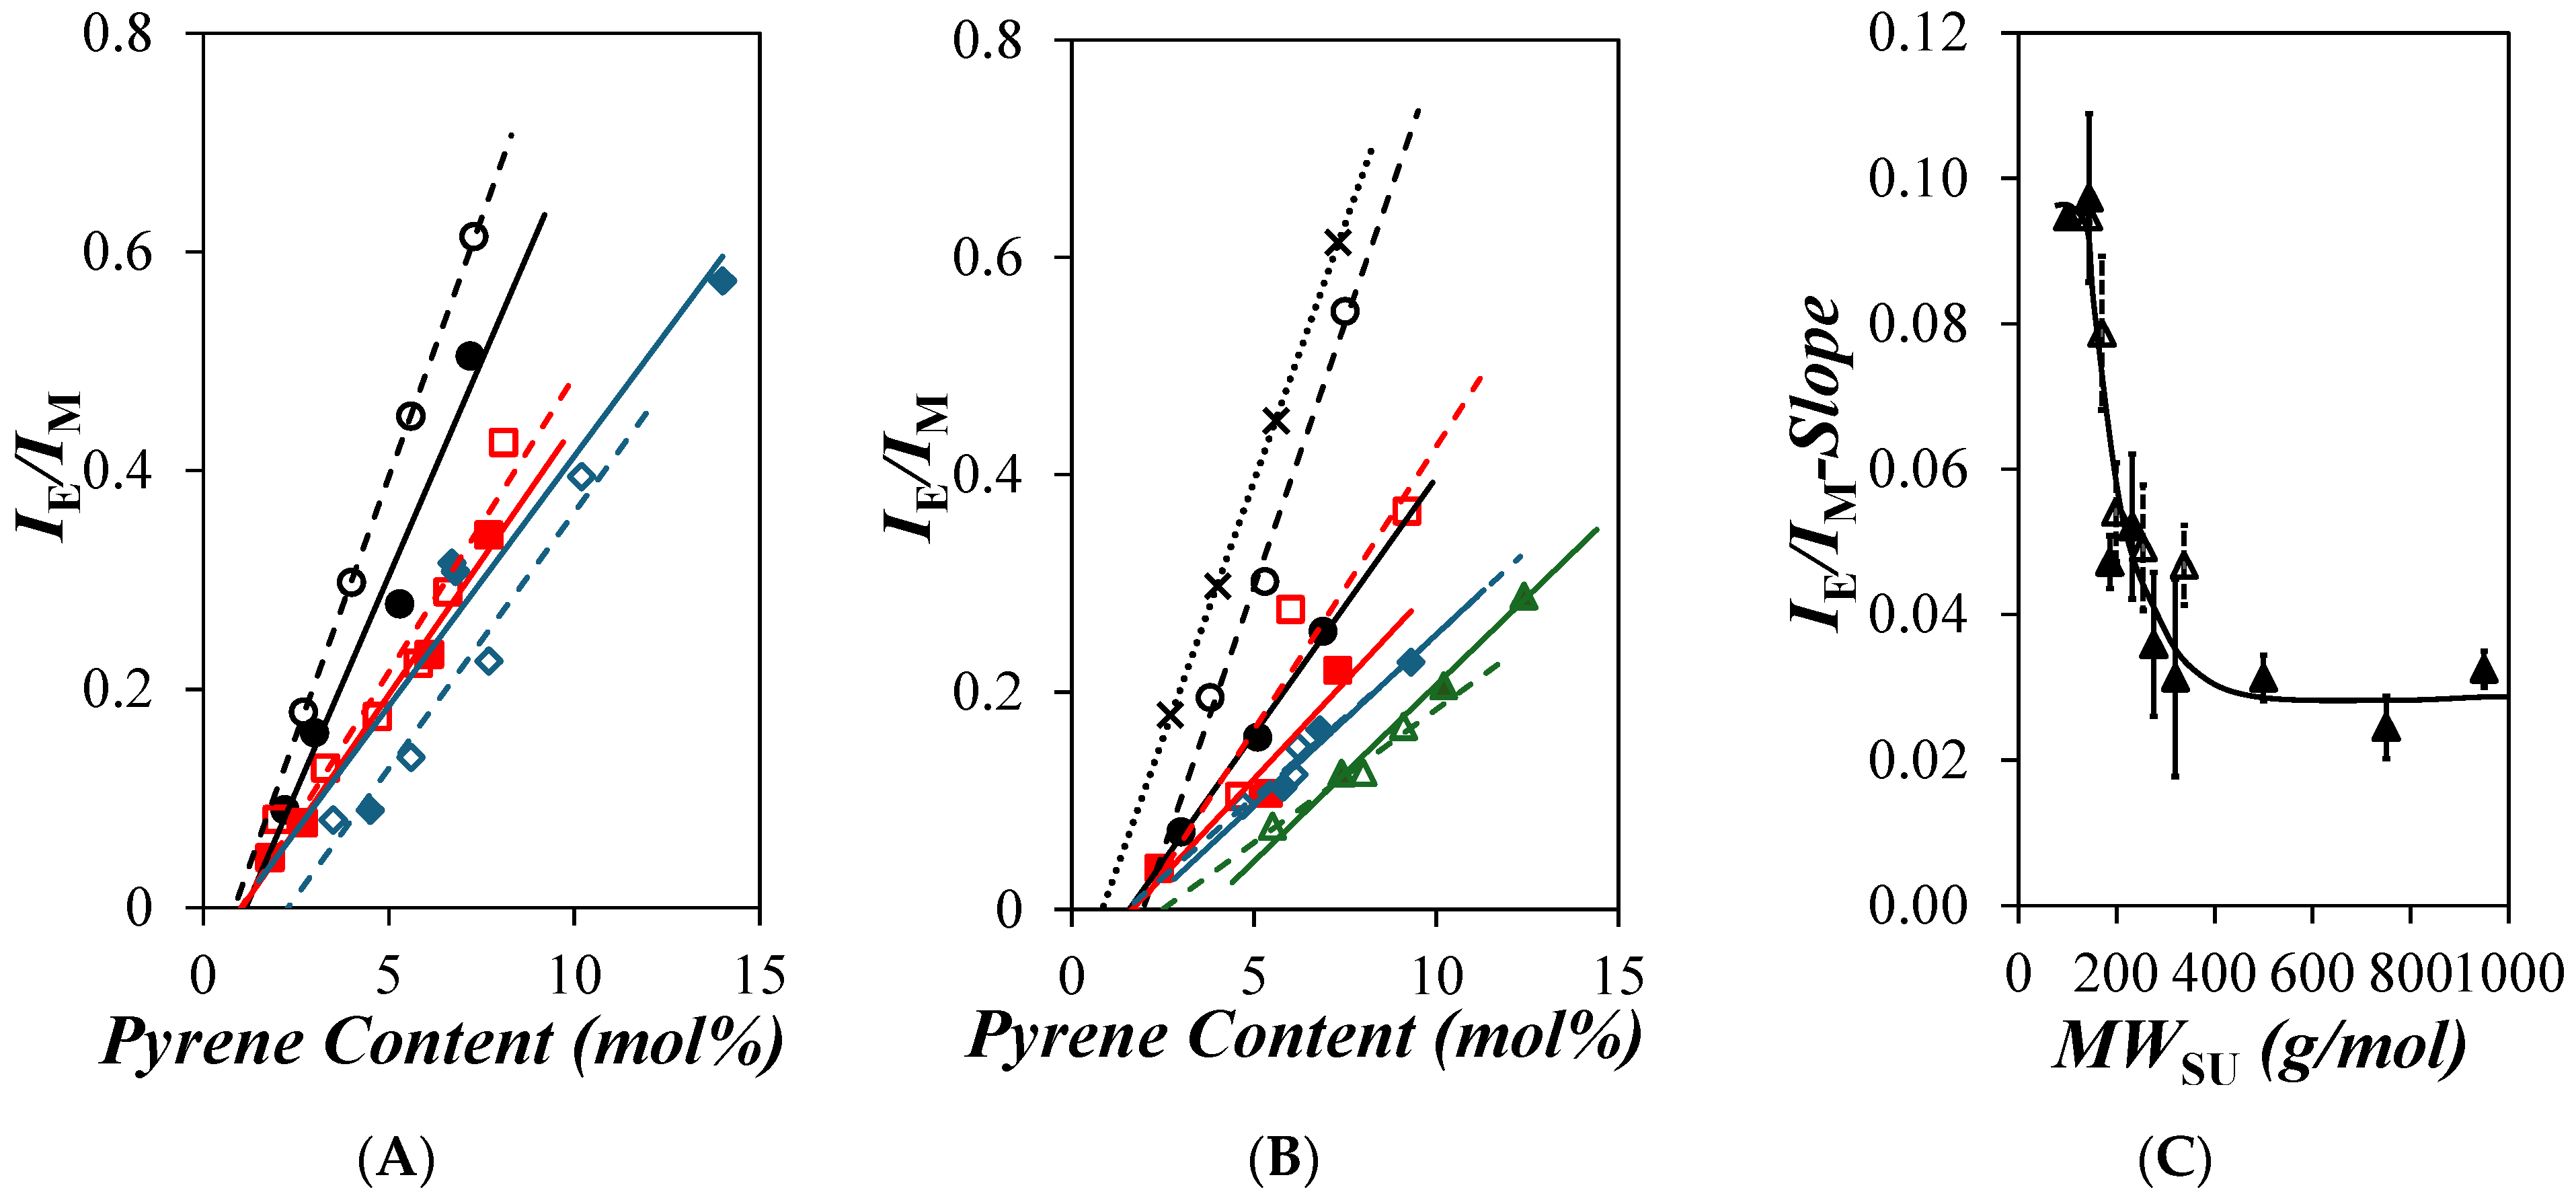
 ) 1, (
 ) 4, (
 ) 6, (
 ) 8, (
 ) 12, and (
 ) 18 and (B) PyC4-PEGnMA for n = (
 ) 1, (
 ) 2, (
 ) 3, (
 ) 4, (
 ) 5, (
 ) 9, (
 ) 16, and (
 ) 19 in o-xylene and (C) comparison of the averaged <Nblob> value of (
 ) PyC4-PCnMA in o-xylene and PyC4-PEGnMA in (
 ) o-xylene and (×) DMF as a function of the molecular weight of a structural unit (MWSU). The solid line represents the predicted Nblob-vs.-MWSU trend for a 0.76 mPa.s solvent viscosity [19].
 ) 1, (
 ) 4, (
 ) 6, (
 ) 8, (
 ) 12, and (
 ) 18 and (B) PyC4-PEGnMA for n = (
 ) 1, (
 ) 2, (
 ) 3, (
 ) 4, (
 ) 5, (
 ) 9, (
 ) 16, and (
 ) 19 in o-xylene and (C) comparison of the averaged <Nblob> value of (
 ) PyC4-PCnMA in o-xylene and PyC4-PEGnMA in (
 ) o-xylene and (×) DMF as a function of the molecular weight of a structural unit (MWSU). The solid line represents the predicted Nblob-vs.-MWSU trend for a 0.76 mPa.s solvent viscosity [19].
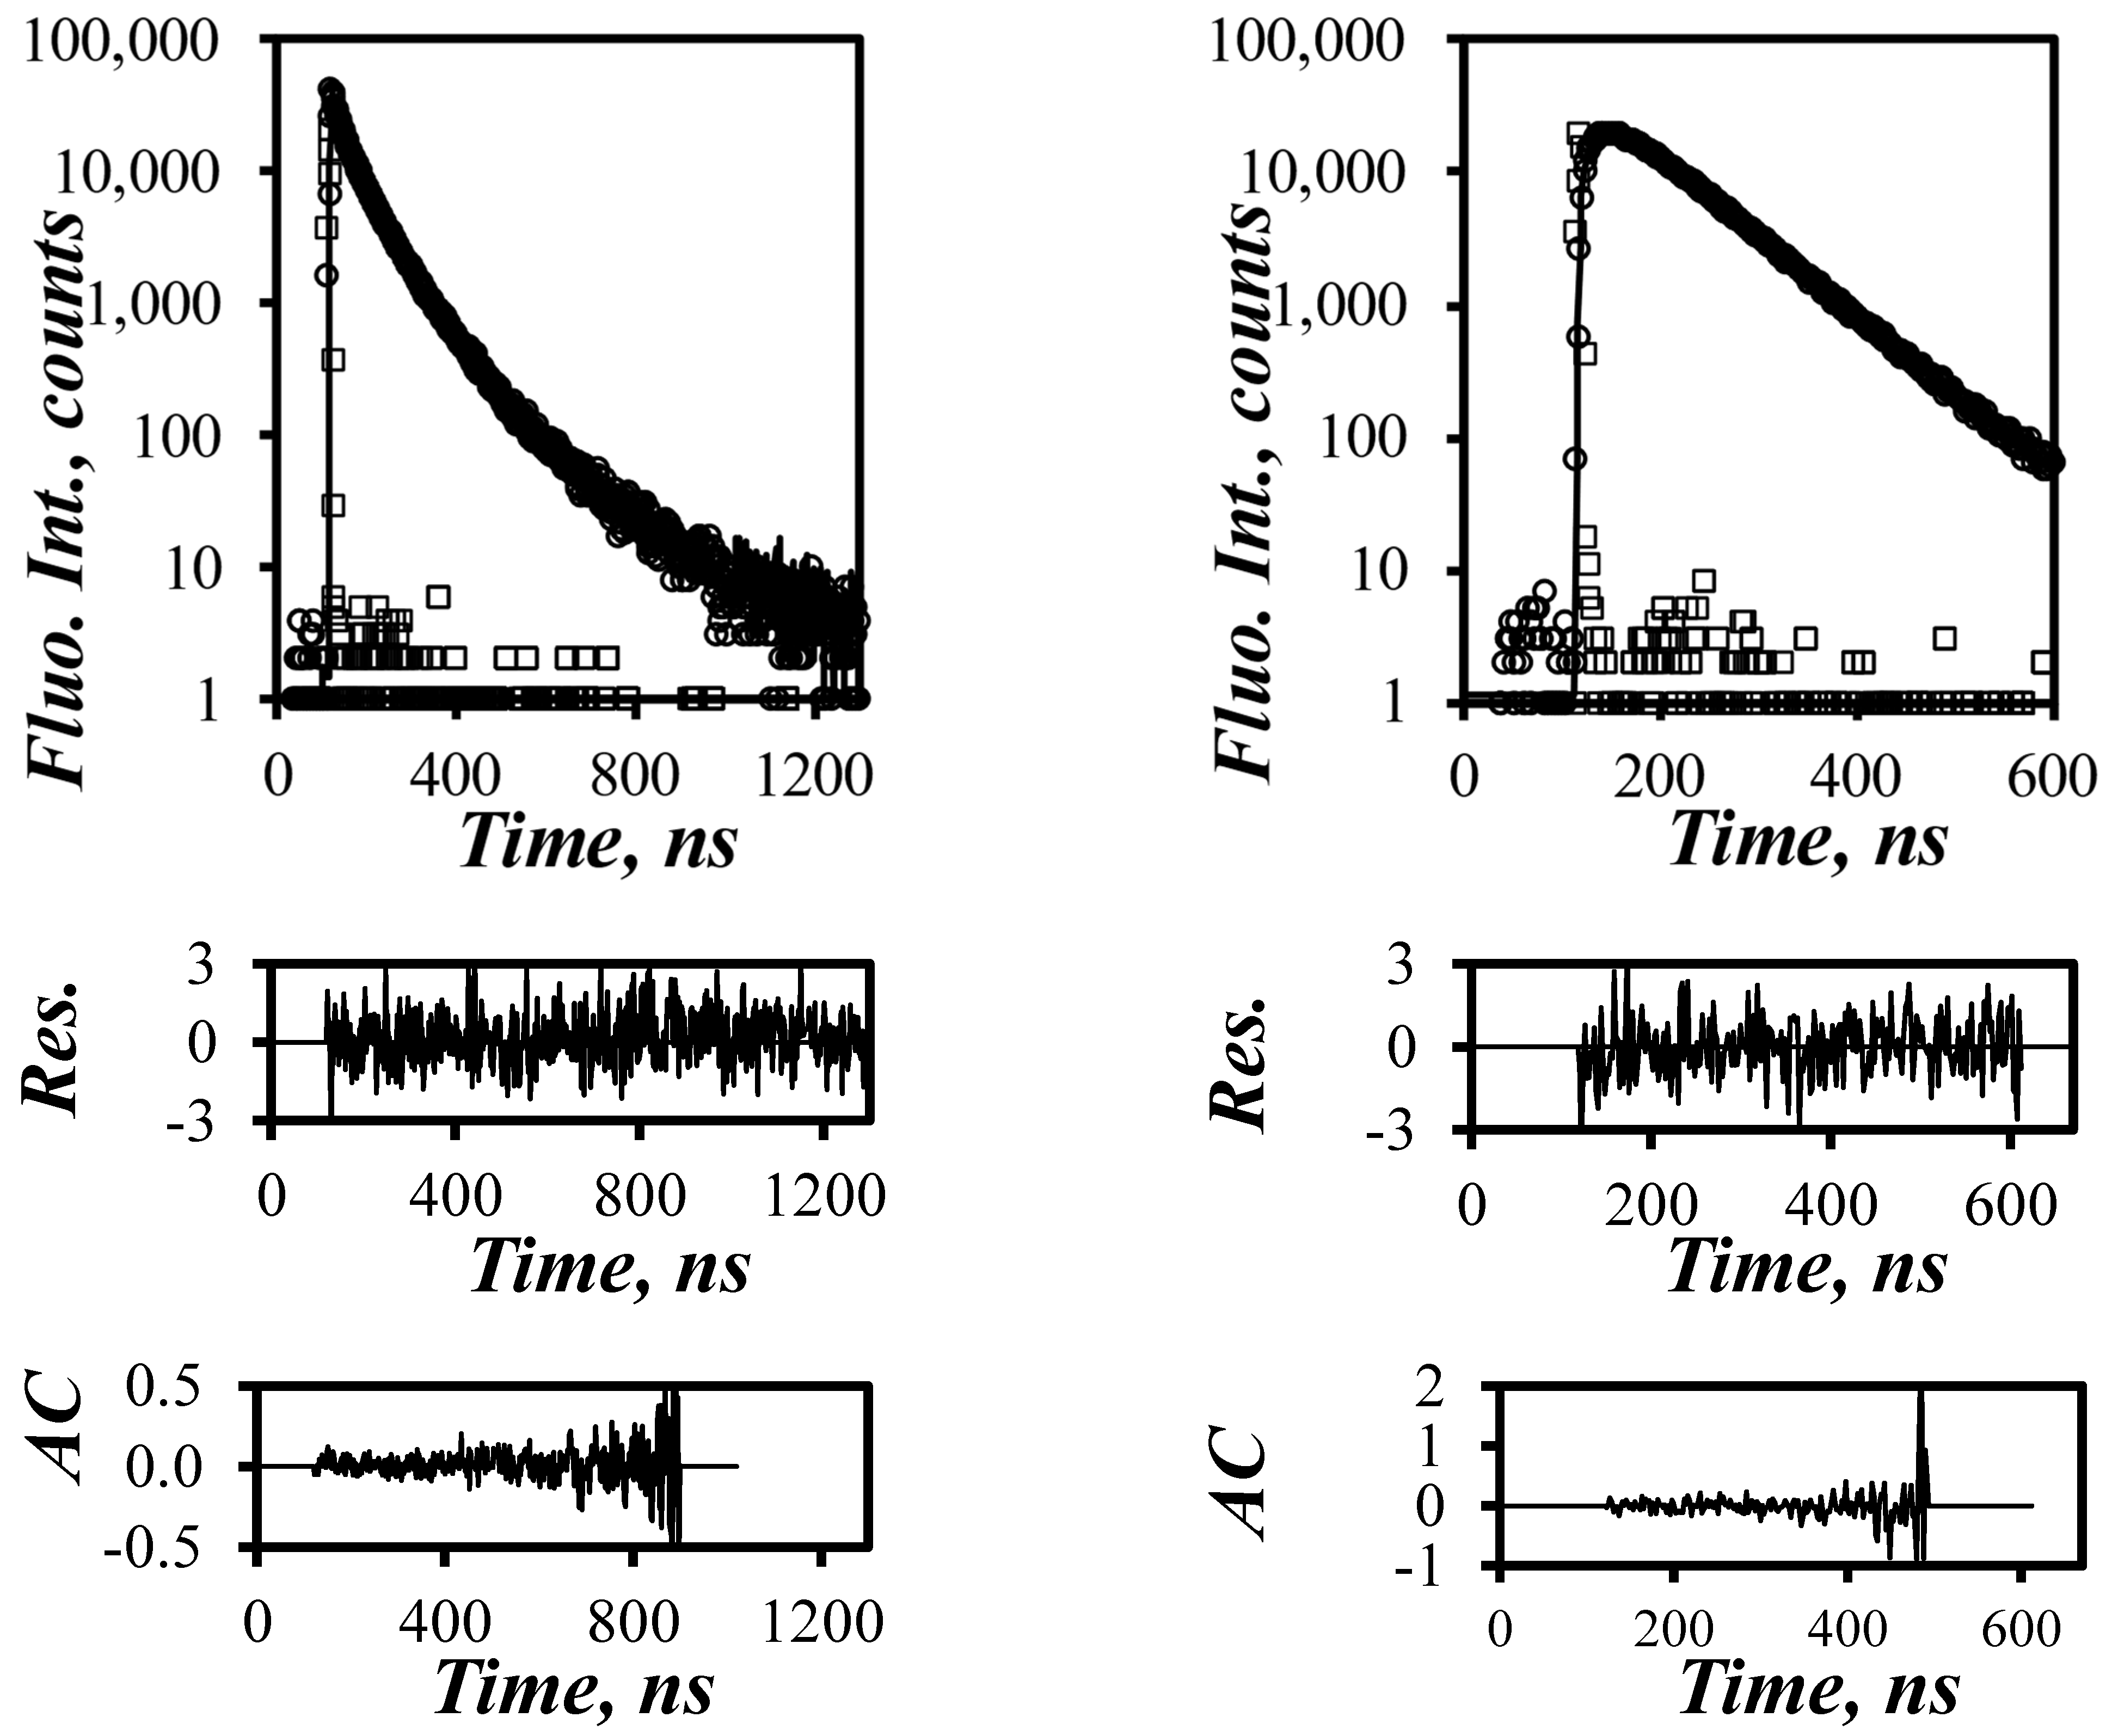
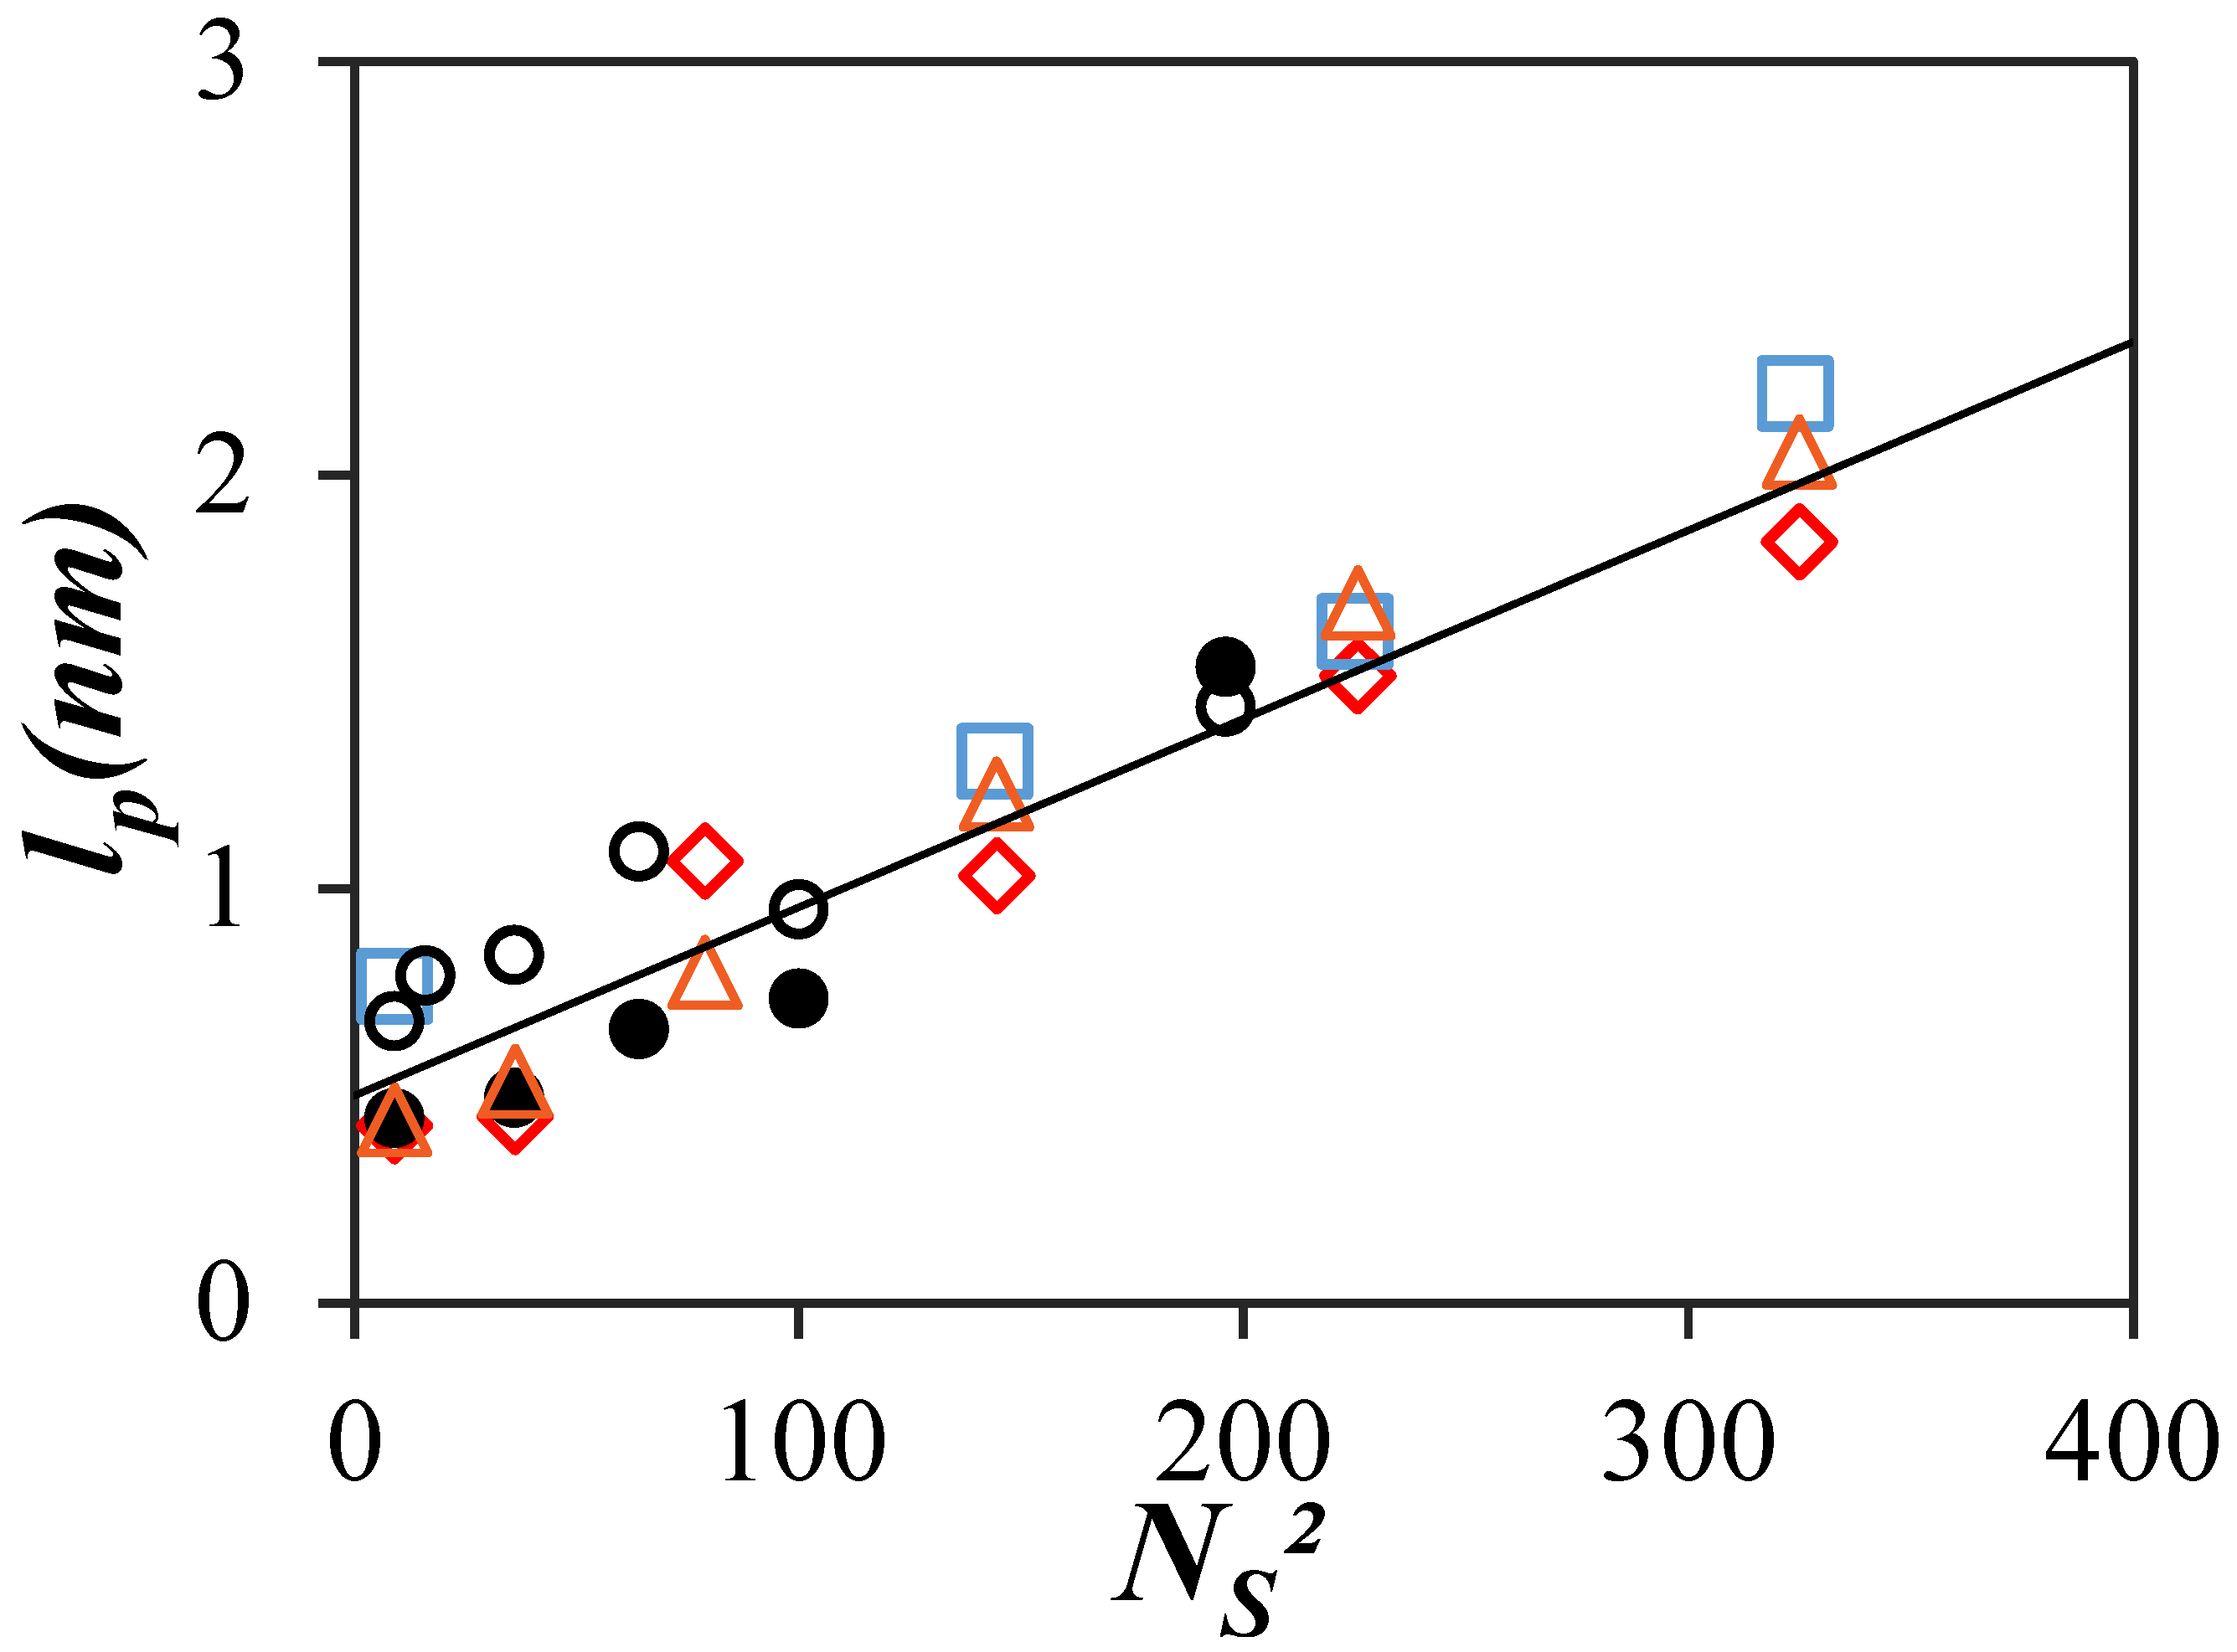
 ) viscometry for PCnMA [14] and PEF for (
 ) PyC4-PCnMA in o-xylene, (
 ) PyC4-PEGnMA in o-xylene, (
 ) PyC4-PEGnMA in DMF [19], and (
 ) PyEG5-PEGnMA in DMF [20]. The solid line represents the predicted trend for lp obtained with the PyC4-PEGnMA samples as a function of NS2 [19].
 ) viscometry for PCnMA [14] and PEF for (
 ) PyC4-PCnMA in o-xylene, (
 ) PyC4-PEGnMA in o-xylene, (
 ) PyC4-PEGnMA in DMF [19], and (
 ) PyEG5-PEGnMA in DMF [20]. The solid line represents the predicted trend for lp obtained with the PyC4-PEGnMA samples as a function of NS2 [19].
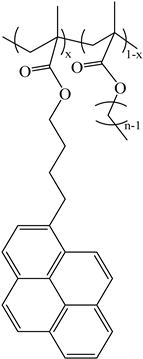
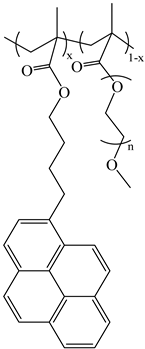
| PyC4-PCnMA | PyC4-PEGnMA | PyEG5-PEGnMA |
| n = 1, 4, 6, 8, 12, and 18 | n = 0–5, 9, 16, and 19 | n = 0, 3–5, 7, 9, and 19 |
 |  | 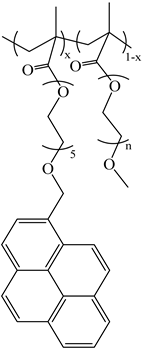 |
Disclaimer/Publisher’s Note: The statements, opinions and data contained in all publications are solely those of the individual author(s) and contributor(s) and not of MDPI and/or the editor(s). MDPI and/or the editor(s) disclaim responsibility for any injury to people or property resulting from any ideas, methods, instructions or products referred to in the content. |
© 2024 by the authors. Licensee MDPI, Basel, Switzerland. This article is an open access article distributed under the terms and conditions of the Creative Commons Attribution (CC BY) license (https://creativecommons.org/licenses/by/4.0/).
Share and Cite
Lulic, K.; Muller, G.; Gutierrez, R.; Little, H.; Duhamel, J. Flexibility of Poly(alkyl methacrylate)s Characterized by Their Persistence Length Determined through Pyrene Excimer Formation. Polymers 2024, 16, 2126. https://doi.org/10.3390/polym16152126
Lulic K, Muller G, Gutierrez R, Little H, Duhamel J. Flexibility of Poly(alkyl methacrylate)s Characterized by Their Persistence Length Determined through Pyrene Excimer Formation. Polymers. 2024; 16(15):2126. https://doi.org/10.3390/polym16152126
Chicago/Turabian StyleLulic, Kristijan, Grégoire Muller, Renzo Gutierrez, Hunter Little, and Jean Duhamel. 2024. "Flexibility of Poly(alkyl methacrylate)s Characterized by Their Persistence Length Determined through Pyrene Excimer Formation" Polymers 16, no. 15: 2126. https://doi.org/10.3390/polym16152126
APA StyleLulic, K., Muller, G., Gutierrez, R., Little, H., & Duhamel, J. (2024). Flexibility of Poly(alkyl methacrylate)s Characterized by Their Persistence Length Determined through Pyrene Excimer Formation. Polymers, 16(15), 2126. https://doi.org/10.3390/polym16152126


