Spectroscopic Benchmarks by Machine Learning as Discriminant Analysis for Unconventional Italian Pictorialism Photography
Abstract
1. Introduction
2. Materials and Methods
2.1. Description of the Piero Vanni Collection
2.2. Measurements Strategy
2.3. Spectroscopic Techniques
- (a)
- Energy dispersive X-ray fluorescence (ED-XRF). ED-XRF spectroscopy was performed by the XRAMAN spectrometer (XGLab S.R.L., Bruker Nano Analytics, Milano, Italy) [16]. It is characterized by a rhodium target X-ray tube operating at 50 kV and 200 mA, and the time of each acquisition it is fixed at 70 s. The detector is a large-area silicon drift X-ray detector with an active area of 25 mm2 and energy resolution of <135 eV measured on the MnKα line (5.890 eV) that allows element detection with atomic number Z > 11, with an input photon rate of up to 100.000 counts per second.
- (b)
- Fourier-transform infrared spectroscopy (FTIR). FTIR spectra were collected by a NICOLET iS5 spectrometer (Thermo Scientific, Waltham, MA, USA) equipped with a DTGS detector and KBr beam splitter. Spectra were sequentially recorded in the range of 4000–400 cm−1 with 128 scans and a resolution of 2 cm−1, yielding a total of 88 FTIR spectra (reflectance Mode–R%) and 4096 variables. Measurements were conducted with a Nicolet™ FTIR Thermo Scientific™ device equipped with a ConservatIR™ FTIR External Reflection Accessory for non-invasive and nondestructive analysis of large objects with a spot size of ~1.25 mm in diameter.
2.4. Optical Investigations
2.5. Machine Learning Analysis
2.6. Algorithms Computed
3. Discussion and Results
3.1. Gum Bichromate


| n. | Wavenumber [cm−1] | Functional Group | Note |
|---|---|---|---|
| 1 | 1650, 1633 | νC–NH2, δN–H | Gelatin [19] |
| 2 | 1537, 1550 | νC–NH–C, δN–H | Gelatin [19] |
| 3 | 990, 979 * | K2Cr2O7 | Sensitizer [10] |
| 4 | 223, 291, 409, 611 | Fe2O3 1 | Pigment [10] |
| 5 | 667, 668 | SO42− | Support [20] |
| 6 | 1062, 1030 | C–O, C–C | Cellulose chain [21] |
3.2. Silver Particles Suspended in Gelatin
3.3. Carbon Print
3.4. Bromoil Printing
3.5. Machine Learning
- (a)
- PCA_Score_FTIR. In Figure 11, the score plot of the FTIR dataset (88 × 14,935 size) is displayed. This plot helps to assess the correlation between measurement points and interpret certain sample groupings, similarities, or differences in molecular spectroscopic data.
- (b)
- PCA_Loading_FTIR. Figure 12 displays the loading plot of the FTIR dataset, which is 88 × 14,935 in size. The loading plot assesses the correlation of variables (spectroscopic benchmarks vibrations in specific spectral ranges) to interpret energy grouping, similarities, or differences in molecular spectroscopic data. Figure 12 shows the spectroscopic molecular benchmarks and the respective contributions of the individual PCs. The loading analysis in Figure 12 shows the correlation of the PCs and the characteristic spectroscopic regions or bands of the entire dataset. It also indicates the contribution of the cumulative information of the three components or those vibrational bands described by only one or more components. This allows for the identification of spectral regions and the contribution of all three components, such as the stretching vibration of the hydroxyl group (O–H) due to the water content or the typical bands of the proteinaceous binder or gum. Additionally, it is possible to extract esters (spectroscopic benchmarks at 1742 cm−1 [27]) highlighted, in part, by PC3, which accounts for 3% of the dataset.
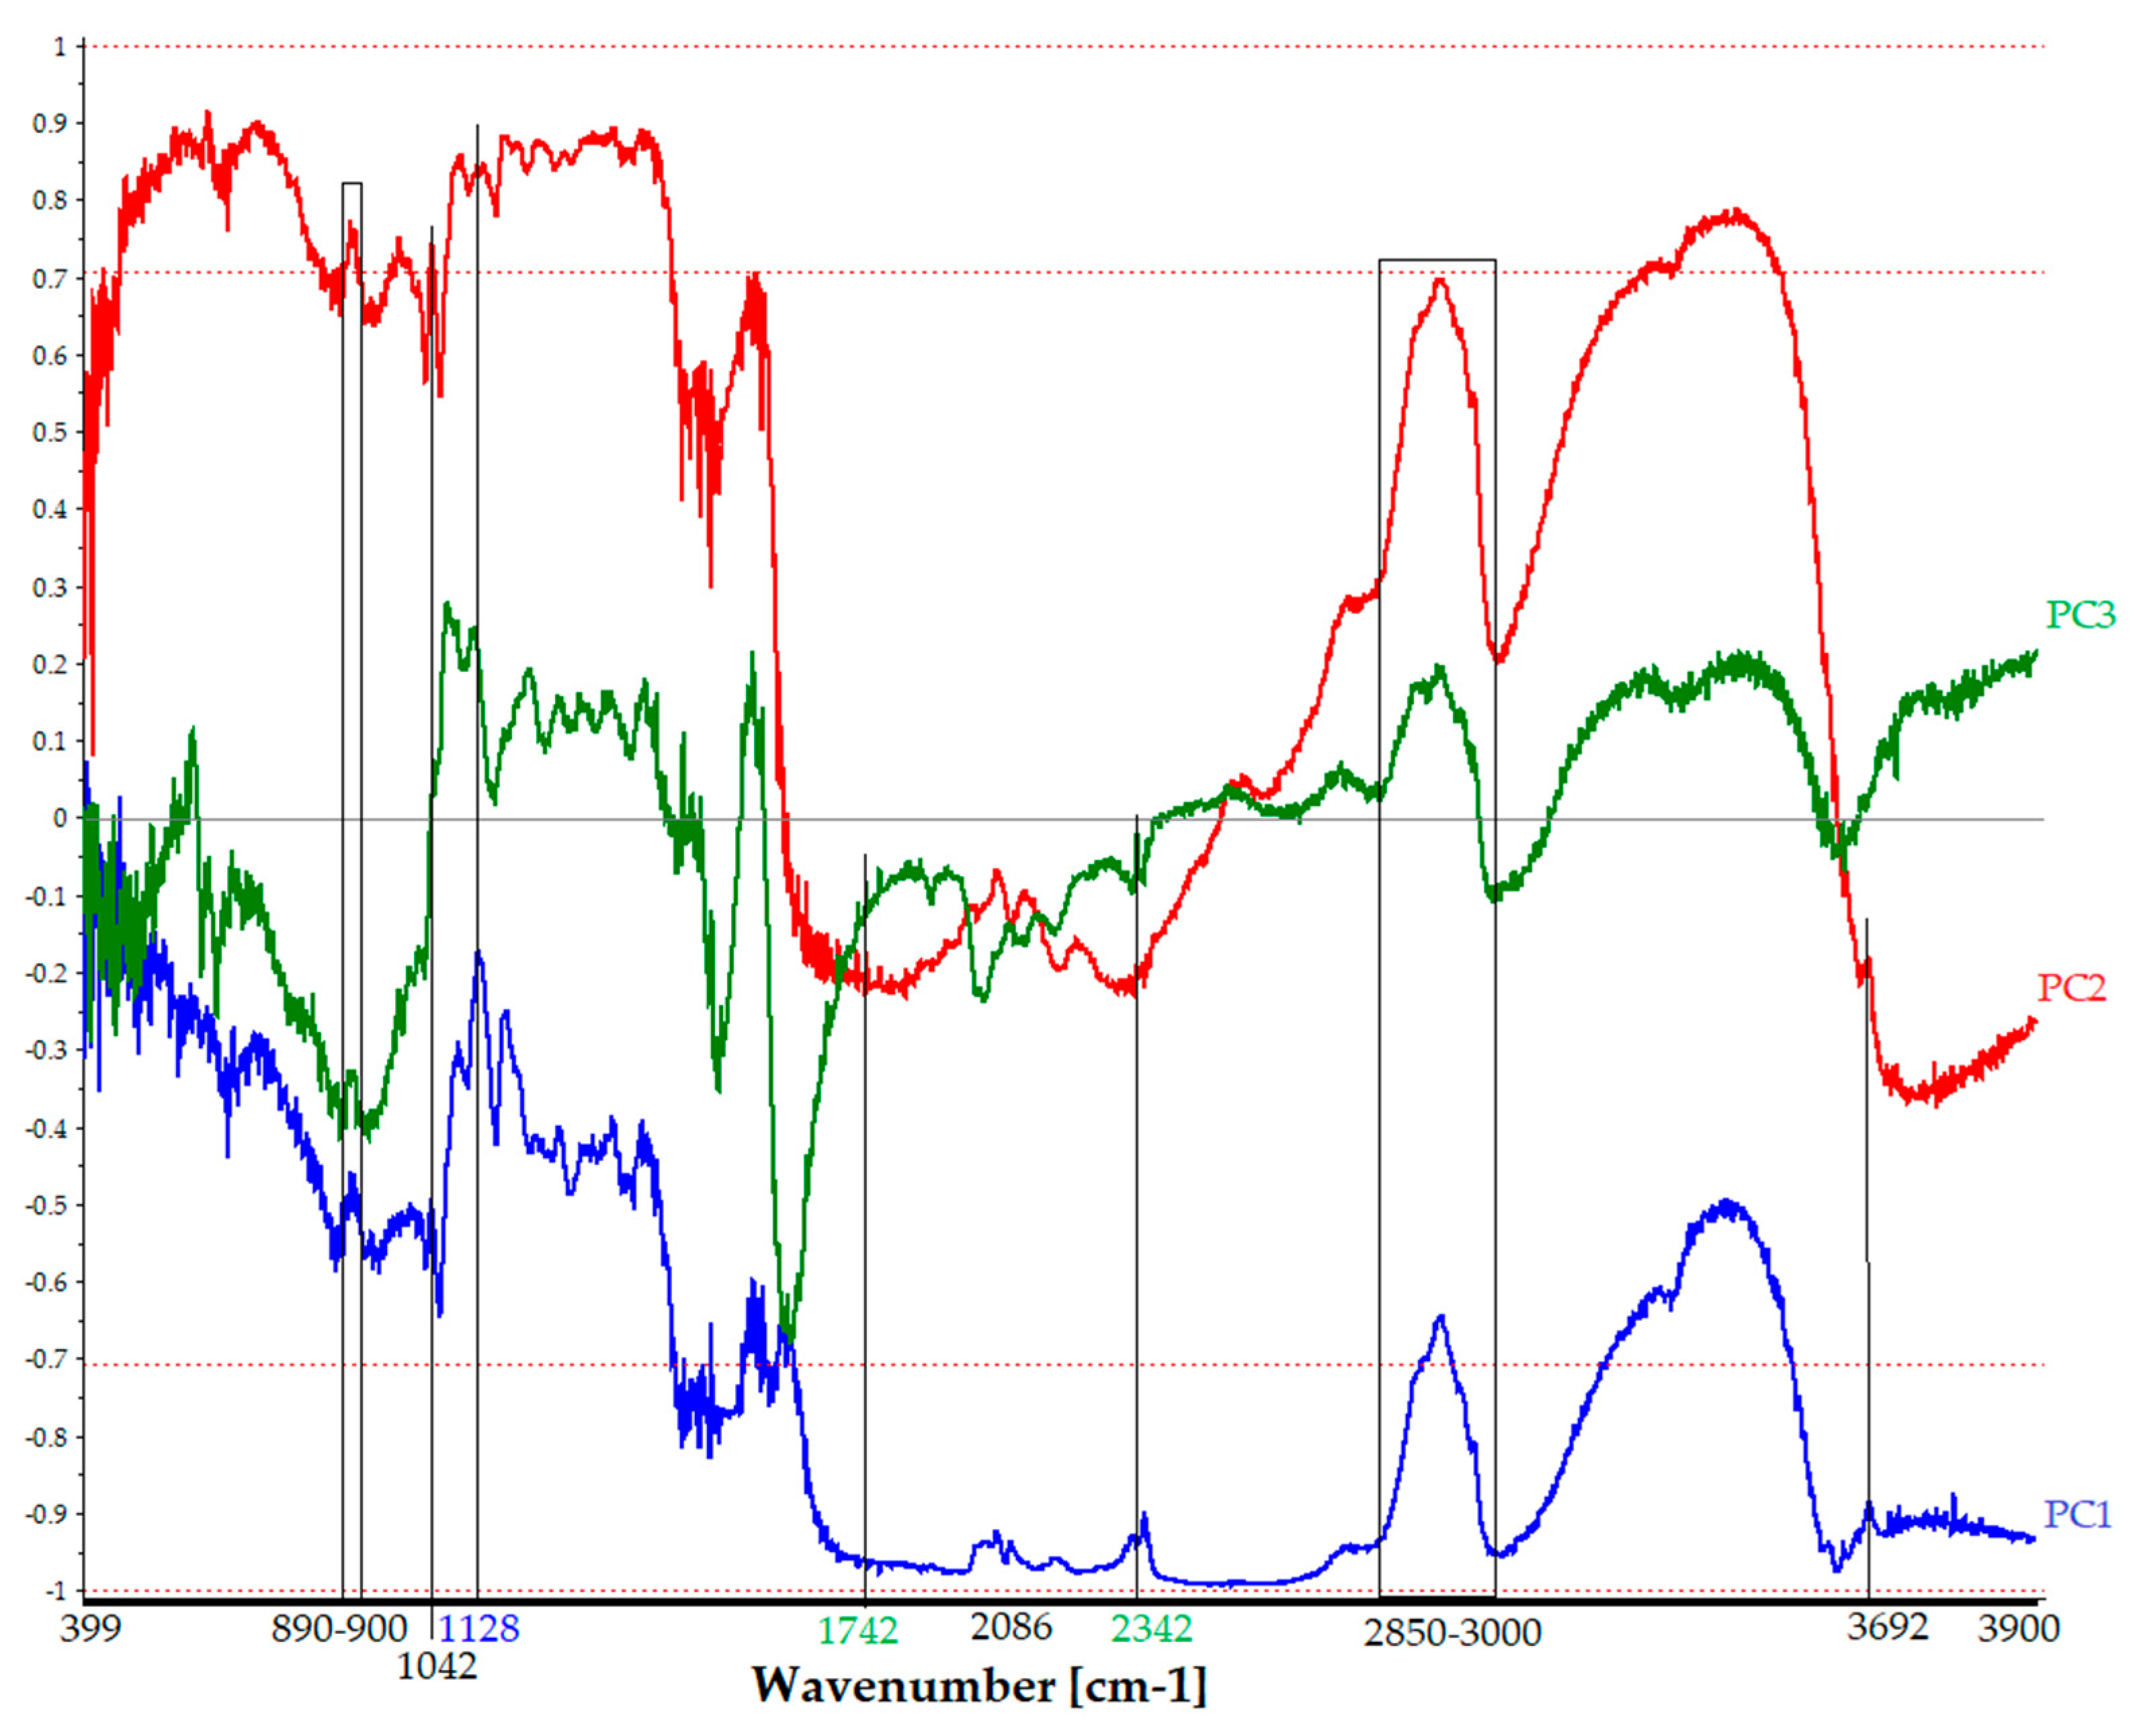
| Wavenumber [cm−1] | Functional Group | Note |
|---|---|---|
| 3400–36,000 | νO–H | Water content [23,29]–PC1, PC2, PC3 |
| 3692 | νOH | Silicates [8]–PC1, PC2 |
| 2790 | νCH3 | Solvent [24]–PC3 |
| 2342 | Me–O | Silica [30]–PC3 |
| 2357 | νSi–O | Silicates [8]–PC1 |
| 2076 | νMe–CO | Ag, Cu [31]–PC1, PC2, PC3 |
| 1650, 1633 | νC–NH2, δN–H | Gelatin [19] |
| 2850–3000, 1738–1757 | νCH2 | Gelatin [19] |
| 1537, 1550 | νC–NH–C, δN–H | Gelatin [19] |
| 1437 | νC–N–C | Gelatin [19] |
| 890–900 | β-glycosidic linkage | Cellulose/gum/starch 1 [32]–PC1, PC2, PC3 |
| 1042 | ν–O, νC–C | Xylose [33]–PC1, PC2 |
| 1128 | νC–Br | Methylene bromide [26]–PC1 |
- (c)
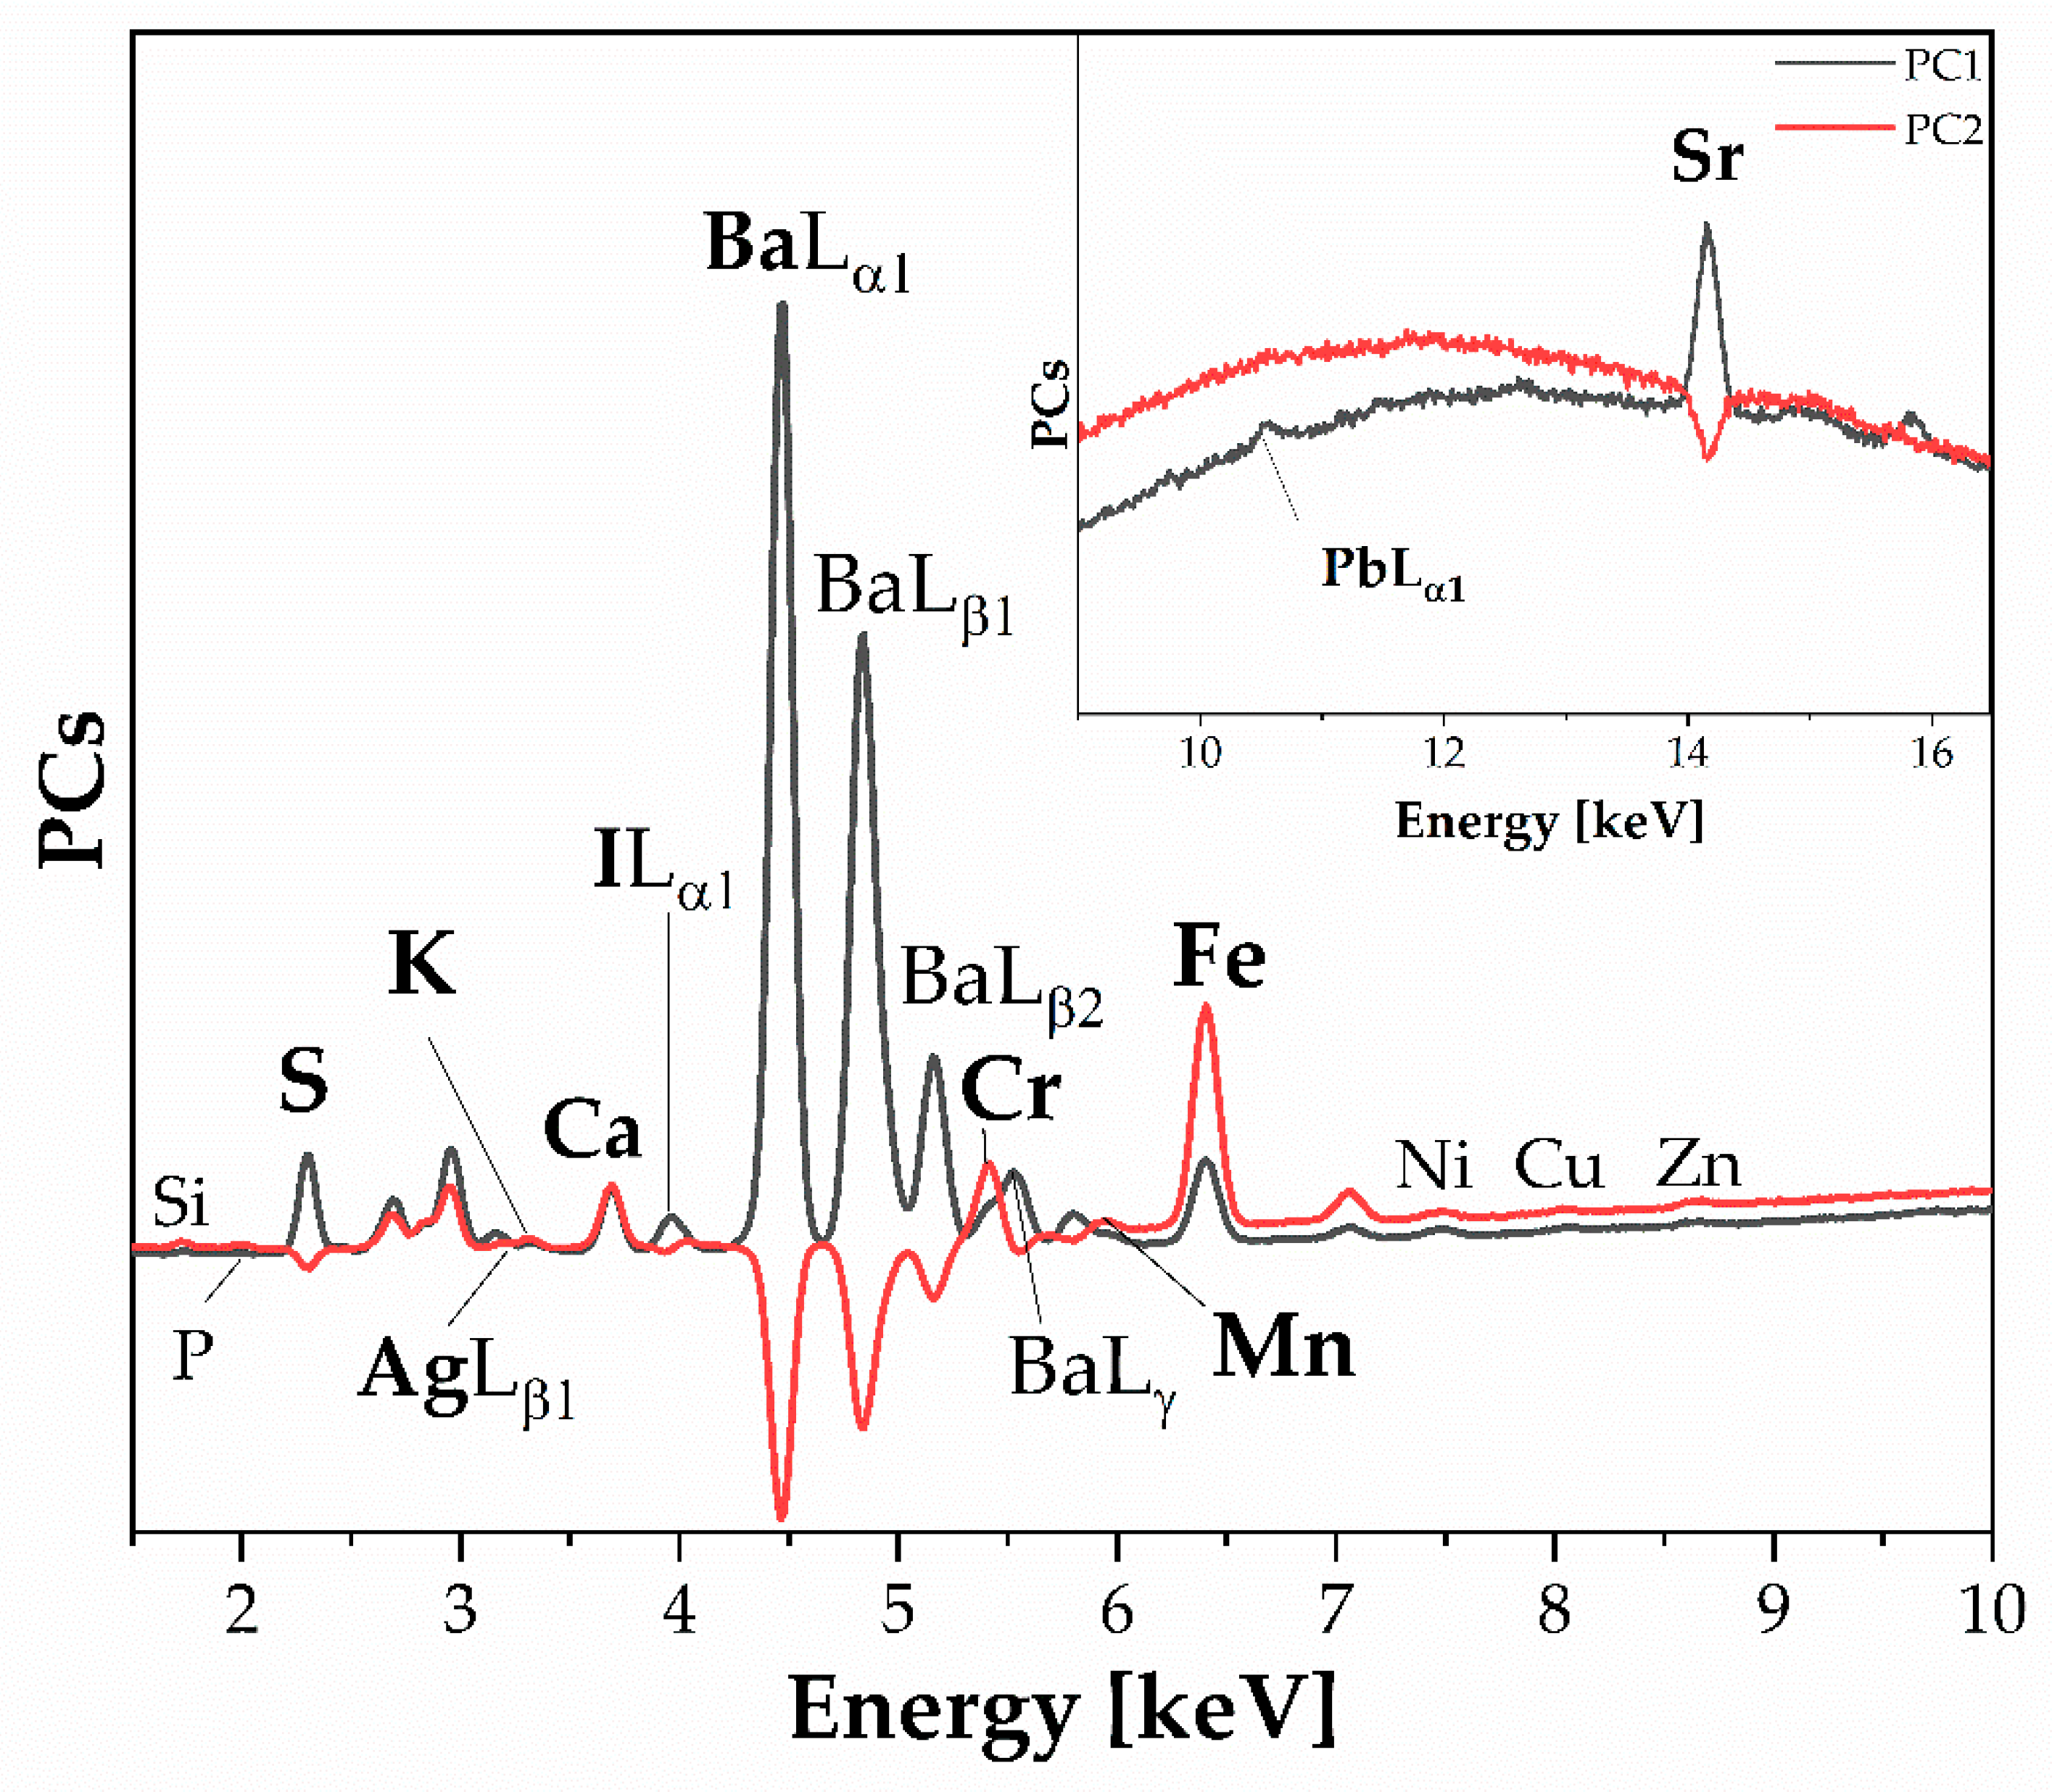
- PCA (Loading_XRF).
4. Conclusions
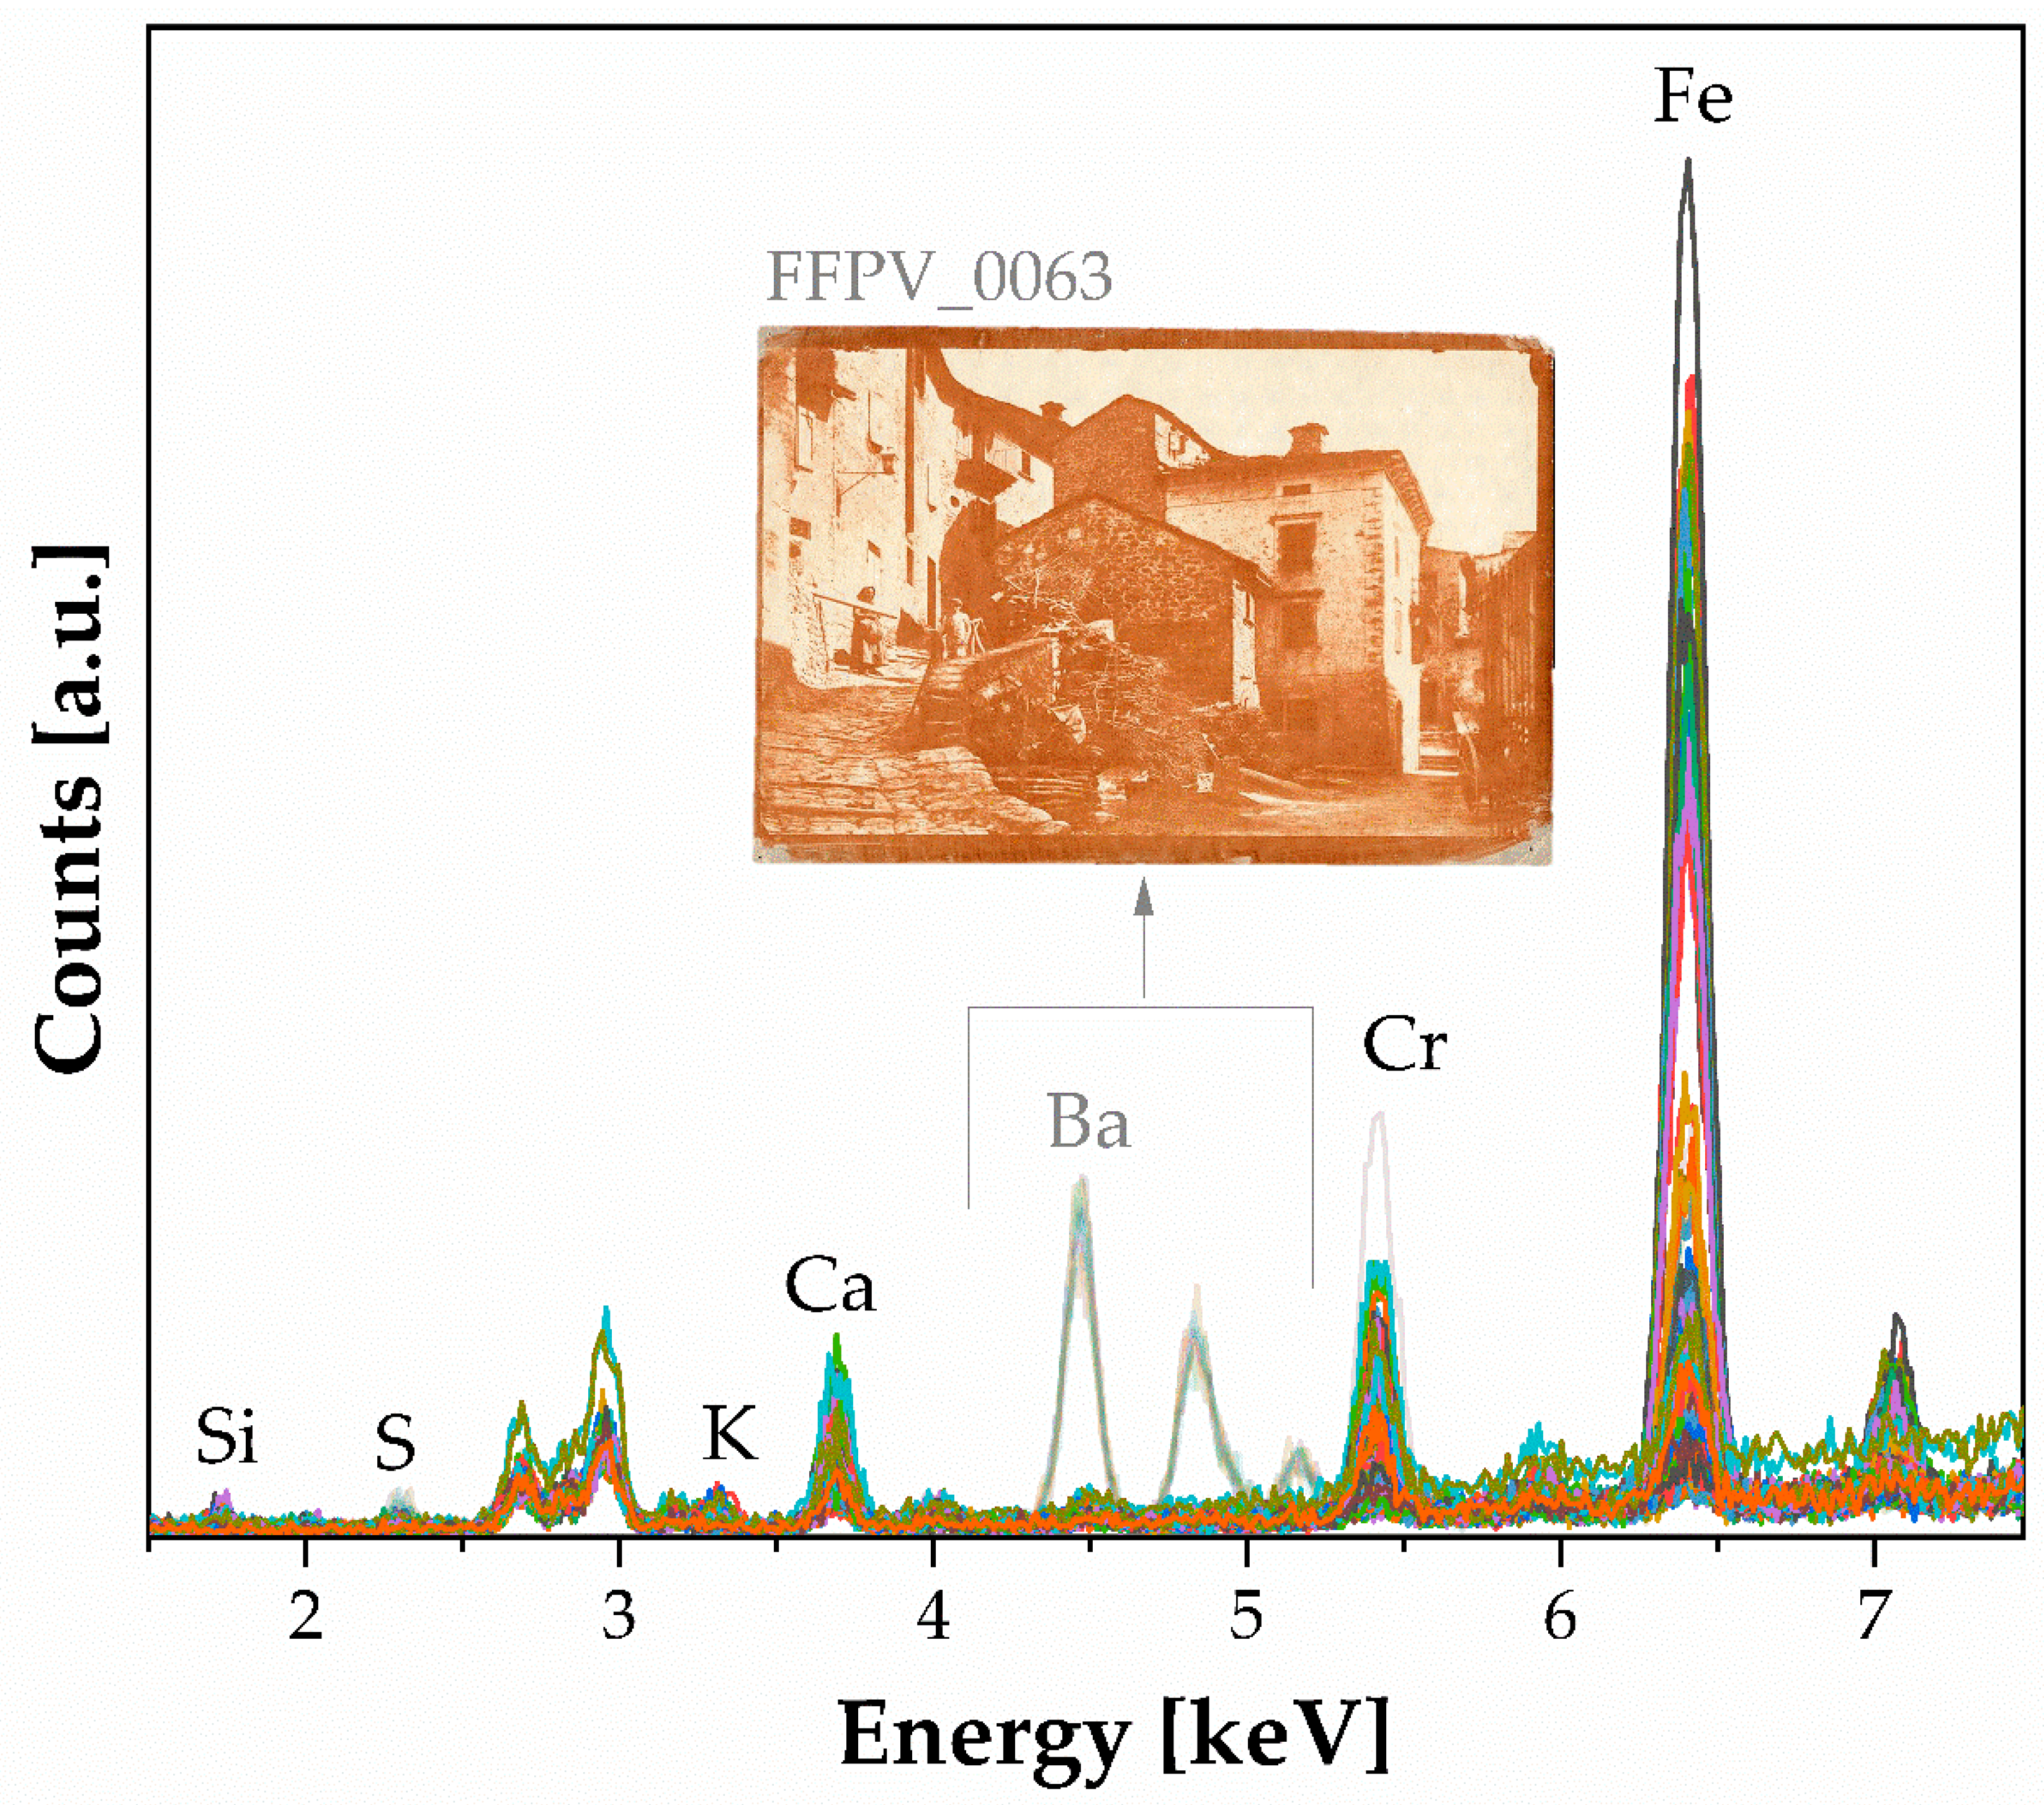
- Dichromate salts with gum arabic print. Fourteen photographic prints have been characterized by sensitive dichromate salts and gum arabic. The prints were prepared using potassium dichromate as a photosensitizing agent, along with a pigment (likely iron oxide) responsible for the reddish-brown coloring in some of the photographs. An unconventional print (inventory number FFPV_0063) was found, as it used a baryta layer and an additional layer applied with a roller, as mentioned in the artist’s notes. A sharp-cut tool was used, particularly along the edges of the photograph FFPV_0063. Furthermore, FTIR analysis complements the XRF findings, identifying the presence of a sensitizer (potassium dichromate) bands, gum arabic, and potentially gelatin or starch. This group of prints, which is the largest numerically, exhibits a higher variance, as indicated by the spread of measurement points along the PCs.
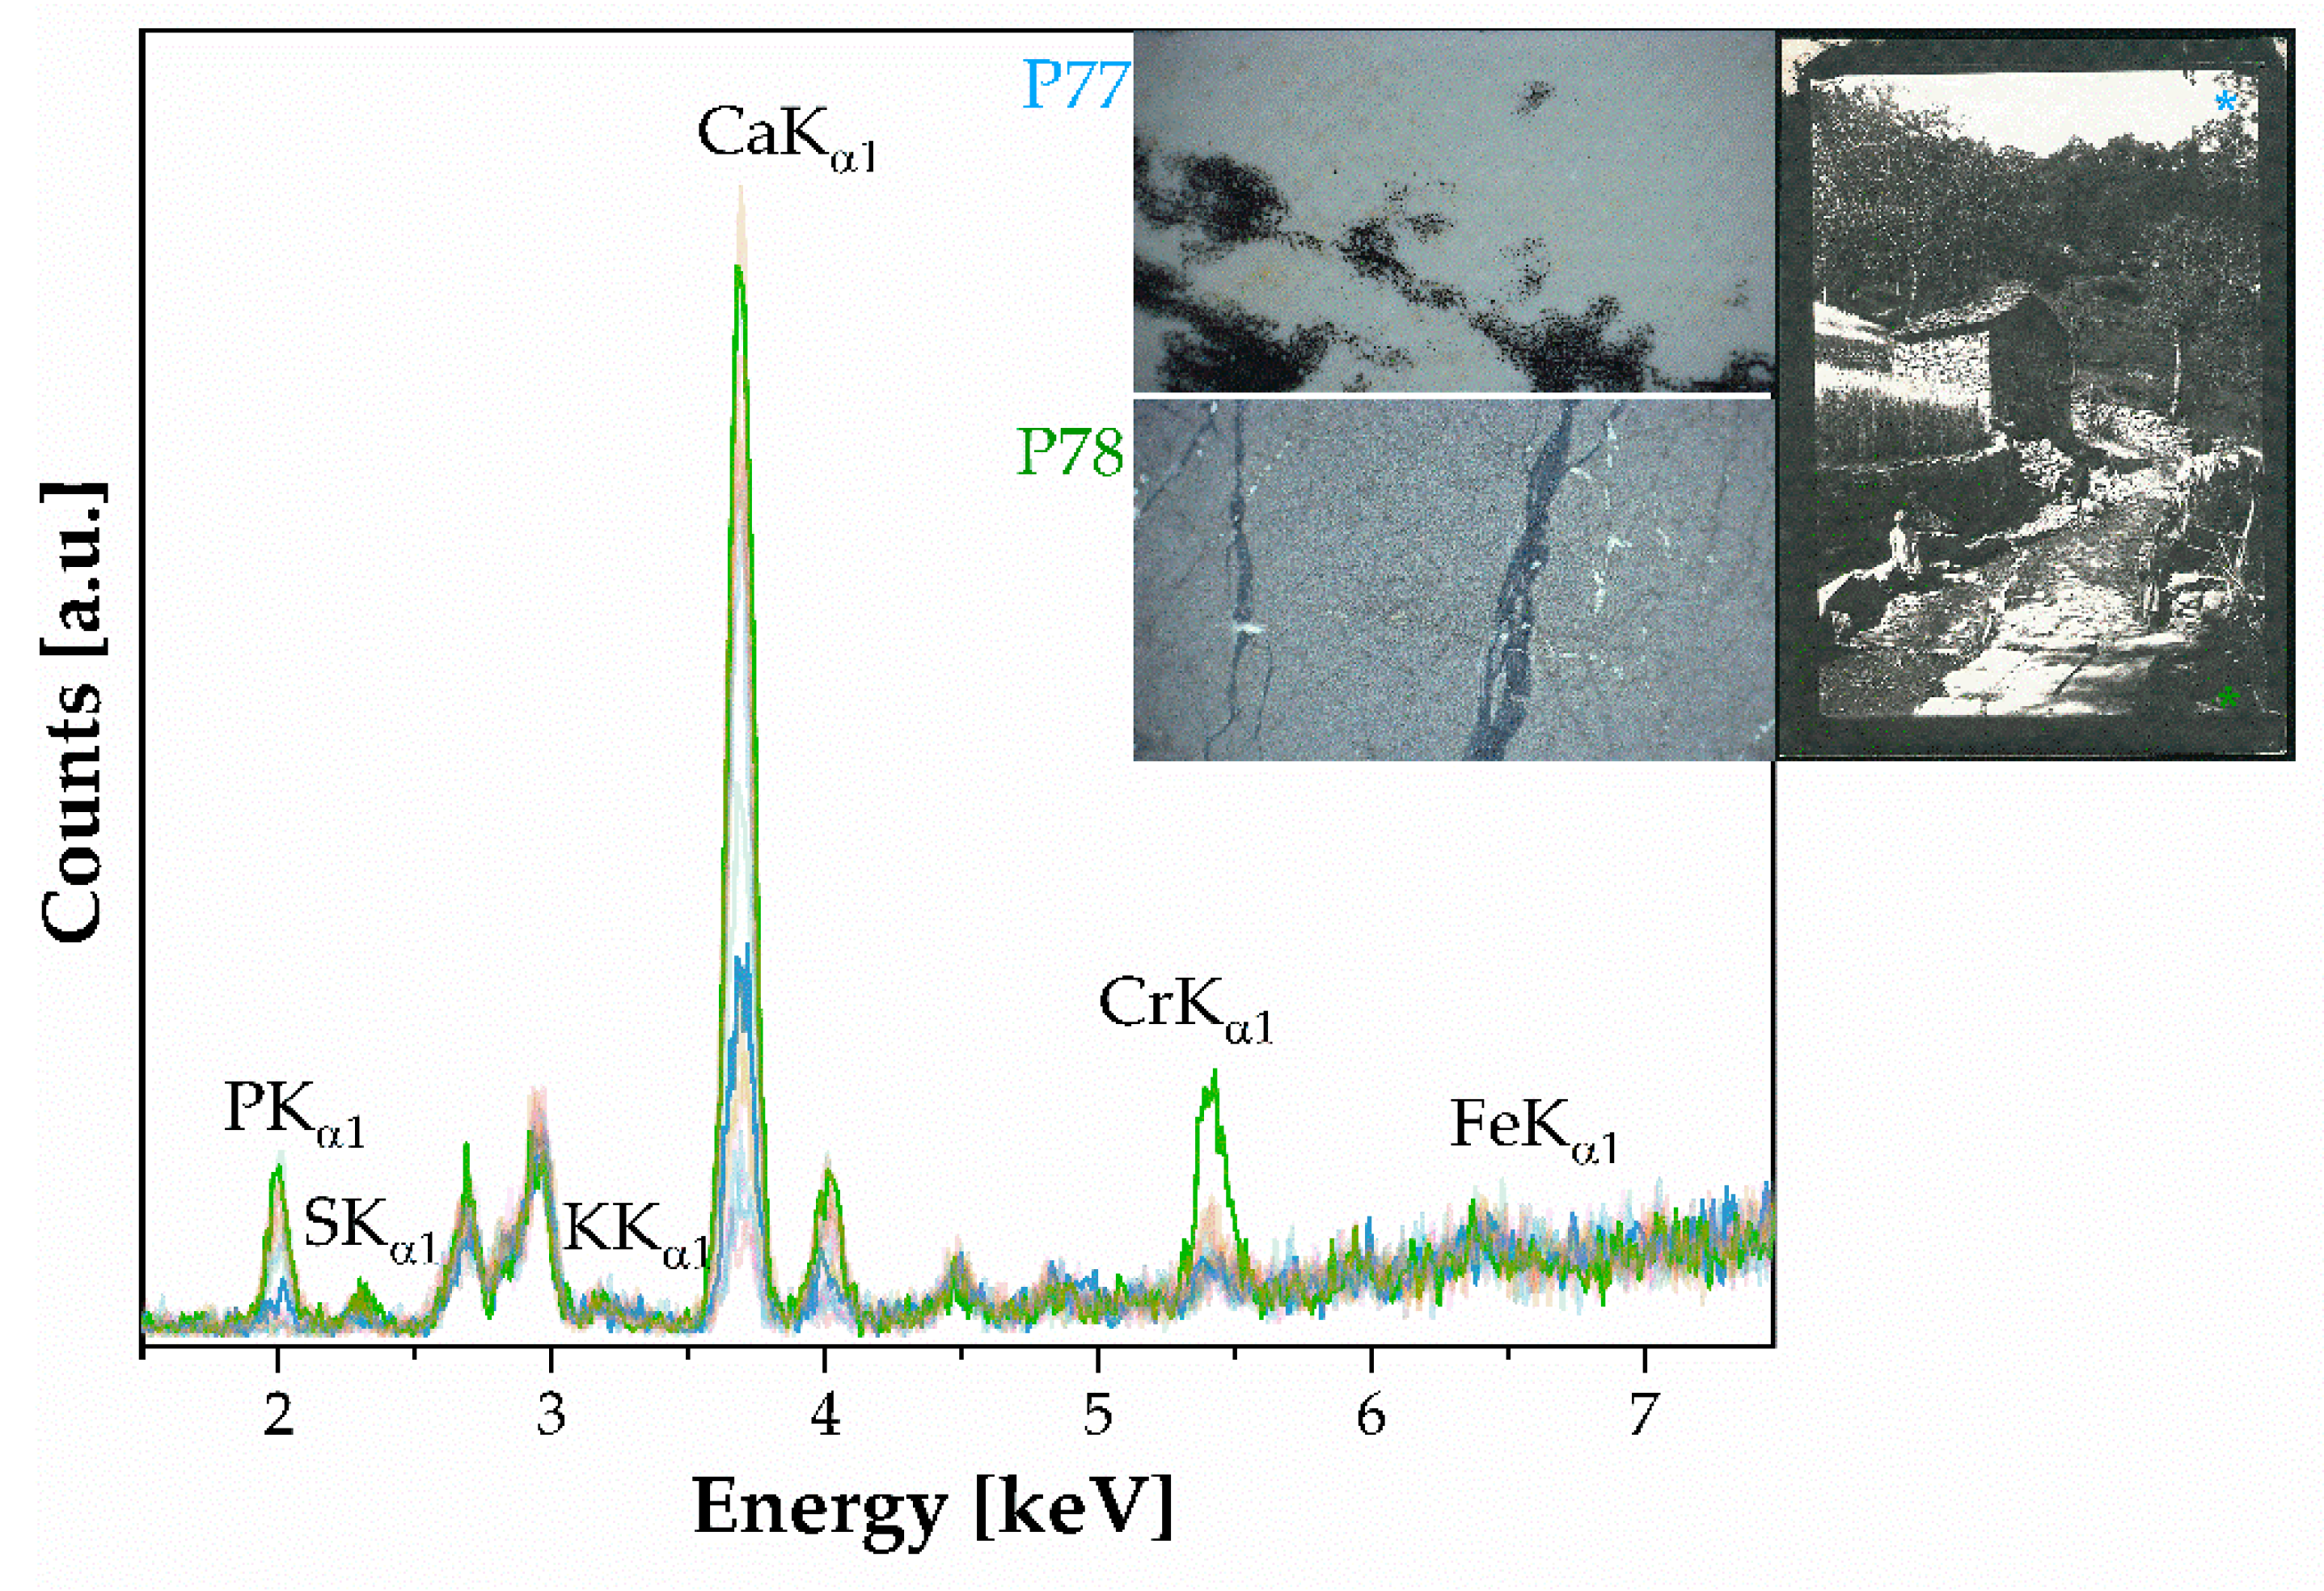
- Silver halide emulsions on the baryta layer. A baryta layer on silver halide emulsions is identified in eight photographic prints. The spectroscopic elemental analysis revealed that the prints contain Ag, I, and Ba as elemental benchmarks, indicating the presence of colloidal and baryta layer parts. Additionally, Si was detected as part of the silicates added as additives as a matting agent. The PCA revealed the presence of an Ilα1 peak at 3.94 keV, the second line Kβ of a Ca peak at 4.01 keV, and a Mn peak at 5.90 keV (both hidden by the noisy signal—see Figure 4). The binder was identified as a mixture of gelatin and albumen and a N-H stretching band was detected, indicating the use of gelatin hardening during gluing. Machine learning techniques were employed to identify prints with a greater abundance of albumen and distinguish similar paper backgrounds used in the prints.
- Carbon prints. Carbon prints characterized two photographic prints using a dichromate colloid suspended in pigmented gelatin. XRF and FTIR analyses confirm the traditional process. In this instance, the artist emphasized the dark areas by incorporating the dichromate salt. The PCA’s score analysis revealed that this group of prints is the most consistent and homogeneous. The artist used commercially prepared papers, resulting in a stylistic uniformity among the prints.
- Bromoil prints. Bromoil prints are characterized by six photographic prints. This class of prints is diverse in its elemental and molecular composition. The photographic process involves using dichromate salt and pigments (iron-based), along with the presence of gelatin. The distinct vibrations of this type of photograph, particularly the oily part, were only revealed through PCA by the correlation loading.
Supplementary Materials
Author Contributions
Funding
Institutional Review Board Statement
Informed Consent Statement
Data Availability Statement
Acknowledgments
Conflicts of Interest
References
- Abdala, R.D. Kaleidoscope of Images in Exchange: The Pictorialism Movement in the Promotion of Photographic Education and Photographic Production. In Rethinking Centre-Periphery Assumptions in the History of Education; Taylor a& Francis Group, Imprint; Routledge: New York, NY, USA, 2024; ISBN 9781003374091. [Google Scholar]
- Available online: https://libreriabelriguardo.it/libro/aa-vv-il-diaframma-fotografia-italiana-1975/ (accessed on 24 April 2024).
- Pinet, H. La Photographie Pictorialiste en Europe 1888–1918; Musée des Beaux-Arts; Le Point du jour: Rennes, France, 2005. [Google Scholar] [CrossRef]
- Available online: https://invitoallalettura.com/libri/8233-il-processo-di-stampa-fotografica-positiva-alla-gomma-bicromatata.html (accessed on 24 April 2024).
- Available online: http://www.barcis.fvg.it/Piero-Vanni-Medico-condotto.131.0.html (accessed on 24 April 2024).
- Grabska, J.; Beć, K.B.; Huck, C.W. Novel near-infrared and Raman spectroscopic technologies for print and photography identification, classification, and authentication. NIR News 2021, 32, 11–16. [Google Scholar] [CrossRef]
- Moon, J.; Curran, K. A study of the relationship between the migration of image silver and perceived yellowing of silver gelatine photographs. Herit. Sci. 2017, 5, 45. [Google Scholar] [CrossRef]
- Shaheen, R.; Fouad, M.; Saqr, O.; Reda, S.; Labeeb, A. Assessment of the photo-chemical degradation of silver gelatin photograph print-out. Int. J. Conserv. Sci. 2020, 11, 1093–1102. [Google Scholar]
- Walker, J.M.; Berrie, B.H. Influence of image density and interfacial surfaces on ER-FTIR spectra of 19th century photographic print processes. J. Cult. Herit. 2023, 63, 80. [Google Scholar] [CrossRef]
- Zhang, S.; Tang, Y.; Vlahovic, B. A review on preparation and applications of silver-containing nanofibers. Nanoscale Res. Lett. 2016, 11, 1–8. [Google Scholar] [CrossRef]
- Vila, A.; Centeno, S.A. FTIR, Raman and XRF identification of the image materials in turn of the 20th century pigment-based photographs. Microchem. J. 2013, 106, 255–262. [Google Scholar] [CrossRef]
- Casoli, A.; Fornaciari, S. An analytical study on an early twentieth-century Italian photographs collection by means of microscopic and spectroscopic techniques. Microchem. J. 2014, 116, 24–30. [Google Scholar] [CrossRef]
- Martins, A.; Daffner, L.A.; Fenech, A.; McGlinchey, C.; Strlič, M. Non-destructive dating of fiber-based gelatin silver prints using near-infrared spectroscopy and multivariate analysis. Anal. Bioanal. Chem. 2012, 525, 1459–1469. [Google Scholar] [CrossRef][Green Version]
- Oravec, M.; Haberová, K.; Jančovičová, V.; Machatová, Z.; Čeppan, M.; Huck, C.W. Identification of the historic photographic print materials using portable NIR and PCA. Microchem. J. 2019, 150, 104202. [Google Scholar] [CrossRef]
- Tournié, A.; Carré, P.; Andraud, C.; Boust, C.; Lavédrine, B. Identification of chromogenic colour photographic print brand by fiber optical reflectance spectroscopy and statistical analysis. J. Cult. Herit. 2017, 26, 28–35. [Google Scholar] [CrossRef]
- Available online: https://www.bruker.com/it/applications/academia-materials-science/art-conservation-archaeology/special-engineering.html (accessed on 24 April 2024).
- Available online: http://www.graphicsatlas.org/identification/ (accessed on 24 April 2024).
- Vila, A.; Centeno, S.A.; Barro, L.; Kennedy, N.W. Understanding the gum dichromate process in pictorialist photographs: A literature review and technical study. Stud. Conserv. 2013, 58, 176–188. [Google Scholar] [CrossRef]
- Kaplan, A.; Stulik, D. Pushing the Limits of the Identification of Photographs: Variants of the Gum Bichromate Process. Top. Photogr. Preserv. 2013, 15, 190–206. [Google Scholar]
- Yusuf, M.O. Bond characterization in cementitious material binders using Fourier-transform infrared spectroscopy. Appl. Sci. 2023, 13, 3353. [Google Scholar] [CrossRef]
- Shaheen, R.A.; Ali, M.F.; Osama Saqr, M.; Reda, S.M.; Labeeb, A.M. Inquisition on the photochemical degradation of silver gelatin photograph print-out. J. Interv. Radiol. Nucl. Med. 2019, 2019, 58–66. [Google Scholar]
- Ricci, C.; Bloxha, S.; Kazarian, S.G. ATR-FTIR imaging of albumen photographic prints. J. Cult. Herit. 2007, 8, 387–395. [Google Scholar] [CrossRef]
- Cichosz, S.; Masek, A. Cellulose fibers hydrophobization via a hybrid chemical modification. Polymers 2019, 11, 1174. [Google Scholar] [CrossRef]
- Ketones. Available online: https://iloencyclopaedia.org/ (accessed on 24 April 2024).
- Cotton, D.P.J.; Popel, A.; Graz, I.M.; Lacour, S.P. Photopatterning the mechanical properties of polydimethylsiloxane films. J. Appl. Phys. 2011, 109, 054905. [Google Scholar] [CrossRef]
- Kelsall, B.J.; Andrews, L. FTIR spectroscopic studies of the matrix photoionization and photolysis products of methylene halides. J. Mol. Spectrosc. 1983, 97, 362–378. [Google Scholar] [CrossRef]
- Scatigno, C.; Festa, G. FTIR coupled with machine learning to unveil spectroscopic benchmarks in the Italian EVOO. Int. J. Food Sci. Technol. 2022, 57, 4156–4162. [Google Scholar] [CrossRef]
- Festa, G.; Maggio, M.S.; Teodonio, L.; Scatigno, C. Ancient handwriting attribution via spectroscopic benchmarks and machine learning: ‘Clavis Prophetarum’ by Antonio Viera. Expert Syst. Appl. 2023, 227, 120328. [Google Scholar] [CrossRef]
- Śmiechowski, M.; Gojło, E.; Stangret, J. Ionic hydration in LiPF6, NaPF6, and KPF6 aqueous solutions derived from infrared HDO spectra. J. Phys. Chem. B 2004, 108, 15938–15943. [Google Scholar] [CrossRef]
- Bal, R.; Tope, B.B.; Das, T.K.; Hegde, S.G.; Sivasanker, S. Alkali-loaded silica, a solid base: Investigation by FTIR spectroscopy of adsorbed CO2 and its catalytic activity. J. Catal. 2001, 204, 358–363. [Google Scholar] [CrossRef]
- Hadjiivanov, K.; Knözinger, H. Low-Temperature CO Adsorption on Ag+/SiO2 and Ag–ZSM-5: An FTIR Study. J. Phys. Chem. B 1998, 102, 10936–10940. [Google Scholar] [CrossRef]
- Yuen, S.N.; Choi, S.M.; Phillips, D.L.; Ma, C.Y. Raman and FTIR spectroscopic study of carboxymethylated non-starch polysaccharides. Food Chem. 2009, 114, 1091–1098. [Google Scholar] [CrossRef]
- Liu, X.; Renard, C.M.; Bureau, S.; Le Bourvellec, C. Revisiting the contribution of ATR-FTIR spectroscopy to characterize plant cell wall polysaccharides. Carbohydr. Polym. 2021, 262, 117935. [Google Scholar] [CrossRef]
- Cattaneo, B.; Chelazzi, D.; Giorgi, R.; Serena, T.; Merlo, C.; Baglioni, P. Physico-chemical characterization and conservation issues of photographs dated between 1890 and 1910. J. Cult. Herit. 2008, 9, 277–284. [Google Scholar] [CrossRef]
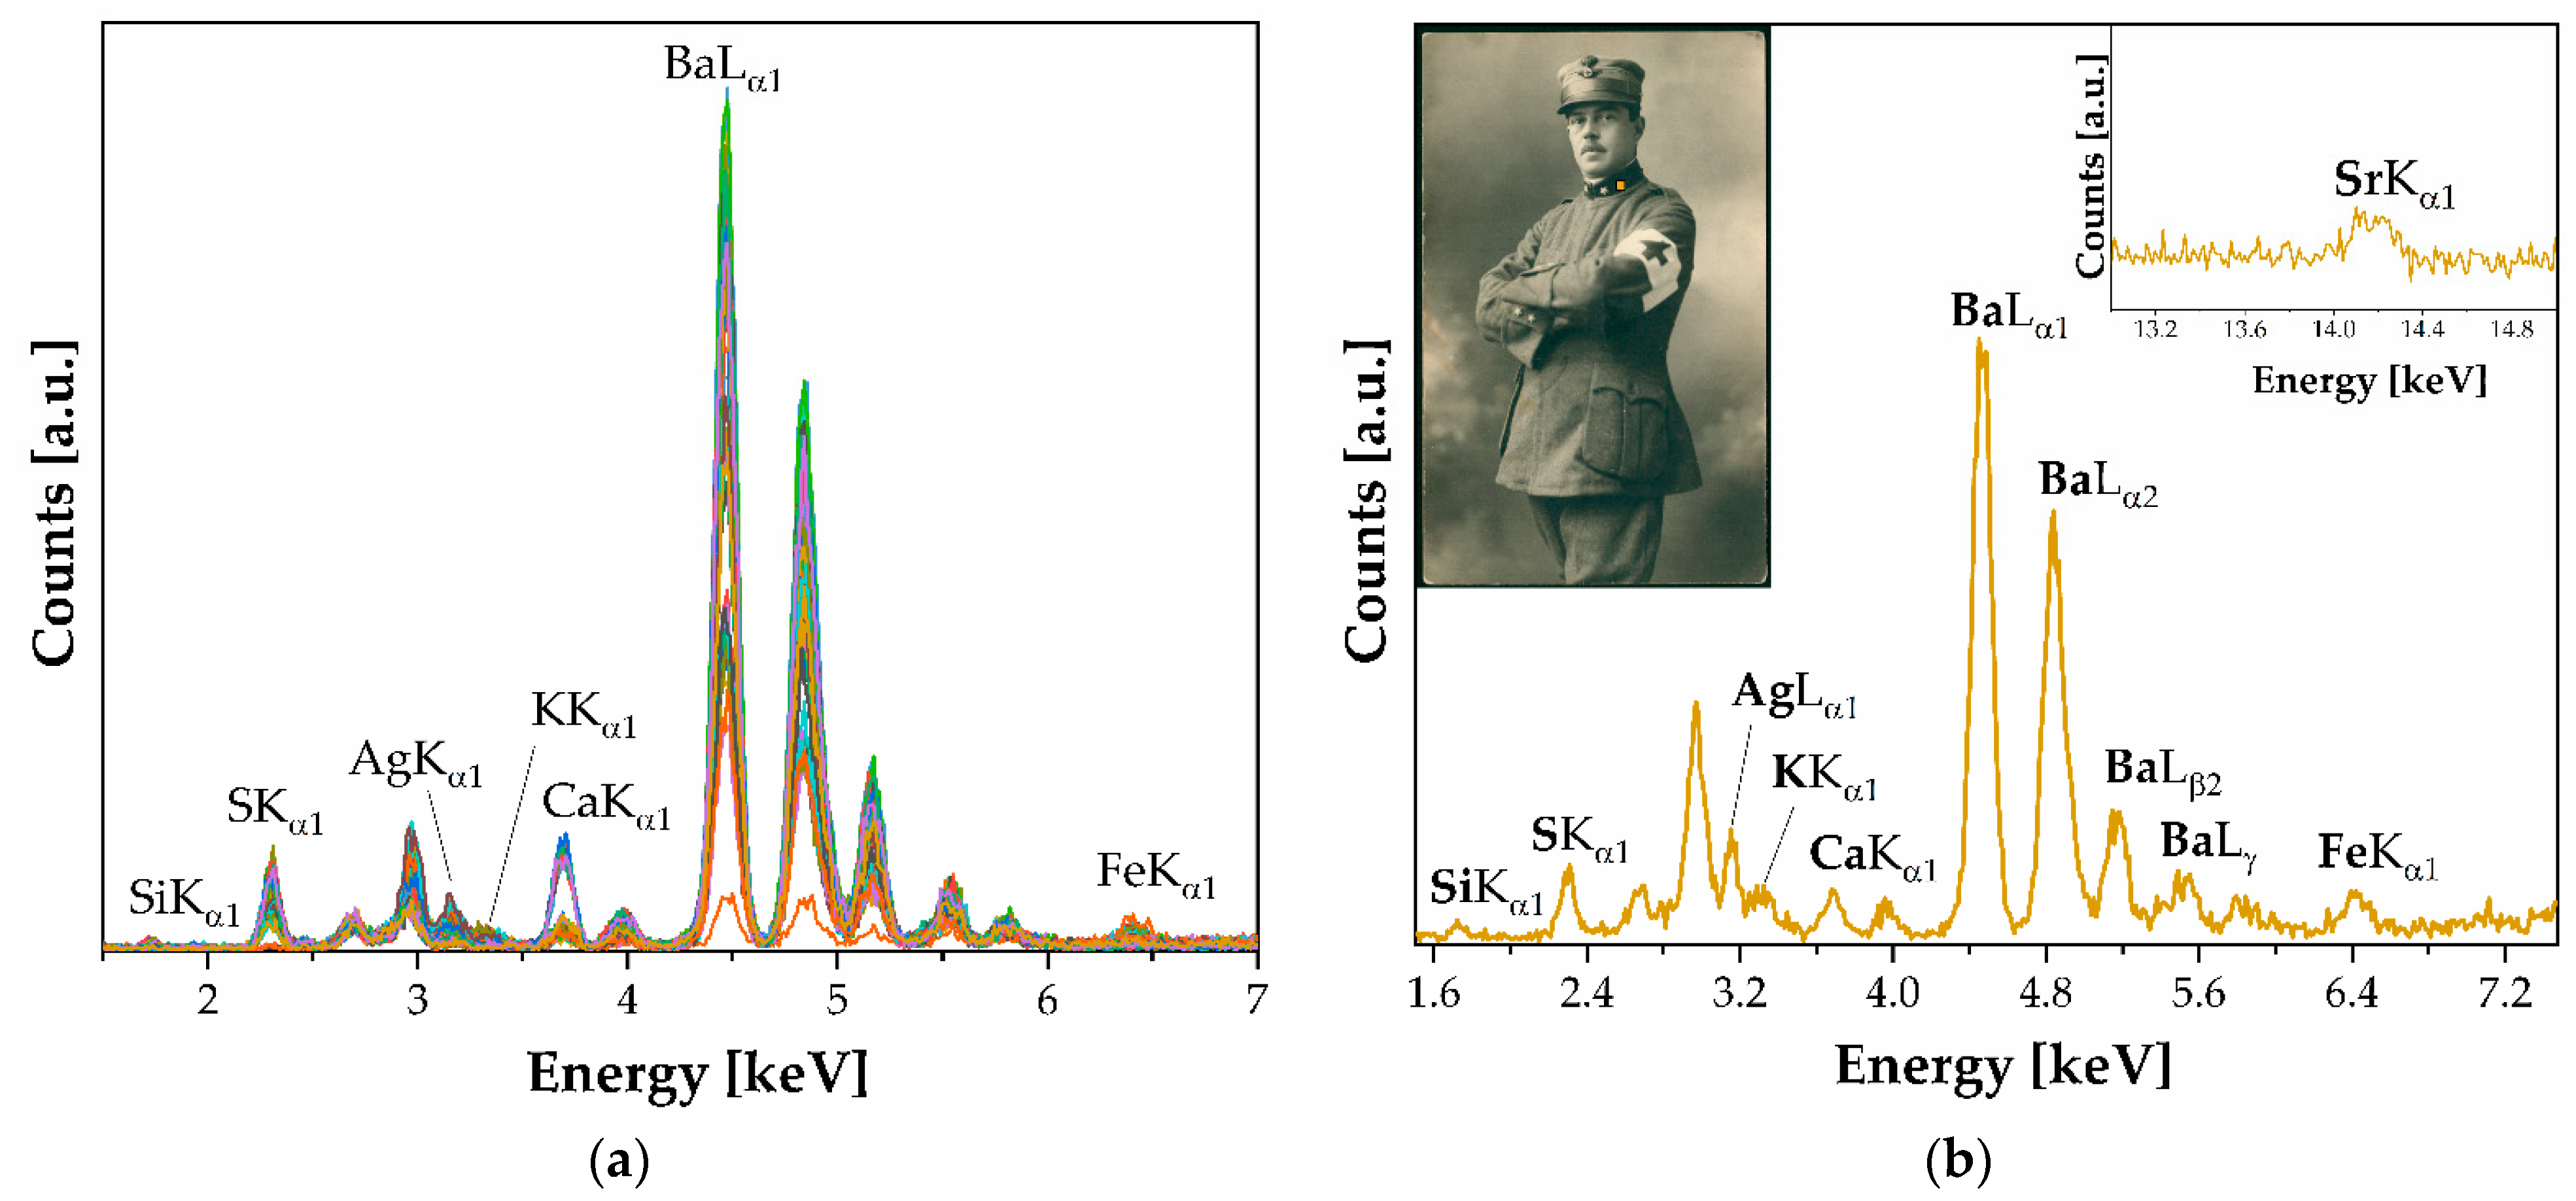
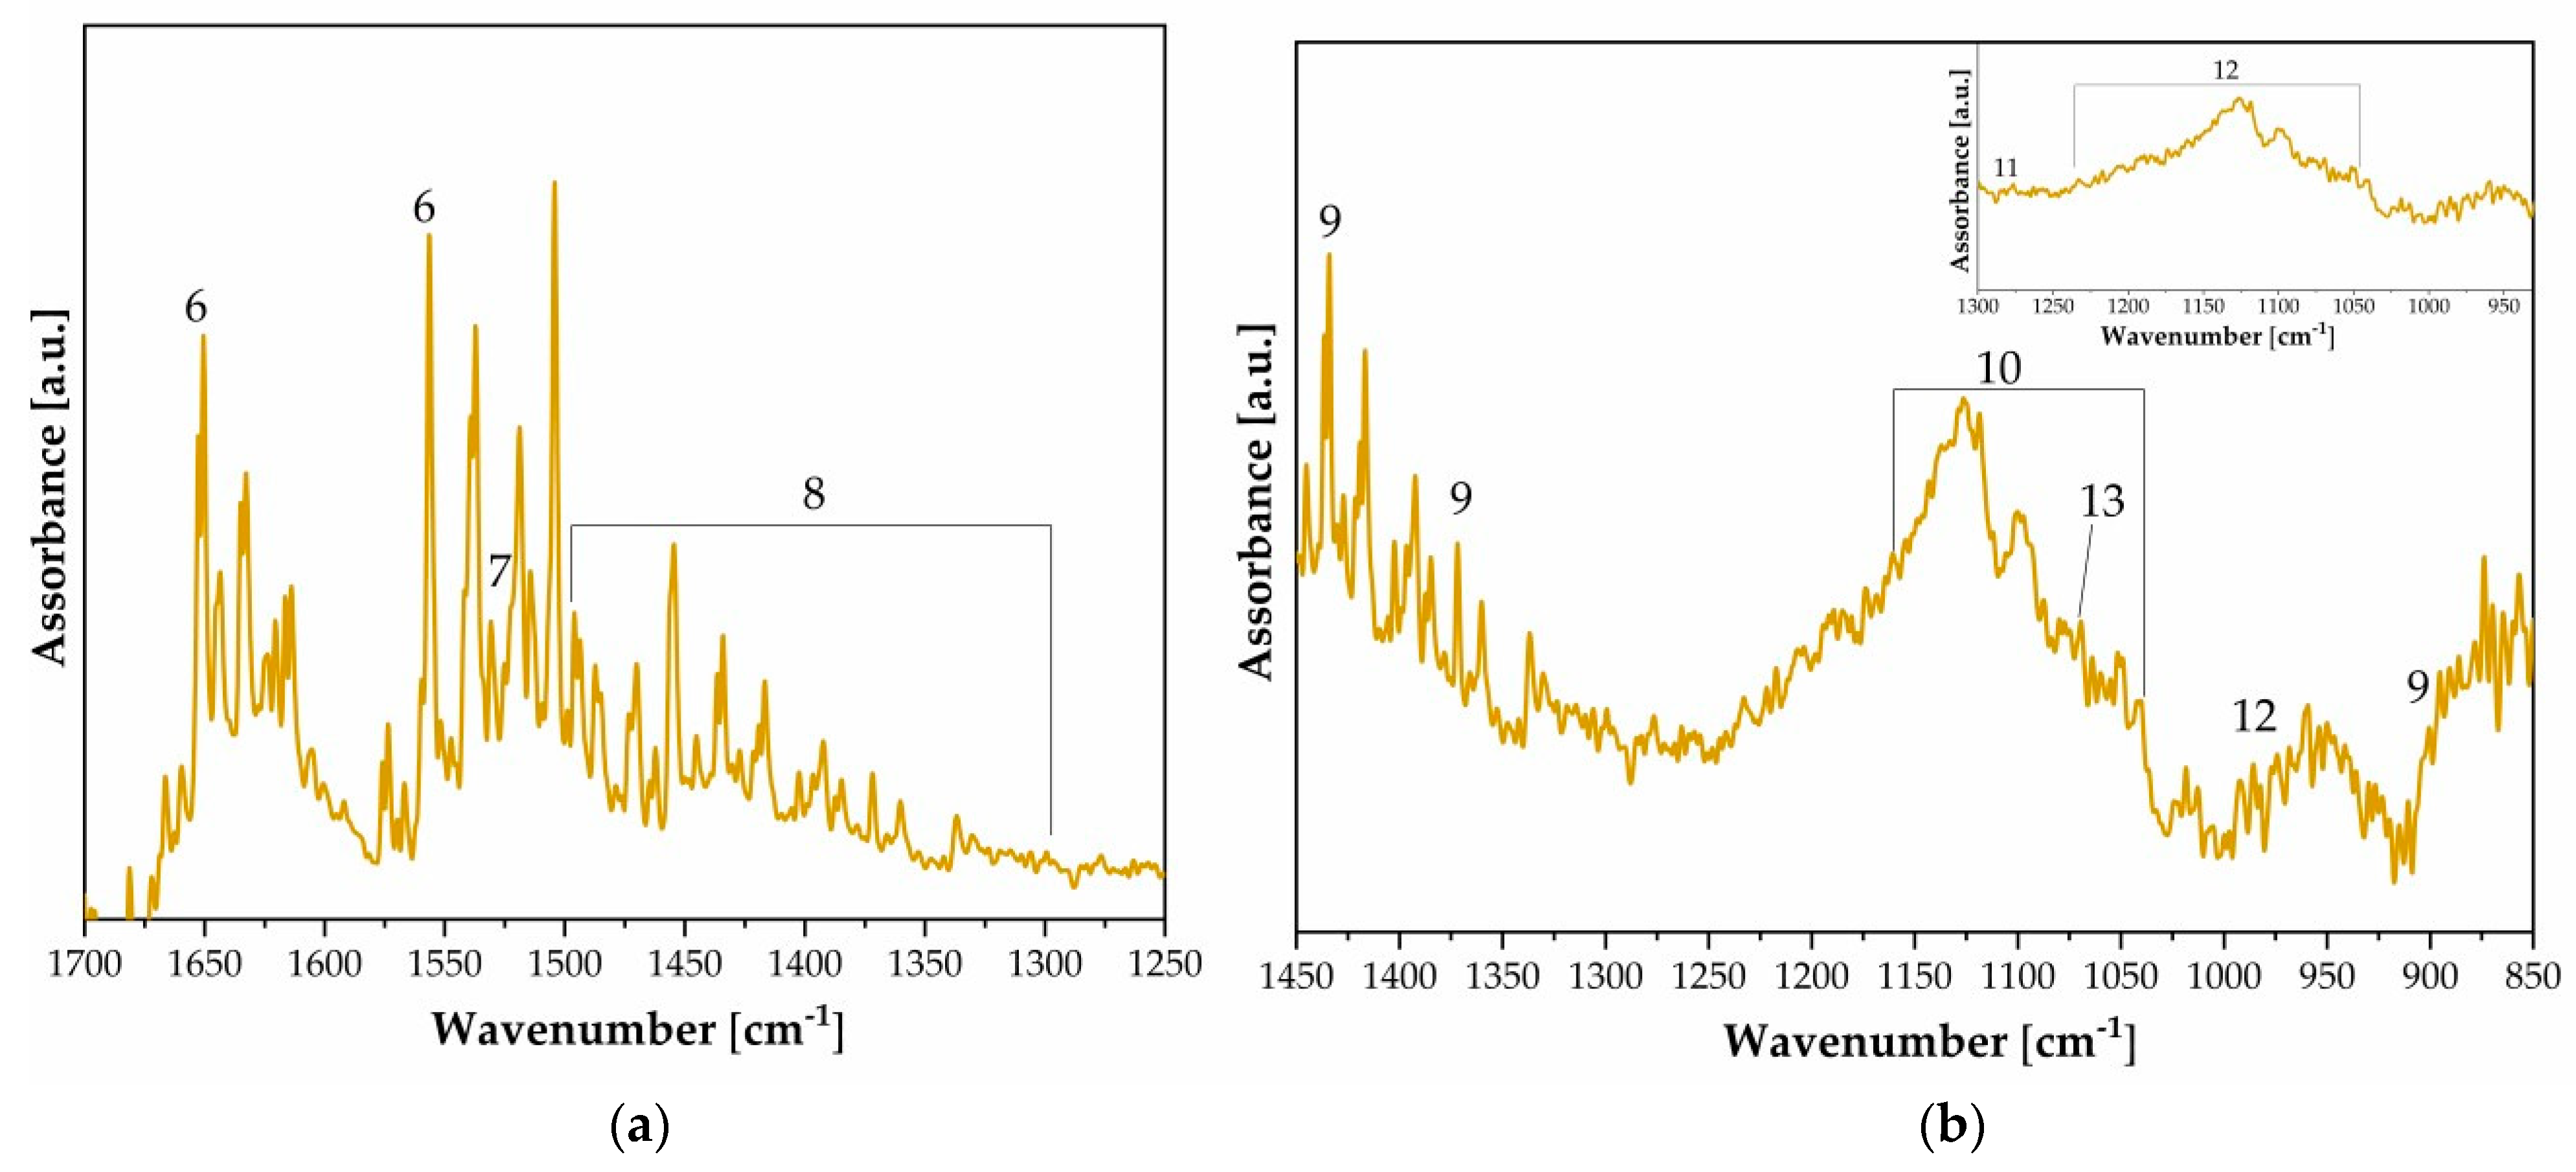



| n. | Wavenumber [cm−1] | Functional Group | Note |
|---|---|---|---|
| 1 * | 3550–3200 | νO–H | Alcohol/Phenol [21] |
| 2 * | 3500–3300 | νN–H | Amine [21] |
| 3 * | 2950–2850 | νC–H | Alkyl [21] |
| 4 * | 3100–3010 | νC–H | Alkenyl [21] |
| 5 * | 3030 | νC–H | Aromatic [21] |
| 6 | 1650, 1540 | νC=O | Amide I-II (protein layer) [7] |
| 7 | 1526 | δN–H | Gelatin/ammonium dichromate [21] |
| 8 | 1500–1300 | C=O, CONH2, NH | Gelatin/albumen/ammonium dichromate [12,21] |
| 9 | 1430, 1375, 900 | CH2, CH, C–O–C | Cellulose chain [8] |
| 10 | 3340, 1100, 1062, 1030 | C–O, C–C | Cellulose chain [8] |
| 11 | 1276 | Ag | Colloidal silver [8] |
| 12 | 1240–1050, 985 | SO42− | Baryta layer [8] |
| 13 | 1070 | νSi–O 1 | Silicate [8] |
| n. | Wavenumber [cm−1] | Functional Group | Note |
|---|---|---|---|
| 1 | 1650, 1633 | νC–NH2, δN–H | Gelatin [19] |
| 2 | 1537, 1550 | νC–NH–C, δN–H | Gelatin [19] |
| 3 | 1437 | νC–N–C | Gelatin [19] |
| 4 | 1062, 1030 | C–O, C–C | Cellulose chain [7] |
| 5 | 990, 979 * | K2Cr2O7 | Sensitizer [11] |
| n. | Wavenumber [cm−1] | Functional Group | Note |
|---|---|---|---|
| 1 | 3334 | –OH | Water [23] |
| 2 | 1930 | R–CHO | Hardening [24] |
| 3 | 1243 | CH3[Si(CH3)2O]nSi(CH3)3 | Photosensitive poly(dimethylsiloxane) [25] |
| 4 | 1000–900 | νC–Br | Halite Emulsion [26] |
| 5 | 1650, 1633 | νC–NH2, δN–H | Gelatin [19] |
| 6 | 1537, 1550 | νC–NH–C, δN–H | Gelatin [19] |
| 7 | 1437 | νC–N–C | Gelatin [19] |
| 8 | 1062, 1030 * | C–O, C–C | Cellulose chain [7] |
| 9 | 990, 979 † | K2Cr2O7 | Sensitizer [11] |
Disclaimer/Publisher’s Note: The statements, opinions and data contained in all publications are solely those of the individual author(s) and contributor(s) and not of MDPI and/or the editor(s). MDPI and/or the editor(s) disclaim responsibility for any injury to people or property resulting from any ideas, methods, instructions or products referred to in the content. |
© 2024 by the authors. Licensee MDPI, Basel, Switzerland. This article is an open access article distributed under the terms and conditions of the Creative Commons Attribution (CC BY) license (https://creativecommons.org/licenses/by/4.0/).
Share and Cite
Scatigno, C.; Teodonio, L.; Di Rocco, E.; Festa, G. Spectroscopic Benchmarks by Machine Learning as Discriminant Analysis for Unconventional Italian Pictorialism Photography. Polymers 2024, 16, 1850. https://doi.org/10.3390/polym16131850
Scatigno C, Teodonio L, Di Rocco E, Festa G. Spectroscopic Benchmarks by Machine Learning as Discriminant Analysis for Unconventional Italian Pictorialism Photography. Polymers. 2024; 16(13):1850. https://doi.org/10.3390/polym16131850
Chicago/Turabian StyleScatigno, Claudia, Lorenzo Teodonio, Eugenia Di Rocco, and Giulia Festa. 2024. "Spectroscopic Benchmarks by Machine Learning as Discriminant Analysis for Unconventional Italian Pictorialism Photography" Polymers 16, no. 13: 1850. https://doi.org/10.3390/polym16131850
APA StyleScatigno, C., Teodonio, L., Di Rocco, E., & Festa, G. (2024). Spectroscopic Benchmarks by Machine Learning as Discriminant Analysis for Unconventional Italian Pictorialism Photography. Polymers, 16(13), 1850. https://doi.org/10.3390/polym16131850


