Temperature-Dependent Viscosity Analysis of Powell–Eyring Fluid Model during a Roll-over Web Coating Process


Abstract
1. Introduction
- Numerous studies have tackled the process of roll coating involving different non-Newtonian fluids with constant thermophysical properties. Nevertheless, there exists a gap in research that explicitly focuses on the effects of change in viscosity concerning with temperature, particularly in the case of Eyring–Powell fluid as a non-Newtonian fluid.
- Most of the studies do not capture the important engineering characteristics such as coating thickness, Nusselt number, shear stress, roll/sheet separating force, and roll transmitted power to the fluid.
- Studies that center the concurrent optimization of chosen key parameters to maximize heat transfer rate and minimize shear stress rate are scarce.
- Constructing an Eyring–Powell fluid model for rollover coating process using Reynold’s model—a variable viscosity model.
- Investigating the outcome of temperature-dependent viscosity parameter in a rollover web coating problem.
- Examining the consequence of interested pertinent parameters on the engineering key factors like coating thickness, stress rate, rate of heat transfer coefficient, roll/sheet separating force, and roll transmitted power to the fluid.
- Identifying the limitations that achieve the dual goals of maximizing the rate of heat transfer and minimizing stress rate simultaneously through the application of optimization methods.
2. Governing Equations and the Problem Formulation
- ⮚
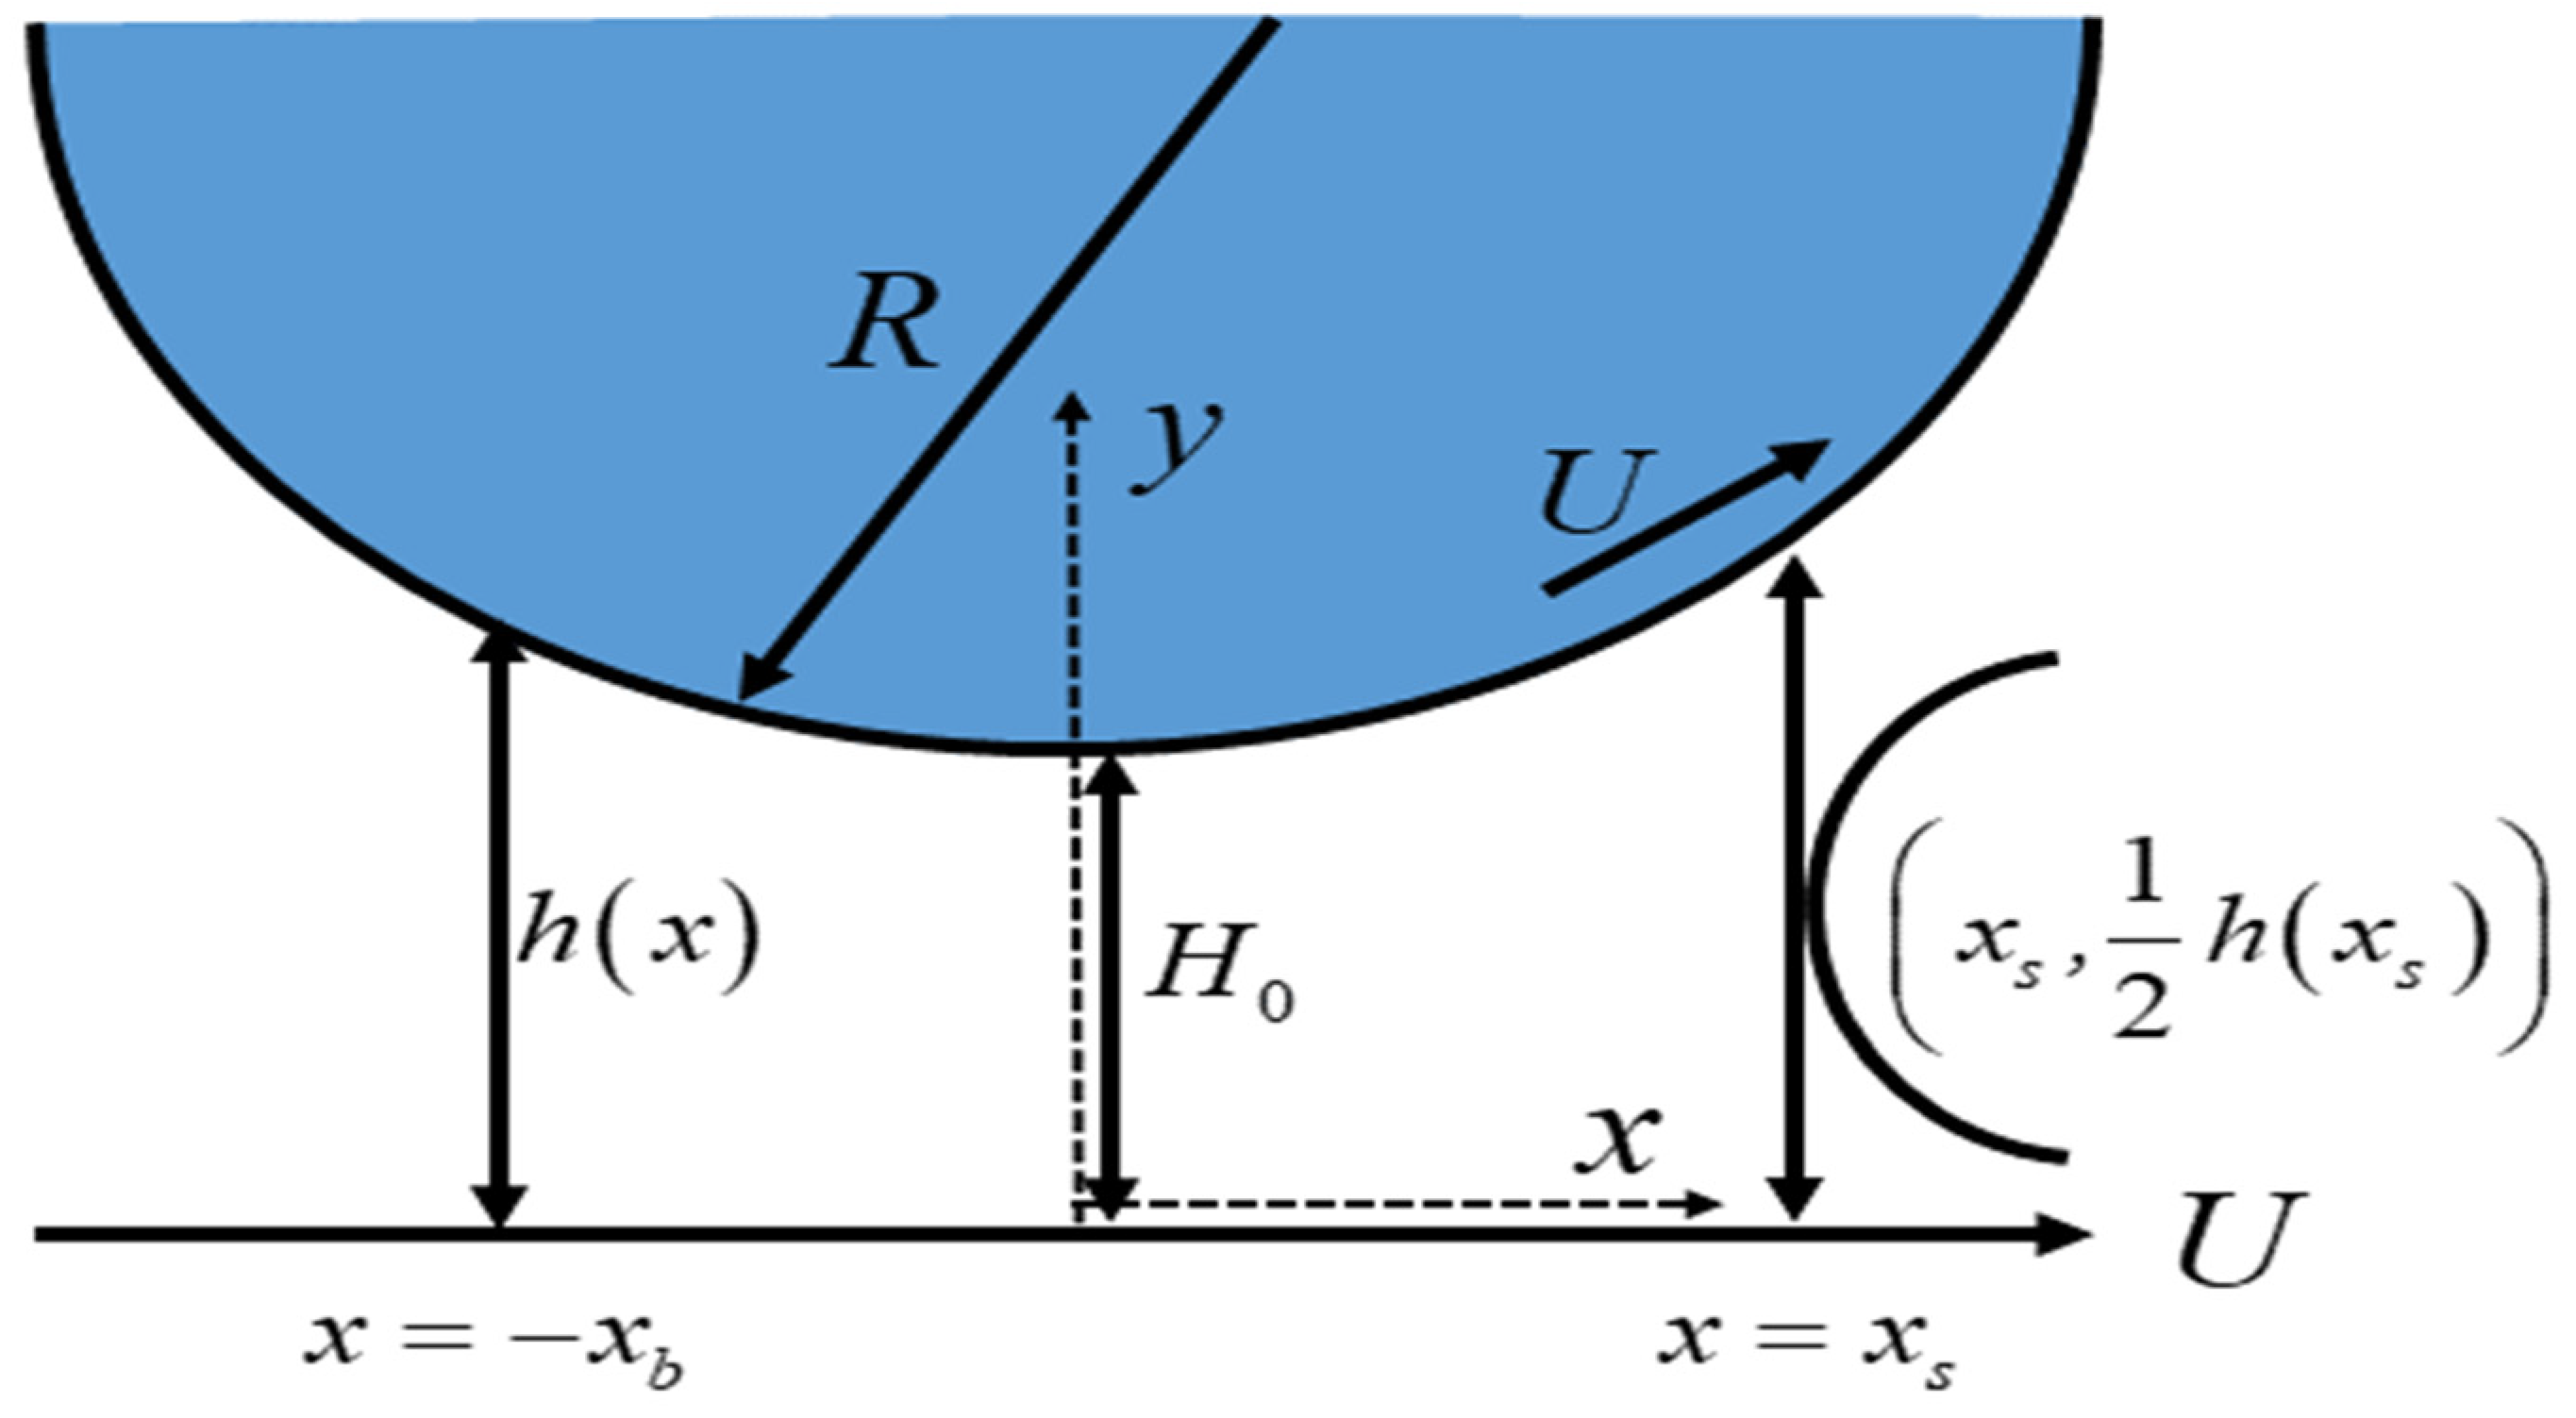
- A steady, incompressible, and non-isothermal flow of Eyring–Powell fluid with temperature-dependent viscosity is considered for the rollover web coating procedure.
- ⮚
- The radius of the roll is taken as , which rotates counterclockwise with an angular velocity represented by , resulting in the linear velocity .
- ⮚
- As the roll starts rotating, the web or sheet starts moving towards a positive -direction with a constant velocity .
- ⮚
- The web and roll have a small separation region called the nip area and the length of that gap is , as depicted in Figure 1.
- ⮚
- Assuming , the flow is locally regarded as a flow between two parallel plates.
2.1. Rheological Model
2.2. Non-Dimensionalities
2.3. Viscosity Model (Reynolds Model)
3. Machinal Quantities of Interest
3.1. Coating Thickness
3.2. Roll Separation Force ()
3.3. Power Input
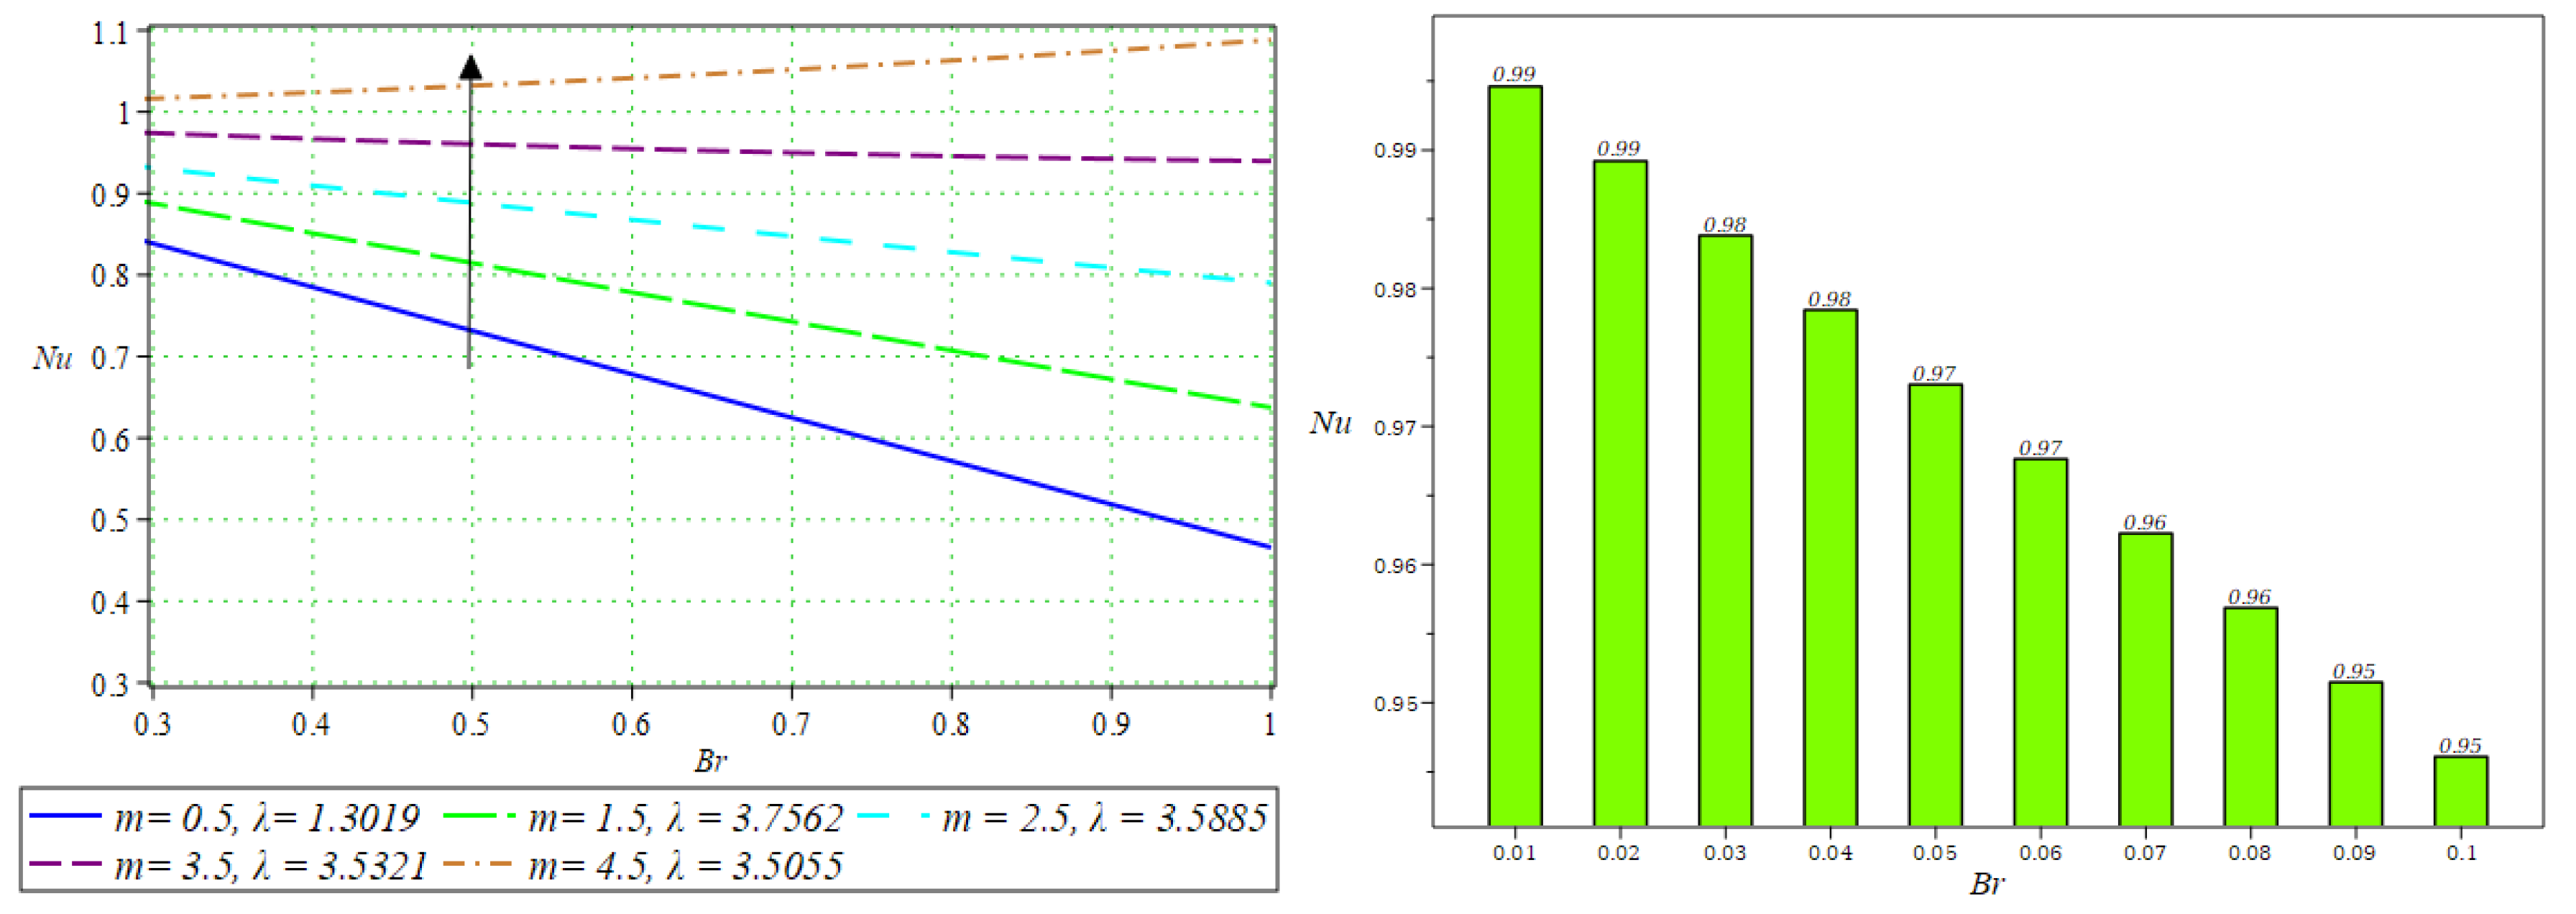
3.4. Nusselt Number
3.5. Shear Rate
4. Results and Discussion
5. Surface Response Methodology
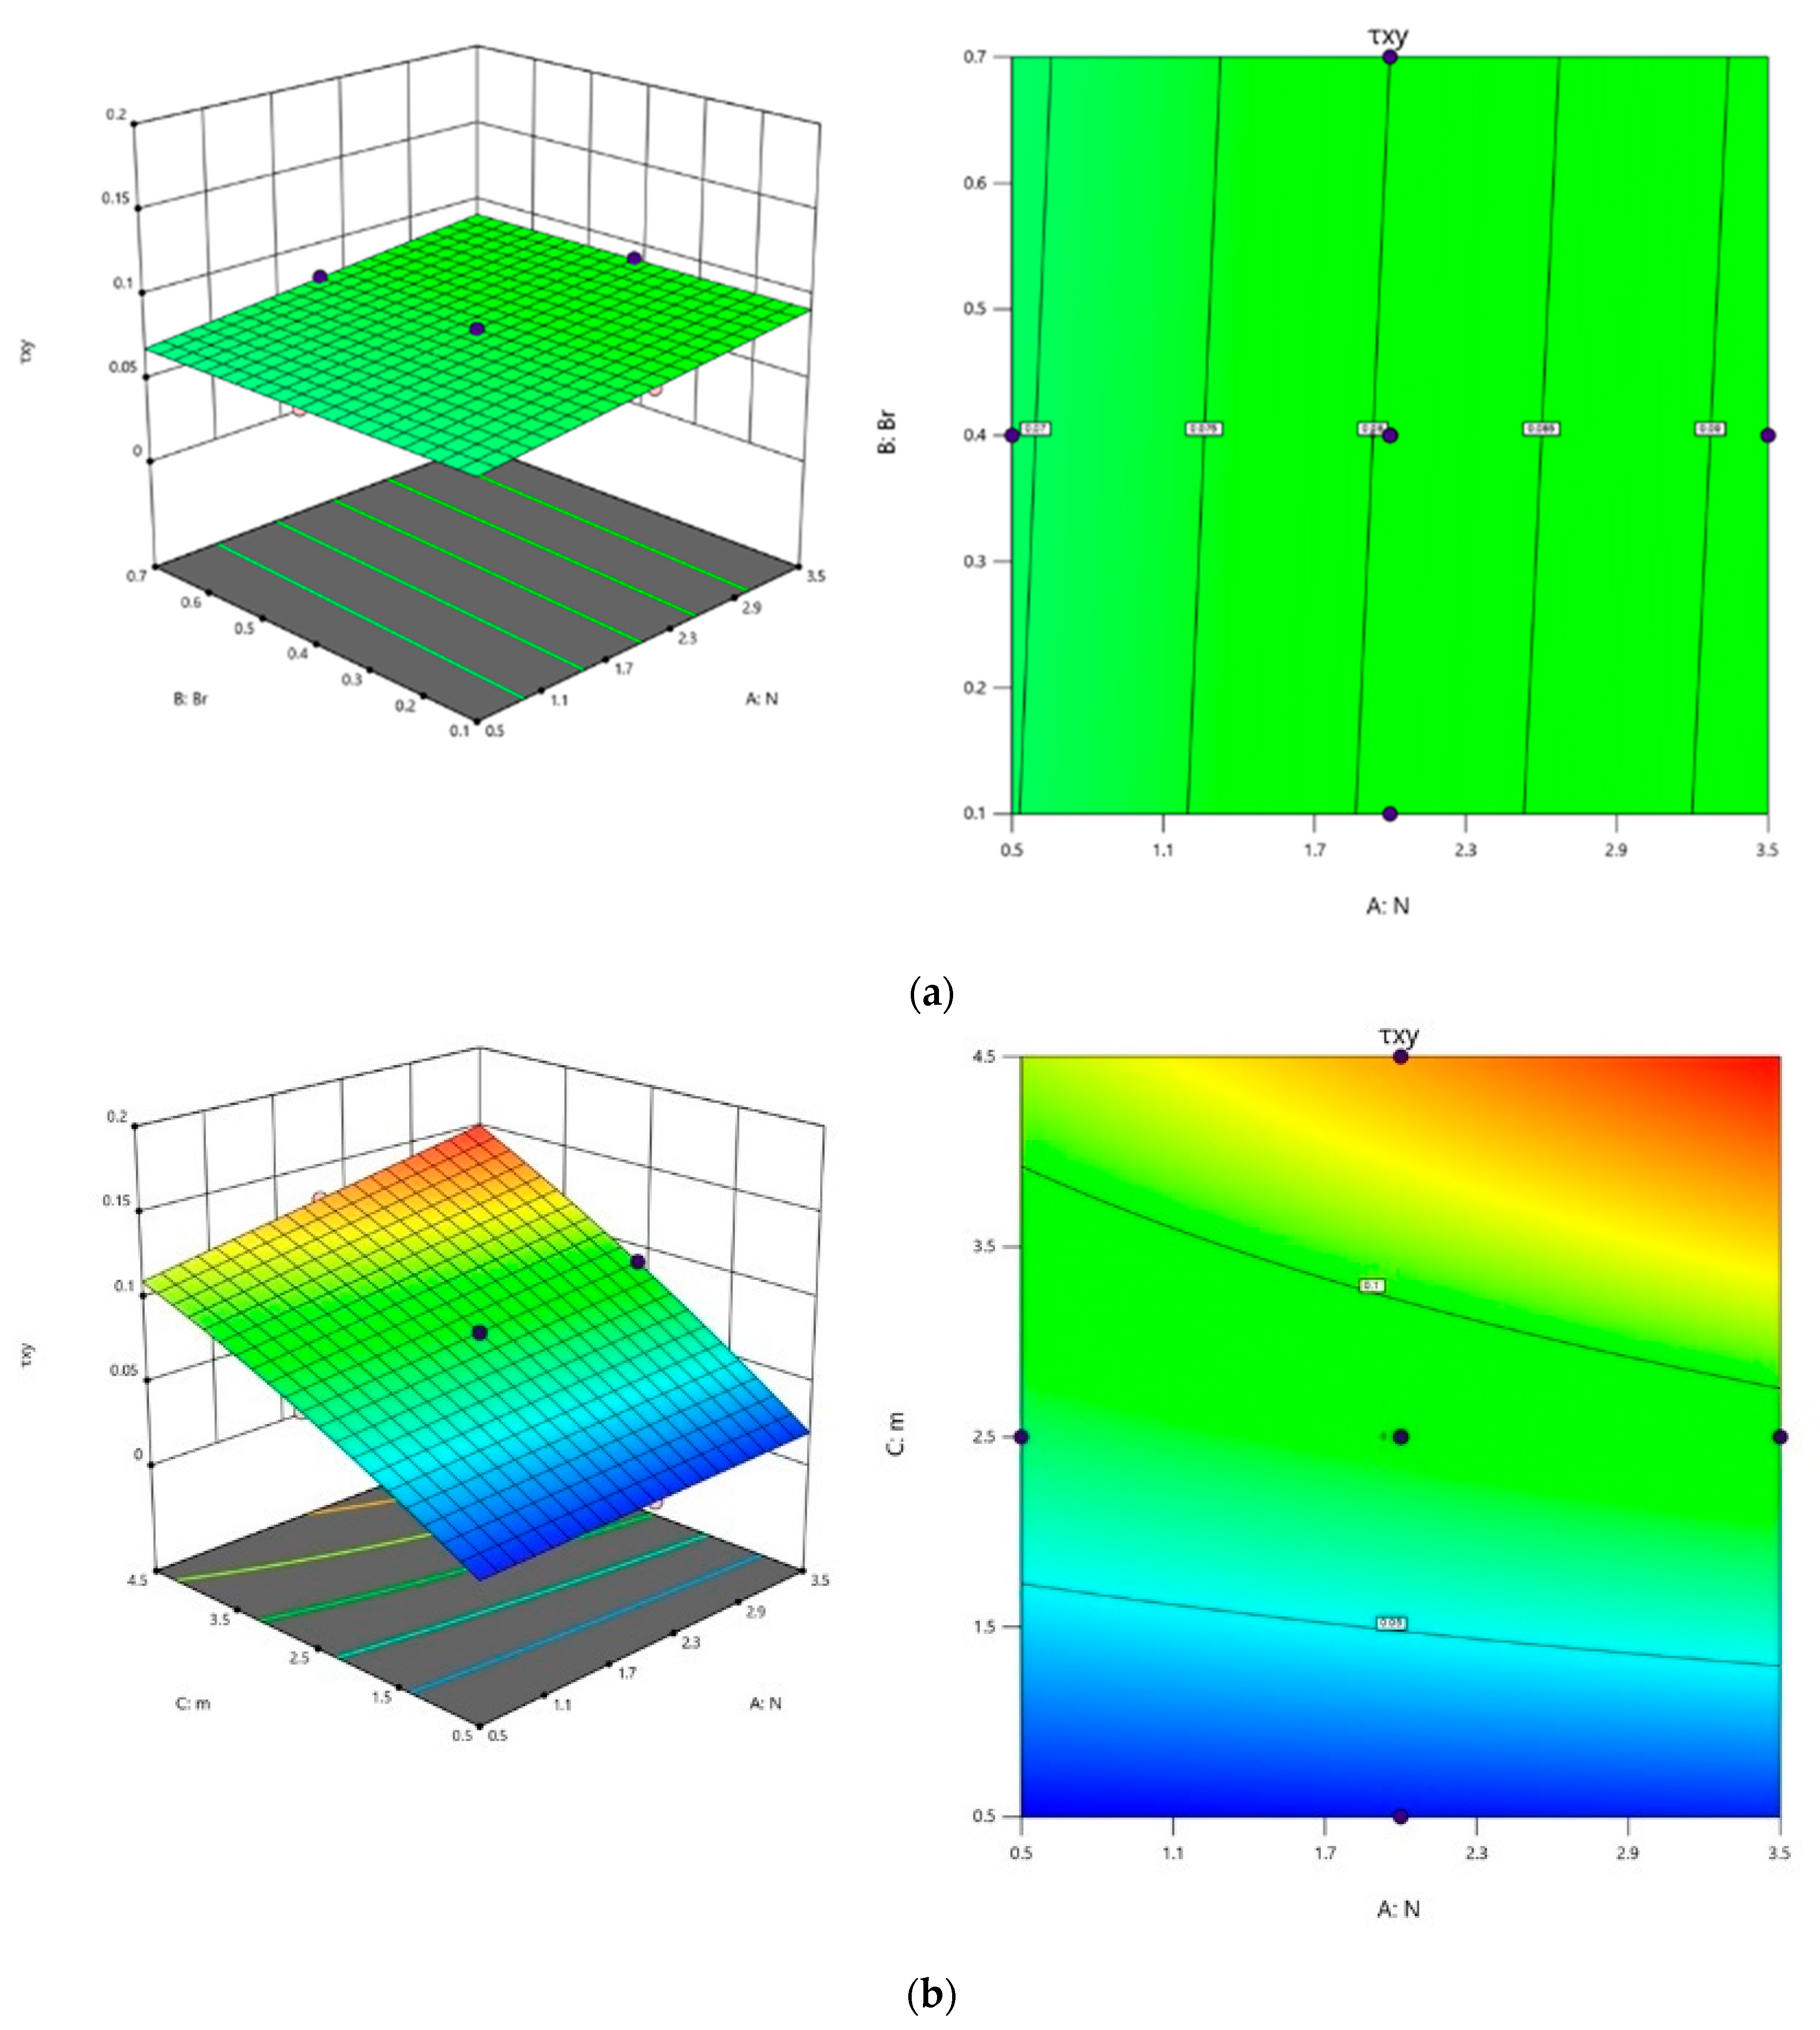
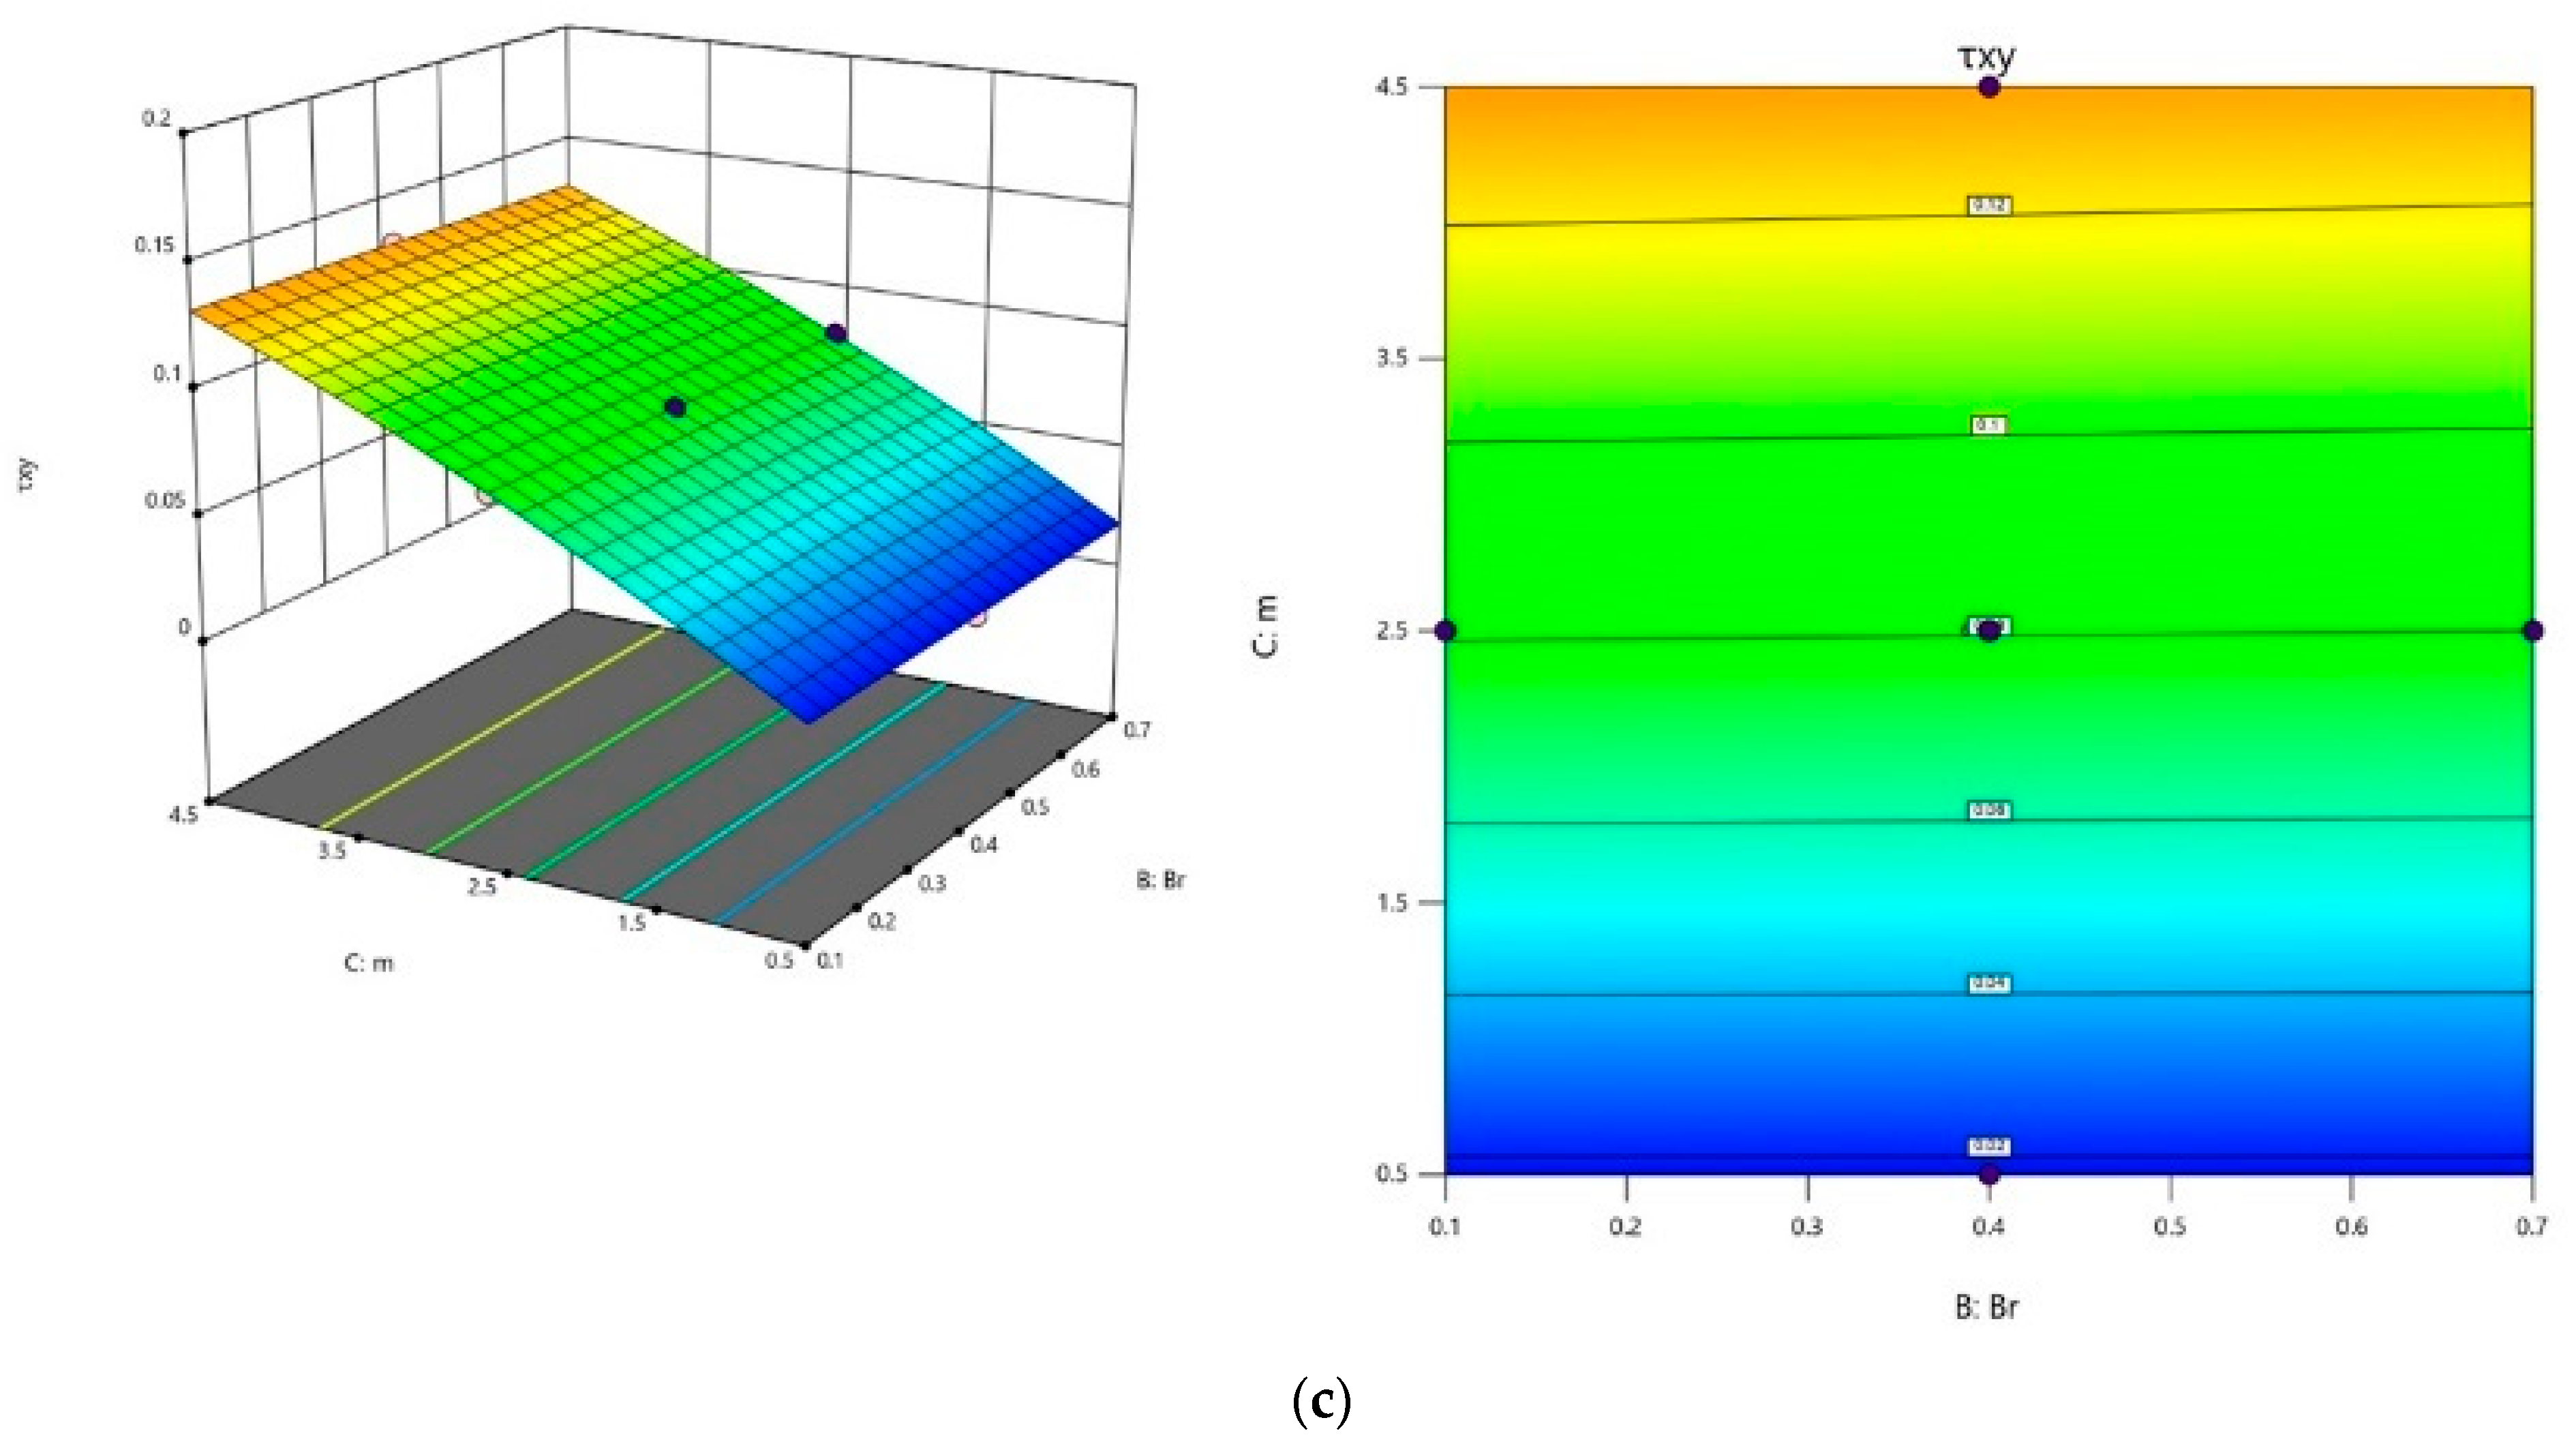
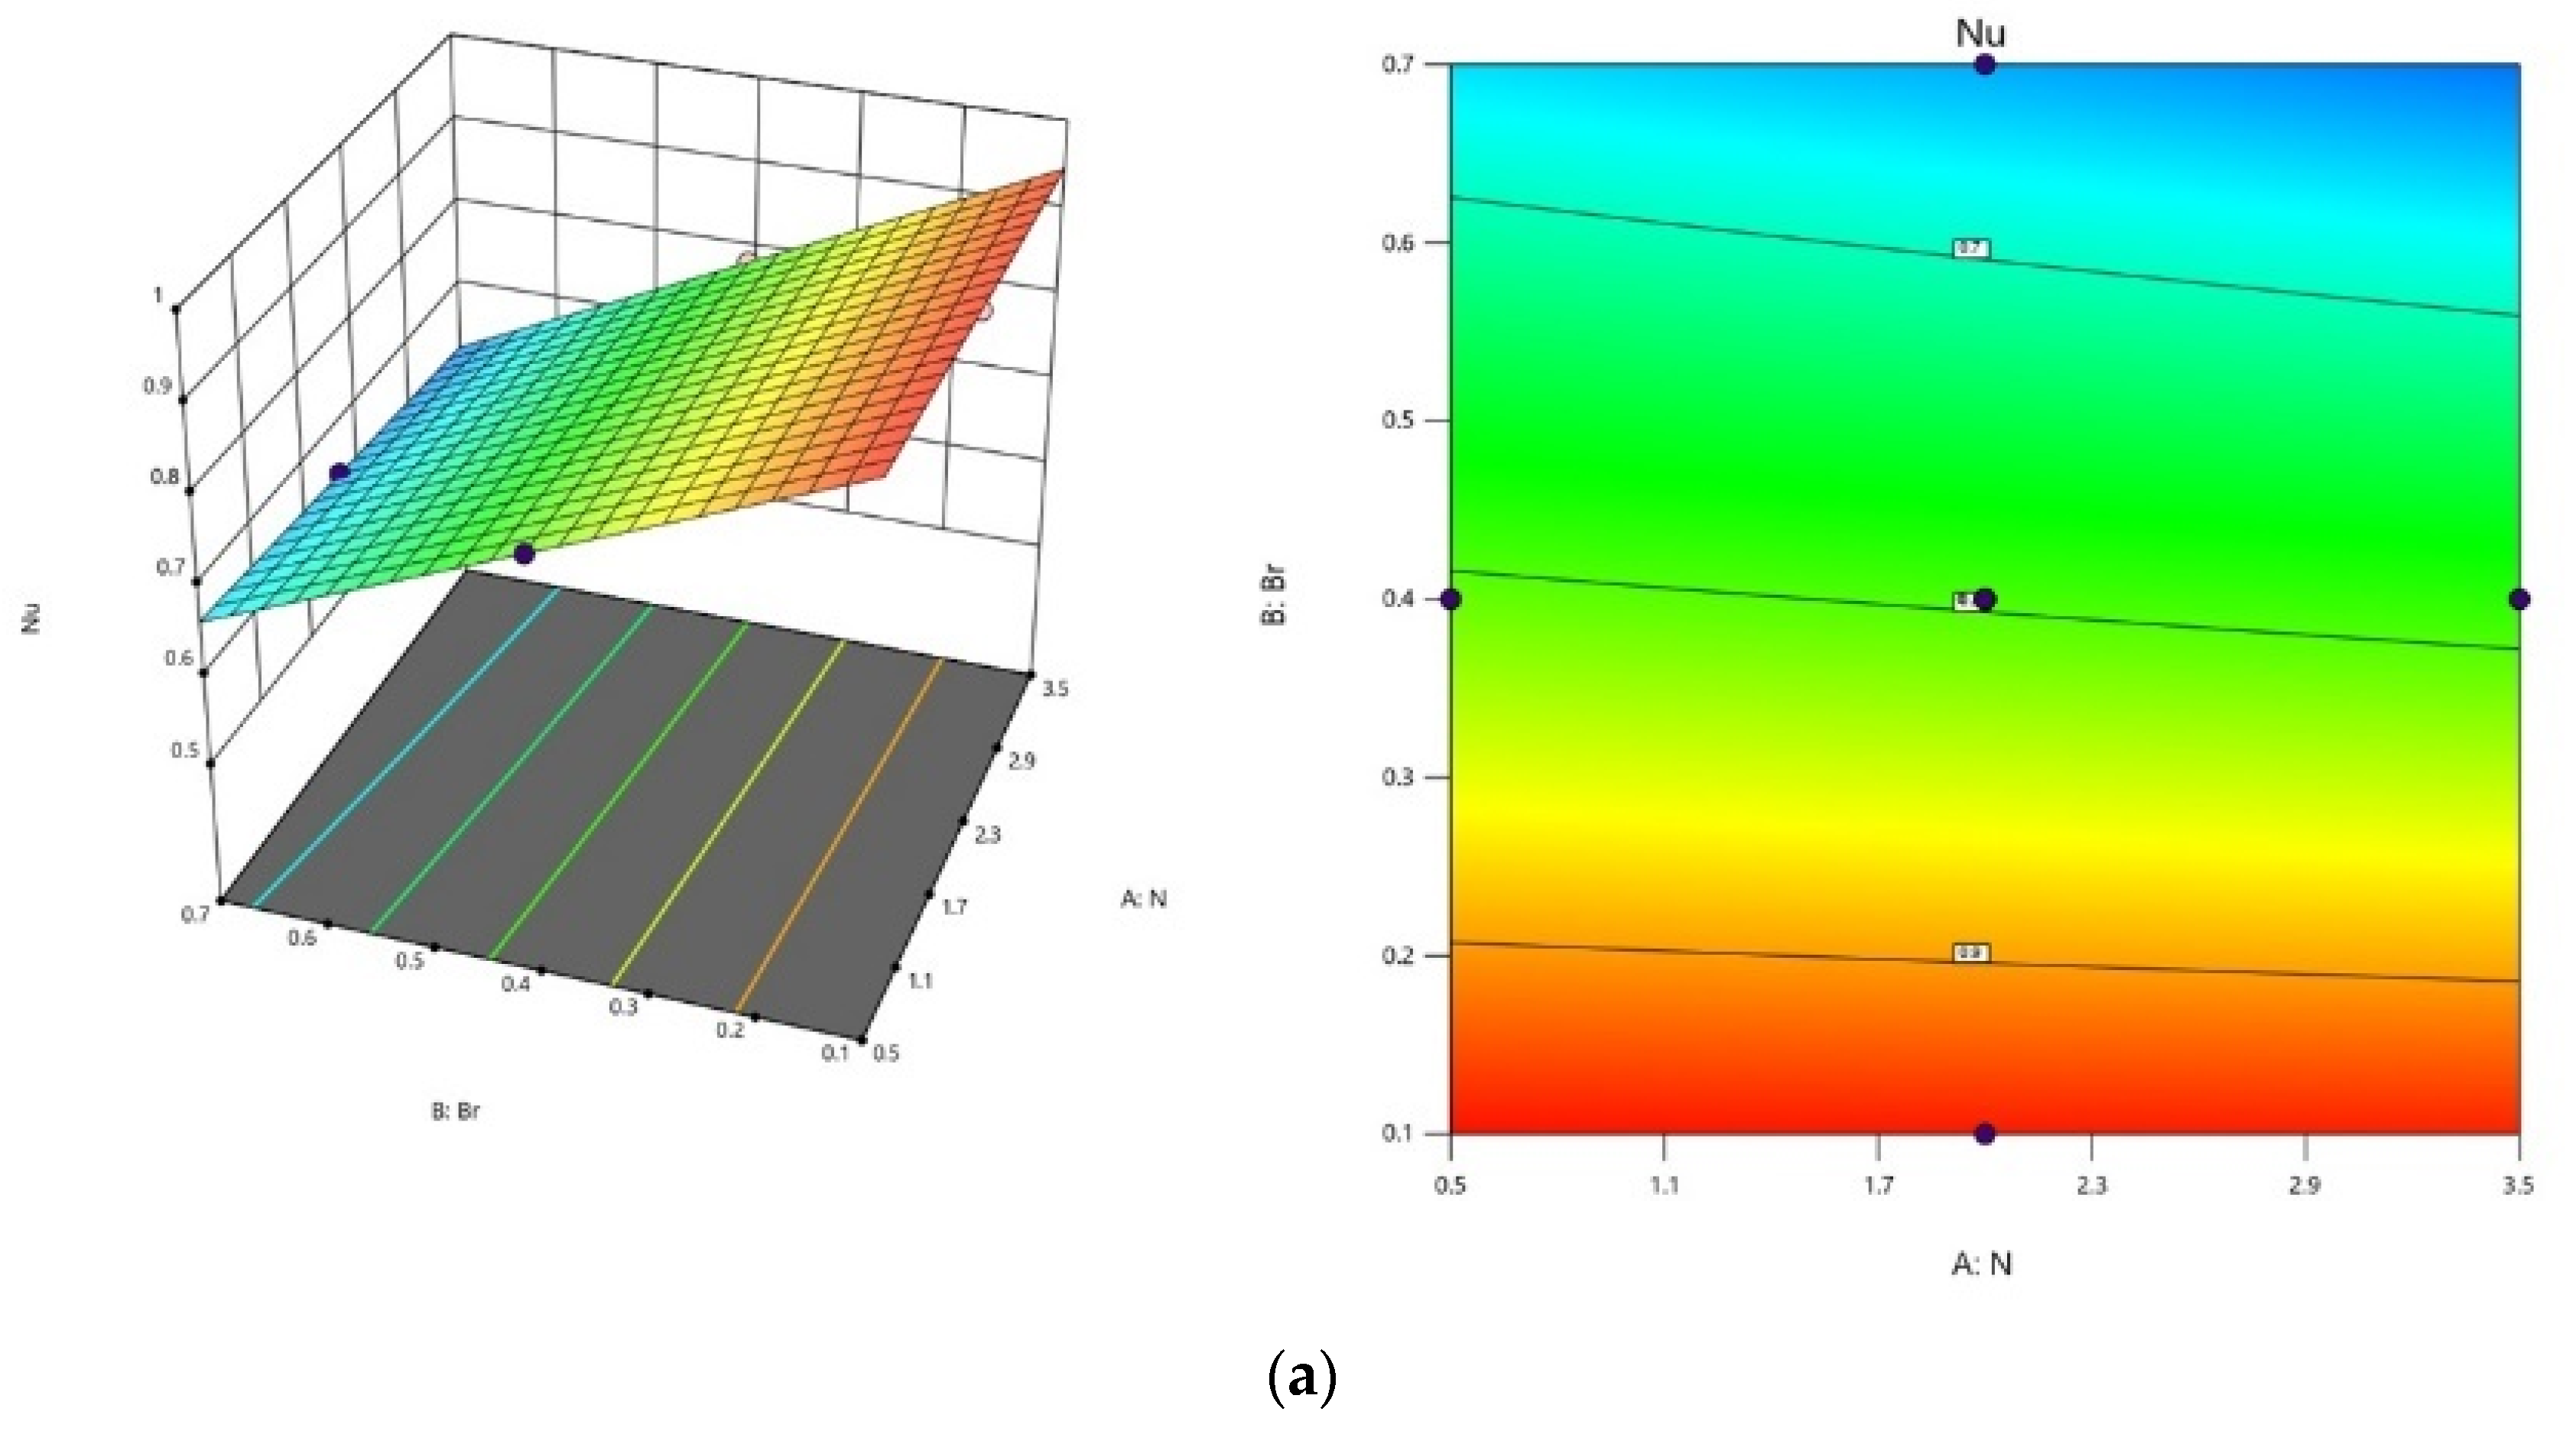
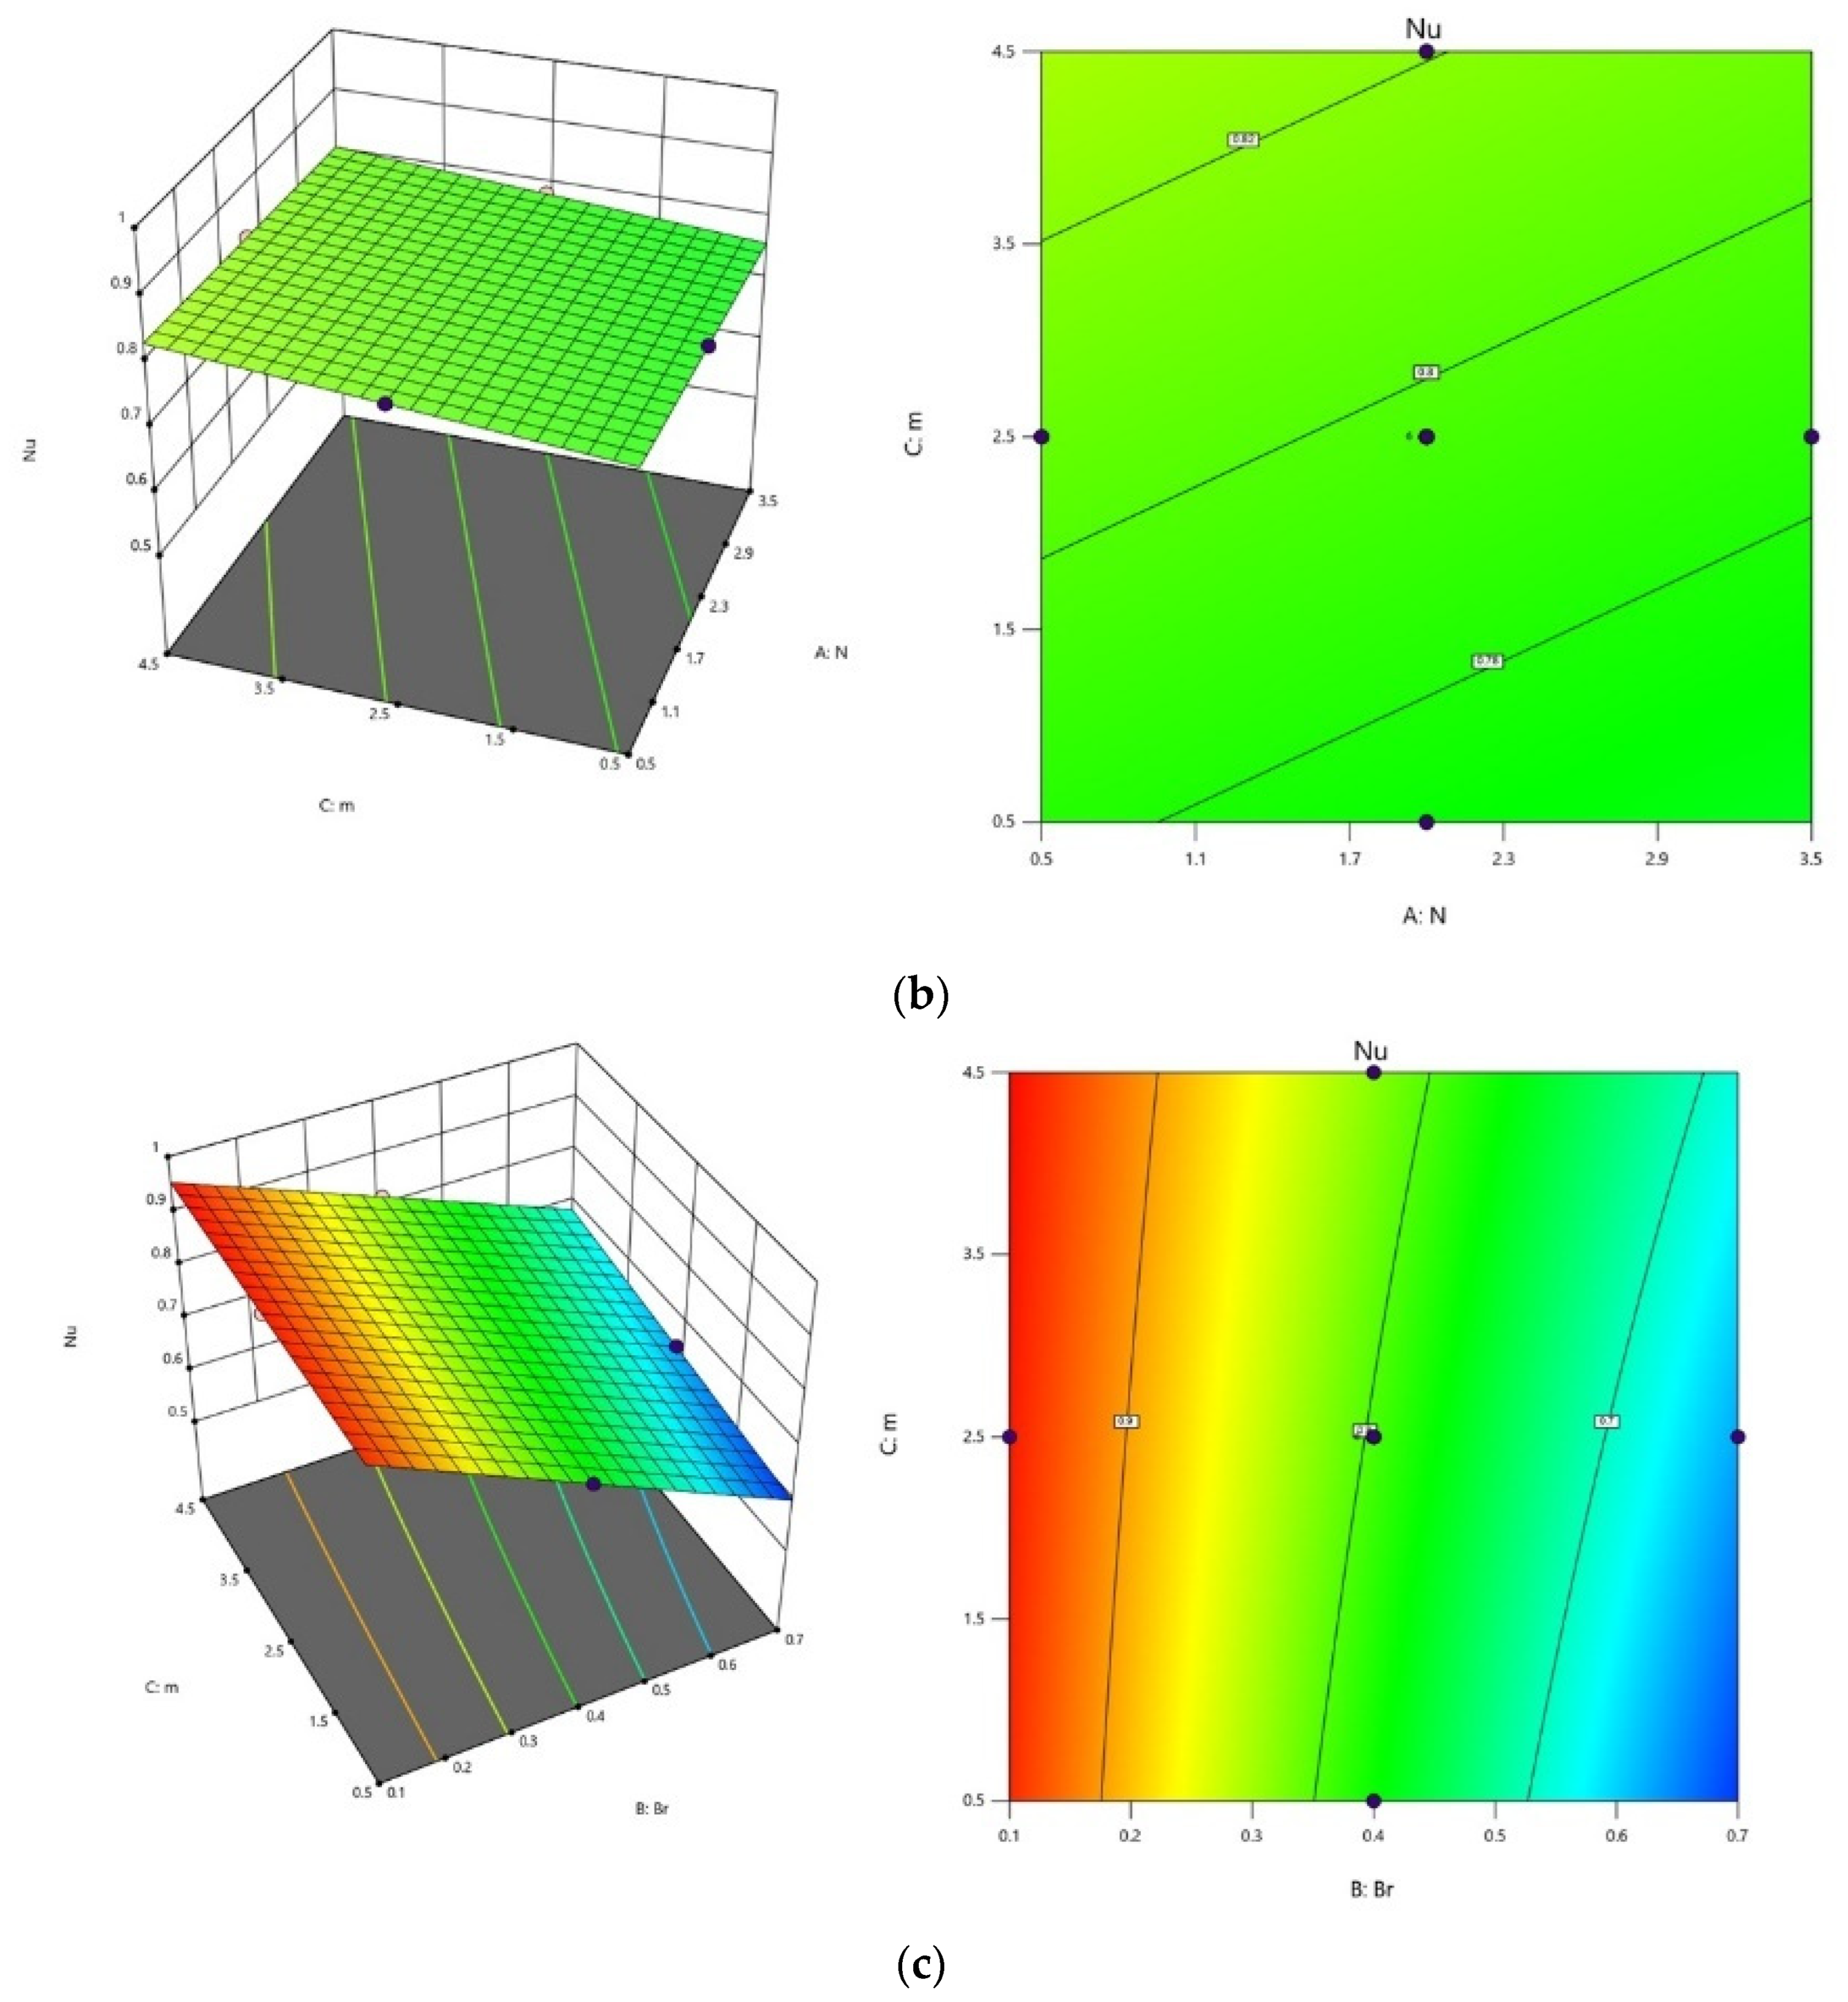
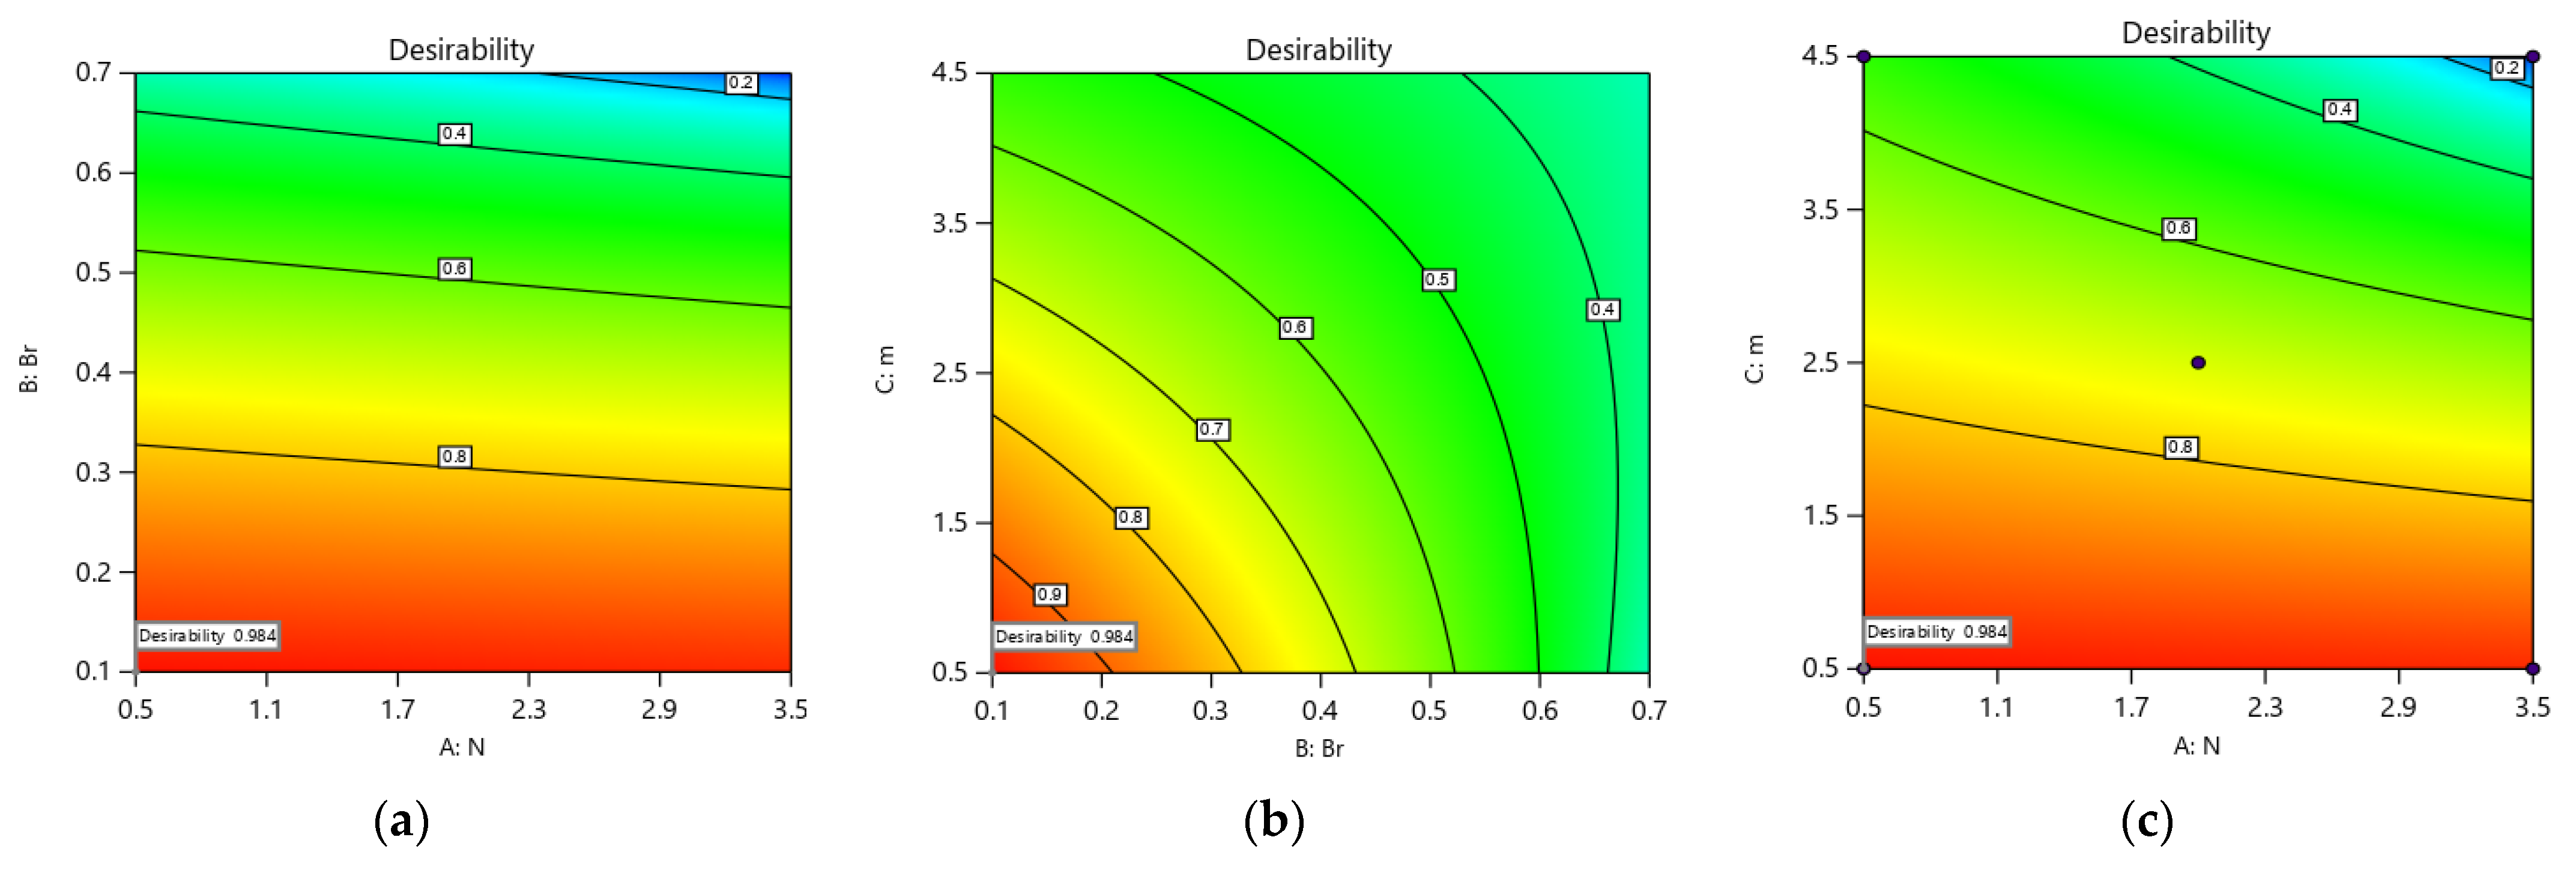
5.1. Contour and Surface Plots ( and )
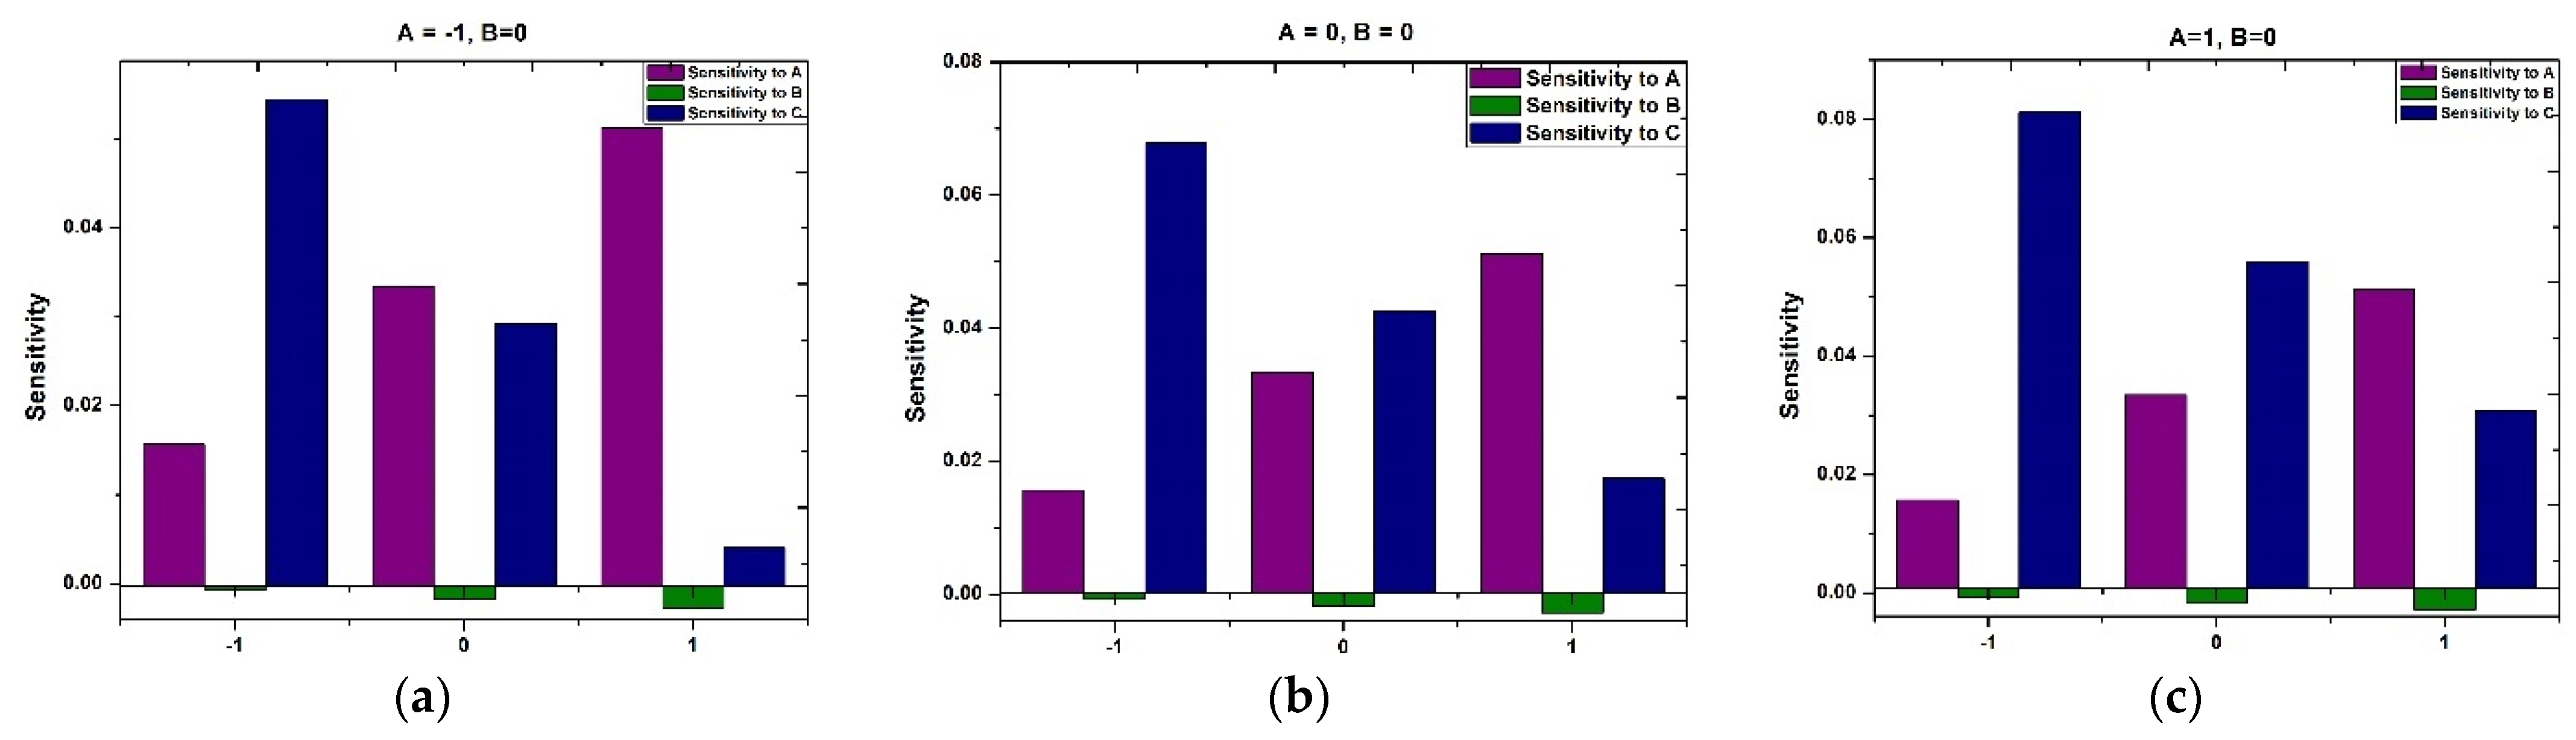
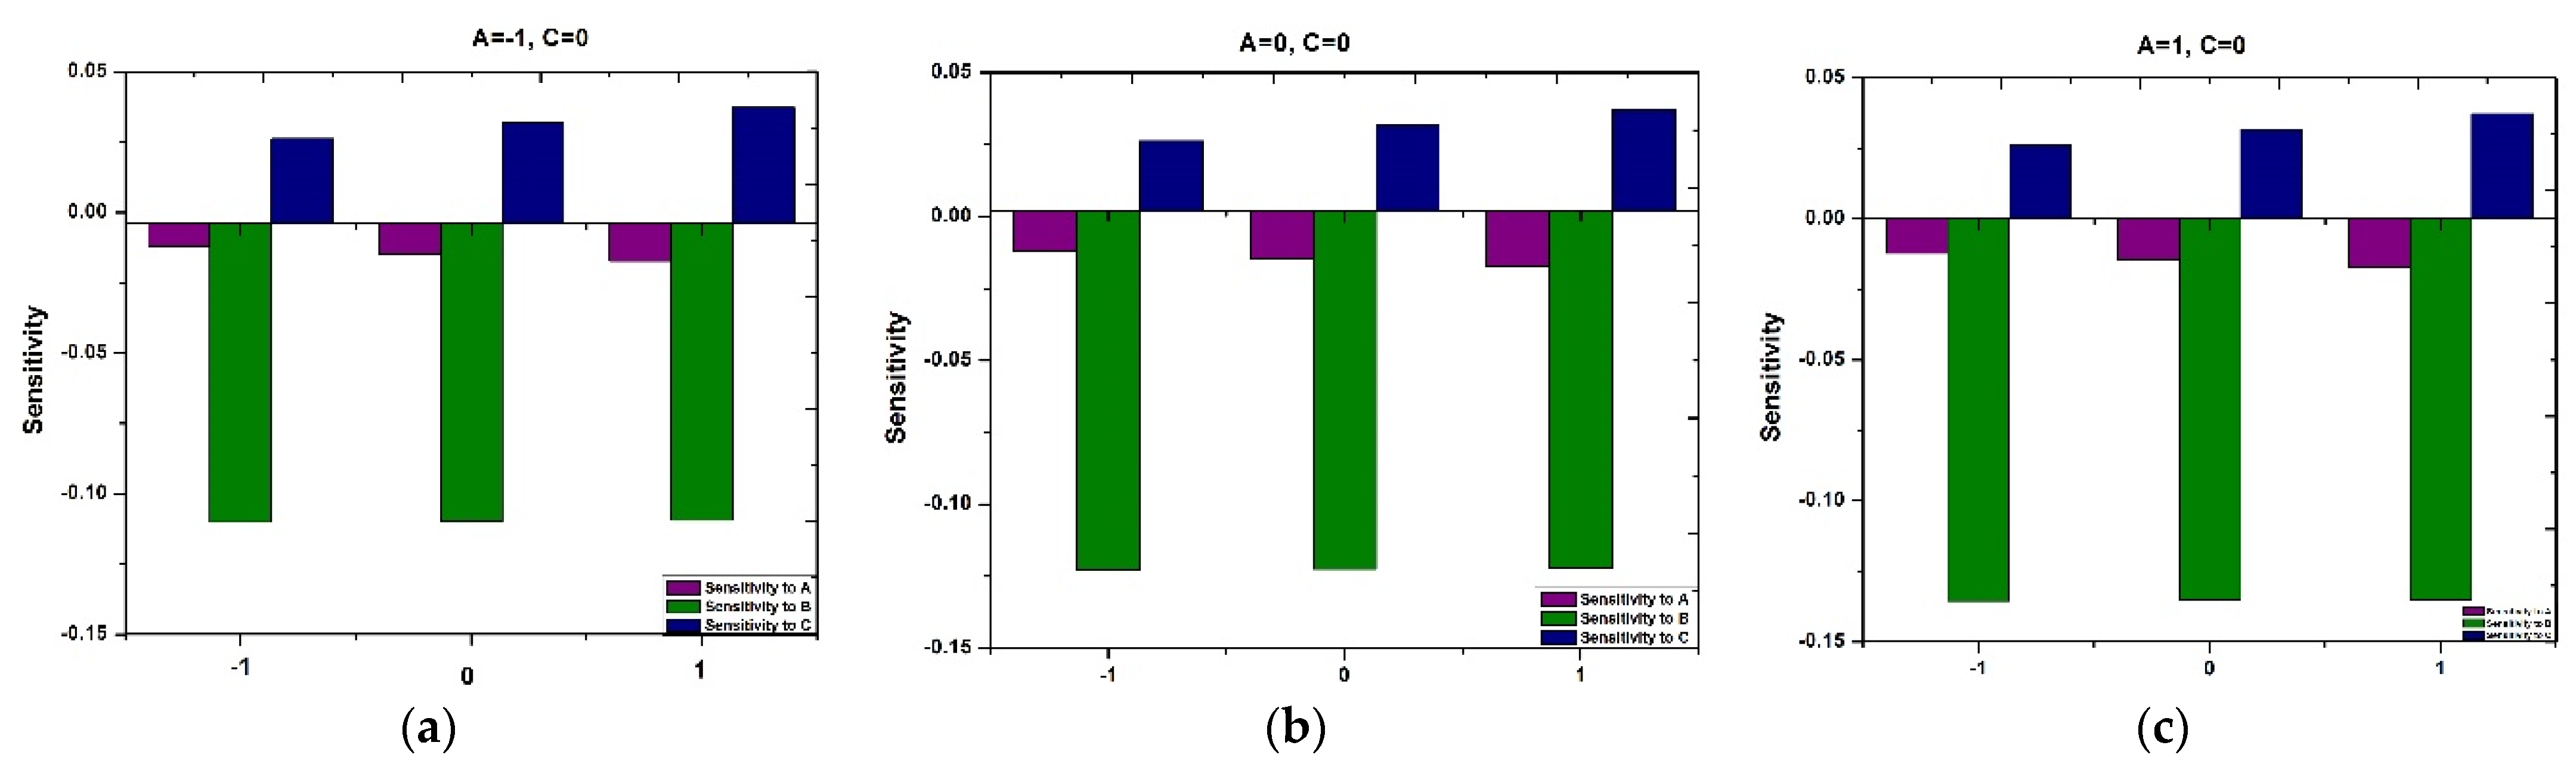
5.2. Sensitivity Analysis
5.3. Multi-Objective Optimization
6. Conclusions
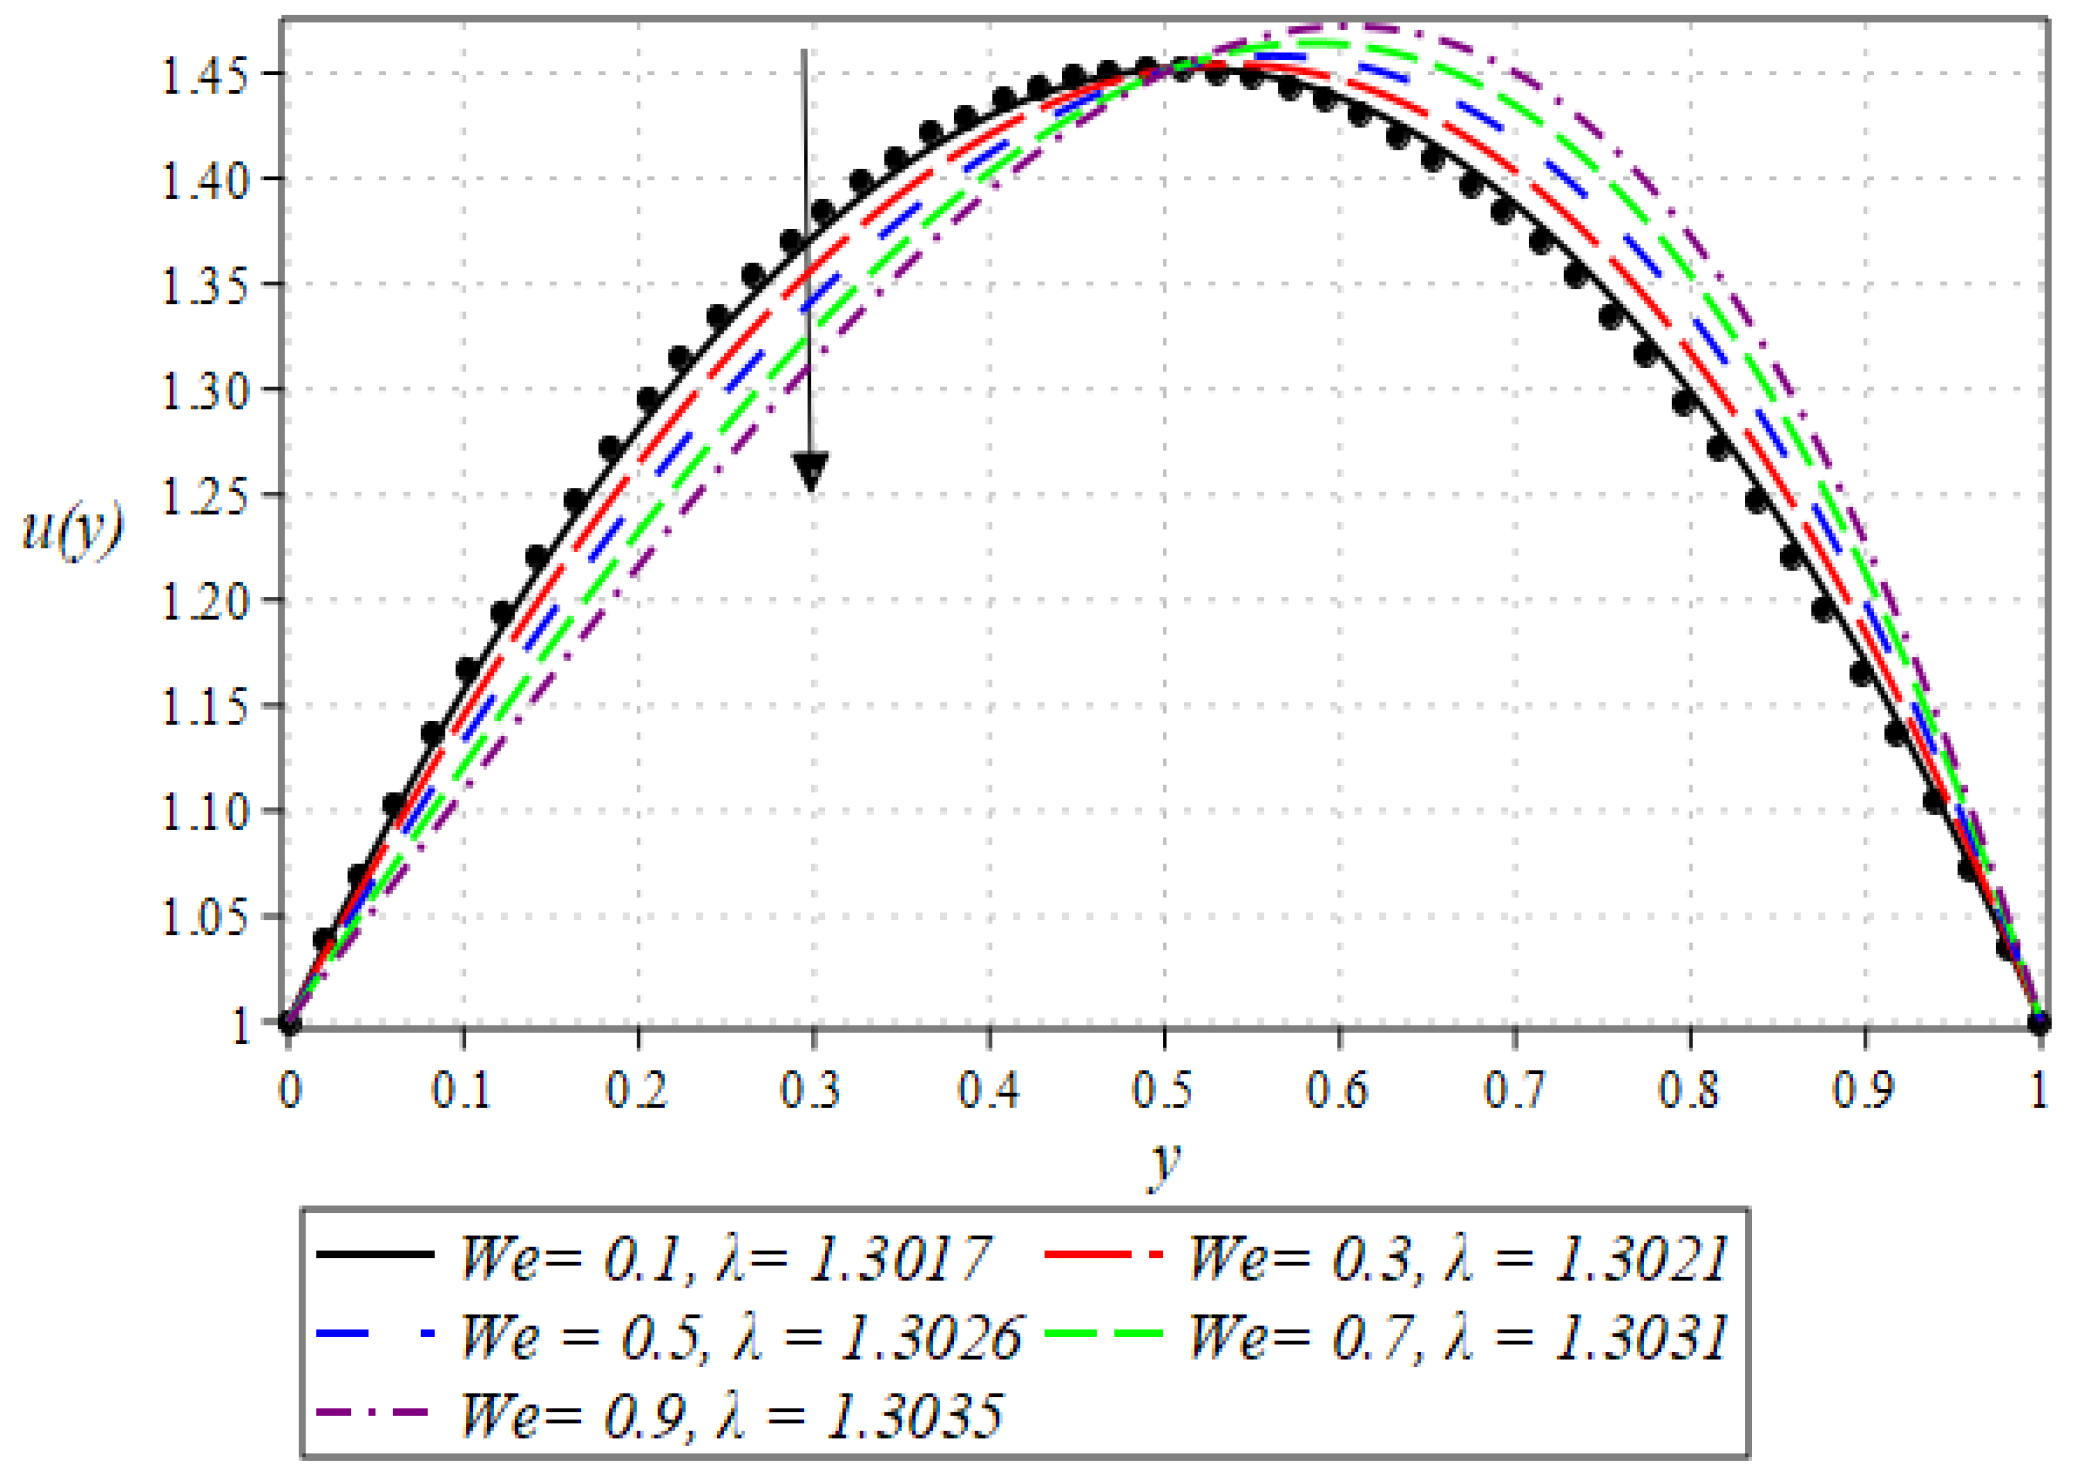
- The velocity profile has a decreasing trend for the increasing values of and , whereas the opposite trend was witnessed for increasing values of and .
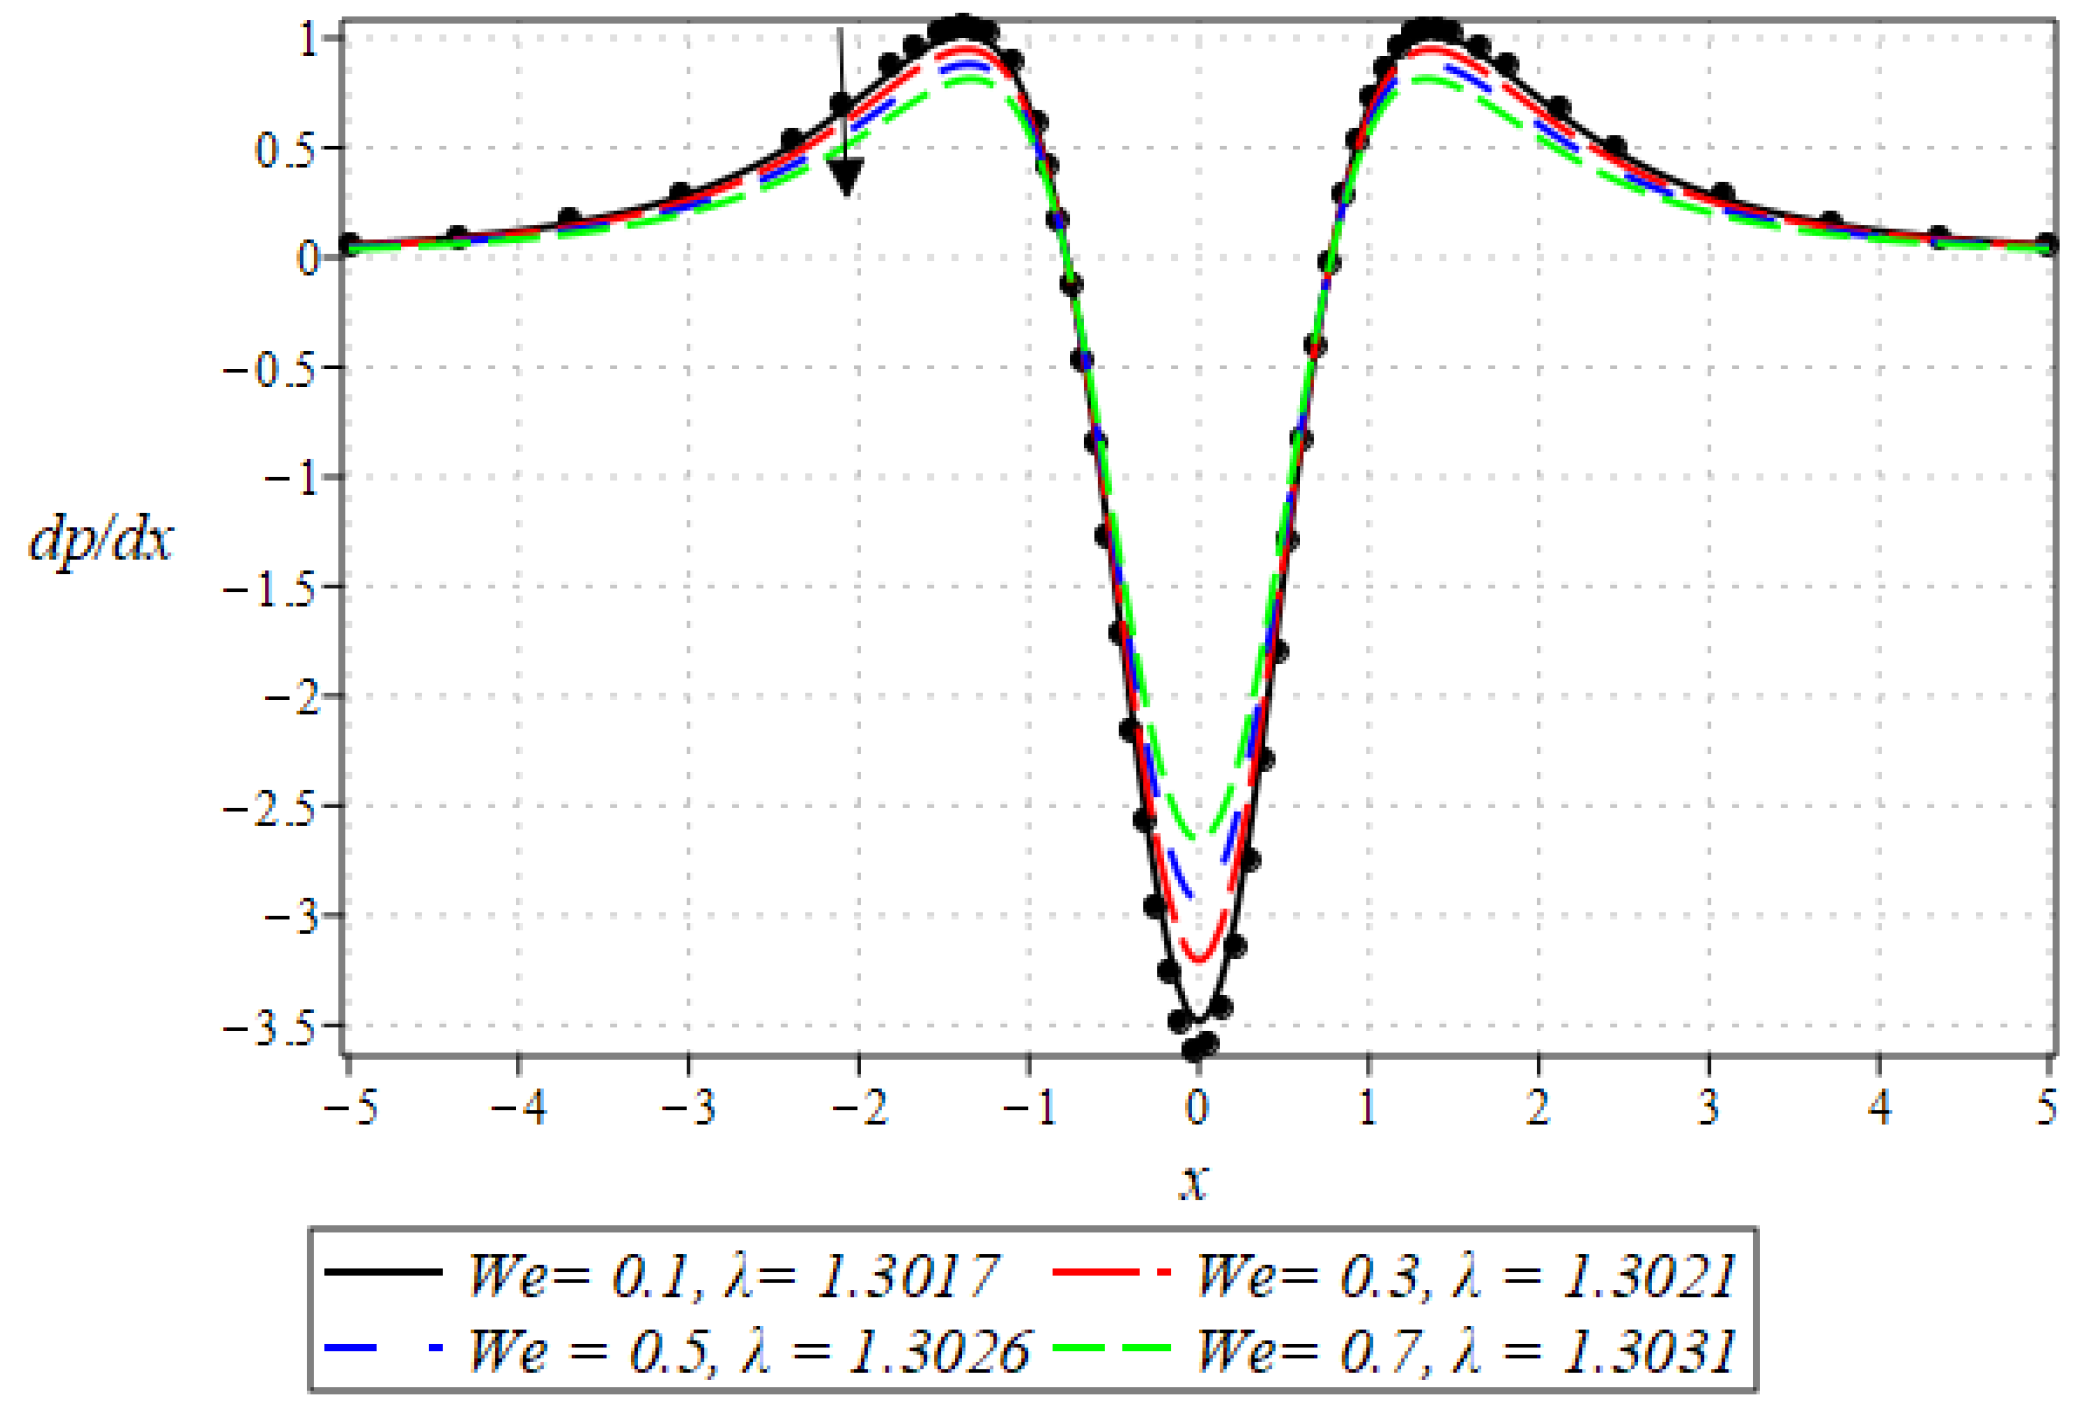
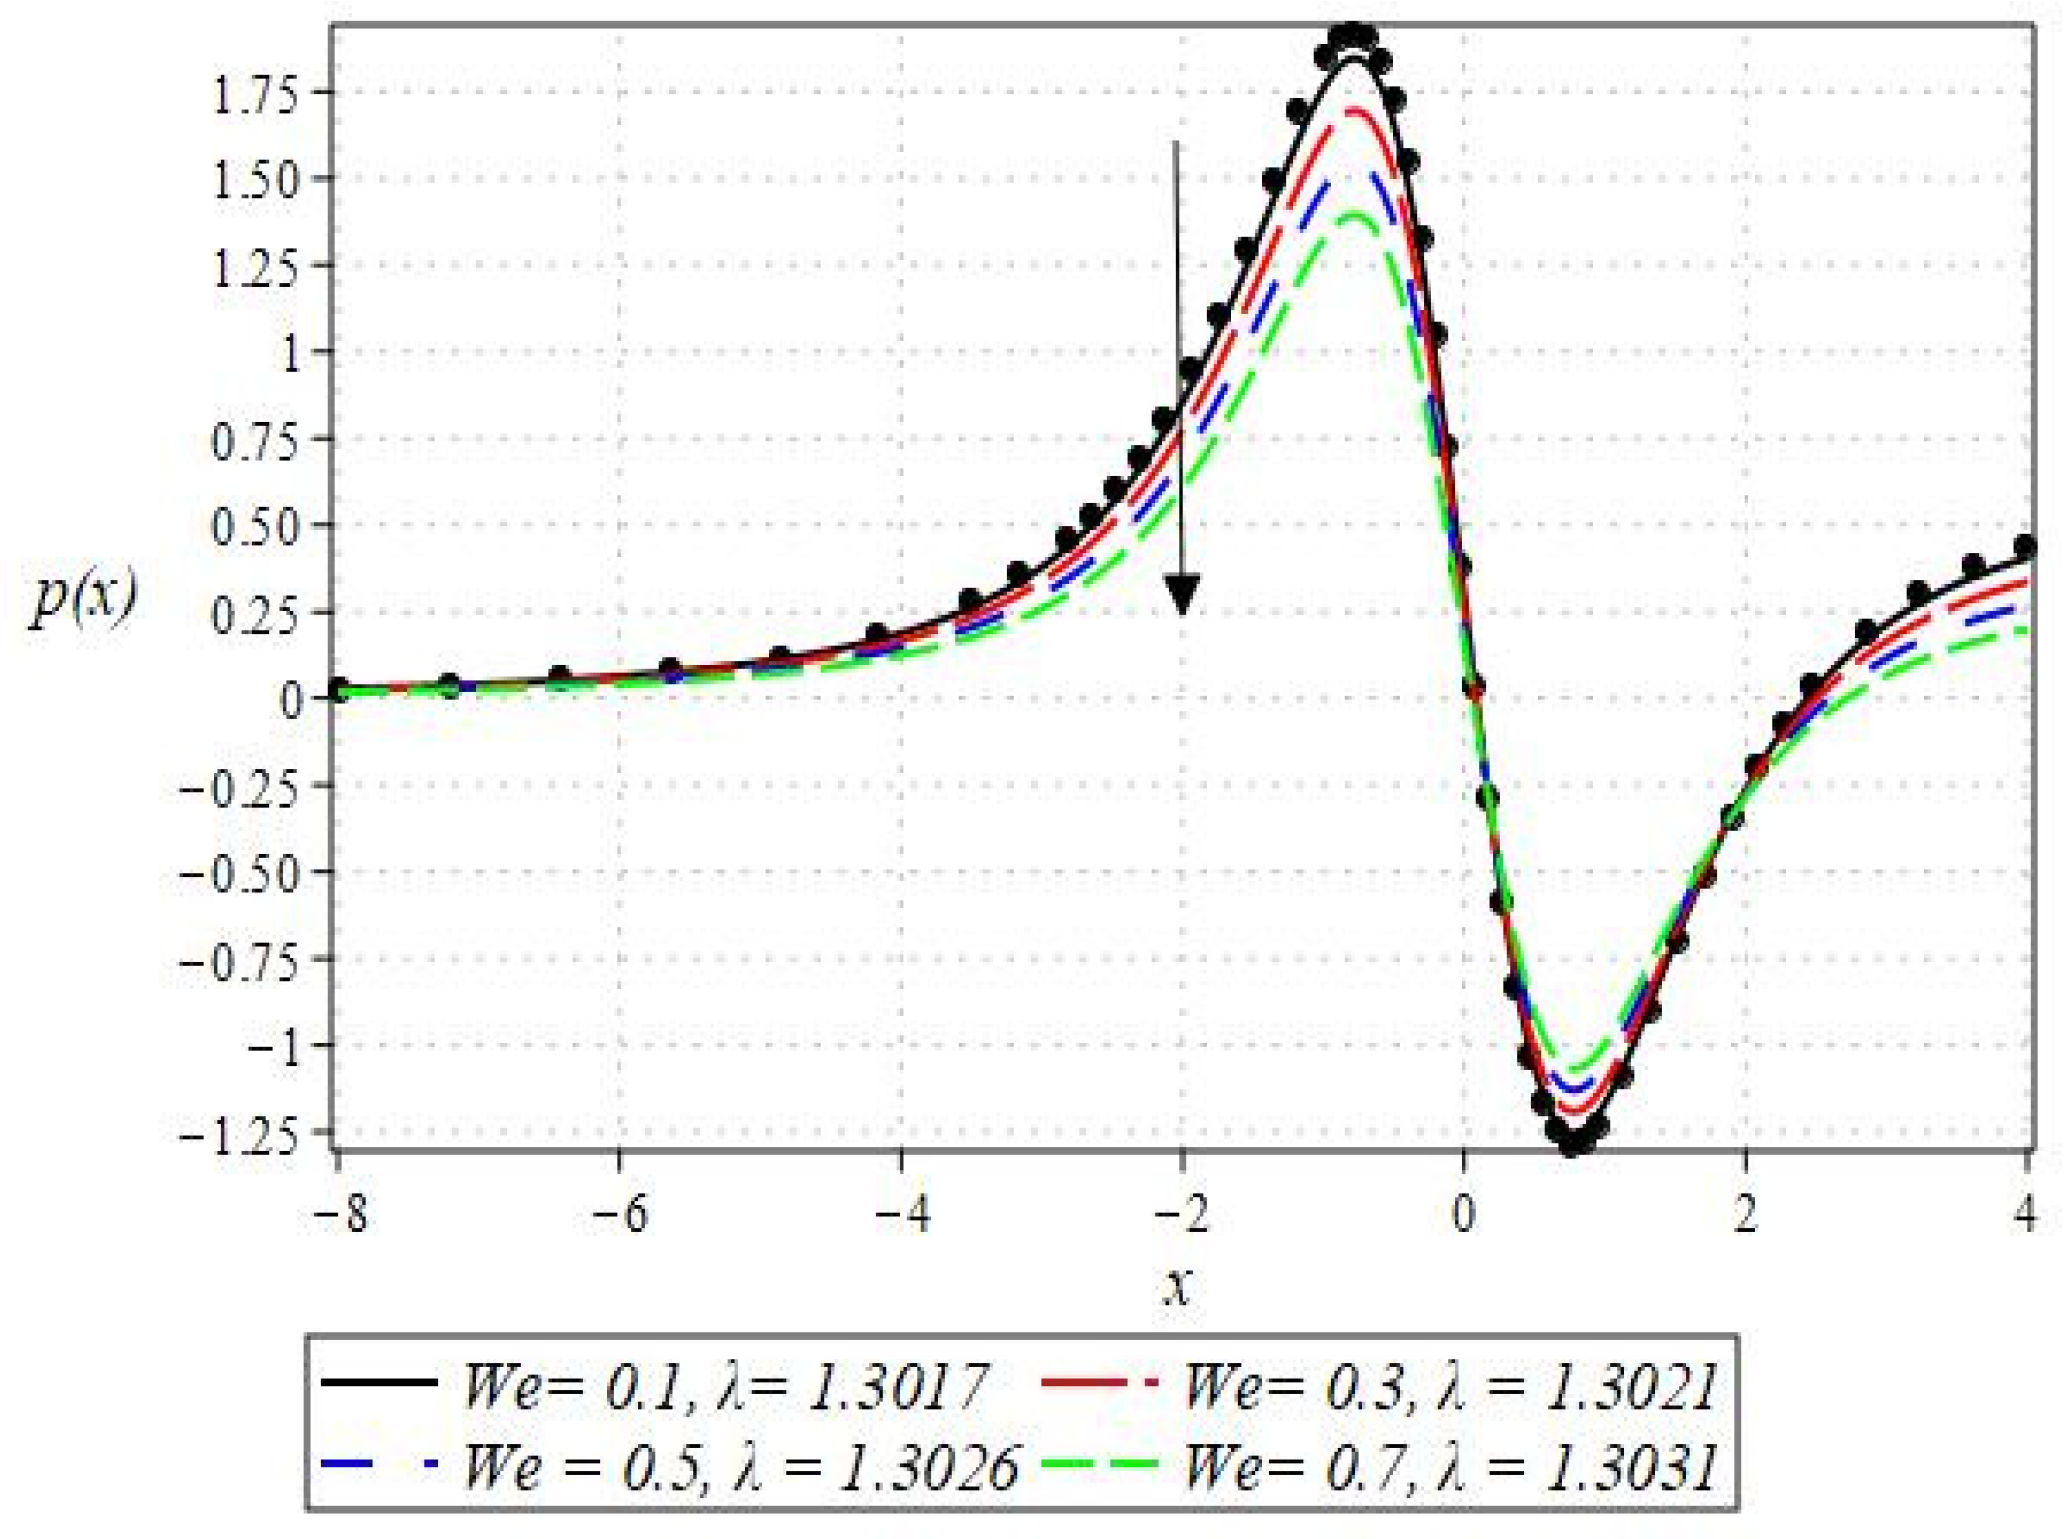
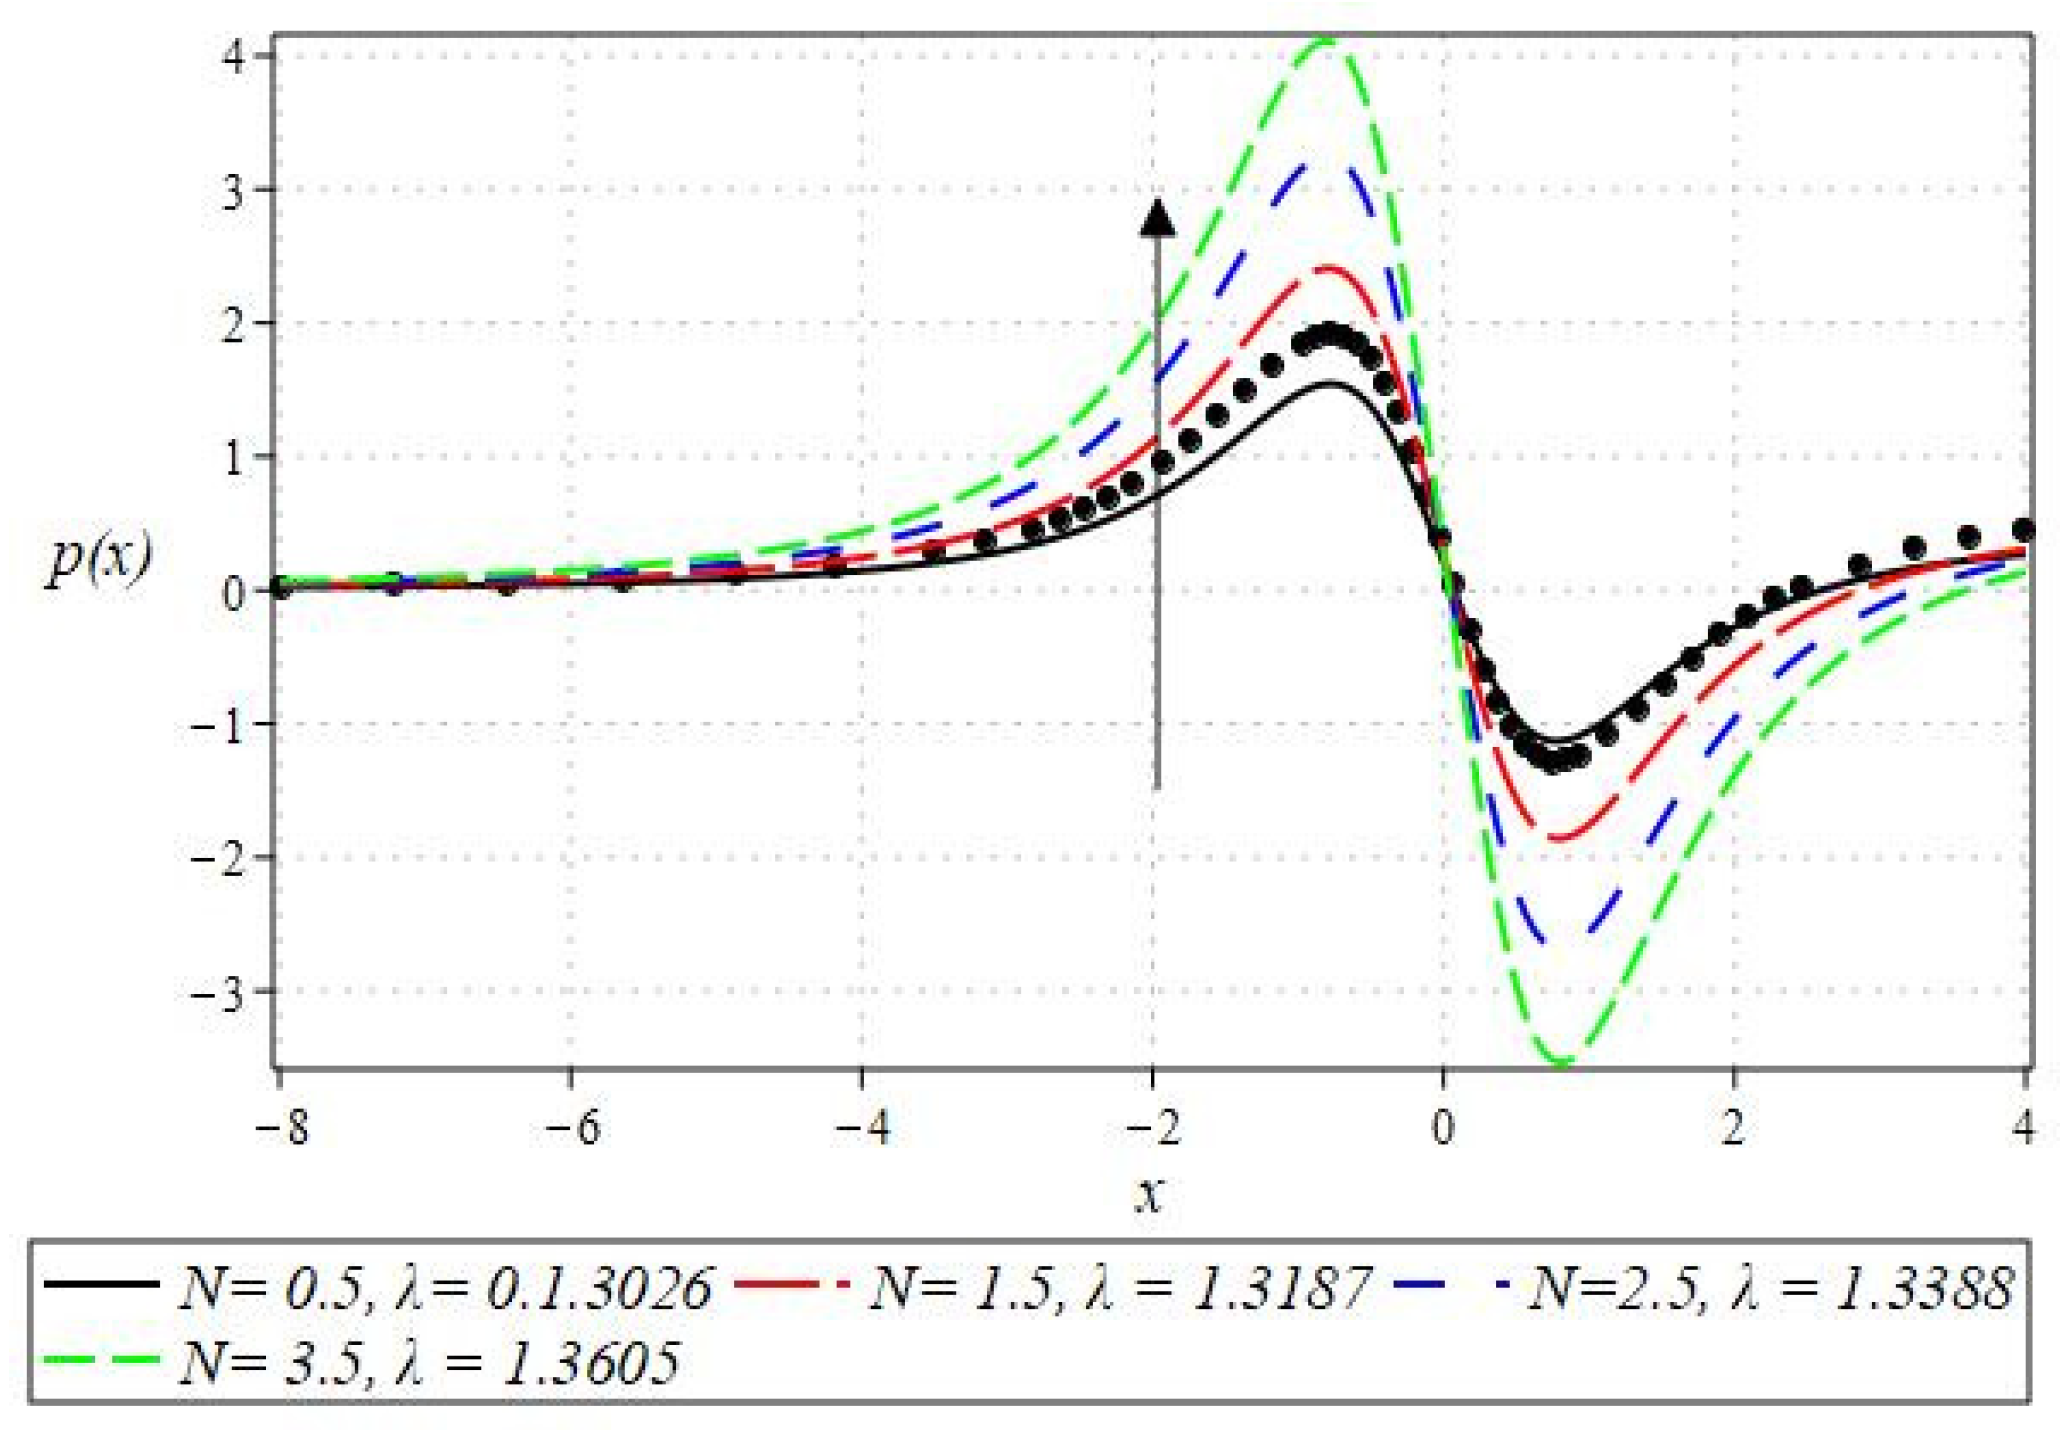
- A decline in pressure gradient and pressure profile can be noticed by increasing , , and , whereas opposite behavior can be witnessed for the increasing value of .
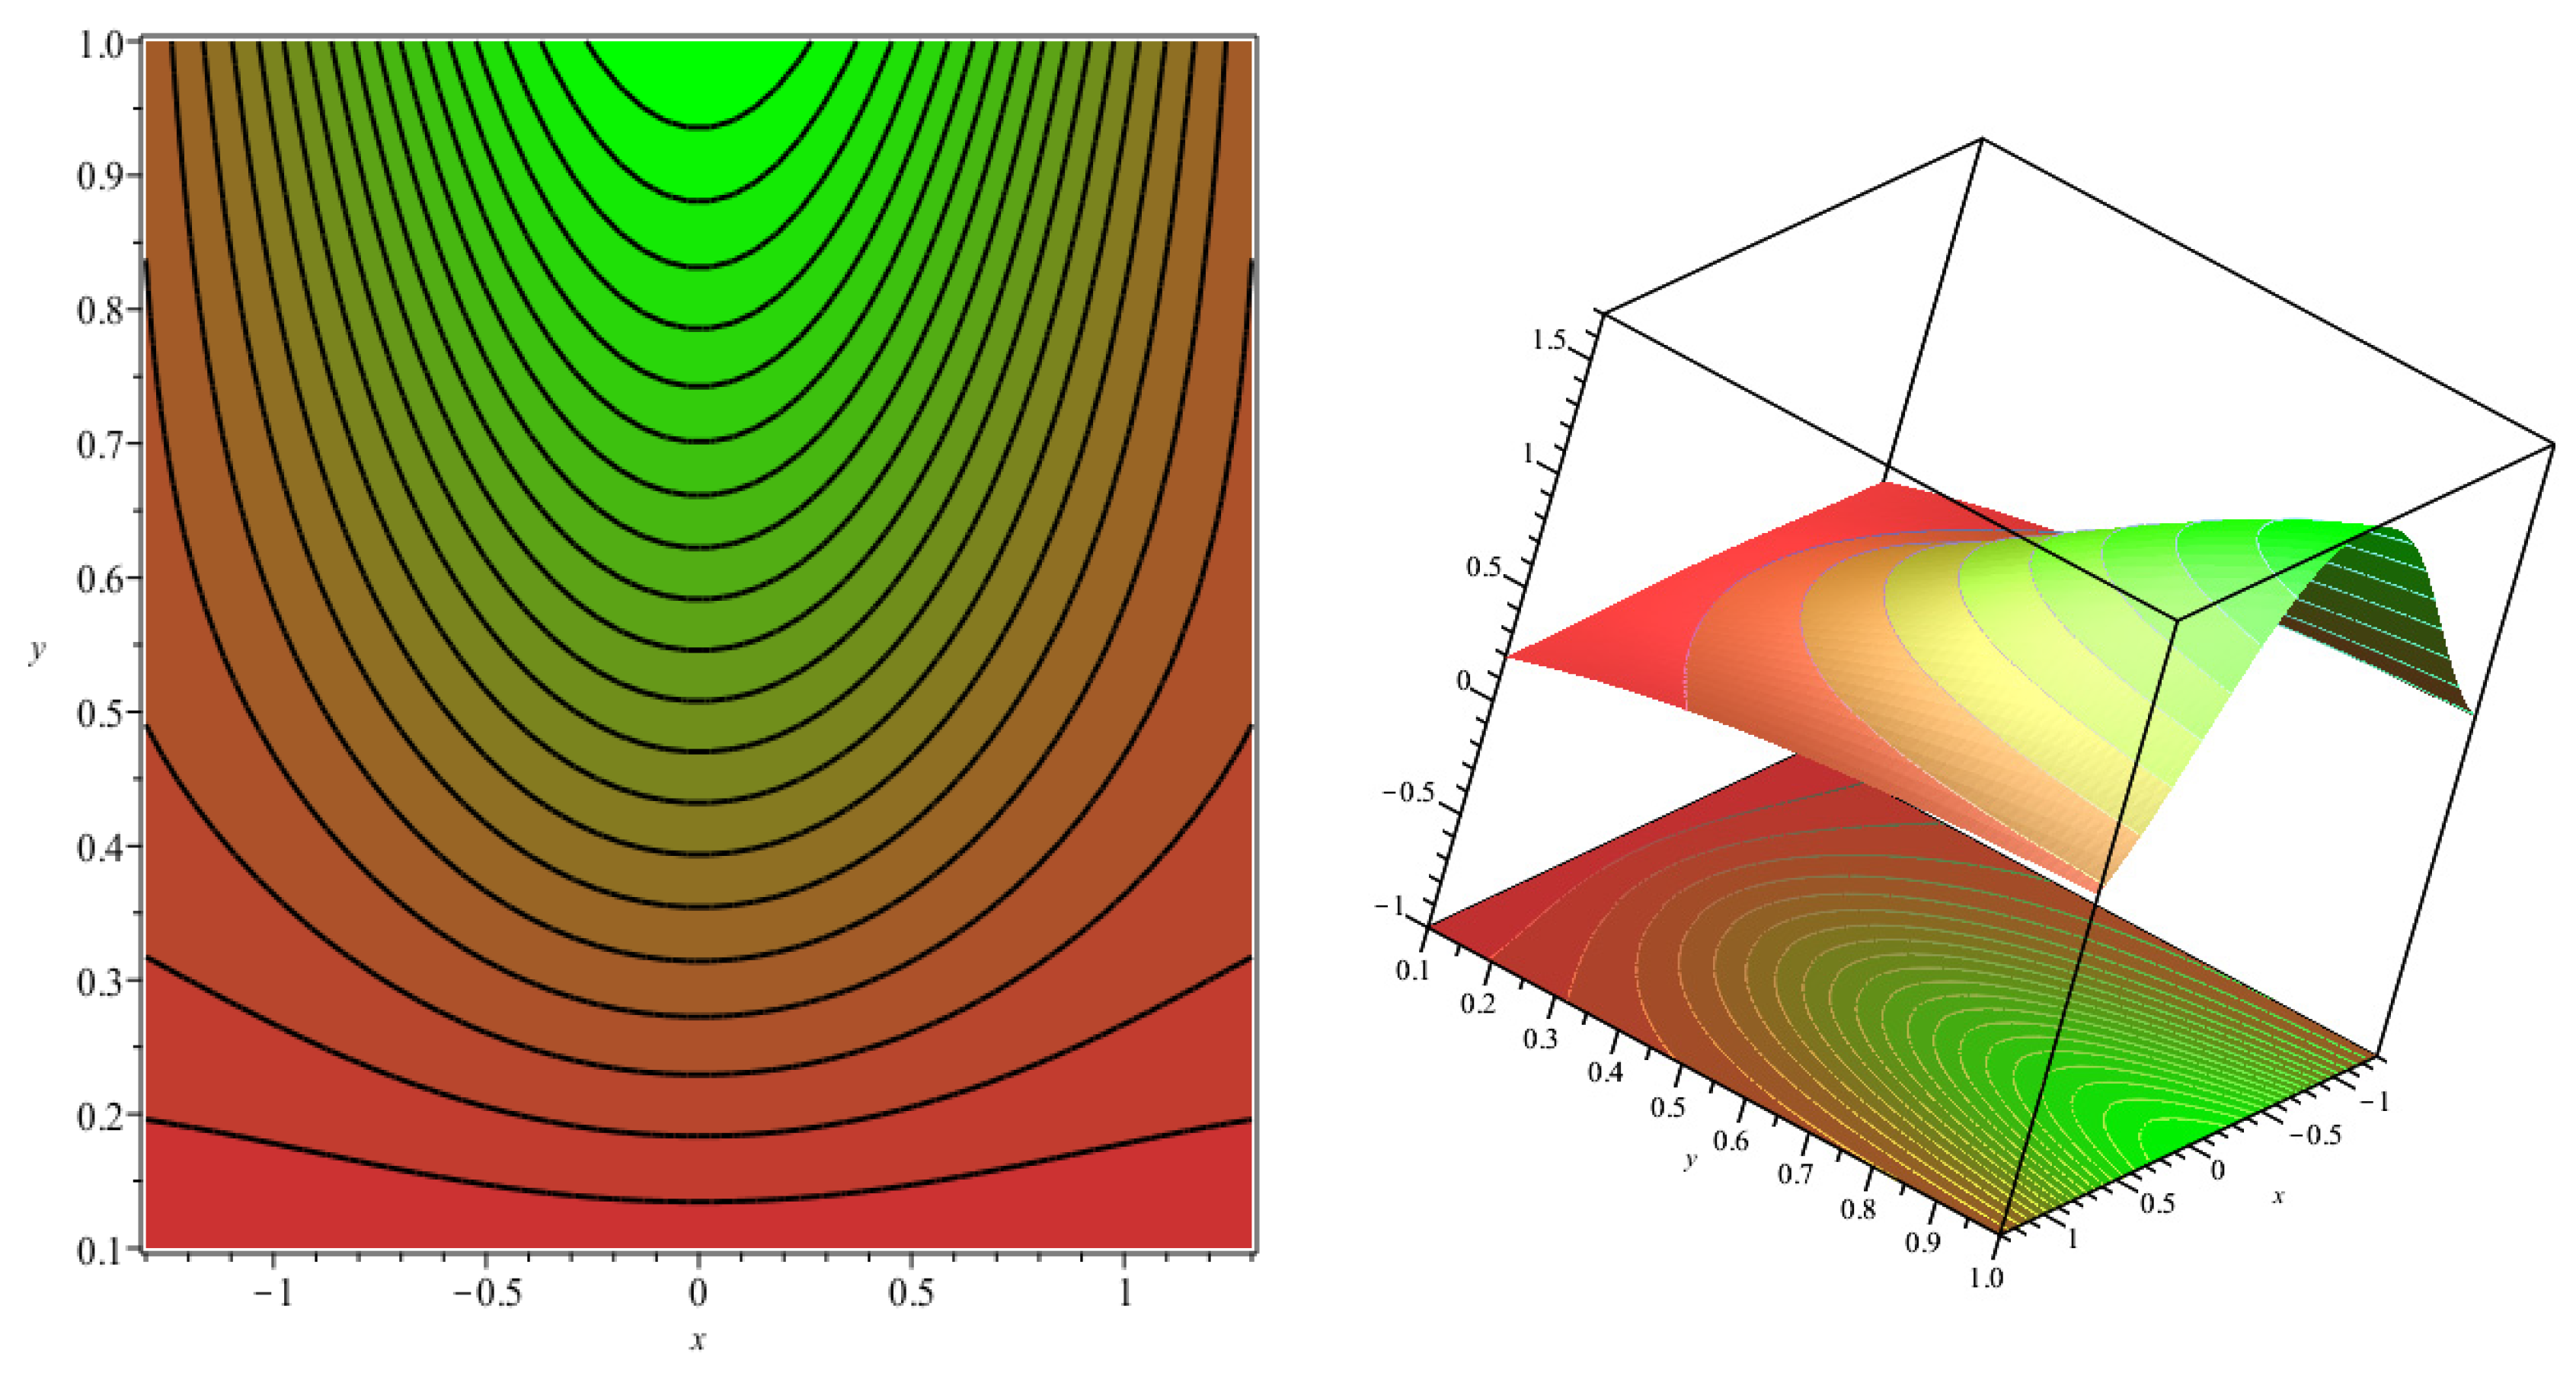
- The streamline plot shows a symmetrical distribution about the vertical axis and indicates a balanced flow on either side of the centerline.
- From sensitivity analysis, it was observed that the sensitivity of is positive for and . Also, the sensitivity of is positive for .
- From RSM, it is possible to achieve maximum heat transfer rate and minimum shear stress rate concurrently when , and with a desirability of 0.984.
- The Newtonian solution is achieved when the dimensionless parameter becomes zero [1].
Author Contributions
Funding
Data Availability Statement
Acknowledgments
Conflicts of Interest
Nomenclature
| Velocity of the roll | |
| Nip region | |
| Coating thickness | |
| Roll radius | |
| Fluid density | |
| Perturb parameter | |
| viscosity variation parameters | |
| Flow rate | |
| The material constant of the Powell–Eyring fluid model | |
| The material constant of the Powell–Eyring fluid model | |
| The material constant of the Powell–Eyring fluid model | |
| Dimensionless number which is square root of ratio of to |
References
- Greener, Y.; Middleman, S. A theory of roll coating of viscous and viscoelastic fluids. Polym. Eng. Sci. 1975, 15, 1–10. [Google Scholar] [CrossRef]
- Hintermaier, J.C.; White, R.E. The splitting of a water film between rotating rolls. Tappi J. 1965, 48, 617–625. [Google Scholar]
- Benkreira, H.; Edwards, M.; Wilkinson, W. Roll coating of purely viscous liquids. Chem. Eng. Sci. 1981, 36, 429–434. [Google Scholar] [CrossRef]
- Benkreira, H.; Edwards, M.; Wilkinson, W. A semi-empirical model of the forward roll coating flow of newtonian fluids. Chem. Eng. Sci. 1981, 36, 423–427. [Google Scholar] [CrossRef]
- Benkreira, H.; Edwards, M.; Wilkinson, W. Roll coating operations. J. Non-Newton. Fluid Mech. 1984, 14, 377–389. [Google Scholar] [CrossRef]
- Coyle, D.J.; Macosko, C.W.; Scriven, L.E. The fluid dynamics of reverse roll coating. AIChE J. 1990, 36, 161–174. [Google Scholar] [CrossRef]
- Manzoor, T.; Zafar, M.; Iqbal, S.; Nazar, K.; Ali, M.; Saleem, M.; Manzoor, S.; Kim, W.Y. Theoretical Analysis of Roll-Over-Web Surface Thin Layer Coating. Coatings 2020, 10, 691. [Google Scholar] [CrossRef]
- Abbas, Z.; Khaliq, S. Roll-over-web coating analysis of micropolar-Casson fluid: A theoretical investigation. J. Polym. Eng. 2021, 41, 289–298. [Google Scholar] [CrossRef]
- Usman, M.; Hou, Y.; Zahid, M.; Ali, F.; Rana, M.A. Analytical study of viscoelastic fluid during forward roll coating process under lubrication approximation theory. Int. J. Mod. Phys. B 2023, 38, 2450287. [Google Scholar] [CrossRef]
- Ali, F.; Hou, Y.; Zahid, M.; Rana, M.A.; Kumam, P.; Sitthithakerngkiet, K. Numerical analysis of heat transfer and magnetohydrodynamic flow of viscoelastic Jeffery fluid during forward roll coating process. Heat Transf. 2022, 52, 911–935. [Google Scholar] [CrossRef]
- Zahid, M.; Siddique, I.; Ali, R. Coating of a viscoplastic material onto a moving porous web during forward roll coating process: A theoretical study. J. Plast. Film Sheeting 2022, 39, 19–51. [Google Scholar] [CrossRef]
- Atif, H.M.; Jabeen, F.; Javed, M.A. Mathematical study of viscoelastic polymer during roll-over-web coating. J. Plast. Film Sheeting 2023, 40, 30–50. [Google Scholar] [CrossRef]
- Powell, R.E.; Eyring, H. Mechanisms for the Relaxation Theory of Viscosity. Nature 1944, 154, 427–428. [Google Scholar] [CrossRef]
- Khan, Z.; Rasheed, H.U.; Abbas, T.; Khan, W.; Khan, I.; Baleanu, D.; Nisar, K.S. Analysis of Eyring–Powell Fluid Flow Used as a Coating Material for Wire with Variable Viscosity Effect along with Thermal Radiation and Joule Heating. Crystals 2020, 10, 168. [Google Scholar] [CrossRef]
- Aljohani, J.L.; Alaidarous, E.S.; Raja, M.A.Z.; Shoaib, M.; Alhothuali, M.S. Intelligent computing through neural networks for numerical treatment of non-Newtonian wire coating analysis model. Sci. Rep. 2021, 11, 9072. [Google Scholar] [CrossRef]
- Ali, F.; Zahid, M.; Souayeh, B.; Asmat, F.; Nwaigwe, C. Analytical and numerical investigation for viscoelastic fluid with heat transfer analysis during rollover-web coating phenomena. Open Phys. 2024, 22. [Google Scholar] [CrossRef]
- Patil, P.M.; Kulkarni, M. MHD quadratic mixed convective Eyring-Powell nanofluid flow with multiple diffusions. Chin. J. Phys. 2022, 77, 393–410. [Google Scholar] [CrossRef]
- Rashad, A.M.; Nafe, M.A.; Eisa, D.A. Heat Generation and Thermal Radiation Impacts on Flow of Magnetic Eyring–Powell Hybrid Nanofluid in a Porous Medium. Arab. J. Sci. Eng. 2022, 48, 939–952. [Google Scholar] [CrossRef]
- Nazeer, M.; Khan, M.; Khan, S.U.; Saleem, A.; Muhammad, T.; Shah, S.I. Assessment of heat and mass transfer characteristics in Poiseuille flow of non-Newtonian nanofluid in a porous channel with convectively heated lower wall. Chin. J. Phys. 2022, 77, 1065–1079. [Google Scholar] [CrossRef]
- Khan, U.; Zaib, A.; Ishak, A.; Sherif, E.-S.M.; Sarris, I.E. Numerical analysis of irregular heat source/sink through a wall jet flow of spherical graphene oxide nanoparticle in the presence of thermophoretic particle deposition: The case of non-Newtonian Eyring–Powell fluid model. Numer. Heat Transfer Part B Fundam. 2023, 1–18. [Google Scholar] [CrossRef]
- Manvi, B.; Tawade, J.; Biradar, M.; Noeiaghdam, S.; Fernandez-Gamiz, U.; Govindan, V. The effects of MHD radiating and non-uniform heat source/sink with heating on the momentum and heat transfer of Eyring-Powell fluid over a stretching. Results Eng. 2022, 14, 100435. [Google Scholar] [CrossRef]
- Ali, F.; Hou, Y.; Feng, X.; Odeyemi, J.K.; Zahid, M.; Hussain, S. Optimization and sensitivity analysis of heat transfer for Powell–Eyring fluid between rotating rolls with temperature-dependent viscosity: A mathematical modeling approach. Phys. Fluids 2024, 36. [Google Scholar] [CrossRef]
- Bhukta, D.; Mishra, S.; Hoque, M.M. Numerical simulation of heat transfer effect on Oldroyd 8-constant fluid with wire coating analysis. Eng. Sci. Technol. Int. J. 2016, 19, 1910–1918. [Google Scholar] [CrossRef]
- Srikantha, N.; Hegde, S. Numerical investigation of heat and mass transfer of the Sisko fluid in a wire-coating process with variable fluid properties. Phys. Scr. 2023, 98, 105221. [Google Scholar] [CrossRef]
- Lawal, M.O.; Kasali, K.B.; Ogunseye, H.A.; Oni, M.O.; Tijani, Y.O.; Lawal, Y.T. On the mathematical model of Eyring–Powell nanofluid flow with non-linear radiation, variable thermal conductivity and viscosity. Partial. Differ. Equ. Appl. Math. 2022, 5, 100318. [Google Scholar] [CrossRef]
- Basavarajappa, M.; Bhatta, D. Heat and mass transfer of a molten polymer conveying nanoparticles in a wire coating process with temperature-dependent fluid properties: Optimization using Response surface method. Int. Commun. Heat Mass Transf. 2022, 133, 105941. [Google Scholar] [CrossRef]
- Srikantha, N.; Hegde, S. Numerical study of unsteady nonlinear convective flow of a nanofluid over a vertical plate with variable fluid properties. Int. J. Ambient. Energy 2023, 44, 1814–1828. [Google Scholar] [CrossRef]
- Zeeshan; Rasheed, H.U.; Naeem, M.; Ataullah. Viscoelastic third-order nanofluid MHD flow for wire coating purpose inside canonical coating die with variable viscosity effect: Numerical and analytical solutions. Waves Random Complex Media 2023, 33, 1405–1423. [Google Scholar] [CrossRef]
- Thriveni, K.; Mahanthesh, B. Sensitivity computation of nonlinear convective heat transfer in hybrid nanomaterial between two concentric cylinders with irregular heat sources. Int. Commun. Heat Mass Transf. 2021, 129, 105677. [Google Scholar] [CrossRef]
- Kalateh, M.R.; Kianifar, A.; Sardarabadi, M. A three-dimensional numerical study of the effects of various twisted tapes on heat transfer characteristics and flow field in a tube: Experimental validation and multi-objective optimization via response surface methodology. Sustain. Energy Technol. Assess. 2021, 50, 101798. [Google Scholar] [CrossRef]
- Farouk, W.; Abdullah, A.; Mohammed, S.A.; Alawee, W.H.; Omara, Z.; Essa, F. Modeling and optimization of working conditions of pyramid solar still with different nanoparticles using response surface methodology. Case Stud. Therm. Eng. 2022, 33, 101984. [Google Scholar] [CrossRef]
- Rana, P.; Gupta, S.; Gupta, G. Unsteady nonlinear thermal convection flow of MWCNT-MgO/EG hybrid nanofluid in the stagnation-point region of a rotating sphere with quadratic thermal radiation: RSM for optimization. Int. Commun. Heat Mass Transf. 2022, 134, 106025. [Google Scholar] [CrossRef]
- Myers, T.; Charpin, J.; Tshehla, M. The flow of a variable viscosity fluid between parallel plates with shear heating. Appl. Math. Model. 2005, 30, 799–815. [Google Scholar] [CrossRef]
- Sofou, S.; Mitsoulis, E. Roll-over-web Coating of Pseudoplastic and Viscoplastic Sheets Using the Lubrication Approximation. J. Plast. Film Sheeting 2005, 21, 307–333. [Google Scholar] [CrossRef]


| Separation Force | Power Input | |||
|---|---|---|---|---|
| 0.1 | 1.30173 | 0.650865 | −0.09944 | −1.86362 |
| 0.2 | 1.30197 | 0.650985 | −0.02874 | −2.00728 |
| 0.3 | 1.30220 | 0.651100 | 0.07234 | −2.15093 |
| 0.4 | 1.30243 | 0.651215 | 0.19987 | −2.28994 |
| 0.5 | 1.30266 | 0.651330 | 0.35074 | −2.42104 |
| 0.6 | 1.30290 | 0.651450 | 0.52260 | −2.54185 |
| 0.7 | 1.30313 | 0.651565 | 0.71358 | −2.65060 |
| 0.8 | 1.30336 | 0.651680 | 0.92231 | −2.74596 |
| 0.9 | 1.30360 | 0.651800 | 1.14754 | −2.82672 |
| Separation Force | Power Input | |||
|---|---|---|---|---|
| 0.1 | 1.30266 | 0.651330 | 0.35074 | −2.42104 |
| 0.2 | 1.30350 | 0.651750 | 0.153774 | −2.28806 |
| 0.3 | 1.30394 | 0.651970 | 0.047609 | −2.21690 |
| 0.4 | 1.30415 | 0.652075 | −0.02152 | −2.16852 |
| 0.5 | 1.30420 | 0.652100 | −0.07122 | −2.13142 |
| 0.6 | 1.30422 | 0.652110 | −0.108580 | −2.10079 |
| 0.7 | 1.30435 | 0.652175 | −0.137957 | −2.07429 |
| 0.8 | 1.30448 | 0.652240 | −0.161521 | −2.05042 |
| 0.9 | 1.30455 | 0.652275 | −0.181215 | −2.02833 |
| Separation Force | Power Input | |||
|---|---|---|---|---|
| 0.5 | 1.30196 | 0.650980 | 0.390623 | −2.82448 |
| 1 | 1.30350 | 0.651750 | 0.480159 | −2.34299 |
| 1.5 | 1.30362 | 0.651810 | 0.668466 | −1.71699 |
| 2 | 1.30386 | 0.651930 | 0.695152 | −0.77848 |
| 2.5 | 1.30404 | 0.652020 | 0.546205 | 0.65600 |
| 3 | 1.30442 | 0.652210 | 0.235125 | 2.79225 |
| 3.5 | 1.30538 | 0.652690 | −0.229888 | 5.874679 |
| 4 | 1.30640 | 0.653200 | −0.846708 | 10.20356 |
| 4.5 | 1.30743 | 0.653715 | −1.613521 | 16.1462 |
| Codes | Variables | Level | ||
|---|---|---|---|---|
| Low (−1) | Intermediate (0) | High (+1) | ||
| 0.5 | 2 | 3.5 | ||
| 0.1 | 0.4 | 0.7 | ||
| 0.5 | 2.5 | 4.5 | ||
| Std | Run | Space Type | Parameter I | Parameter II | Parameter III | Target I | Target II |
|---|---|---|---|---|---|---|---|
| 1 | 2 | Factorial | 0.5 | 0.1 | 0.5 | 0.01545 | 0.9459 |
| 2 | 5 | Factorial | 3.5 | 0.1 | 0.5 | 0.01997 | 0.94024 |
| 3 | 17 | Factorial | 0.5 | 0.7 | 0.5 | 0.01542 | 0.62173 |
| 4 | 7 | Factorial | 3.5 | 0.7 | 0.5 | 0.01993 | 0.58215 |
| 5 | 4 | Factorial | 0.5 | 0.1 | 4.5 | 0.11156 | 0.95762 |
| 6 | 16 | Factorial | 3.5 | 0.1 | 4.5 | 0.15196 | 0.95196 |
| 7 | 13 | Factorial | 0.5 | 0.7 | 4.5 | 0.10959 | 0.70734 |
| 8 | 14 | Factorial | 3.5 | 0.7 | 4.5 | 0.14968 | 0.66777 |
| 9 | 6 | Axial | 0.5 | 0.4 | 2.5 | 0.06925 | 0.80767 |
| 10 | 3 | Axial | 3.5 | 0.4 | 2.5 | 0.09176 | 0.78505 |
| 11 | 11 | Axial | 2 | 0.1 | 2.5 | 0.08088 | 0.94893 |
| 12 | 8 | Axial | 2 | 0.7 | 2.5 | 0.08014 | 0.64475 |
| 13 | 18 | Axial | 2 | 0.4 | 0.5 | 0.01769 | 0.77241 |
| 14 | 15 | Axial | 2 | 0.4 | 4.5 | 0.13069 | 0.82031 |
| 15 | 20 | Center | 2 | 0.4 | 2.5 | 0.08051 | 0.79636 |
| 16 | 1 | Center | 2 | 0.4 | 2.5 | 0.08051 | 0.79636 |
| 17 | 10 | Center | 2 | 0.4 | 2.5 | 0.08051 | 0.79636 |
| 18 | 19 | Center | 2 | 0.4 | 2.5 | 0.08051 | 0.79636 |
| 19 | 9 | Center | 2 | 0.4 | 2.5 | 0.08051 | 0.79636 |
| 20 | 12 | Center | 2 | 0.4 | 2.5 | 0.08051 | 0.79636 |
| Source | Sum of Squares | df | Mean Square | F-Value | p-Value | Coefficient Estimate |
|---|---|---|---|---|---|---|
| Model | 0.0340 | 9 | 0.0038 | 5.879 × 10⁵ | <0.0001 | 0.0805 |
| 0.0013 | 1 | 0.0013 | 1.952 × 10⁵ | <0.0001 | 0.0112 | |
| 2.560 × 10⁻⁶ | 1 | 2.560 × 10⁻⁶ | 398.17 | <0.0001 | −0.0005 | |
| 0.0319 | 1 | 0.0319 | 4.965 × 10⁶ | <0.0001 | 0.0565 | |
| 1.280 × 10⁻⁸ | 1 | 1.280 × 10⁻⁸ | 1.99 | 0.1886 | 0.0000 | |
| 0.0006 | 1 | 0.0006 | 99,266.00 | <0.0001 | 0.0089 | |
| 2.184 × 10⁻⁶ | 1 | 2.184 × 10⁻⁶ | 339.65 | <0.0001 | −0.0005 | |
| 5.114 × 10⁻¹² | 1 | 5.114 × 10⁻¹² | 0.0008 | 0.9781 | −1.364 × 10⁻⁶ | |
| 3.636 × 10⁻¹¹ | 1 | 3.636 × 10⁻¹¹ | 0.0057 | 0.9415 | 3.636 × 10⁻⁶ | |
| 0.0001 | 1 | 0.0001 | 17,062.06 | <0.0001 | −0.0063 | |
| Residual | 6.430 × 10⁻⁸ | 10 | 6.430 × 10⁻⁹ | |||
| Lack of Fit | 6.430 × 10⁻⁸ | 5 | 1.286 × 10⁻⁸ | |||
| Pure Error | 0.0000 | 5 | 0.0000 | |||
| Cor Total | 0.0340 | 19 |
| Source | Sum of Squares | df | Mean Square | F-Value | p-Value | Coefficient Estimate |
|---|---|---|---|---|---|---|
| Model | 0.2418 | 9 | 0.0269 | 1.140 × 10⁶ | <0.0001 | 0.7964 |
| 0.0013 | 1 | 0.0013 | 54274.79 | <0.0001 | −0.0113 | |
| 0.2313 | 1 | 0.2313 | 9.817 × 10⁶ | <0.0001 | −0.1521 | |
| 0.0059 | 1 | 0.0059 | 2.497 × 10⁵ | <0.0001 | 0.0243 | |
| 0.0006 | 1 | 0.0006 | 24,406.38 | <0.0001 | −0.0085 | |
| 1.250 × 10⁻¹¹ | 1 | 1.250 × 10⁻¹¹ | 0.0005 | 0.9821 | 1.250 × 10⁻⁶ | |
| 0.0027 | 1 | 0.0027 | 1.159 × 10⁵ | <0.0001 | 0.0185 | |
| 5.682 × 10⁻¹³ | 1 | 5.682 × 10⁻¹³ | 0.0000 | 0.9962 | −4.545 × 10⁻⁷ | |
| 6.324 × 10⁻⁷ | 1 | 6.324 × 10⁻⁷ | 26.84 | 0.0004 | 0.0005 | |
| 5.682 × 10⁻¹³ | 1 | 5.682 × 10⁻¹³ | 0.0000 | 0.9962 | −4.545 × 10⁻⁷ | |
| Residual | 2.356 × 10⁻⁷ | 10 | 2.356 × 10⁻⁸ | |||
| Lack of Fit | 2.356 × 10⁻⁷ | 5 | 4.713 × 10⁻⁸ | |||
| Pure Error | 0.0000 | 5 | 0.0000 | |||
| Cor Total | 0.2418 | 19 |
Disclaimer/Publisher’s Note: The statements, opinions and data contained in all publications are solely those of the individual author(s) and contributor(s) and not of MDPI and/or the editor(s). MDPI and/or the editor(s) disclaim responsibility for any injury to people or property resulting from any ideas, methods, instructions or products referred to in the content. |
© 2024 by the authors. Licensee MDPI, Basel, Switzerland. This article is an open access article distributed under the terms and conditions of the Creative Commons Attribution (CC BY) license (https://creativecommons.org/licenses/by/4.0/).
Share and Cite
Ali, F.; Narasimhamurthy, S.; Hegde, S.; Usman, M. Temperature-Dependent Viscosity Analysis of Powell–Eyring Fluid Model during a Roll-over Web Coating Process. Polymers 2024, 16, 1723. https://doi.org/10.3390/polym16121723
Ali F, Narasimhamurthy S, Hegde S, Usman M. Temperature-Dependent Viscosity Analysis of Powell–Eyring Fluid Model during a Roll-over Web Coating Process. Polymers. 2024; 16(12):1723. https://doi.org/10.3390/polym16121723
Chicago/Turabian StyleAli, Fateh, Srikantha Narasimhamurthy, Soniya Hegde, and Muhammad Usman. 2024. "Temperature-Dependent Viscosity Analysis of Powell–Eyring Fluid Model during a Roll-over Web Coating Process" Polymers 16, no. 12: 1723. https://doi.org/10.3390/polym16121723
APA StyleAli, F., Narasimhamurthy, S., Hegde, S., & Usman, M. (2024). Temperature-Dependent Viscosity Analysis of Powell–Eyring Fluid Model during a Roll-over Web Coating Process. Polymers, 16(12), 1723. https://doi.org/10.3390/polym16121723