
Identification of Plastics in Mixtures and Blends through Pyrolysis-Gas Chromatography/Mass Spectrometry


Abstract
:1. Introduction
2. Materials and Methods
2.1. Materials
2.2. Method
2.2.1. Solid Mixtures and Blends Preparation
2.2.2. Characterization Techniques
3. Results and Discussion
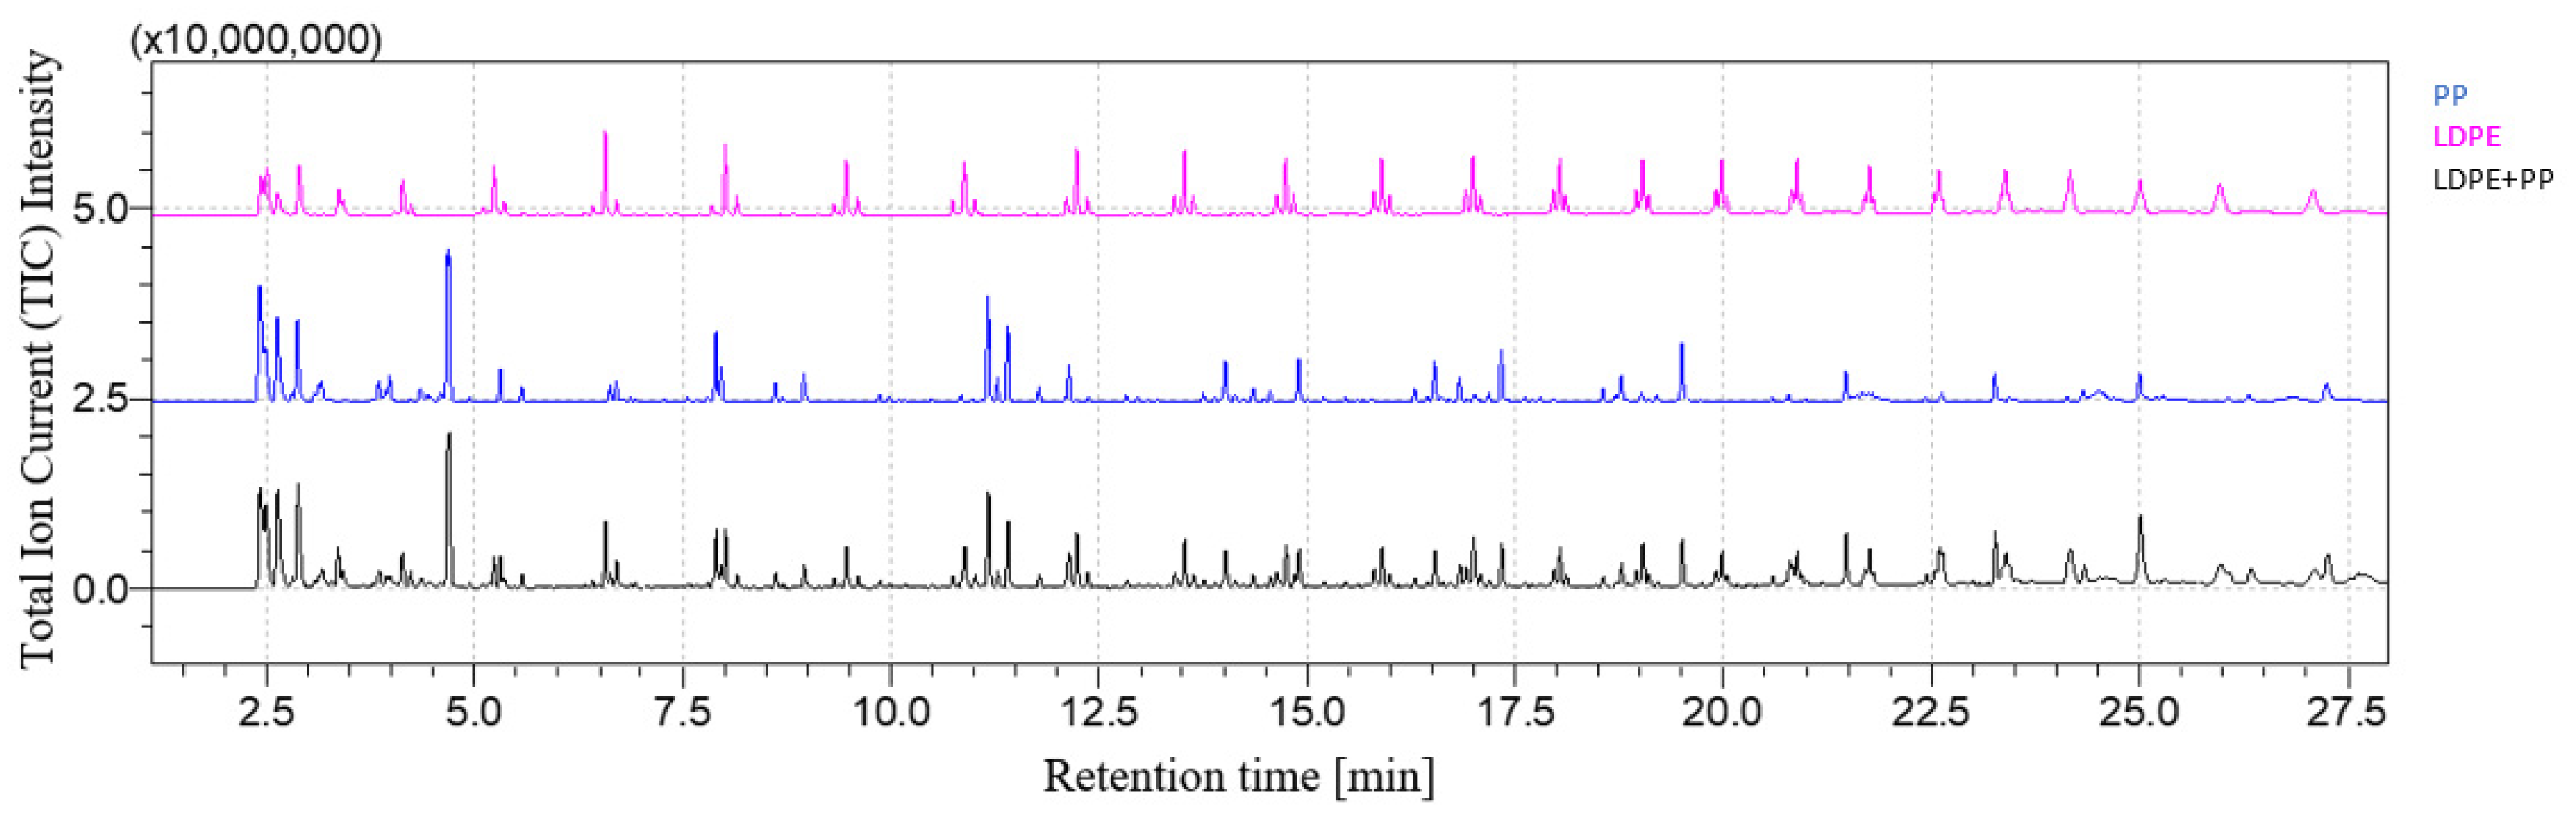
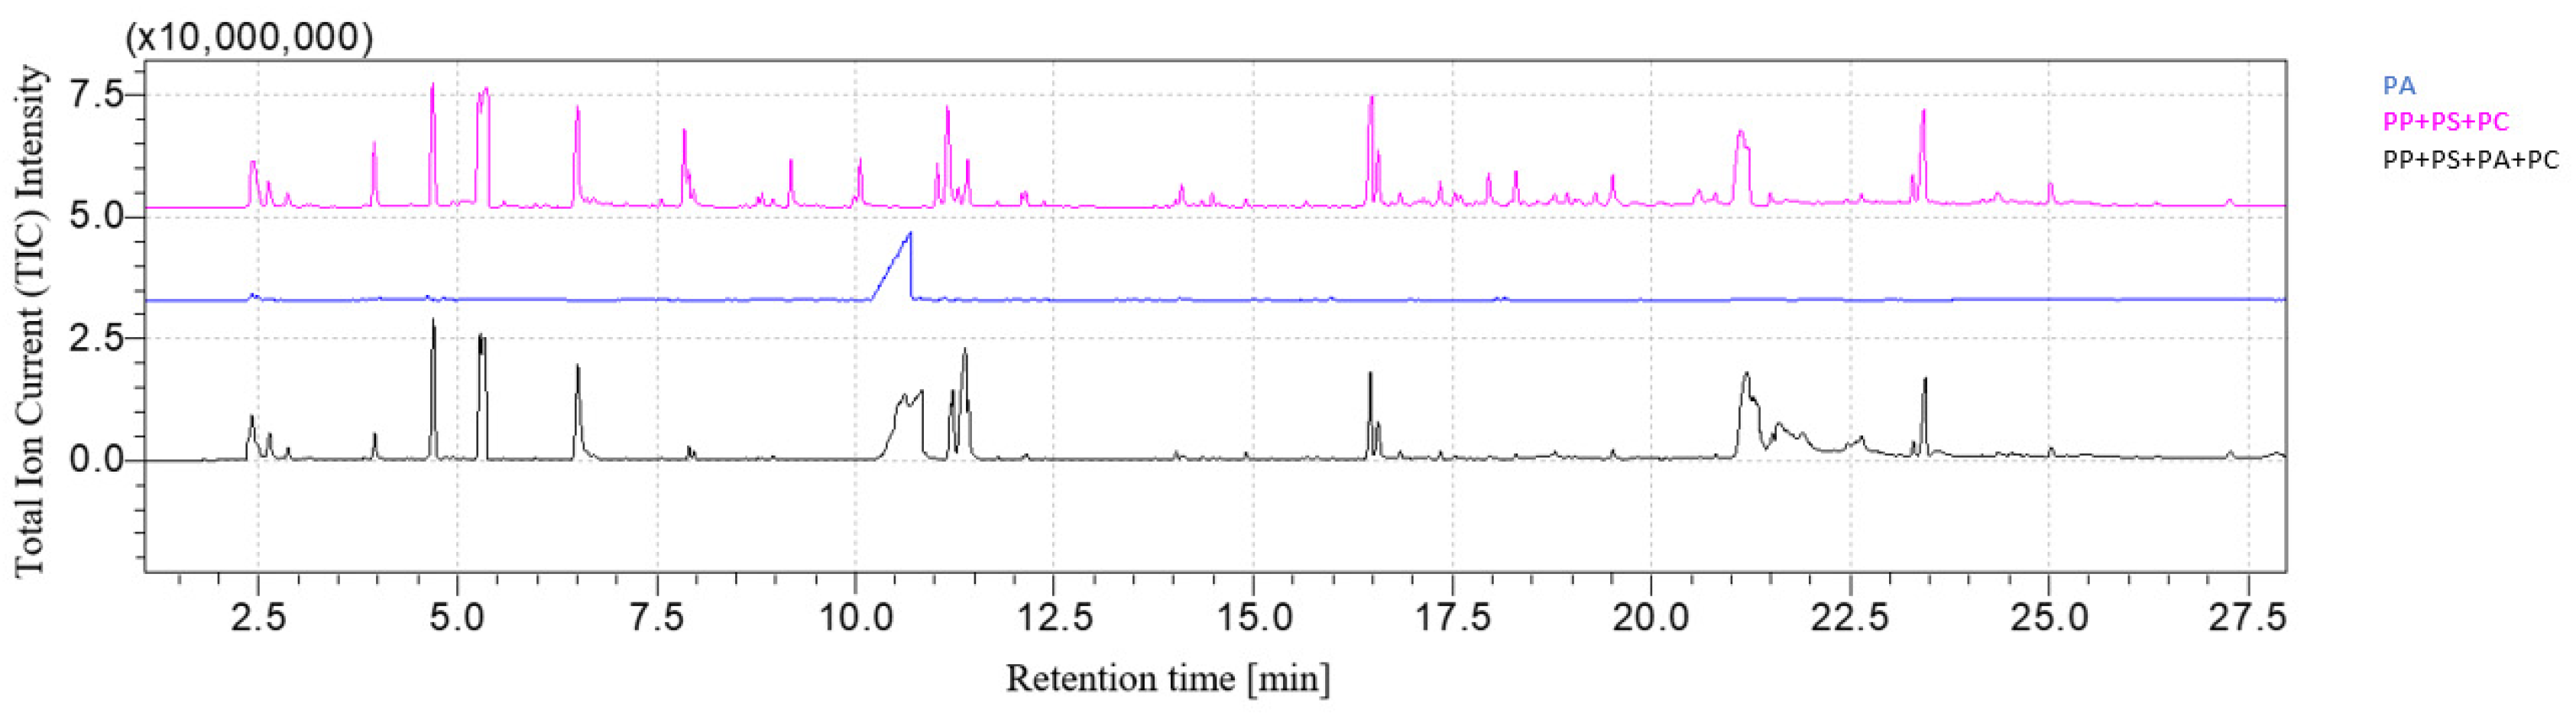
3.1. Qualitative Analysis of Mixtures
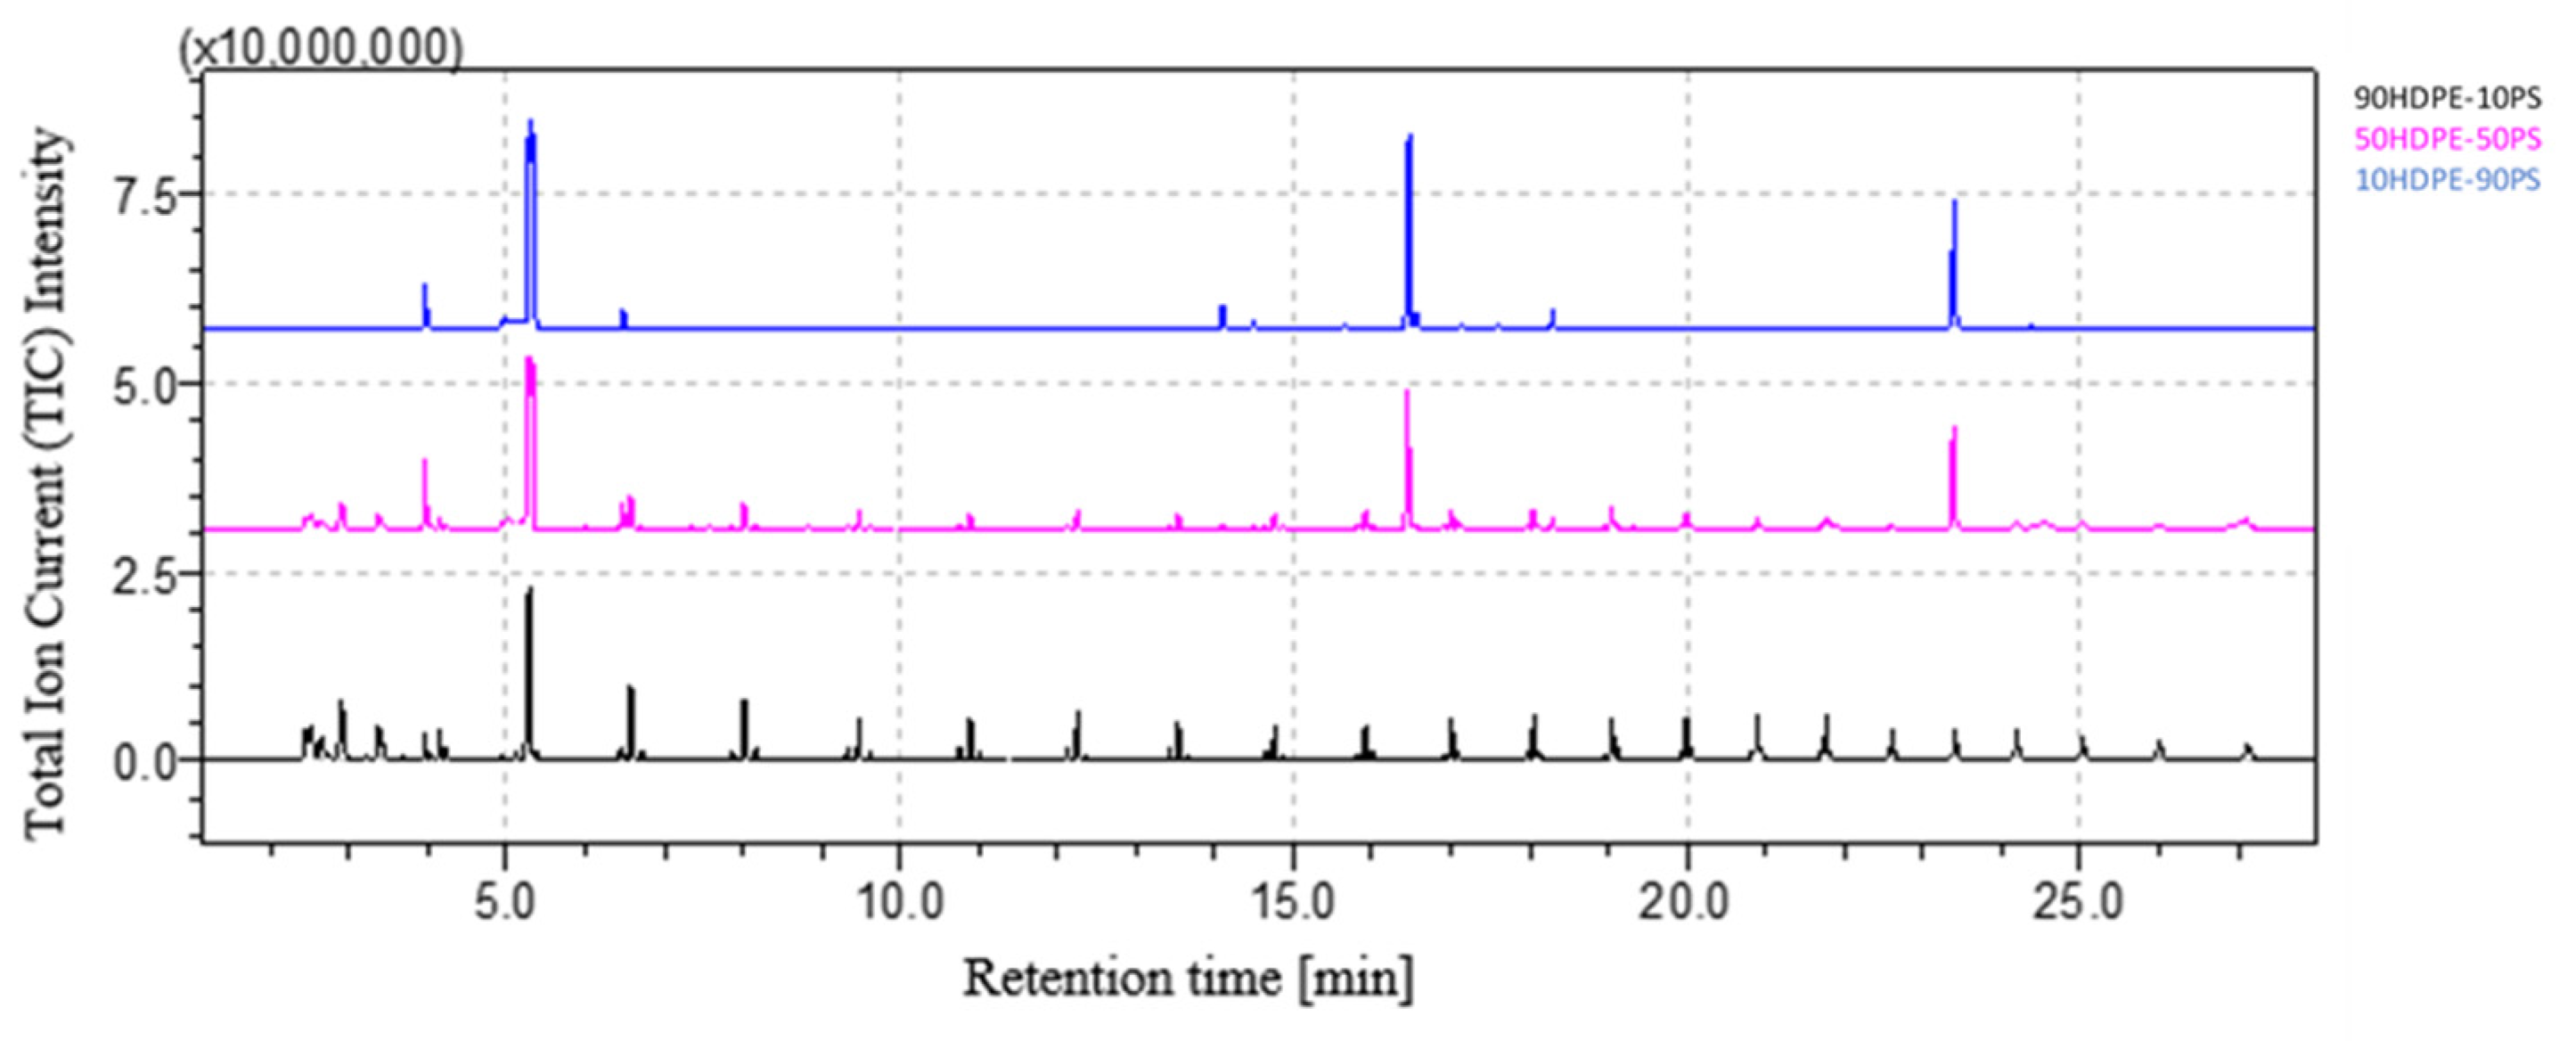
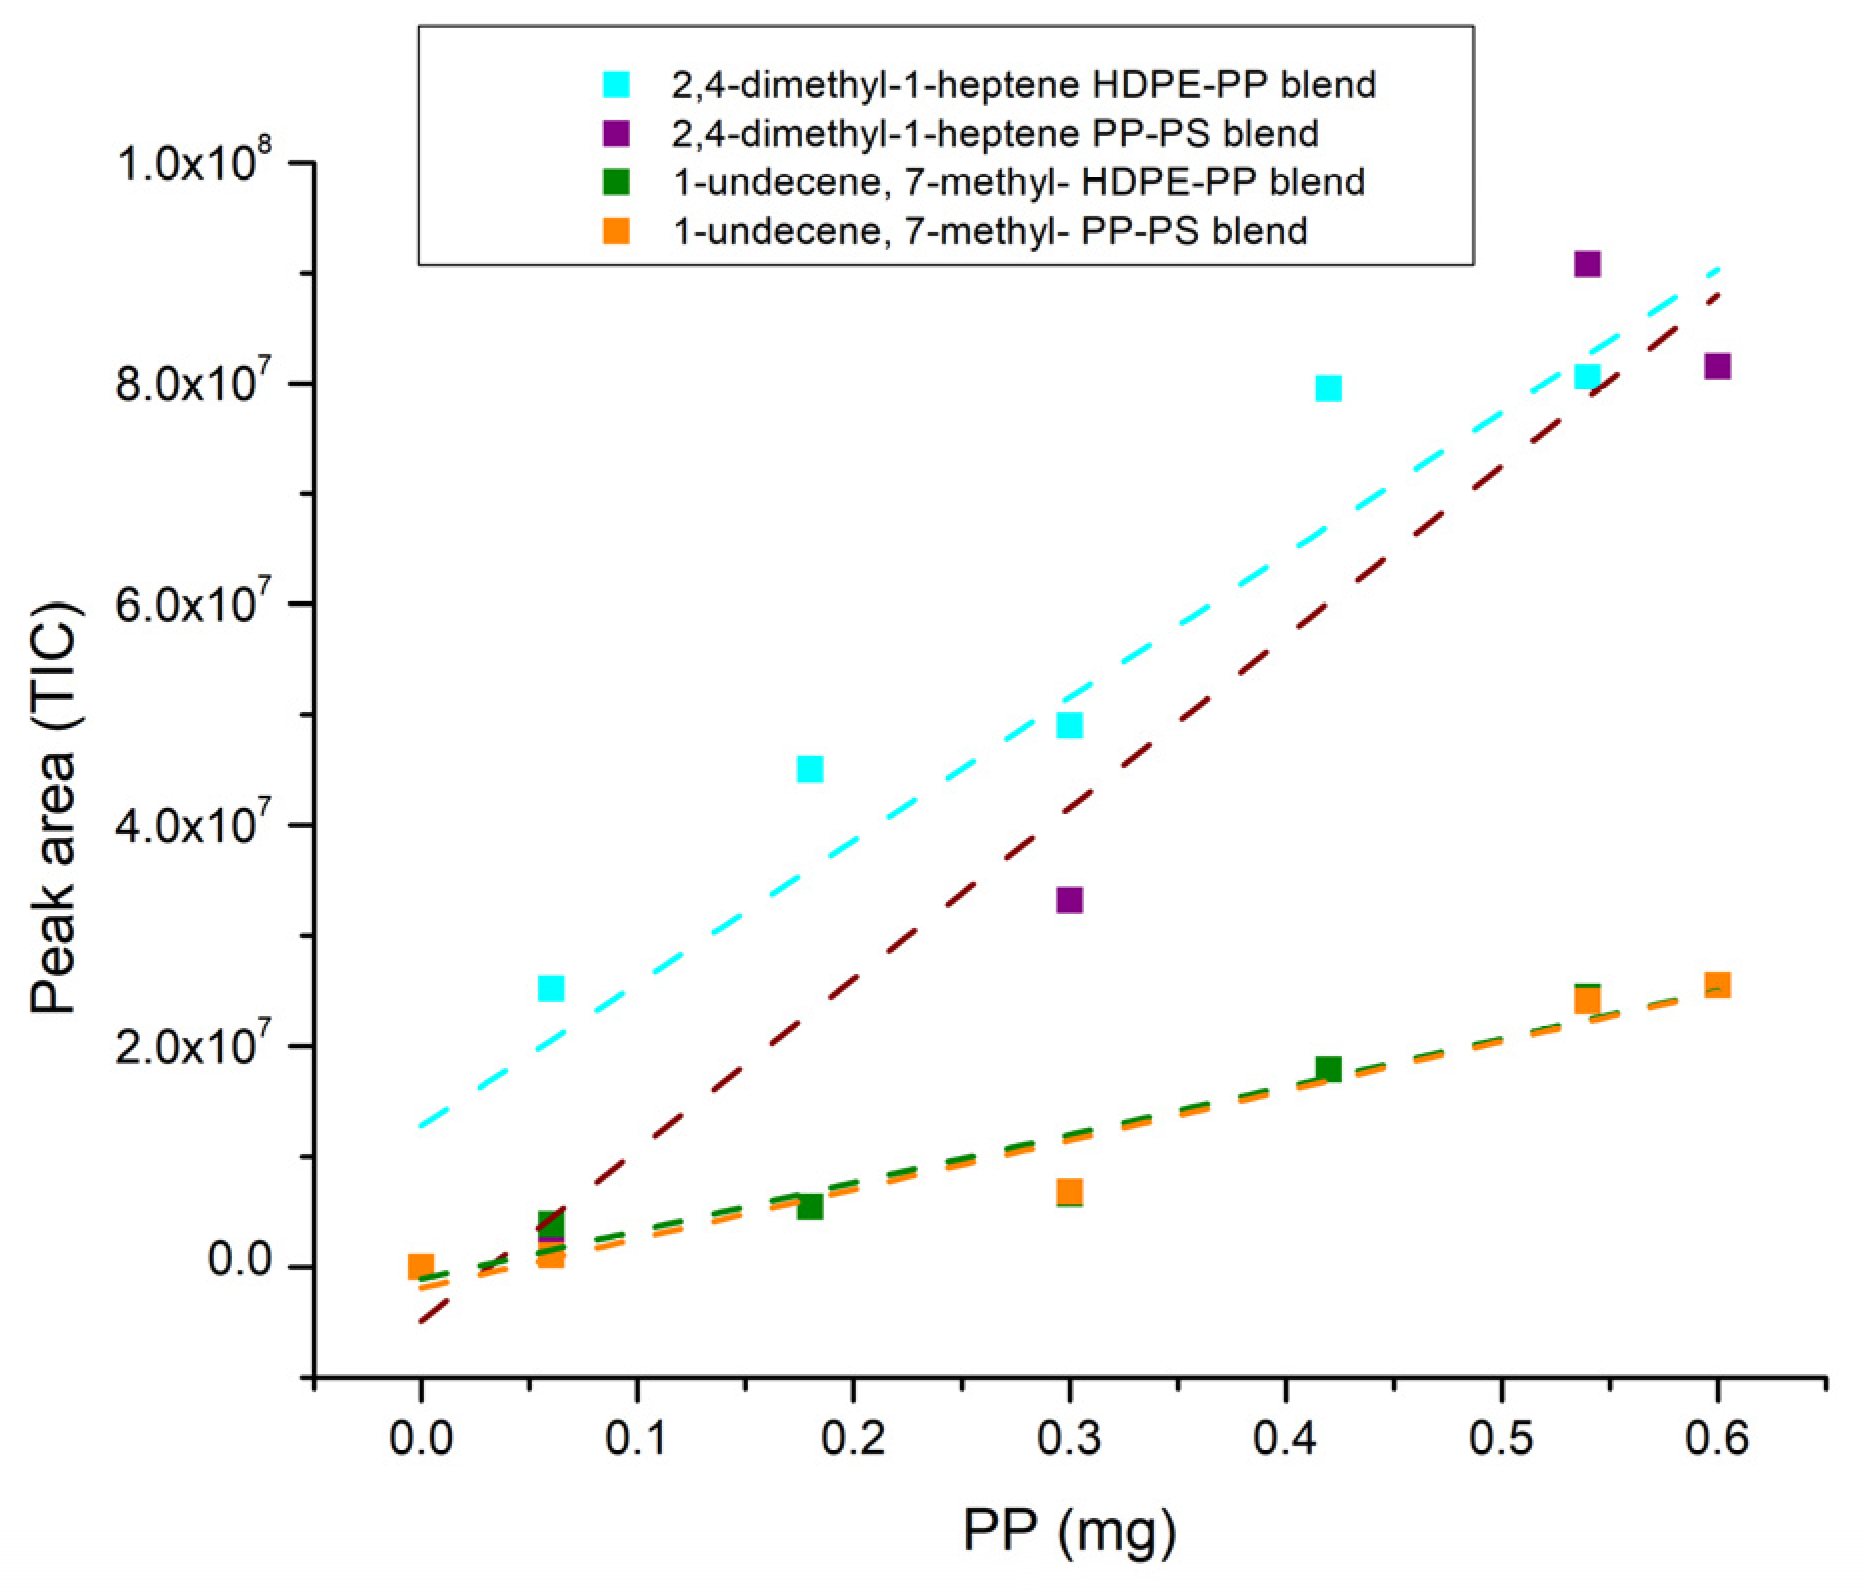
3.2. Quantitative Analysis of Blends
4. Conclusions
Supplementary Materials
Author Contributions
Funding
Institutional Review Board Statement
Data Availability Statement
Conflicts of Interest
References
- Shaykheeva, D. World Population Estimates and Projections: Data and Methods. J. Econ. Econ. Educ. Res. 2016, 17, 237–247. [Google Scholar]
- Zehra, T.; Fattah-alhosseini, A.; Kaseem, M. Surface Properties of Plasma Electrolytic Oxidation Coating Modified by Polymeric Materials: A Review. Prog. Org. Coat. 2022, 171, 107053. [Google Scholar] [CrossRef]
- Zhao, K.; Wei, Y.; Dong, J.; Zhao, P.; Wang, Y.; Pan, X.; Wang, J. Separation and characterization of microplastic and nanoplastic particles in marine environment. Environ. Pollut. 2022, 297, 118773. [Google Scholar] [CrossRef] [PubMed]
- Nerland, I.L.; Halsband, C.; Allan, I.; Thomas, K.V. Microplastics in Marine Environments: Occurrence, Distribution and Effects; Norwegian Institute for Water Research: Oslo, Norway, 2014; ISBN 9788257764890. [Google Scholar]
- Zheng, Y.; Yanful, E.K.; Bassi, A.S. A Review of Plastic Waste Biodegradation. Crit. Rev. Biotechnol. 2005, 25, 243–250. [Google Scholar] [CrossRef] [PubMed]
- Chang, X.; Xue, Y.; Li, J.; Zou, L.; Tang, M. Potential Health Impact of Environmental Micro- and Nanoplastics Pollution. J. Appl. Toxicol. 2020, 40, 4–15. [Google Scholar] [CrossRef] [PubMed]
- Tong, H.; Zhong, X.; Duan, Z.; Yi, X.; Cheng, F.; Xu, W.; Yang, X. Micro- and Nanoplastics Released from Biodegradable and Conventional Plastics during Degradation: Formation, Aging Factors, and Toxicity. Sci. Total Environ. 2022, 833, 155275. [Google Scholar] [CrossRef] [PubMed]
- Lou, F.; Wang, J.; Sima, J.; Lei, J.; Huang, Q. Mass Concentration and Distribution Characteristics of Microplastics in Landfill Mineralized Refuse Using Efficient Quantitative Detection Based on Py-GC/MS. J. Hazard. Mater. 2023, 459, 132098. [Google Scholar] [CrossRef] [PubMed]
- Zhang, K.; Hamidian, A.H.; Tubić, A.; Zhang, Y.; Fang, J.K.H.; Wu, C.; Lam, P.K.S. Understanding Plastic Degradation and Microplastic Formation in the Environment: A Review. Environ. Pollut. 2021, 274, 116554. [Google Scholar] [CrossRef]
- Jiang, B.; Kauffman, A.E.; Li, L.; McFee, W.; Cai, B.; Weinstein, J.; Lead, J.R.; Chatterjee, S.; Scott, G.I.; Xiao, S. Health Impacts of Environmental Contamination of Micro- And Nanoplastics: A Review. Environ. Health Prev. Med. 2020, 25, 29. [Google Scholar] [CrossRef]
- Ainali, N.M.; Bikiaris, D.N.; Lambropoulou, D.A. Aging Effects on Low- and High-Density Polyethylene, Polypropylene and Polystyrene under UV Irradiation: An Insight into Decomposition Mechanism by Py-GC/MS for Microplastic Analysis. J. Anal. Appl. Pyrolysis 2021, 158, 105207. [Google Scholar] [CrossRef]
- Peller, J.R.; Mezyk, S.P.; Shidler, S.; Castleman, J.; Kaiser, S.; Faulkner, R.F.; Pilgrim, C.D.; Wilson, A.; Martens, S.; Horne, G.P. Facile Nanoplastics Formation from Macro and Microplastics in Aqueous Media. Environ. Pollut. 2022, 313, 120171. [Google Scholar] [CrossRef]
- Enfrin, M.; Dumée, L.F.; Lee, J. Nano/Microplastics in Water and Wastewater Treatment Processes—Origin, Impact and Potential Solutions. Water Res. 2019, 161, 621–638. [Google Scholar] [CrossRef] [PubMed]
- Wu, X.; Zhao, X.; Chen, R.; Liu, P.; Liang, W.; Wang, J.; Teng, M.; Wang, X.; Gao, S. Wastewater Treatment Plants Act as Essential Sources of Microplastic Formation in Aquatic Environments: A Critical Review. Water Res. 2022, 221, 118825. [Google Scholar] [CrossRef] [PubMed]
- da Costa, J.P. Micro- and Nanoplastics in the Environment: Research and Policymaking. Curr. Opin. Environ. Sci. Health 2018, 1, 12–16. [Google Scholar] [CrossRef]
- Menzel, T.; Meides, N.; Mauel, A.; Mansfeld, U.; Kretschmer, W.; Kuhn, M.; Herzig, E.M.; Altstädt, V.; Strohriegl, P.; Senker, J.; et al. Degradation of Low-Density Polyethylene to Nanoplastic Particles by Accelerated Weathering. Sci. Total Environ. 2022, 826, 154035. [Google Scholar] [CrossRef] [PubMed]
- Graca, B.; Szewc, K.; Zakrzewska, D.; Dołęga, A.; Szczerbowska-Boruchowska, M. Sources and Fate of Microplastics in Marine and Beach Sediments of the Southern Baltic Sea—A Preliminary Study. Environ. Sci. Pollut. Res. 2017, 24, 7650–7661. [Google Scholar] [CrossRef] [PubMed]
- Suaria, G.; Avio, C.G.; Mineo, A.; Lattin, G.L.; Magaldi, M.G.; Belmonte, G.; Moore, C.J.; Regoli, F.; Aliani, S. The Mediterranean Plastic Soup: Synthetic Polymers in Mediterranean Surface Waters. Sci. Rep. 2016, 6, 37551. [Google Scholar] [CrossRef] [PubMed]
- Materić, D.; Holzinger, R.; Niemann, H. Nanoplastics and Ultrafine Microplastic in the Dutch Wadden Sea—The Hidden Plastics Debris? Sci. Total Environ. 2022, 846, 157371. [Google Scholar] [CrossRef] [PubMed]
- Summers, S.; Henry, T.; Gutierrez, T. Agglomeration of Nano- and Microplastic Particles in Seawater by Autochthonous and de Novo-Produced Sources of Exopolymeric Substances. Mar. Pollut. Bull. 2018, 130, 258–267. [Google Scholar] [CrossRef]
- Li, W.C.; Tse, H.F.; Fok, L. Plastic Waste in the Marine Environment: A Review of Sources, Occurrence and Effects. Sci. Total Environ. 2016, 566–567, 333–349. [Google Scholar] [CrossRef]
- Al-Thawadi, S. Microplastics and Nanoplastics in Aquatic Environments: Challenges and Threats to Aquatic Organisms. Arab. J. Sci. Eng. 2020, 45, 4419–4440. [Google Scholar] [CrossRef]
- Ivar Do Sul, J.A.; Costa, M.F. The Present and Future of Microplastic Pollution in the Marine Environment. Environ. Pollut. 2014, 185, 352–364. [Google Scholar] [CrossRef] [PubMed]
- Sankar Sana, S.; Kumar Dogiparthi, L.; Gangadhar, L.; Chakravorty, A.; Abhishek, N. Effects of Microplastics and Nanoplastics on Marine Environment and Human Health. Environ. Sci. Pollut. Res. 2020, 27, 44743–44756. [Google Scholar] [CrossRef] [PubMed]
- Yee, M.S.L.; Hii, L.W.; Looi, C.K.; Lim, W.M.; Wong, S.F.; Kok, Y.Y.; Tan, B.K.; Wong, C.Y.; Leong, C.O. Impact of Microplastics and Nanoplastics on Human Health. Nanomaterials 2021, 11, 496. [Google Scholar] [CrossRef] [PubMed]
- Chae, Y.; An, Y.J. Current Research Trends on Plastic Pollution and Ecological Impacts on the Soil Ecosystem: A Review. Environ. Pollut. 2018, 240, 387–395. [Google Scholar] [CrossRef] [PubMed]
- Ng, E.L.; Huerta Lwanga, E.; Eldridge, S.M.; Johnston, P.; Hu, H.W.; Geissen, V.; Chen, D. An Overview of Microplastic and Nanoplastic Pollution in Agroecosystems. Sci. Total Environ. 2018, 627, 1377–1388. [Google Scholar] [CrossRef] [PubMed]
- Rillig, M.C.; Ingraffia, R.; De Souza Machado, A.A. Microplastic Incorporation into Soil in Agroecosystems. Front. Plant Sci. 2017, 8, 1805. [Google Scholar] [CrossRef]
- Qiu, Y.; Zhou, S.; Zhang, C.; Zhou, Y.; Qin, W. Soil Microplastic Characteristics and the Effects on Soil Properties and Biota: A Systematic Review and Meta-Analysis. Environ. Pollut. 2022, 313, 120183. [Google Scholar] [CrossRef]
- Pathan, S.I.; Arfaioli, P.; Bardelli, T.; Ceccherini, M.T.; Nannipieri, P.; Pietramellara, G. Soil Pollution from Micro-and Nanoplastic Debris: A Hidden and Unknown Biohazard. Sustainability 2020, 12, 7255. [Google Scholar] [CrossRef]
- Van Raamsdonk, L.W.D.; Van Der Zande, M.; Koelmans, A.A.; Hoogenboom, P.L.A.; Peters, R.J.B.; Groot, M.J.; Peijnenburg, M.A.C.; Weesepoel, Y.J.A. Current Insights into Monitoring, Bioaccumulation, and Potential Health Effects of Microplastics Present in the Food Chain. Foods 2020, 9, 72. [Google Scholar] [CrossRef]
- World Health Organization. Dietary and Inhalation Exposure to Nano-and Microplastic Particles and Potential Implications for Human Health; World Health Organization: Geneva, Switzerland, 2022. [Google Scholar]
- Batista, T.; Cansado, I.P.d.P.; Tita, B.; Ilhéu, A.; Metrogos, L.; Mourão, P.A.M.; Nabais, J.M.V.; Castanheiro, J.; Borges, C.; Matos, G. Dealing with Plastic Waste from Agriculture Activity. Agronomy 2022, 12, 134. [Google Scholar] [CrossRef]
- Maraveas, C. Environmental Sustainability of Plastic in Agriculture. Agriculture 2020, 10, 310. [Google Scholar] [CrossRef]
- Dong, H.; Yang, G.; Zhang, Y.; Yang, Y.; Wang, D.; Zhou, C. Recycling, Disposal, or Biodegradable-Alternative of Polyethylene Plastic Film for Agricultural Mulching? A Life Cycle Analysis of Their Environmental Impacts. J. Clean. Prod. 2022, 380, 134950. [Google Scholar] [CrossRef]
- Kasirajan, S.; Ngouajio, M. Polyethylene and Biodegradable Mulches for Agricultural Applications: A Review. Agron. Sustain. Dev. 2012, 32, 501–529. [Google Scholar] [CrossRef]
- Corti, A.; Sudhakar, M.; Chiellini, E. Assessment of the Whole Environmental Degradation of Oxo-Biodegradable Linear Low Density Polyethylene (LLDPE) Films Designed for Mulching Applications. J. Polym. Environ. 2012, 20, 1007–1018. [Google Scholar] [CrossRef]
- Gamage, A.; Liyanapathiranage, A.; Manamperi, A.; Gunathilake, C.; Mani, S.; Merah, O.; Madhujith, T. Applications of Starch Biopolymers for a Sustainable Modern Agriculture. Sustainability 2022, 14, 6085. [Google Scholar] [CrossRef]
- Steinmetz, Z.; Wollmann, C.; Schaefer, M.; Buchmann, C.; David, J.; Tröger, J.; Muñoz, K.; Frör, O.; Schaumann, G.E. Plastic Mulching in Agriculture. Trading Short-Term Agronomic Benefits for Long-Term Soil Degradation? Sci. Total Environ. 2016, 550, 690–705. [Google Scholar] [CrossRef] [PubMed]
- Lyu, K.; Yu, B.; Li, D.; Gu, L.; Yang, Z. Increased Food Availability Reducing the Harmful Effects of Microplastics Strongly Depends on the Size of Microplastics. J. Hazard. Mater. 2022, 437, 129375. [Google Scholar] [CrossRef]
- Thornton Hampton, L.M.; Brander, S.M.; Coffin, S.; Cole, M.; Hermabessiere, L.; Koelmans, A.A.; Rochman, C.M. Characterizing Microplastic Hazards: Which Concentration Metrics and Particle Characteristics Are Most Informative for Understanding Toxicity in Aquatic Organisms? Microplastics Nanoplastics 2022, 2, 20. [Google Scholar] [CrossRef]
- Bucci, K.; Rochman, C.M. Microplastics: A Multidimensional Contaminant Requires a Multidimensional Framework for Assessing Risk. Microplastics Nanoplastics 2022, 2, 7. [Google Scholar] [CrossRef]
- Li, W.; Wufuer, R.; Duo, J.; Wang, S.; Luo, Y.; Zhang, D.; Pan, X. Microplastics in Agricultural Soils: Extraction and Characterization after Different Periods of Polythene Film Mulching in an Arid Region. Sci. Total Environ. 2020, 749, 141420. [Google Scholar] [CrossRef] [PubMed]
- Sobhani, Z.; Al Amin, M.; Naidu, R.; Megharaj, M.; Fang, C. Identification and Visualisation of Microplastics by Raman Mapping. Anal. Chim. Acta 2019, 1077, 191–199. [Google Scholar] [CrossRef] [PubMed]
- Xu, J.L.; Thomas, K.V.; Luo, Z.; Gowen, A.A. FTIR and Raman Imaging for Microplastics Analysis: State of the Art, Challenges and Prospects. TrAC—Trends Anal. Chem. 2019, 119, 115629. [Google Scholar] [CrossRef]
- Käppler, A.; Fischer, D.; Oberbeckmann, S.; Schernewski, G.; Labrenz, M.; Eichhorn, K.J.; Voit, B. Analysis of Environmental Microplastics by Vibrational Microspectroscopy: FTIR, Raman or Both? Anal. Bioanal. Chem. 2016, 408, 8377–8391. [Google Scholar] [CrossRef]
- Yang, L.; Zhang, Y.; Kang, S.; Wang, Z.; Wu, C. Microplastics in Soil: A Review on Methods, Occurrence, Sources, and Potential Risk. Sci. Total Environ. 2021, 780, 146546. [Google Scholar] [CrossRef] [PubMed]
- Du, C.; Wu, J.; Gong, J.; Liang, H.; Li, Z. ToF-SIMS Characterization of Microplastics in Soils. Surf. Interface Anal. 2020, 52, 293–300. [Google Scholar] [CrossRef]
- Adhikari, S.; Kelkar, V.; Kumar, R.; Halden, R.U. Methods and Challenges in the Detection of Microplastics and Nanoplastics: A Mini-Review. Polym. Int. 2022, 71, 543–551. [Google Scholar] [CrossRef]
- Sorolla-Rosario, D.; Llorca-Porcel, J.; Pérez-Martínez, M.; Lozano-Castelló, D.; Bueno-López, A. Study of Microplastics with Semicrystalline and Amorphous Structure Identification by TGA and DSC. J. Environ. Chem. Eng. 2021, 10, 106886. [Google Scholar] [CrossRef]
- Mansa, R.; Zou, S. Thermogravimetric Analysis of Microplastics: A Mini Review. Environ. Adv. 2021, 5, 100117. [Google Scholar] [CrossRef]
- Tsuge, S.; Ohtani, H. Pyrolysis-Gas Chromatography. In Practical Gas Chromatography; Springer: Berlin/Heidelberg, Germany, 2014; pp. 829–847. [Google Scholar]
- Tsuge, S.; Ohtani, H. Structural Characterization of Polymeric Materials by Pyrolysis-GC/MS. Polym. Degrad. Stab. 1997, 58, 109–130. [Google Scholar] [CrossRef]
- Watanabe, C.; Ohtani, H.; Tsuge, S. Pyrolysis—GC/MS Data Book of Synthetic Polymers: Pyrograms, Thermograms and MS of Pyrolyzates; Elsevier: Amsterdam, The Netherlands, 2011. [Google Scholar]
- Ainali, N.M.; Kalaronis, D.; Kontogiannis, A.; Evgenidou, E.; Kyzas, G.Z.; Yang, X.; Bikiaris, D.N.; Lambropoulou, D.A. Microplastics in the Environment: Sampling, Pretreatment, Analysis and Occurrence Based on Current and Newly-Exploited Chromatographic Approaches. Sci. Total Environ. 2021, 794, 148725. [Google Scholar] [CrossRef] [PubMed]
- Li, Y.; Zhang, C.; Tian, Z.; Cai, X.; Guan, B. Identification and Quantification of Nanoplastics (20–1000 Nm) in a Drinking Water Treatment Plant Using AFM-IR and Pyr-GC/MS. J. Hazard. Mater. 2024, 463, 132933. [Google Scholar] [CrossRef] [PubMed]
- Belesov, A.V.; Rezviy, T.V.; Pokryshkin, S.A.; Lakhmanov, D.E.; Chukhchin, D.G.; Kozhevnikov, A.Y. Impact of Coastal Sediments of the Northern Dvina River on Microplastics Inputs to the White and Barents Seas. J. Mar. Sci. Eng. 2022, 10, 1485. [Google Scholar] [CrossRef]
- Prata, J.C.; da Costa, J.P.; Duarte, A.C.; Rocha-Santos, T. Methods for Sampling and Detection of Microplastics in Water and Sediment: A Critical Review. TrAC—Trends Anal. Chem. 2019, 110, 150–159. [Google Scholar] [CrossRef]
- Picó, Y.; Barceló, D. Pyrolysis Gas Chromatography-Mass Spectrometry in Environmental Analysis: Focus on Organic Matter and Microplastics. TrAC—Trends Anal. Chem. 2020, 130, 115964. [Google Scholar] [CrossRef]
- La Nasa, J.; Biale, G.; Fabbri, D.; Modugno, F. A Review on Challenges and Developments of Analytical Pyrolysis and Other Thermoanalytical Techniques for the Quali-Quantitative Determination of Microplastics. J. Anal. Appl. Pyrolysis 2020, 149, 104841. [Google Scholar] [CrossRef]
- Chouchene, K.; Nacci, T.; Modugno, F.; Castelvetro, V.; Ksibi, M. Soil Contamination by Microplastics in Relation to Local Agricultural Development as Revealed by FTIR, ICP-MS and Pyrolysis-GC/MS. Environ. Pollut. 2022, 303, 119016. [Google Scholar] [CrossRef] [PubMed]
- Krawczyk-Walach, M.; Gzyra-Jagieła, K.; Milczarek, A.; Jóźwik-Pruska, J. Characterization of Potential Pollutants from Poly(Lactic Acid) after the Degradation Process in Soil under Simulated Environmental Conditions. AppliedChem 2021, 1, 156–172. [Google Scholar] [CrossRef]
- Sun, J.-P.; Sui, S.-J.; Zhang, Z.-J.; Tan, S.; Wang, Q.-W. Study on the Pyrolitic Behavior of Wood-Plastic Composites using Py-GC/MS, “Pyrolysis of WPCs”. BioResources 2013, 8, 6196–6210. [Google Scholar] [CrossRef]
- Sun, C.; Li, C.; Tan, H.; Zhang, Y. Synergistic Effects of Wood Fiber and Polylactic Acid during Co-Pyrolysis Using TG-FTIR-MS and Py-GC/MS. Energy Convers. Manag. 2019, 202, 112212. [Google Scholar] [CrossRef]
- Lin, X.; Zhang, Z.; Sun, J.; Guo, W.; Wang, Q. Effects of Phosphorus-Modified HZSM-5 on Distribution of Hydrocarbon Compounds from Wood-Plastic Composite Pyrolysis Using Py-GC/MS. J. Anal. Appl. Pyrolysis 2015, 116, 223–230. [Google Scholar] [CrossRef]
- Li, Y.; Xia, Z.-X.; Ma, L.-K.; He, Z.-C. Study on the Thermal Decomposition Behavior and Products of Poly(Vinyl Alcohol) and Its LiClO4 Composites via Py/GC/MS. J. Therm. Anal. Calorim. 2022, 147, 7031–7042. [Google Scholar] [CrossRef]
- Vaganov-Vil’kins, A.A.; Rudnev, V.S.; Pavlov, A.D.; Sukhoverkhov, S.V.; Kostin, V.I.; Lukiyanchuk, I.V. IR and Py-GC/MS Investigation of Composite PTFE/PEO Coatings on Aluminum. Mater. Chem. Phys. 2019, 221, 436–446. [Google Scholar] [CrossRef]
- Yousef, S.; Eimontas, J.; Striūgas, N.; Subadra, S.P.; Abdelnaby, M.A. Thermal Degradation and Pyrolysis Kinetic Behaviour of Glass Fibre-Reinforced Thermoplastic Resin by TG-FTIR, Py-GC/MS, Linear and Nonlinear Isoconversional Models. J. Mater. Res. Technol. 2021, 15, 5360–5374. [Google Scholar] [CrossRef]
- Wu, X.; Bourbigot, S.; Li, K.; Zou, Y. Co-Pyrolysis Characteristics and Flammability of Polylactic Acid and Acrylonitrile-Butadiene-Styrene Plastic Blend Using TG, Temperature-Dependent FTIR, Py-GC/MS and Cone Calorimeter Analyses. Fire Saf. J. 2022, 128, 103543. [Google Scholar] [CrossRef]
- Rizzarelli, P.; Rapisarda, M.; Perna, S.; Mirabella, E.F.; La Carta, S.; Puglisi, C.; Valenti, G. Determination of Polyethylene in Biodegradable Polymer Blends and in Compostable Carrier Bags by Py-GC/MS and TGA. J. Anal. Appl. Pyrolysis 2016, 117, 72–81. [Google Scholar] [CrossRef]
- Matsueda, M.; Mattonai, M.; Iwai, I.; Watanabe, A.; Teramae, N.; Robberson, W.; Ohtani, H.; Kim, Y.M.; Watanabe, C. Preparation and Test of a Reference Mixture of Eleven Polymers with Deactivated Inorganic Diluent for Microplastics Analysis by Pyrolysis-GC–MS. J. Anal. Appl. Pyrolysis 2021, 154, 104993. [Google Scholar] [CrossRef]
- Matsui, K.; Ishimura, T.; Mattonai, M.; Iwai, I.; Watanabe, A.; Teramae, N.; Ohtani, H.; Watanabe, C. Identification Algorithm for Polymer Mixtures Based on Py-GC/MS and Its Application for Microplastic Analysis in Environmental Samples. J. Anal. Appl. Pyrolysis 2020, 149, 104834. [Google Scholar] [CrossRef]
- Lou, F.; Wang, J.; Sun, C.; Song, J.; Wang, W.; Pan, Y.; Huang, Q.; Yan, J. Influence of Interaction on Accuracy of Quantification of Mixed Microplastics Using Py-GC/MS. J. Environ. Chem. Eng. 2022, 10, 108012. [Google Scholar] [CrossRef]
- Fischer, M.; Scholz-Böttcher, B.M. Microplastics Analysis in Environmental Samples-Recent Pyrolysis-Gas Chromatography-Mass Spectrometry Method Improvements to Increase the Reliability of Mass-Related Data. Anal. Methods 2019, 11, 2489–2497. [Google Scholar] [CrossRef]
- Pintus, V.; Viana, C.; Angelin, E.M.; De Sá, S.F.; Wienland, K.; Sterflinger, K.; Ferreira, J.L. Applicability of Single-Shot and Double-Shot Py-GC/MS for the Detection of Components in Vinyl Acetate-Based Emulsions Used in Modern-Contemporary Art. J. Anal. Appl. Pyrolysis 2022, 168, 105782. [Google Scholar] [CrossRef]
- Schwarzinger, C.; Leidl, M.; Putz, R. Analysis of Wood Polymer Composites by Two-Stage Pyrolysis-GC/MS. J. Anal. Appl. Pyrolysis 2008, 83, 213–219. [Google Scholar] [CrossRef]
- Shrivastava, A.; Gupta, V. Methods for the Determination of Limit of Detection and Limit of Quantitation of the Analytical Methods. Chron. Young Sci. 2011, 2, 21. [Google Scholar] [CrossRef]
- Ishimura, T.; Iwai, I.; Matsui, K.; Mattonai, M.; Watanabe, A.; Robberson, W.; Cook, A.M.; Allen, H.L.; Pipkin, W.; Teramae, N.; et al. Qualitative and Quantitative Analysis of Mixtures of Microplastics in the Presence of Calcium Carbonate by Pyrolysis-GC/MS. J. Anal. Appl. Pyrolysis 2021, 157, 105188. [Google Scholar] [CrossRef]
- Fischer, M.; Scholz-Böttcher, B.M. Simultaneous Trace Identification and Quantification of Common Types of Microplastics in Environmental Samples by Pyrolysis-Gas Chromatography-Mass Spectrometry. Environ. Sci. Technol. 2017, 51, 5052–5060. [Google Scholar] [CrossRef] [PubMed]
- Lehrle, R.S.; Dadvand, N.; Parsons, I.W.; Rollinson, M.; Horn, I.M.; Skinner, A.R. Pyrolysis-GC-MS Used to Study the Thermal Degradation of Polymers Containing Chlorine III. Kinetics and Mechanisms of Polychloroprene Pyrolysis. Selected Ion Current Plots Used to Evaluate Rate Constants for the Evolution of HCl and Other Degradation Products. Polym. Degrad. Stab. 2000, 70, 395–407. [Google Scholar]
- Dadvand, N.; Lehrle, R.S.; Parsons, I.W.; Rollinson, M. Use of pyrolysis GC-MS to assess the thermal degradation behaviour of polymers containing chlorine. I. The limits of detection and measurement of HCl, deduced from a study of PVC pyrolysis. Polym. Degrad. Stab. 1999, 66, 247–255. [Google Scholar] [CrossRef]
- Hermabessiere, L.; Himber, C.; Boricaud, B.; Kazour, M.; Amara, R.; Cassone, A.L.; Laurentie, M.; Paul-Pont, I.; Soudant, P.; Dehaut, A.; et al. Optimization, Performance, and Application of a Pyrolysis-GC/MS Method for the Identification of Microplastics. Anal. Bioanal. Chem. 2018, 410, 6663–6676. [Google Scholar] [CrossRef] [PubMed]
- Hermabessiere, L.; Rochman, C.M. Microwave-Assisted Extraction for Quantification of Microplastics Using Pyrolysis–Gas Chromatography/Mass Spectrometry. Environ. Toxicol. Chem. 2021, 40, 2733–2741. [Google Scholar] [CrossRef]
- Bourry, D.; Favis, B.D. Morphology Development in a Polyethylene/Polystyrene Binary Blend during Twin-Screw Extrusion. Polymer 1998, 39, 1851–1856. [Google Scholar] [CrossRef]
- Min, K.; White, J.L.; Fellers, J.F. High Density Polyethylene/Polystyrene Blends: Phase Distribution Morphology, Rheological Measurements, Extrusion, and Melt Spinning Behavior. J. Appl. Polym. Sci. 1984, 29, 2117–2142. [Google Scholar] [CrossRef]
- Kallel, T.; Massardier-Nageotte, V.; Jaziri, M.; Gérard, J.F.; Elleuch, B. Compatibilization of PE/PS and PE/PP Blends. I. Effect of Processing Conditions and Formulation. J. Appl. Polym. Sci. 2003, 90, 2475–2484. [Google Scholar] [CrossRef]


| LDPE | PP | PS | PA | PC | |
|---|---|---|---|---|---|
| LDPE + PP | 0.6 ± 0.1 mg | 0.6 ± 0.1 mg | - | - | - |
| LDPE + PS | 0.6 ± 0.1 mg | - | 0.6 ± 0.1 mg | - | - |
| PP + PS | - | 0.6 ± 0.1 mg | 0.6 ± 0.1 mg | - | - |
| PS + PA | - | - | 0.6 ± 0.1 mg | 0.6 ± 0.1 mg | - |
| PP + PS + PC | - | 0.6 ± 0.1 mg | 0.6 ± 0.1 mg | - | 0.6 ± 0.1 mg |
| LDPE + PP + PS | 0.6 ± 0.1 mg | 0.6 ± 0.1 mg | 0.6 ± 0.1 mg | - | - |
| LDPE + PA + PC | 0.6 ± 0.1 mg | - | - | 0.6 ± 0.1 mg | 0.6 ± 0.1 mg |
| LDPE + PS + PA | 0.6 ± 0.1 mg | - | 0.6 ± 0.1 mg | 0.6 ± 0.1 mg | - |
| LDPE + PS + PC | 0.6 ± 0.1 mg | - | 0.6 ± 0.1 mg | - | 0.6 ± 0.1 mg |
| LDPE + PP + PS + PA | 0.6 ± 0.1 mg | 0.6 ± 0.1 mg | 0.6 ± 0.1 mg | 0.6 ± 0.1 mg | - |
| LDPE + PP + PA + PC | 0.6 ± 0.1 mg | 0.6 ± 0.1 mg | - | 0.6 ± 0.1 mg | 0.6 ± 0.1 mg |
| LDPE + PP + PS + PC | 0.6 ± 0.1 mg | 0.6 ± 0.1 mg | 0.6 ± 0.1 mg | - | 0.6 ± 0.1 mg |
| LDPE + PS + PA + PC | 0.6 ± 0.1 mg | - | 0.6 ± 0.1 mg | 0.6 ± 0.1 mg | 0.6 ± 0.1 mg |
| PP + PS + PA + PC | - | 0.6 ± 0.1 mg | 0.6 ± 0.1 mg | 0.6 ± 0.1 mg | 0.6 ± 0.1 mg |
| LDPE + PP + PS + PA + PC | 0.6 ± 0.1 mg | 0.6 ± 0.1 mg | 0.6 ± 0.1 mg | 0.6 ± 0.1 mg | 0.6 ± 0.1 mg |
| HDPE [%wt] | PP [%wt] | PS [%wt] | |
|---|---|---|---|
| 90HDPE-10PP | 90 | 10 | - |
| 70HDPE-30PP | 70 | 30 | - |
| 50HDPE-50PP | 50 | 50 | - |
| 30HDPE-70PP | 30 | 70 | - |
| 10HDPE-90PP | 10 | 90 | - |
| 90HDPE-10PS | 90 | - | 10 |
| 50HDPE-50PS | 50 | - | 50 |
| 10HDPE-90PS | 10 | - | 90 |
| 90PP-10PS | - | 90 | 10 |
| 50PP-50PS | - | 50 | 50 |
| 10PP-90PS | - | 10 | 90 |
| Pyrolyzer | Equilibration time (s) | 5 |
| End time (min) | 5 | |
| Initial temperature (°C) | 70 | |
| Delay time (s) | 0 | |
| Ramp rate 1 (°C/s) | 60 | |
| Hold temperature 1 (°C) | 400 | |
| Ramp rate 2 (°C/s) | 60 | |
| Hold temperature 2 (°C) | 600 | |
| Hold time 2 (s) | 231 | |
| Column flow/inlet pressure time 1 (s) | 180 | |
| GC | Column oven temperature (°C) | 70 |
| Hold time column oven temperature (min) | 1 | |
| Injection temperature (°C) | 100 | |
| Injection mode | Split | |
| Pressure (kPa) | 62.5 | |
| Total row (mL/min) | 84 | |
| Column row (mL/min) | 1 | |
| Linear velocity (cm/s) | 36.8 | |
| Purge flow (mL/min) | 3 | |
| Split ratio | 80 | |
| Rate (°C/min) | 10 | |
| Final temperature (°C) | 300 | |
| Hold time final temperature (min) | 4.5 | |
| Total program time (min) | 28.5 | |
| MS | Ion source temperature (°C) | 200 |
| Interface temperature (°C) | 200 | |
| Solvent cut time (min) | 0.5 | |
| Start time (min) | 1 | |
| End time (min) | 28 | |
| Acquisition mode | Scan | |
| Event time (min) | 0.3 | |
| Scan speed | 250 | |
| Start m/z | 35 | |
| End m/z | 380 |
| Peak Notation | Characteristic Pyrolysis Product | Retention Time (min) | Coming From |
|---|---|---|---|
| E1 | 1,9-decadiene | 6.46 | LDPE |
| E2 | 1-decene | 6.61 | LDPE |
| E3 | Decane | 6.75 | LDPE |
| P1 | 2,4-dimethyl-1-heptene | 4.74 | PP |
| S1 | Styrene | 5.38 | PS |
| A1 | ε-caprolactam | 10.80 | PA |
| C1 | 2,2-bis(4′-methoxylphenyl)propane | 21.2 | PC |
| E1 | E2 | E3 | P1 | S1 | A1 | C1 | |
|---|---|---|---|---|---|---|---|
| LDPE + PP | Detected | Detected | Not detected | Detected | - | - | - |
| LDPE + PS | Detected | Detected | Detected | - | Detected | - | - |
| PP + PS | - | - | - | Detected | Detected | - | - |
| PS + PA | - | - | - | - | Detected | Detected | - |
| PP + PS + PC | - | - | - | Detected | Detected | - | Detected |
| LDPE + PP + PS | Not detected | Detected | Not detected | Detected | Detected | - | - |
| LDPE + PA + PC | Not detected | Detected | Detected | - | - | Detected | Detected |
| LDPE + PS + PA | Not detected | Detected | Detected | - | Detected | Detected | - |
| LDPE + PS + PC | Not detected | Detected | Detected | - | Detected | - | Detected |
| LDPE + PP + PS + PA | Not detected | Detected | Not detected | Detected | Detected | Detected | - |
| LDPE + PP + PA + PC | Not detected | Detected | Not detected | Detected | - | Detected | Detected |
| LDPE + PP + PS + PC | Not detected | Detected | Not detected | Detected | Detected | - | Detected |
| LDPE + PS + PA + PC | Not detected | Detected | Detected | - | Detected | Detected | Detected |
| PP + PS + PA + PC | - | - | - | Detected | Detected | Detected | Detected |
| LDPE + PP + PS + PA + PC | Not detected | Detected | Not detected | Detected | Detected | Detected | Detected |
| Characteristic Pyrolysis Product | Retention Time (min) | Coming From |
|---|---|---|
| 1-decene | 6.61 | HDPE |
| 1-dodecene | 9.47 | HDPE |
| 2,4-dimethyl-1-heptene | 4.69 | PP |
| 1-undecene, 7-methyl- | 11.17 | PP |
| Bibenzyl | 14.10 | PS |
| 2,5-dyphenyl, 1,5-hexadiene | 18.29 | PS |
| Blend | R2 | Intercept SD | Slope | ||
|---|---|---|---|---|---|
| HDPE | 1-decene | HDPE-PP | 0.92 | 2.14 × 10⁶ | 4.70 × 10⁷ |
| HDPE-PS | 0.87 | 3.54 × 10⁶ | 4.70 × 10⁷ | ||
| 1-dodecene | HDPE-PP | 0.89 | 1.42 × 10⁶ | 2.69 × 10⁷ | |
| HDPE-PS | 0.86 | 2.10 × 10⁶ | 2.71 × 10⁷ | ||
| PP | 2,4-dimethyl-1-heptene | HDPE-PP | 0.90 | 6.55 × 10⁶ | 1.29 × 10⁸ |
| PP-PS | 0.95 | 6.94 × 10⁶ | 1.55 × 10⁸ | ||
| 1-undecene, 7-methyl- | HDPE-PP | 0.92 | 1.87 × 10⁶ | 4.35 × 10⁷ | |
| PP-PS | 0.94 | 2.24 × 10⁶ | 4.46 × 10⁷ | ||
| PS | Bibenzyl | HDPE-PS | 0.93 | 7.24 × 10⁵ | 1.36 × 10⁷ |
| PP-PS | 0.91 | 1.11 × 10⁶ | 1.42 × 10⁷ | ||
| 2,5-diphenyl-1,5-hexadiene | HDPE-PS | 0.88 | 6.68 × 10⁵ | 9.60 × 10⁶ | |
| PP-PS | 0.98 | 2.43 × 10⁵ | 9.32 × 10⁶ |
| Blend | LOD [mg] | LOD [%] | LOQ [mg] | LOD [%] | ||
|---|---|---|---|---|---|---|
| HDPE | 1-decene | HDPE-PP | 0.15 | 25 | 0.45 | 77 |
| HDPE-PS | 0.24 | 32 | 0.70 | 97 | ||
| 1-dodecene | HDPE-PP | 0.17 | 28 | 0.52 | 88 | |
| HDPE-PS | 0.26 | 33 | 0.79 | - | ||
| PP | 2,4-dimethyl-1-heptene | HDPE-PP | 0.17 | 28 | 0.52 | 85 |
| PP-PS | 0.15 | 25 | 0.45 | 75 | ||
| 1-undecene, 7-methyl- | HDPE-PP | 0.14 | 23 | 0.42 | 72 | |
| PP-PS | 0.17 | 28 | 0.52 | 83 | ||
| PS | Bibenzyl | HDPE-PS | 0.18 | 25 | 0.55 | 77 |
| PP-PS | 0.26 | 42 | 0.79 | - | ||
| 2,5-diphenyl-1,5-hexadiene | HDPE-PS | 0.23 | 38 | 0.70 | - | |
| PP-PS | 0.09 | 15 | 0.27 | 43 |
Disclaimer/Publisher’s Note: The statements, opinions and data contained in all publications are solely those of the individual author(s) and contributor(s) and not of MDPI and/or the editor(s). MDPI and/or the editor(s) disclaim responsibility for any injury to people or property resulting from any ideas, methods, instructions or products referred to in the content. |
© 2023 by the authors. Licensee MDPI, Basel, Switzerland. This article is an open access article distributed under the terms and conditions of the Creative Commons Attribution (CC BY) license (https://creativecommons.org/licenses/by/4.0/).
Share and Cite
Gnoffo, C.; Frache, A. Identification of Plastics in Mixtures and Blends through Pyrolysis-Gas Chromatography/Mass Spectrometry. Polymers 2024, 16, 71. https://doi.org/10.3390/polym16010071
Gnoffo C, Frache A. Identification of Plastics in Mixtures and Blends through Pyrolysis-Gas Chromatography/Mass Spectrometry. Polymers. 2024; 16(1):71. https://doi.org/10.3390/polym16010071
Chicago/Turabian StyleGnoffo, Chiara, and Alberto Frache. 2024. "Identification of Plastics in Mixtures and Blends through Pyrolysis-Gas Chromatography/Mass Spectrometry" Polymers 16, no. 1: 71. https://doi.org/10.3390/polym16010071
APA StyleGnoffo, C., & Frache, A. (2024). Identification of Plastics in Mixtures and Blends through Pyrolysis-Gas Chromatography/Mass Spectrometry. Polymers, 16(1), 71. https://doi.org/10.3390/polym16010071