1. Introduction
Sounds are vibrations that travel through an elastic medium and can be sensed by the human ear. This means that the vibrations corresponding to the sounds must have a certain intensity and, respectively, a certain frequency that makes it possible to sense them via a membrane in the human ear. Intensity and frequency are two essential characteristics of sounds, to which, from a musical point of view, duration and timbre are added. Unlike vibrations co-responsive to sounds, noises are vibrations less desired or agreed upon by human beings.
In general, sounds have a frequency between 16 Hz and 20 kHz, but it is also possible for some people to perceive frequencies slightly lower than 16 Hz, just as other people can perceive sounds with frequencies slightly higher than 20 kHz. With age, the ability of the human ear to detect sounds characterized by high frequencies decreases.
Using sounds, people can communicate. They can detect the proximity of vehicles, the presence of other beings, or natural or artificial systems capable of generating or reflecting sounds.
It is normal for sounds to be absorbed by different media, as there may be situations where sounds are amplified.
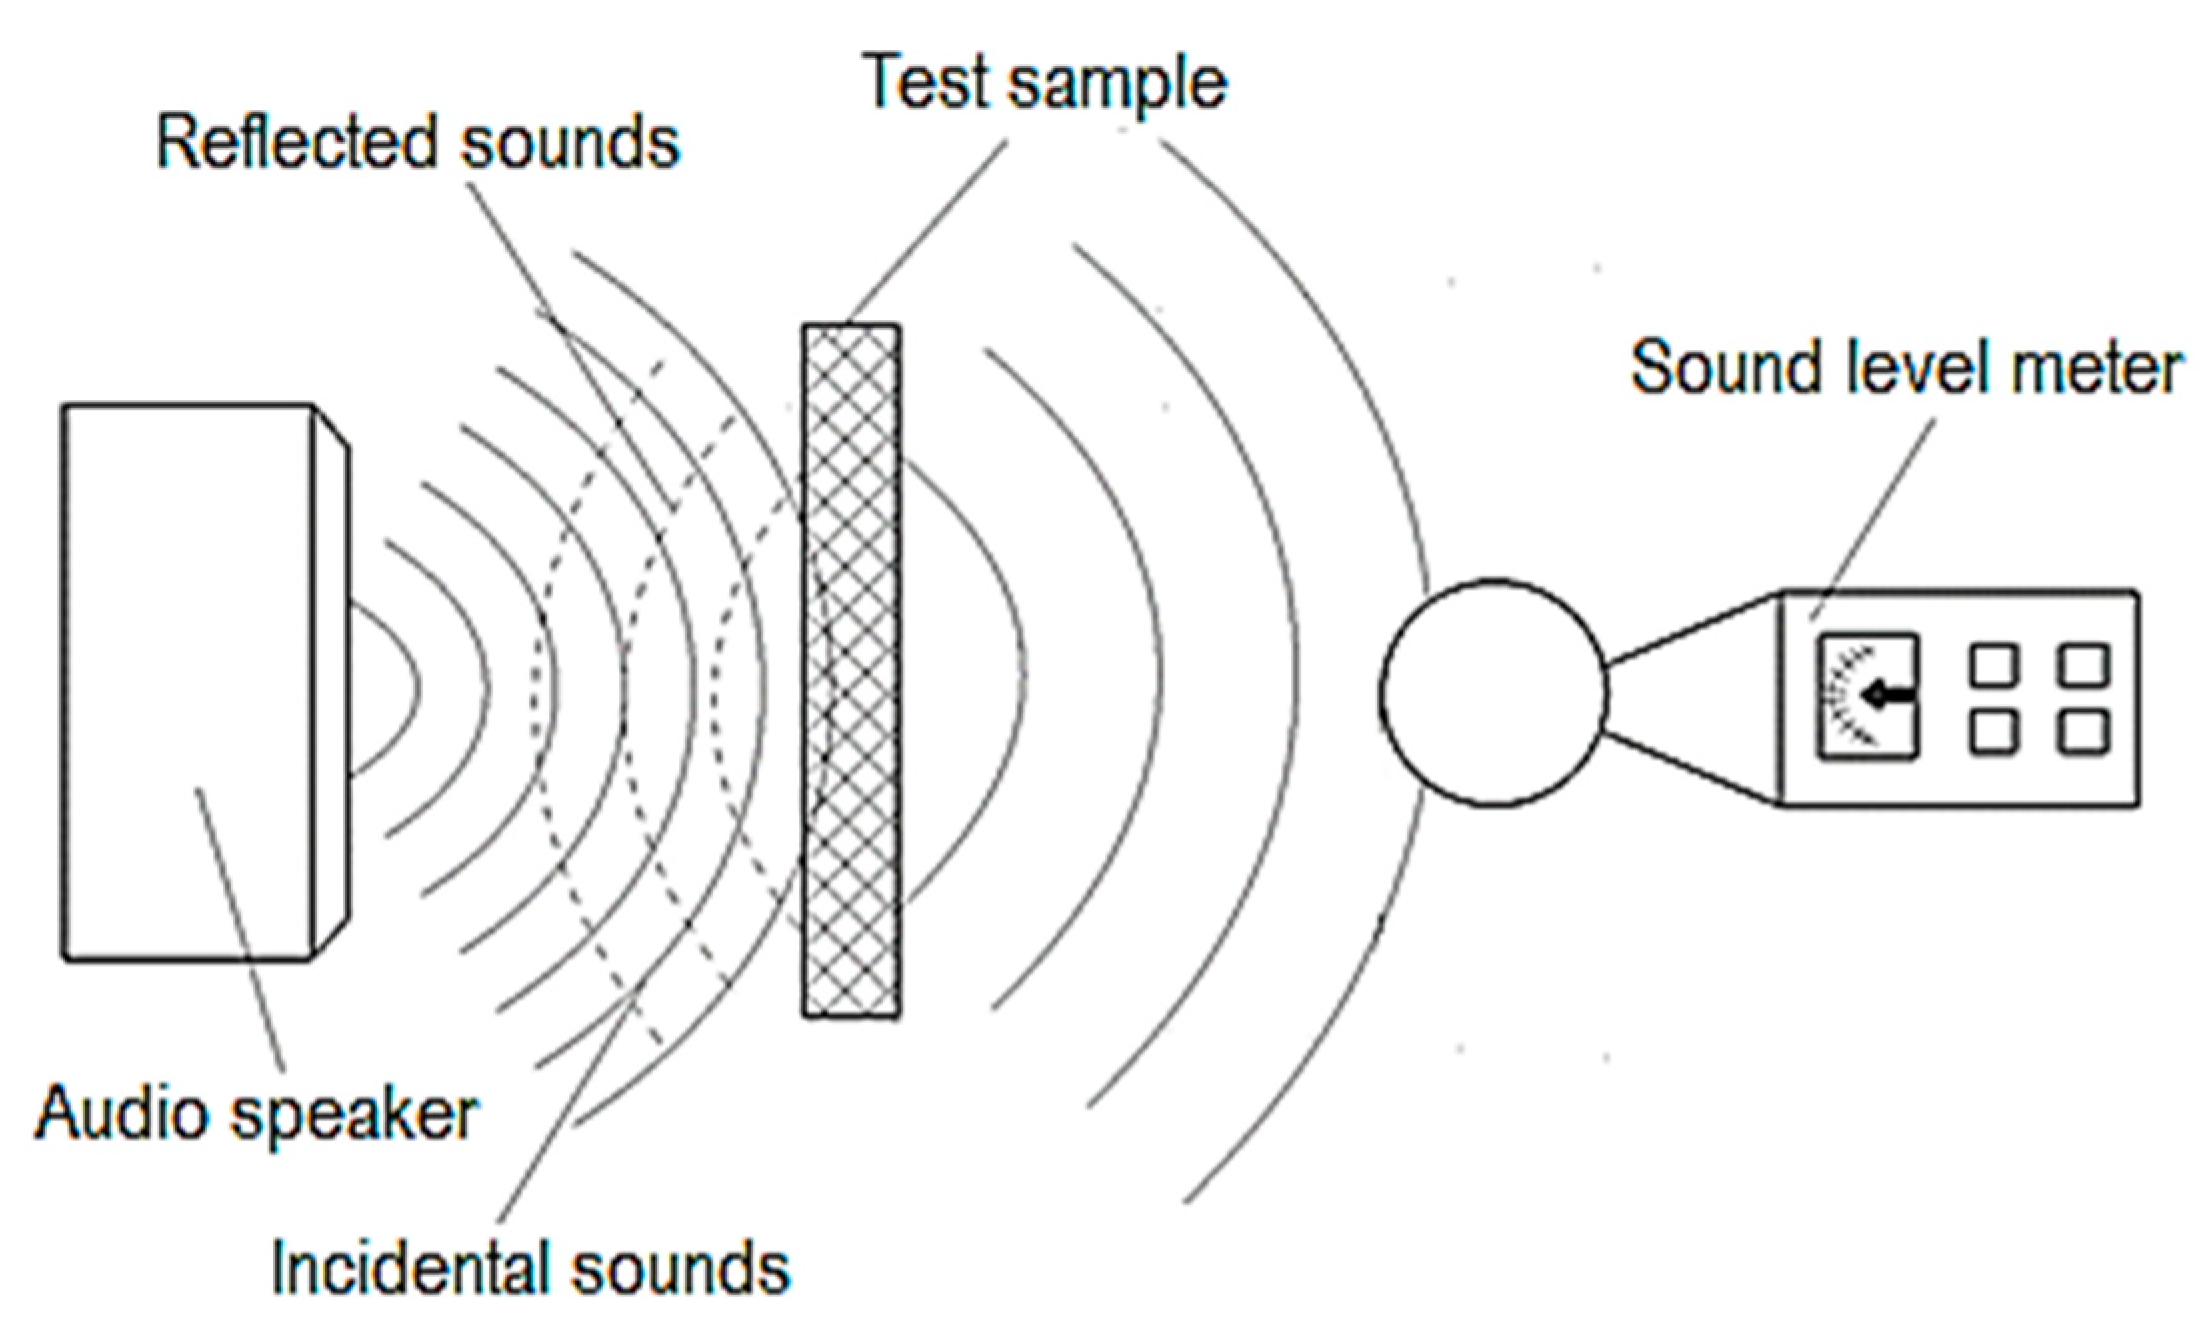
It is known that sounds propagate at speeds that differ from the constitution of the environment they travel through. Thus, the sound propagation speed can have distinct values in different environments. If sounds propagate in the air with speeds of 330–350 m/s, in water, the sound propagation speed can be 1–4 m/s, while in a steel piece, the sound speed can have values of 5100 to 5900 m/s. In parts made of solid materials, sounds propagate through successive elongations and contractions of some areas of the part (
Figure 1).
The situation in which the absorption of sound energy by the environment is necessary occurs mainly when the problem of so-called sound insulation is raised, when technical measures are taken that are mainly aimed at reducing the intensity of sounds. In such a case, the problem of identifying and determining the characteristics of materials with sound insulation properties arises.
The emergence of 3D printing processes has led, among other things, to the need to evaluate the ability of materials from 3D printed parts to be used as insulating materials from a sound point of view, and such a problem has been addressed by researchers in the field of manufacturing parts from polymeric materials by 3D printing.
Thus, Alfarisi et al. (2021) investigated the problem of improving the quality of sounds in the case of a music box for which some components were made by 3D printing [
1]. They used the finite element method to identify possibilities for improving the materials’ ability to transmit sounds.
King et al. have addressed the problem of studying the ability of some panels made by 3D printing to absorb noise using a sound impedance tube [
2]. They found that a model characterized by a micro-perforated design can absorb noises characterized by a frequency between 100 and 6400 Hz.
Vasina et al. studied the sound absorption properties of open-porous acrylonitrile butadiene styrene structures manufactured by 3D printing technologies [
3]. One of their conclusions was that the sound absorption properties of the samples made from the investigated material could be significantly influenced by the type of 3D printing process, the structure of the material, the frequency of excitation, the thickness of the sample, and the size of the interstice in the back of the absorbent material panel.
Hrițuc et al. proposed using equipment to study sound propagation through small panels manufactured by 3D printing [
4,
5]. They researched the influence of different factors on the sound pressure level after passing sounds through such panels.
The experimental research carried out has shown that the main factors or groups of factors able to influence the sound propagation capacity of some materials incorporated in parts manufactured by 3D printing are the following:
The nature of the sample material [
3,
6,
7,
8];
The proportion of different materials in the sample [
6];
The structure corresponding to the arrangement of the material in parts [
2,
3,
9,
10,
11,
12,
13,
14,
15,
16,
17,
18,
19,
20];
Imperfections in the sample material [
14,
17];
The size of the so-called “throat effect” (the throat is the smallest aperture in a series of interconnected pores) [
9,
10,
21];
Test sample manufacturing technology [
7,
14,
17];
The shape of the cavity in which the testing is performed [
22];
The frequency of sounds that pass through parts manufactured by 3D printing [
3,
5,
6,
8,
9,
12,
14,
15,
20,
22];
The acoustic pressure level [
5];
The distance from the test sample to the sound receiver [
3,
12,
15];
The parameters corresponding to the 3D printing process [
5,
7], etc.
Sounds are generated by operating various categories of equipment, by a loudspeaker or by the voice boxes of humans or other animals, by the rubbing of wings by some insects, etc. For example, the operation of a crank-rod mechanism, an internal combustion engine, an electric motor, a percussive hammer, etc., is accompanied by the generation of vibrations that, if they have a certain intensity and a frequency within certain limits, can be perceived by the ear of the human being. If sounds can be produced by moving or striking parts in the case of some mechanical equipment, there are also structural transformations of certain metallic materials associated with generating sounds.
Objectives deriving from communication or entertainment equipment led to the appearance of audio speakers. Such loudspeakers convert electrical energy into mechanical energy that manifests in vibrations with characteristics corresponding to the sound field. Such loudspeakers have a fixed magnet near a coil through which an electric current flows, characterized by a variation in the intensity of the electric current in the audio frequency range. The electromagnet is solidarized with a flexible cone that is intended to amplify and direct the sounds. The interaction between the fields generated by the fixed magnet and the movable electromagnet drives the flexible material cone into motion, thus producing sounds.
As a rule, the passage of sounds through test samples made of different materials is studied using the so-called sound impedance tubes [
18,
24]. Indications regarding the measurement of sound absorption level when passing through different media have been included in two main standards regarding this field of research [
25,
26].
The equipment used to determine the sound absorption coefficient requires small samples in the form of discs inserted into the tube through which the sounds reflected by the walls of the cylindrical glass enclosure will also pass. A variant of the tube impedance is used in the two-microphone impedance method [
12]. Maroo and Wright appreciated that the common impedance tube could not be used to determine sound transmission loss in the case of samples manufactured by 3D printing, especially in the case of high frequencies. For this reason, a small reverberation room was used [
19]. Shtrepi and Prato showed that the currently used methods for studying the absorption of sounds by different materials have some disadvantages. For example, the impedance tube is less suitable for 3D systems, and a real reverberation chamber requires test pieces of large dimensions [
27]. The research results completed through a doctoral thesis on designing a new reverberation chamber usable for characterizing sound transmission loss in the case of multi-material samples manufactured by 3D printing were published in 2021 by Maroo [
28]. A reverberation chamber has been used by Peng et al. for the research of sound transmission loss in the case of some aircraft composite panels of large dimensions, which were not manufactured by 3D printing [
29].
The content of this article is intended to highlight the behavior of small panels made of two polymeric materials by 3D printing when such panels are used as sound insulating materials. A finite element modeling was used to theoretically investigate the process of sound propagation through polymer panels. Later, using the results of some experimental research, empirical mathematical models were determined, and such models highlight the influence exerted by different factors on the acoustic pressure level of the sounds that passed through small panels made of 3D-printed polymer materials.
2. Materials and Methods
2.1. Propagation of Sounds through Panels Made of Polymeric Materials
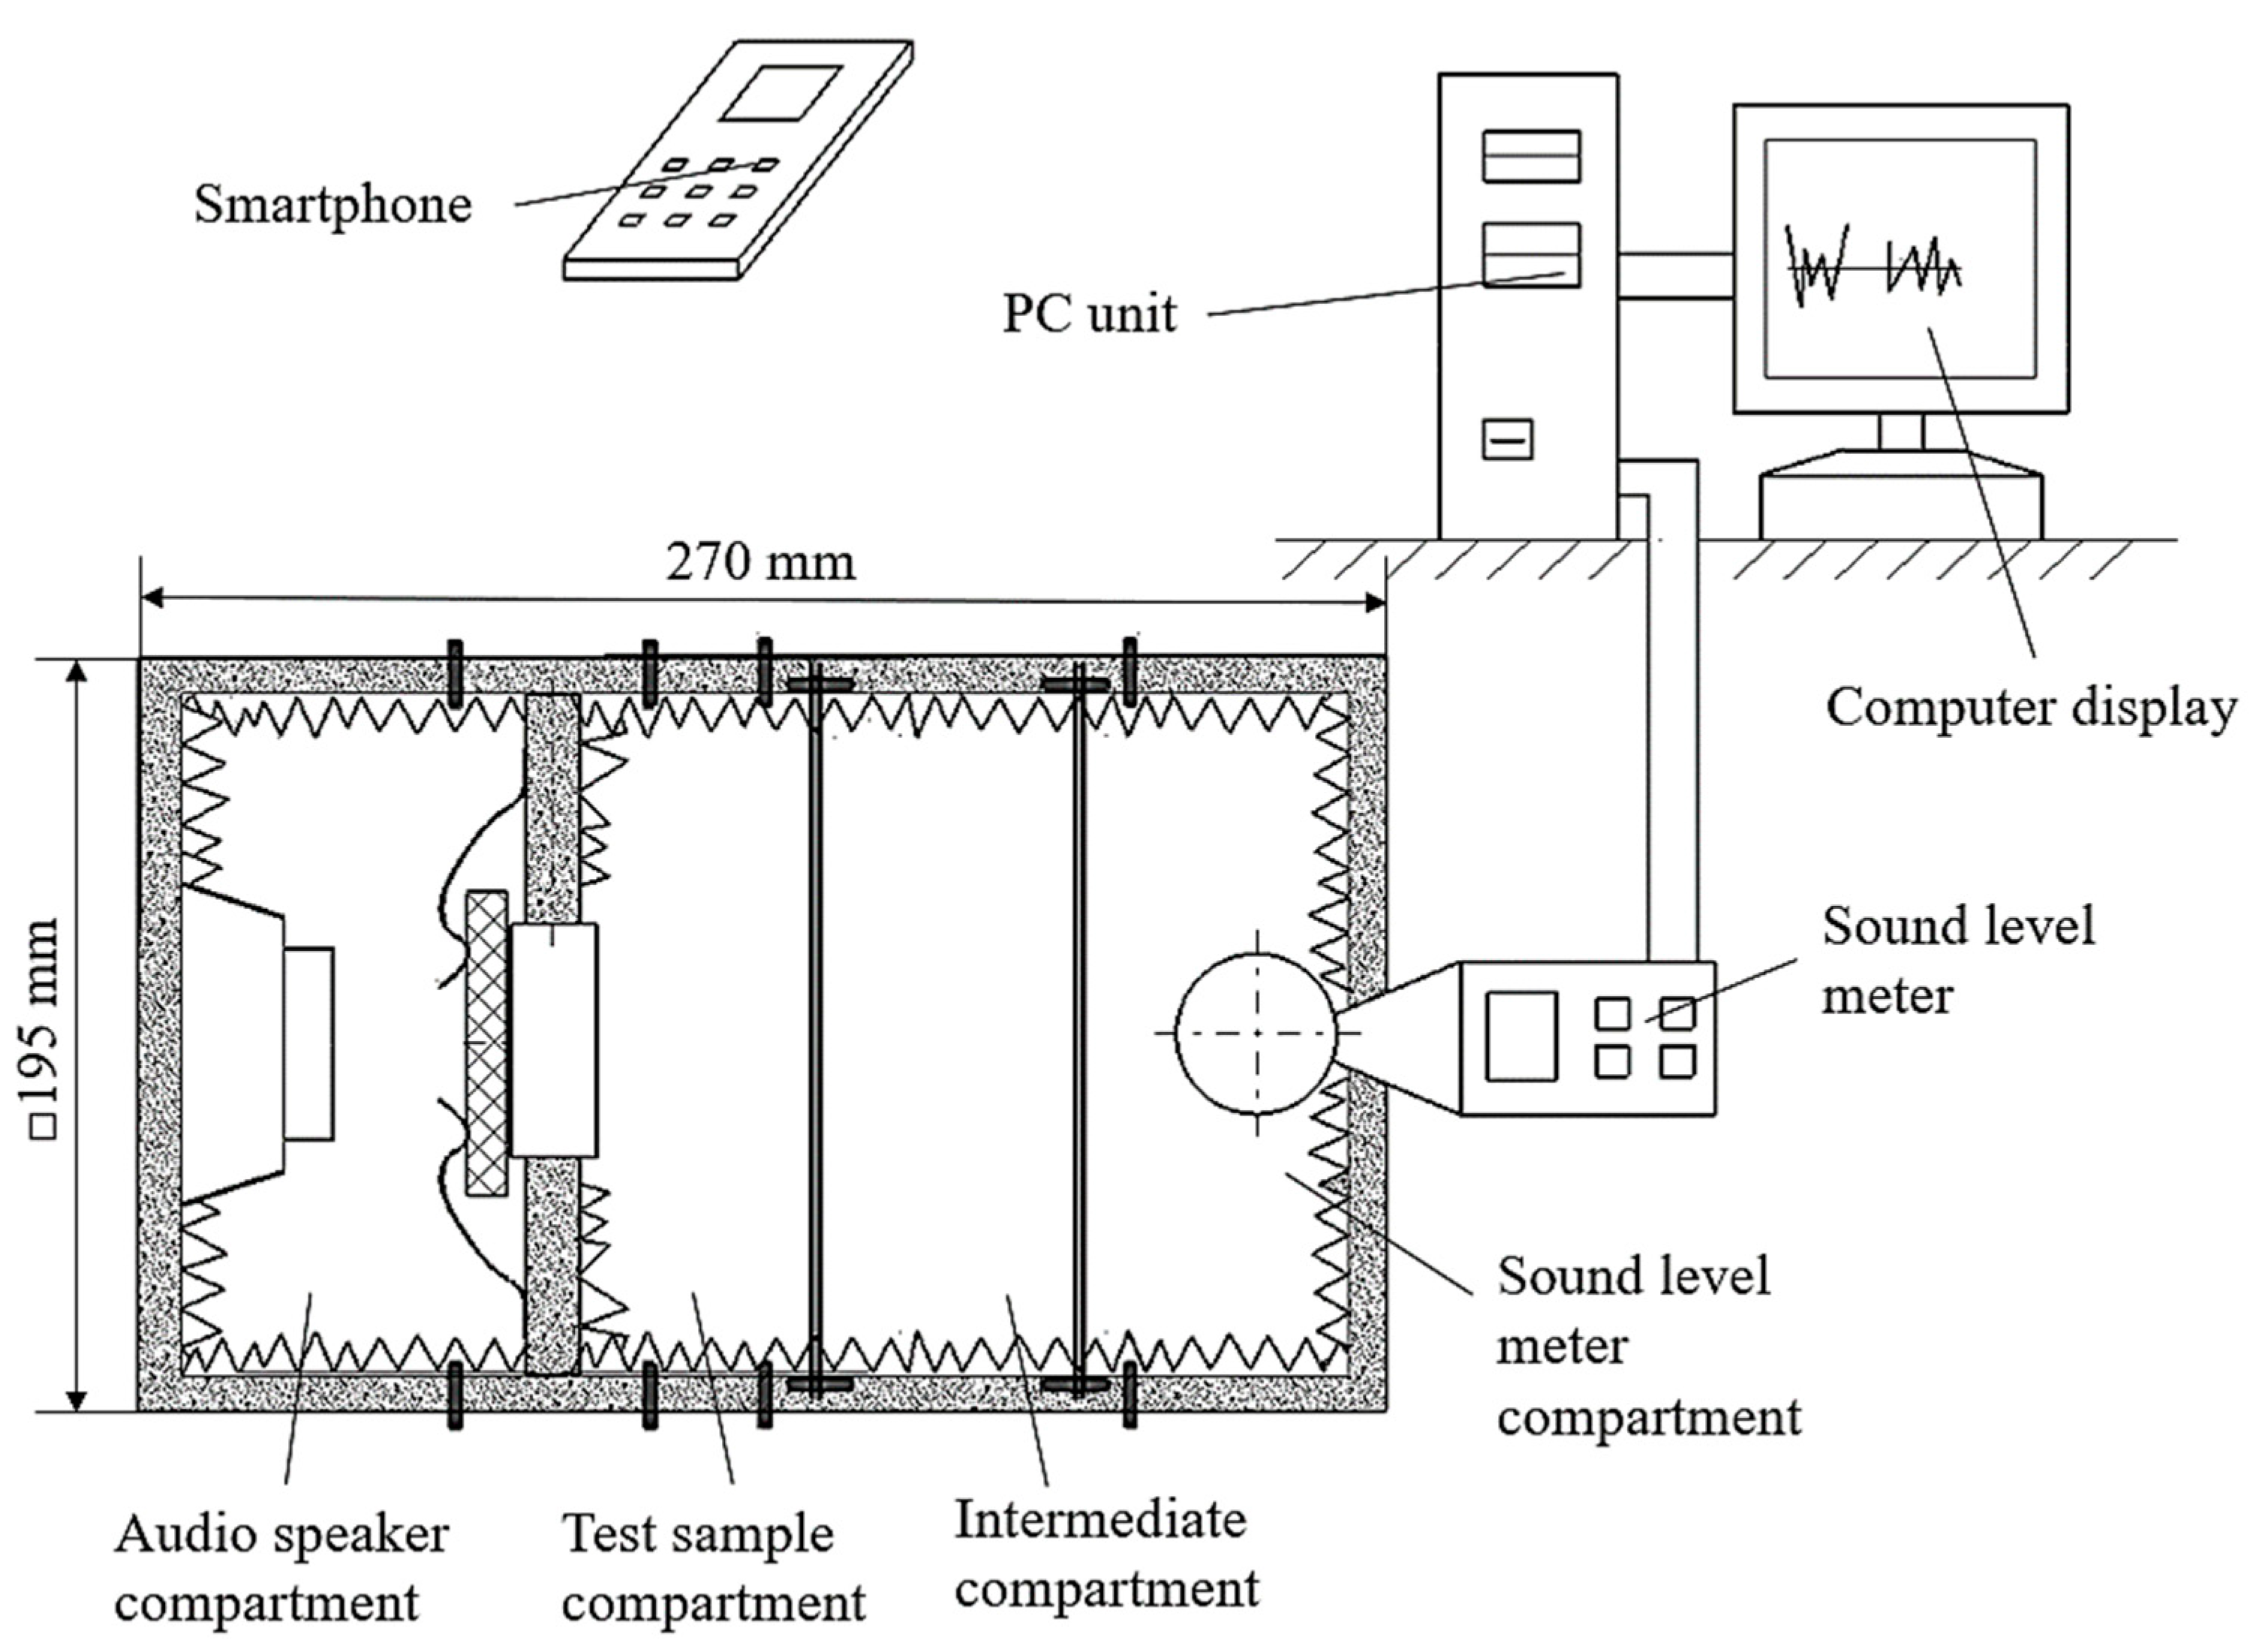
In the research framework, the results of which are presented in this paper, an audio mini speaker was used to generate sounds with variable frequencies and amplitudes (
Figure 2). This audio mini speaker is model Bass, from Andowl, China, being a mini portable wireless speaker. The sounds generated by the audio mini speaker pass through a small panel made of polymer material. The polymer material panel was manufactured by 3D printing. Later, the sounds reach the sensor of a sound level meter, which will provide information about the characteristics of the sounds that have passed through the polymer material panel. The sound level meter is a digital instrument from Ckinnfon, model HY1361, Mainland, China. The three main components (the audio mini speaker, the polymer material panel, and the sound level meter) were placed in enclosures lined on the inside with a material capable of absorbing the energy of sound vibrations.
In principle, the velocity
vg of sound in gases is considered to correspond to a shape relation:
where
K is the bulk modulus and
ρ is the gas density.
In the case of solid materials, the sound propagation speed can be evaluated using a shape relationship:
where
E is the Young’s modulus and
ρ is the density of the solid material.
In the case of macroporous polymers, the presence of the compressible air-filled pores contributes to a reduction of the longitudinal sound speed
vl, reaching [
30] values consistent with the equation:
where
M is the longitudinal modulus, and
ρ is the mass density of the porous material.
The speed of sounds in a body made of polymeric material can have different values, for example, from 1950 m/s in the case of polyethylene of low density to 2270 m/s in the case of polycarbonate and 2430 m/s in the case of polyethylene of high density.
Equations (1)–(3) highlight the fact that elements characterizing the nature and properties of the medium through which the sound waves propagate are capable of exerting an important influence on the energy carried by these waves and that measuring the sound energy can provide information on the capacity of different media to absorb, to a greater or lesser extent, the energy of the sound waves.
2.2. Experimental Conditions
The experimental research aimed to highlight the influence exerted by some factors on the reduction of the sound intensity level after passing the sounds through some small panels made of polymer materials by 3D printing.
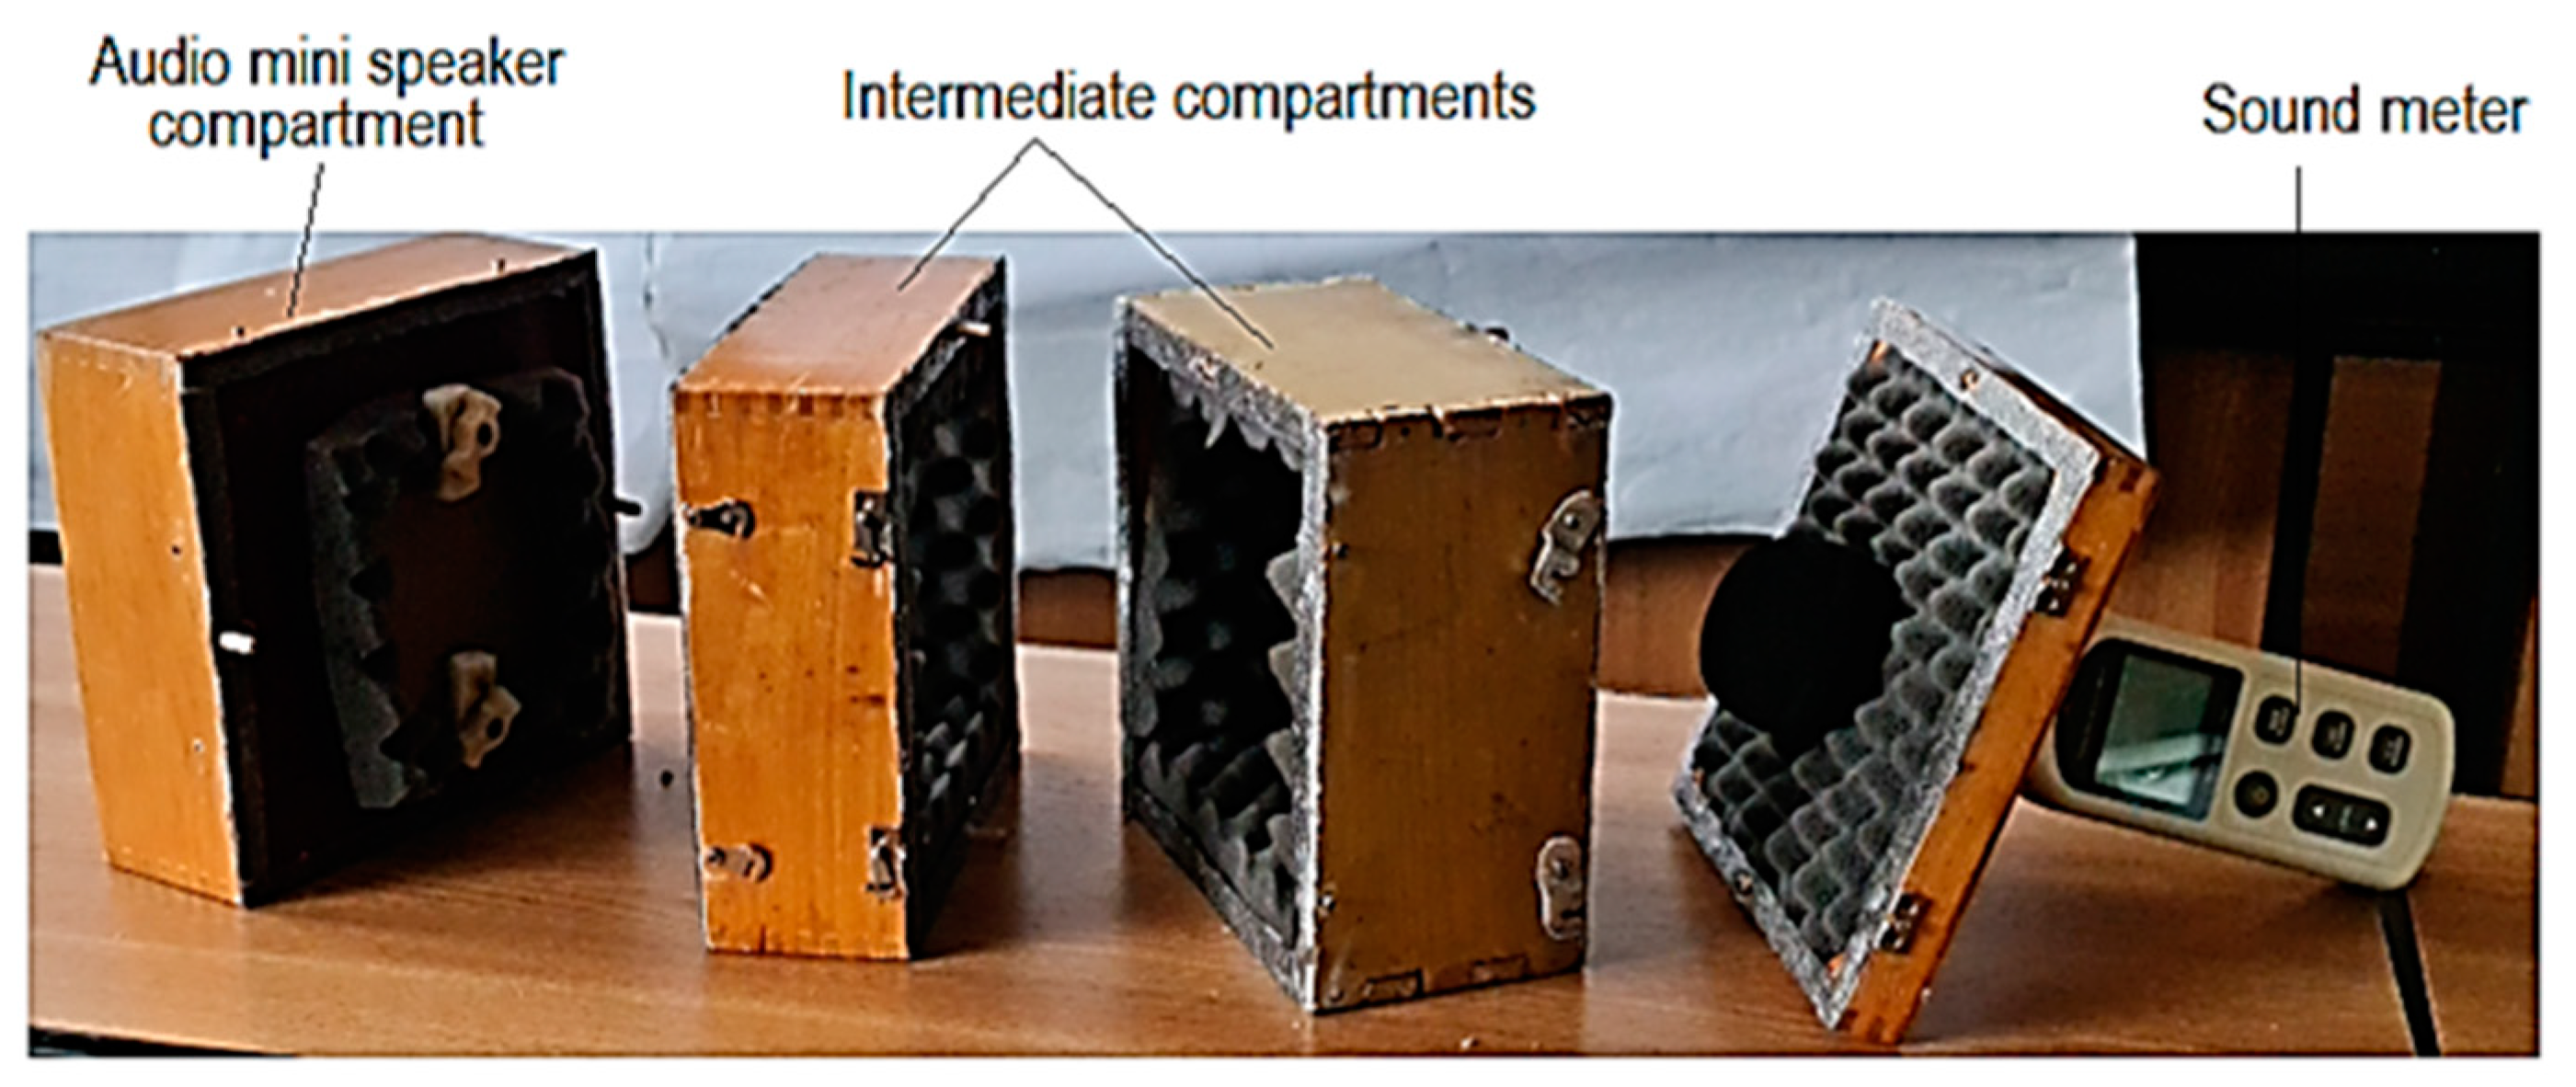
In the case of the present research, we resorted to using equipment made up of several distinct compartments (
Figure 2). It can be seen that there is a compartment in which the audio mini speaker was fixed. A second compartment allowed for the locating and clamping of the polymer sample through which the sound waves pass. Another compartment was where the sensor of a sound level meter was located. An intermediate compartment was provided to include the development of some experimental research on the influence of the distance between the audio mini speaker and the sensor of the sound level meter. The four compartments are made of wooden boards and assembled using wooden pins. To reduce the risk of the wooden walls of the premises influencing the intensity of sounds received by the sound level meter sensor, the interior surfaces of the compartments with wooden walls were covered with a porous polymeric material characterized by a high capacity of sound absorption.
An audio mini speaker type Andowl M10 was used (
Figure 3 and
Figure 4). The application use for phone control (using Bluetooth) of the mini audio speaker was the Frequency Generator built by LuxdeLux, being an online resource, specifically, an Android app, available on Play Store from Google.
The intensity of the influence exerted by different factors on an output parameter corresponding to the process of passing sounds through a small panel manufactured by 3D printing is dependent on the nature of the panel material, the thickness of its wall, some characteristics of the materials embedded in the panel that depends on the 3D printing conditions, the level of acoustic pressure and the frequency of the sound generated by a certain voltage source, etc.
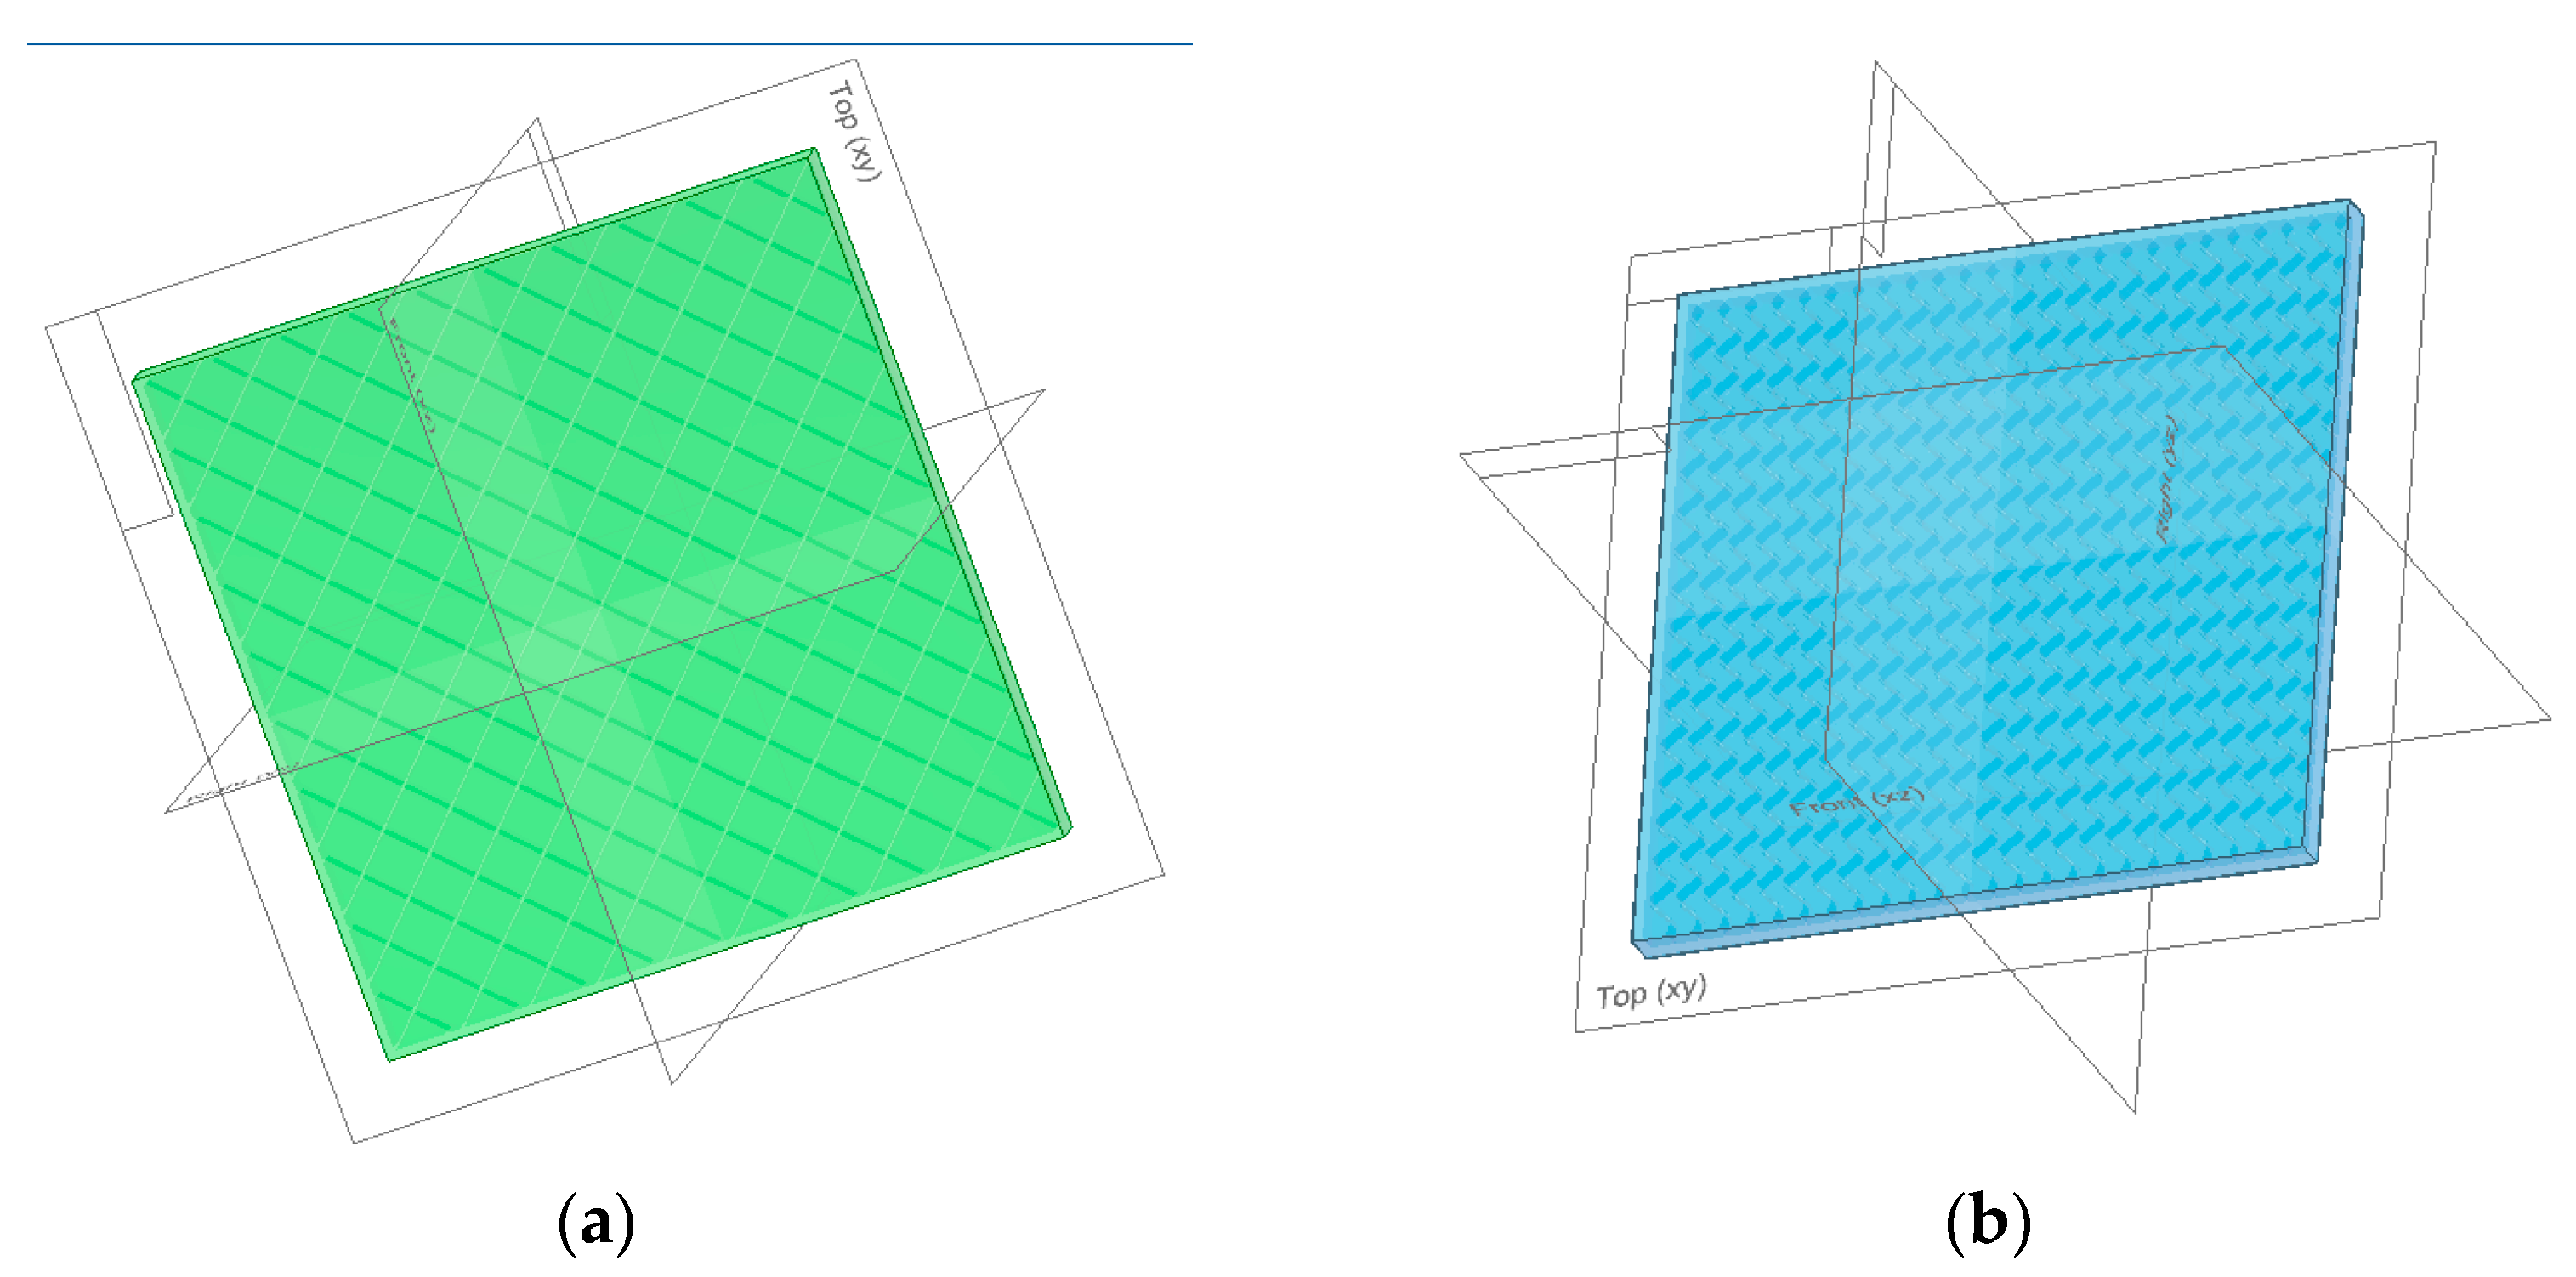
Polylactic acid (PLA, produced by Filamentum, Fillamentum Manufacturing Czech s.r.o., Nám. Míru 1217, 768 24 Hulín, Czech Republic), high-impact polystyrene (HIPS, produced by Formfutura as EasyFil HIPS, Tarweweg 3, 6534 AM Nijmegen. The Netherlands), and polyethylene terephthalate glycol (PETG, produced by PrimaSelect as PrimaSelect™ PETG, PrimaCreator, Kantyxegatan 25 F, 213 76 Malmö, Sweden) were used as materials for the small panels. Some properties of the three materials are presented in
Table 1. The three polymeric materials were chosen to be easily accessible and present different physical–mechanical properties. It was assumed that such materials would also have different sound insulation properties.
During the experimental tests, we noted some characteristics of the small panels (thickness and type of material), some parameters specific to the 3D printing process (being selected, in the present case, printing speed vp, infill percent i, infill pattern ip, and the thickness of the deposited layer t), and also some characteristics of the sounds generated by the audio mini speaker (frequency f and sound volume s).
The design of the experimental tests was carried out by considering an L18-type Taguchi factorial experiment, with seven input factors having three-level variance values and one input factor with two-level variation values. For the selection of the input factor with a two-level variation, it was assumed that an increase in the thickness t of the small panel would lead to a monotonous decrease (hence, one without maxima or minima) of the sound intensity, which would make it more appropriate to use only two levels of variation for the input factor (independent variable) mentioned.
Thus, the thickness t of the small panels (t1 = 1 mm and t2 = 5 mm) was selected as an input factor with values on two levels. The small panels had a surface with an area of 100 × 100 mm2. An Ultimaker 3 printer (Eindhoven, The Netherlands) was used for the 3D printing of panels from different polymer materials.
In the case of factors with values on three levels of variation, the nature of the material from the small panel (three distinct materials, these being the polylactic acid, which was assigned the value of mPLA = 1; high impact polystyrene HIPS, which was taken into account considering mHIPS = 2; and, respectively, polyethylene terephthalate glycol PETG, for which a symbol with the value mPETG = 3 was used), along with 3D printing speed (vp1 = 20 mm/s, vp2 = 40 mm/s, vp3 = 60 m/s), infill percentage i (i1 = 18%, i2 = 48%, i3 = 78%), infill pattern (ip1 for grid, ip2 for cubic, ip3 for gyroid), the thickness of the deposited layer (t1 = 0.05 mm, t2 = 0.1 mm, t3 = 0.15 mm), sound frequency (f1 = 5000 Hz, f2 = 10,000 Hz, f3 = 15,000 Hz), and sound volume s, expressed as a percentage of the maximum sound volume generated by the micro audio speaker used (s1 = 30%, s2 = 50%, s3 = 100%), were accounted for.
As output parameters from the analyzed process, the sound pressure level or sound pressure (this being a measure of the sound energy emitted by a sound source) was used. The unit of measure for evaluating the sound pressure level is the decibel, and it is the decimal logarithm of the ratio between the measured sound pressure and the reference sound pressure po = 2 × 10⁻⁵ Pa (the pressure that can be sensed by the human being, corresponding to a frequency of 1 kHz).
It is relatively common to measure acoustic pressure with the help of sound level meters.
The present research measured the acoustic pressure level using a sound level meter that can be connected to a computer. The use of specialized software allows us to highlight on the computer screen the evolution over time of the acoustic pressure level of the sound received under different conditions.
The values of the input factors (of the independent variables) were included in
Table 2. For each input factor in the investigated process, the coded value according to the Taguchi methodology for an L18-type factorial experiment and the actual value of that factor were included. Also, control samples have been 3D printed considering the infill percentage parameter; it has been 6% and 96%, with the default type of infill assigned per percentage value. Each group of materials received two control samples. The results were consistent with the ones presented for the 18 samples.
4. Discussion
The validation of the empirical mathematical model proposed by Equation (5) can be performed by making an additional experimental test using for one independent variable or for several independent variables, other values different from those used to generate the empirical mathematical models, by processing the experimental results. In the case of the mathematical model represented by Equation (5), an additional experimental test was performed. Experiment no. 18 from
Table 2 was taken into account. The following values of the independent variables were used:
t = 5 mm;
m = 3 (corresponding to PETG material);
v = 60 mm/s;
i = 48%;
ip = grid;
l = 0.1 mm;
f = 8000 Hz; and
s = 7500 Hz. It can be seen that the last two independent variables (
f și
s) had values other than those used to determine the empirical mathematical model corresponding to Equation (5) in the case of experiment no. 18.
For these independent variables’ values, the Δpac parameter value, determined using the empirical mathematical model (5), was 17.31 dB. Through the experimental test, the values I0 = 117.5 dB were obtained without the panel and, respectively, Ip = 101.2 dB when the PETG panel was placed between the mini audio speaker and the sensor of the sound level meter. The difference between the two measured values leads to a value of Δpac = 16.3 dB. It is thus possible to determine a percentage difference between the value determined using the identified empirical mathematical model and the value obtained using the experimental result of the additional test Δ = (17.31 − 16.3) × 100/17.31 = 5.83%. It can thus be appreciated that the proposed empirical mathematical model can be considered validated.
The analysis of Equations (6) and (7)—and, respectively, of the graphic representations in
Figure 7,
Figure 8 and
Figure 9—facilitated the formulation of the following findings.
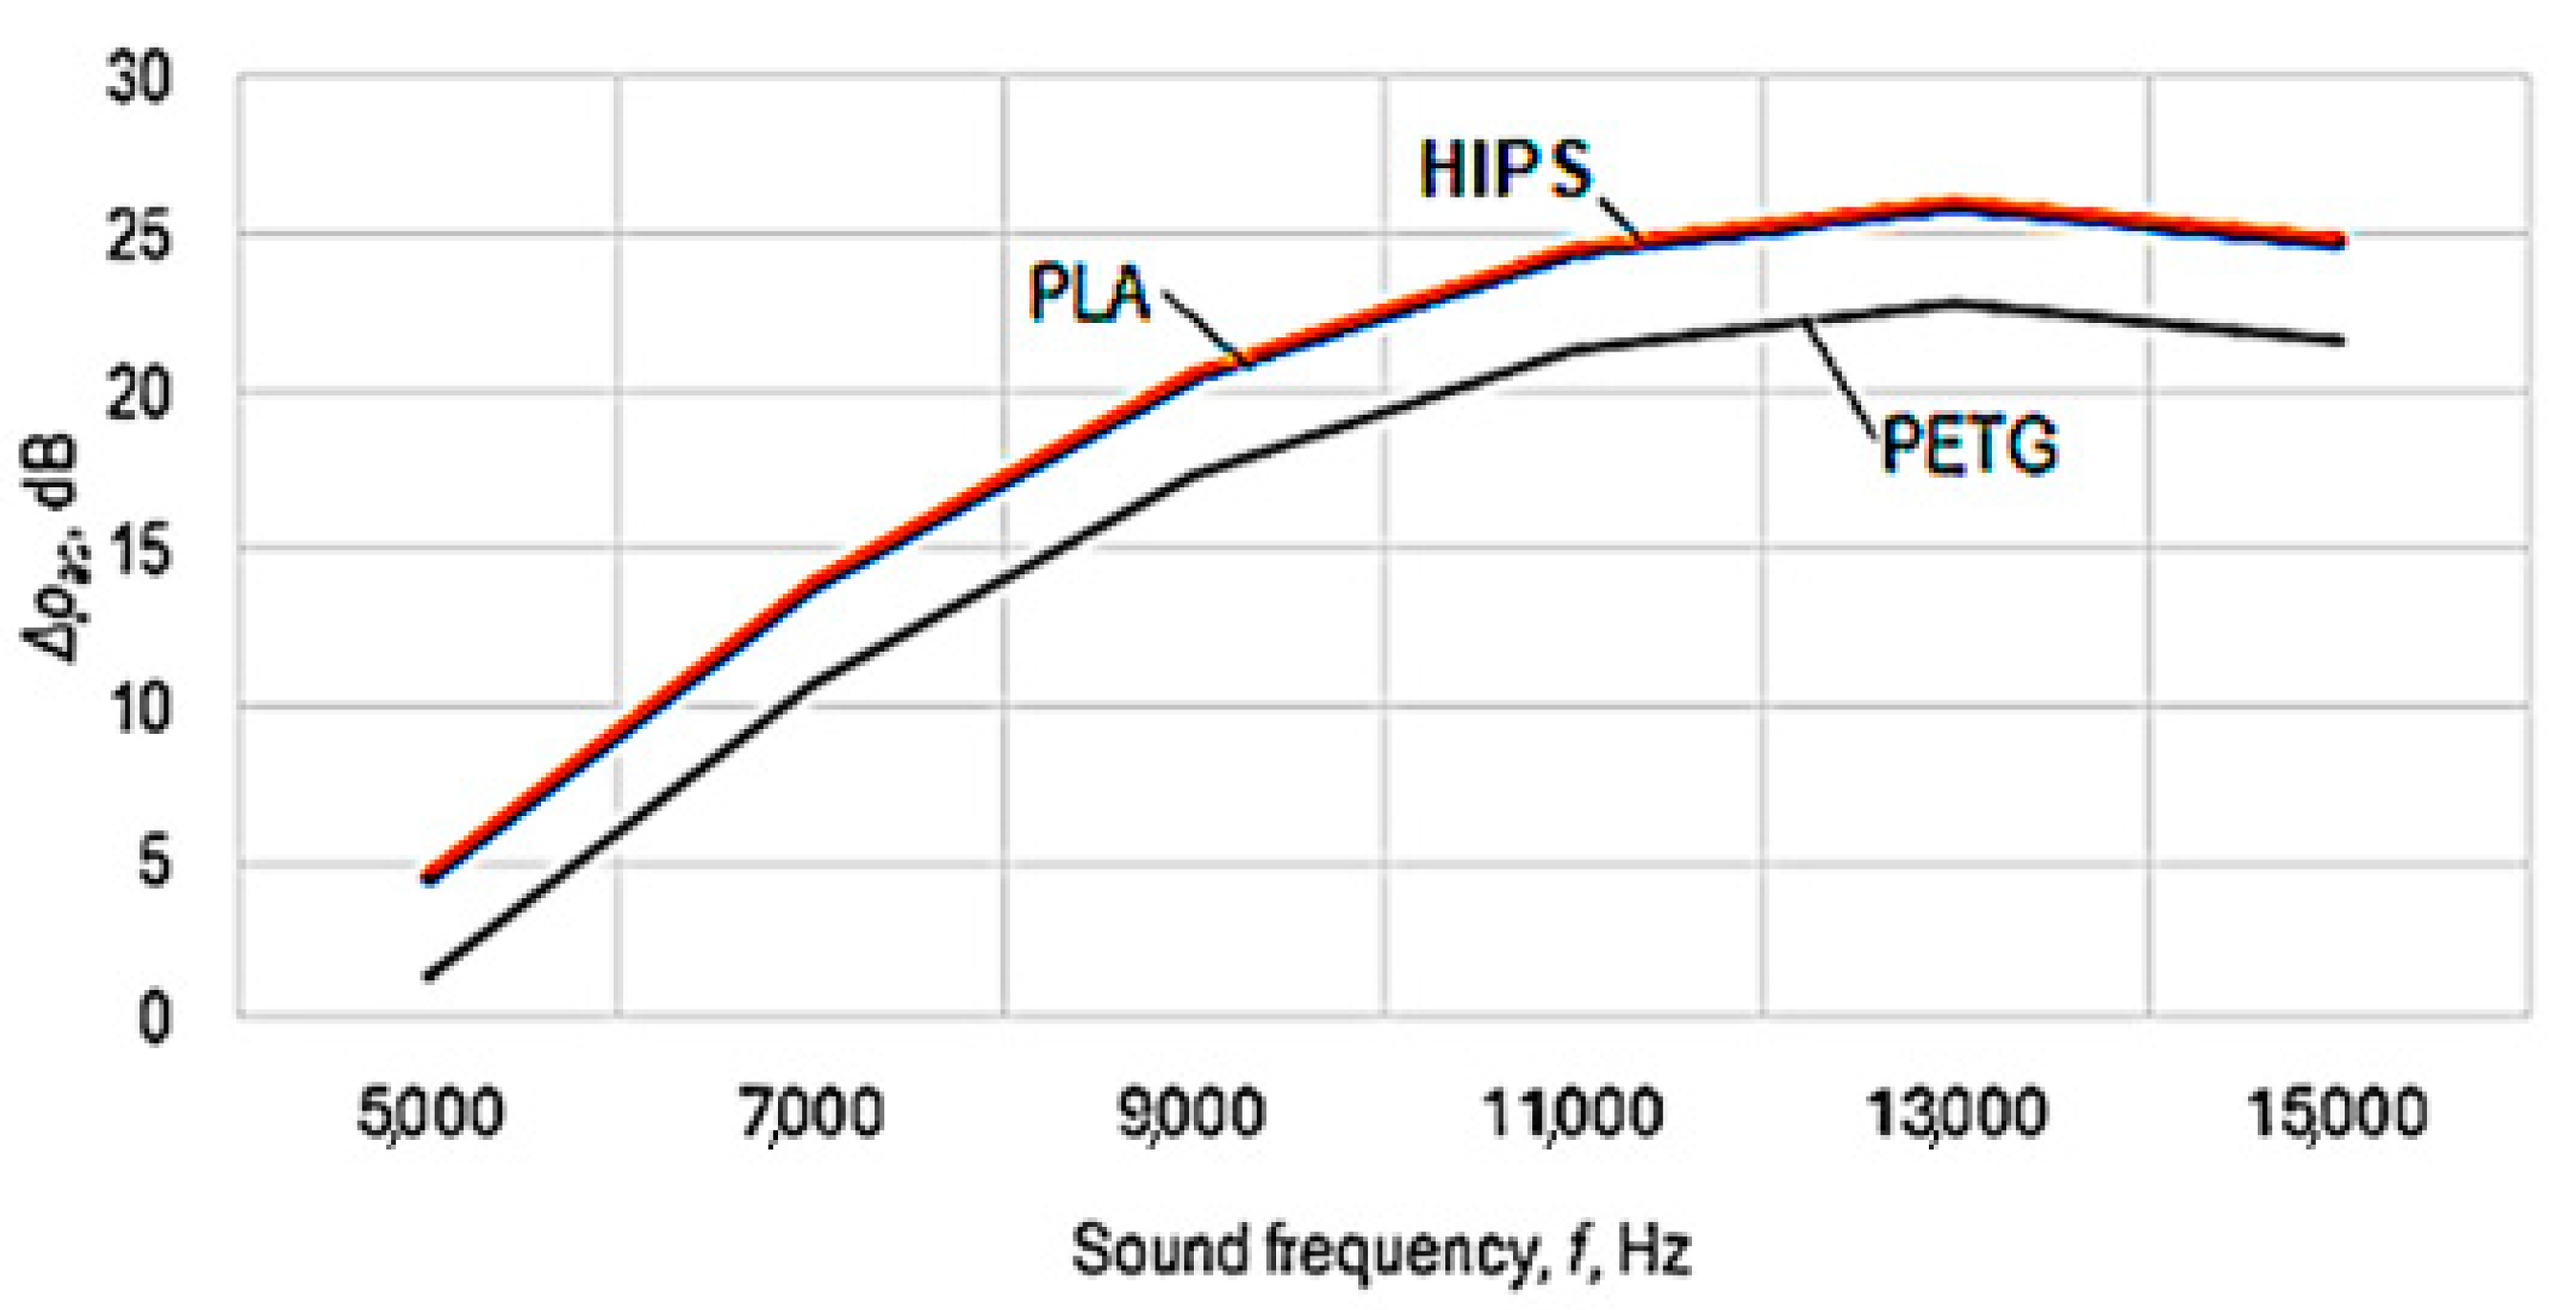
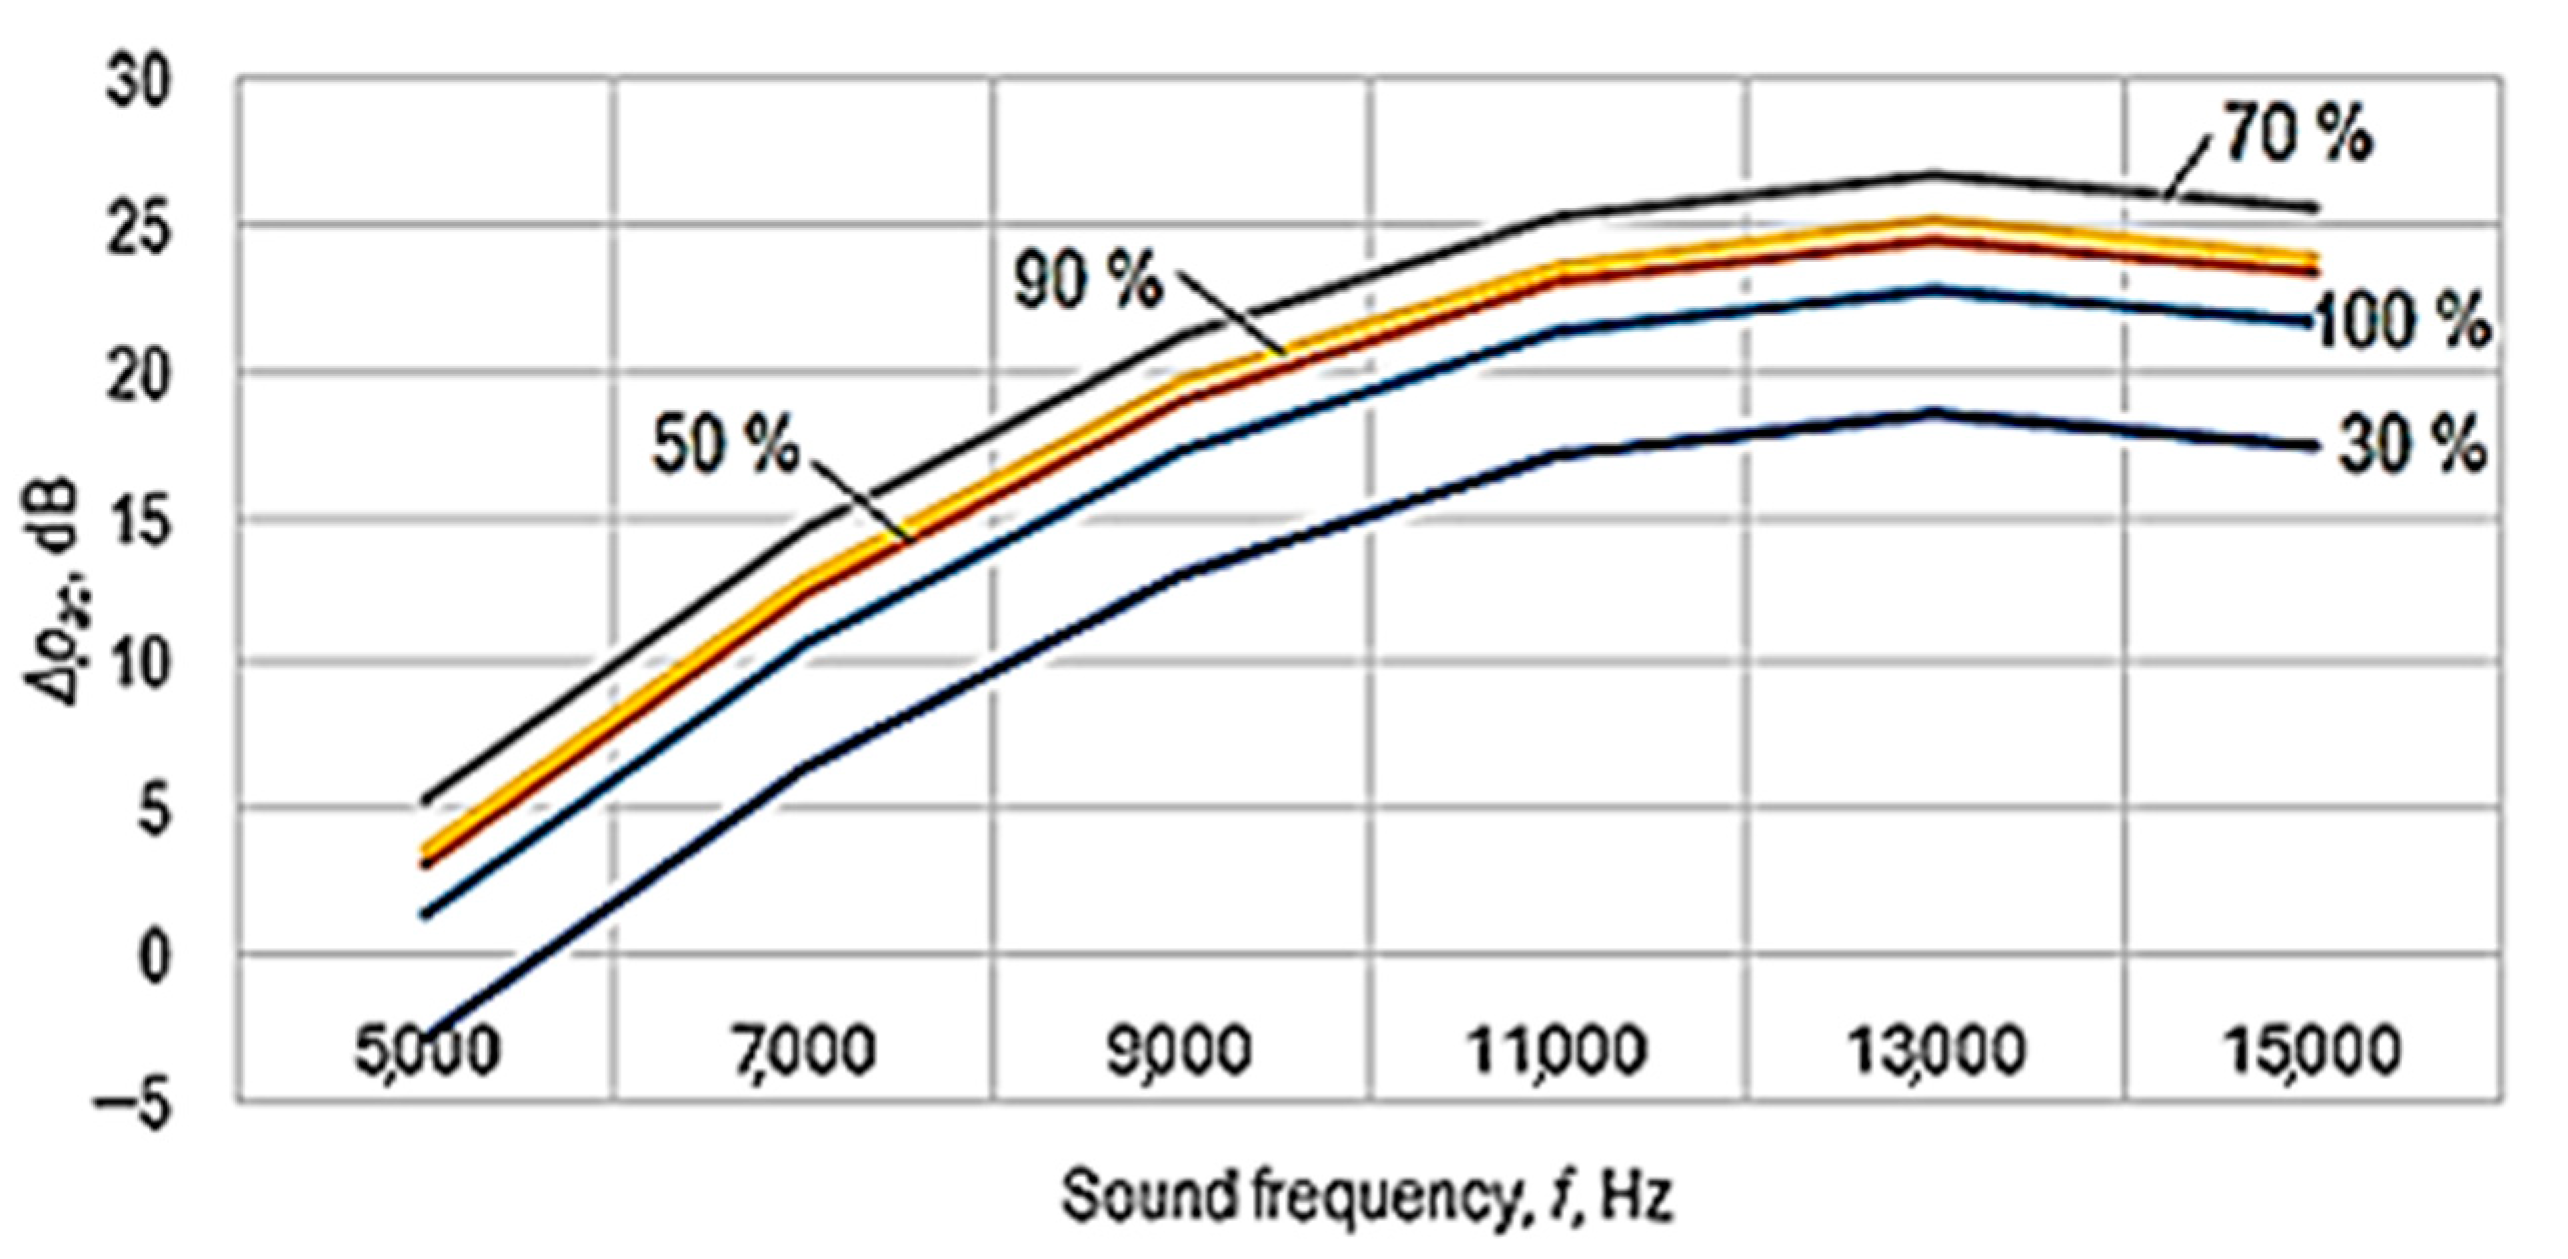
From the analysis of the power-function-type mathematical models (Equations (6) and (7)), it is found that the greatest influences on the values of the acoustic pressure level pac—and, respectively, on the sound energy absorption highlighted by the acoustic pressure difference Δpac—correspond to the factors frequency f and sound volume s, as these factors are associated, in Equations (6) and (7), with relatively high absolute values of exponents (in Equation (7), the two magnitudes are associated with exponent values of 1.618 in the case of frequency f and, respectively, 0.102 in the case of sound volume s).
The empirical mathematical model of power function type defined by Equation (7) highlights the strong influence of frequency f and sound volume s on the sound energy absorbed by the sample material.
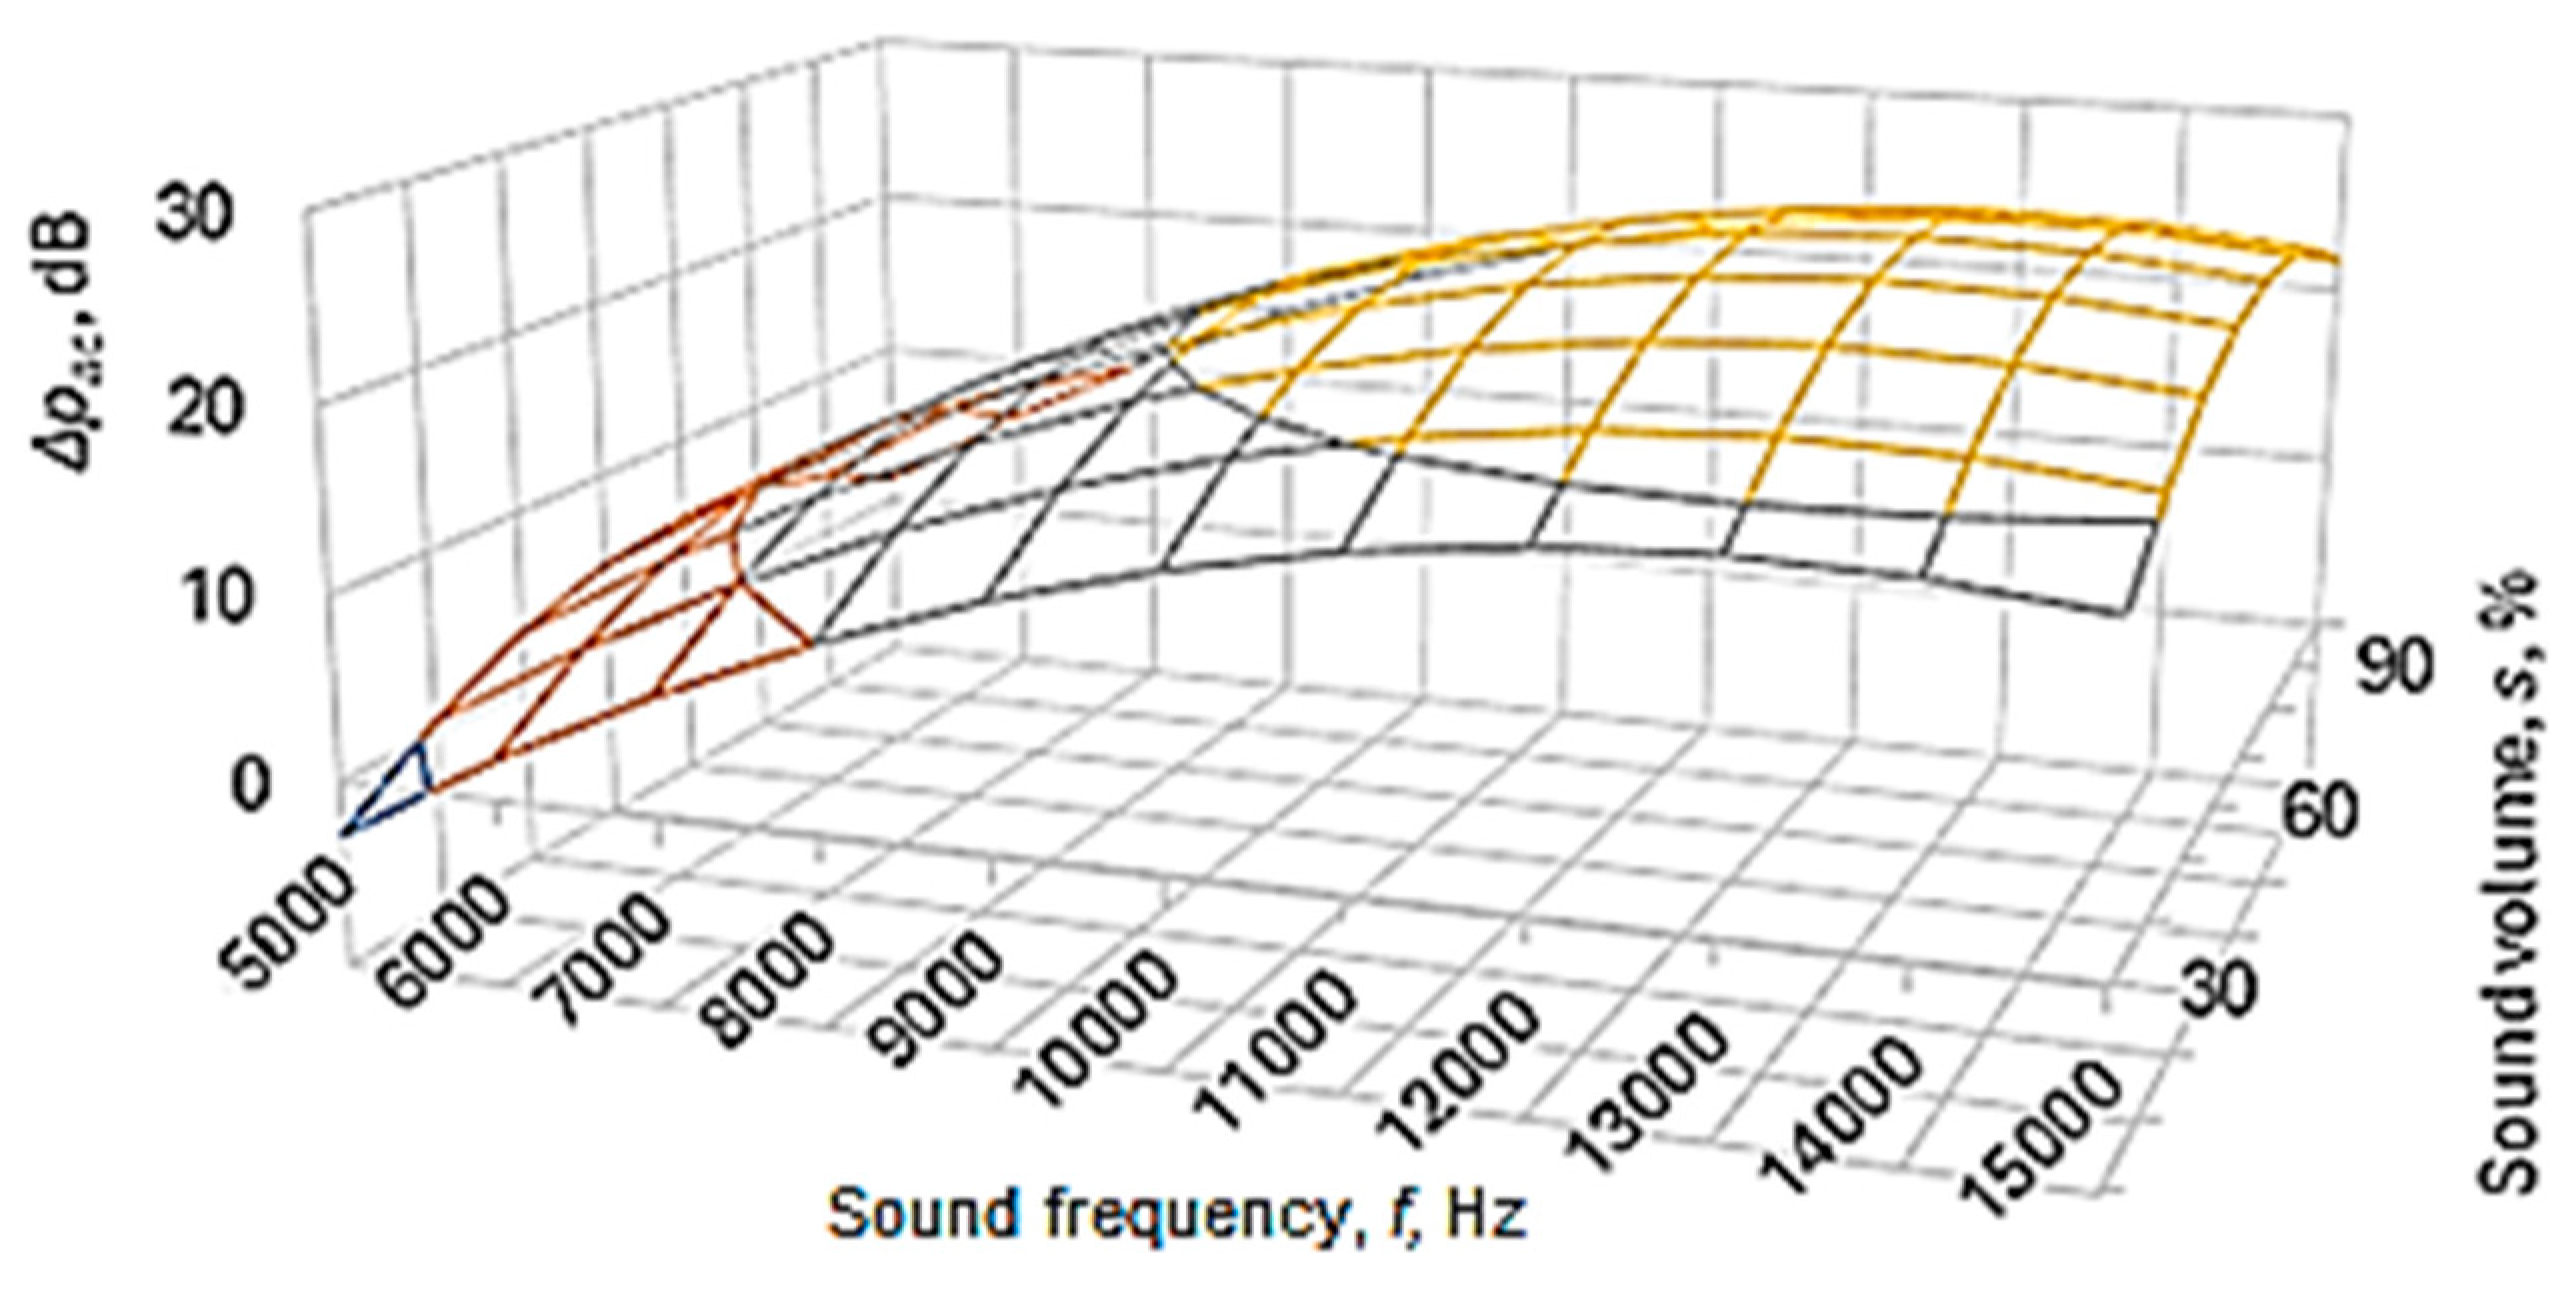
Using mathematical models of the second-degree polynomial type, the graphic representations in
Figure 7,
Figure 8 and
Figure 9 highlight the existence of maxima of the value of the acoustic pressure difference Δ
pac. The more pronounced influence of the frequency
f of the sounds exerted on the difference in acoustic pressure level can be more clearly observed in the graphic representation in
Figure 9.
For the conditions in which the experimental research was carried out, from
Figure 7,
Figure 8 and
Figure 9, it can be seen that there is a maximum of the acoustic pressure difference for a frequency of about 13,000 Hz. It is worth noting that different researchers have observed maximum sound absorption values by panels made of different materials for certain frequency values. These maximum values differ depending on the nature of the panel material and other conditions in which the measurements were made. Thus, it was found the existence of a maximum absorption coefficient for a frequency of approximately 2000 Hz in the case of a panel made of 20% polyester resin and 80% PET pellets [
6]. Others highlighted the existence of two maxima of the sound absorption coefficient for frequencies with approximate values of 2500–4000 Hz and, respectively, of approximately 7500–9500 Hz in the case of panels made of porous solid fiber structures [
9].
As mentioned in the introduction, there is an influence exerted on the sound absorption capacity in the case of some panels of polymeric materials by some input factors in the experimental investigation process, such as the sound frequency [
6,
8,
9,
12,
14,
15,
20,
22], the nature of the materials from which the samples were made [
3,
6,
7,
8,
9], the acoustic pressure level of the incident sound radiation [
5], the thickness of the panels [
3,
5,
13,
15,
23], the structure corresponding to the arrangement of the material in samples [
2,
3,
9,
10,
11,
12,
13,
14,
15,
16,
17,
18,
19,
20] etc. However, the values that characterize the sound energy absorption by the samples have values between wide limits due to the differences corresponding to the conditions involved in making the measurements. Through the experimental results presented in this paper, as expected, it is confirmed that an increase in the thickness
t of the panel will lead to the absorption of a greater amount of the energy of the sounds emitted by the source.
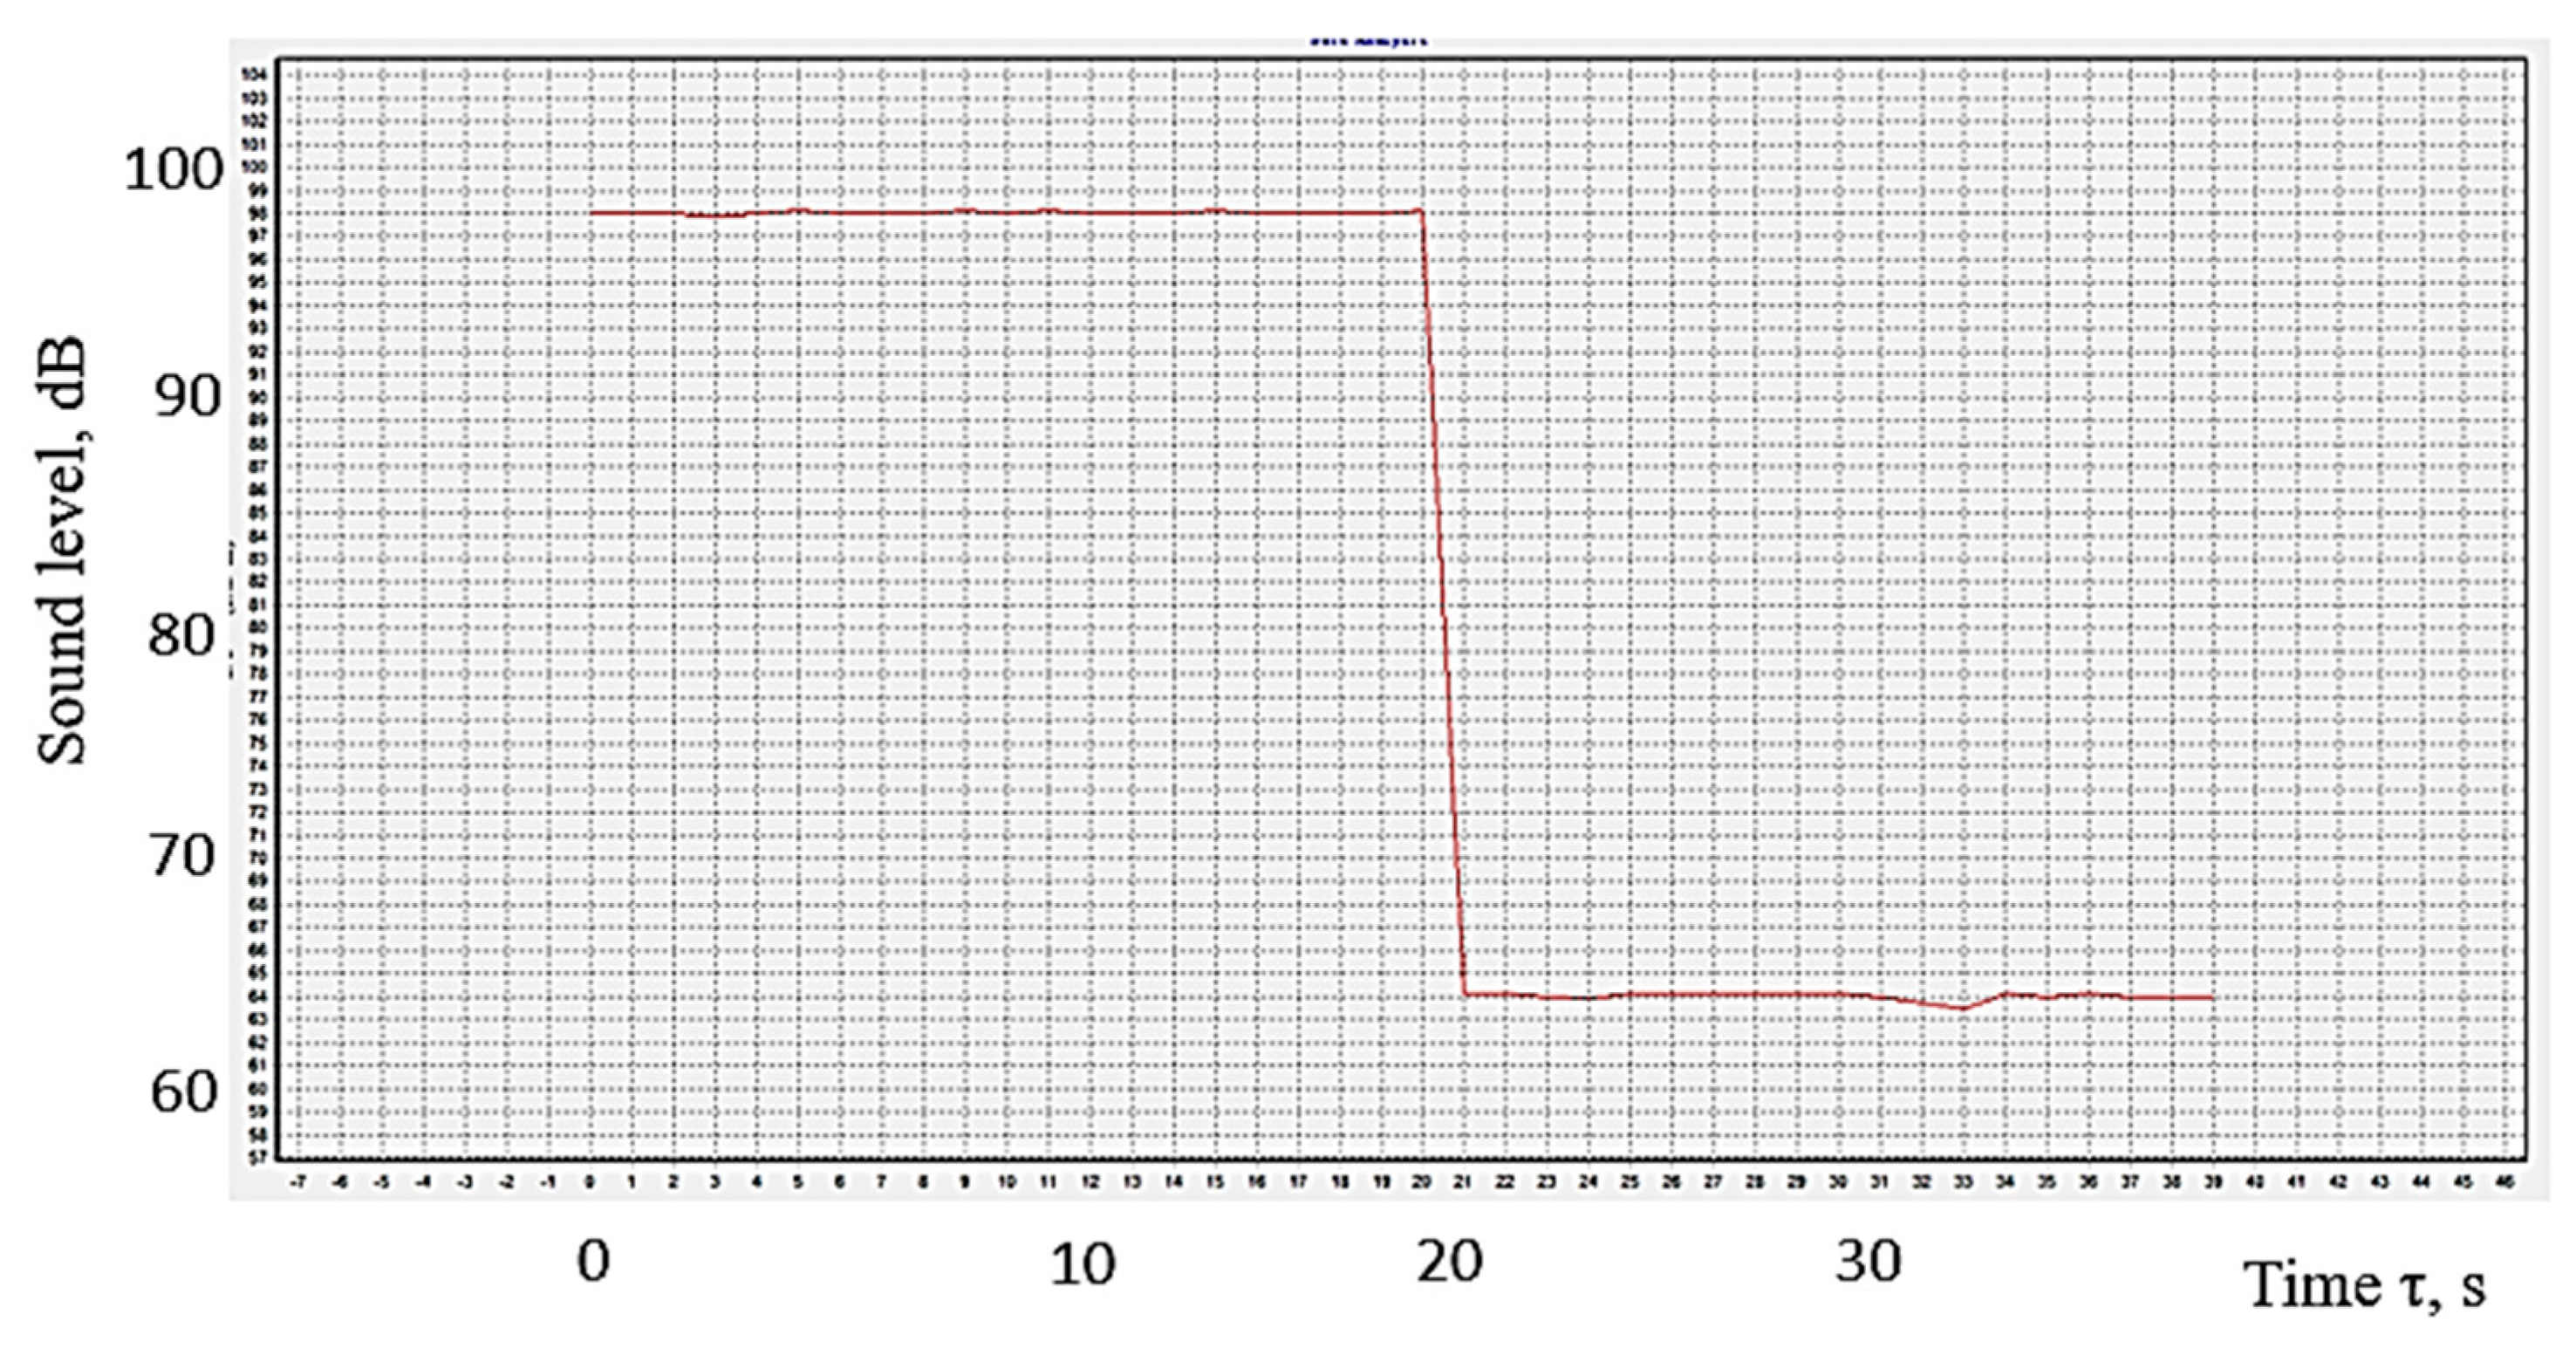
Figure 10 shows the reduction of the sound level when a panel made of polymeric material manufactured by 3D printing was placed between the sound source and the sensor of the equipment under the conditions valid for experiment no. 2. As expected, the presence of the polymer panel contributes to a decrease in the sound level received by the device’s sensor. It can be noted that the panel made of polymer material absorbs energy corresponding to a difference in acoustic pressure of about 35 dB. This means that the presence of the polylactic acid panel leads to a reduction of about 45% in the sound pressure level.
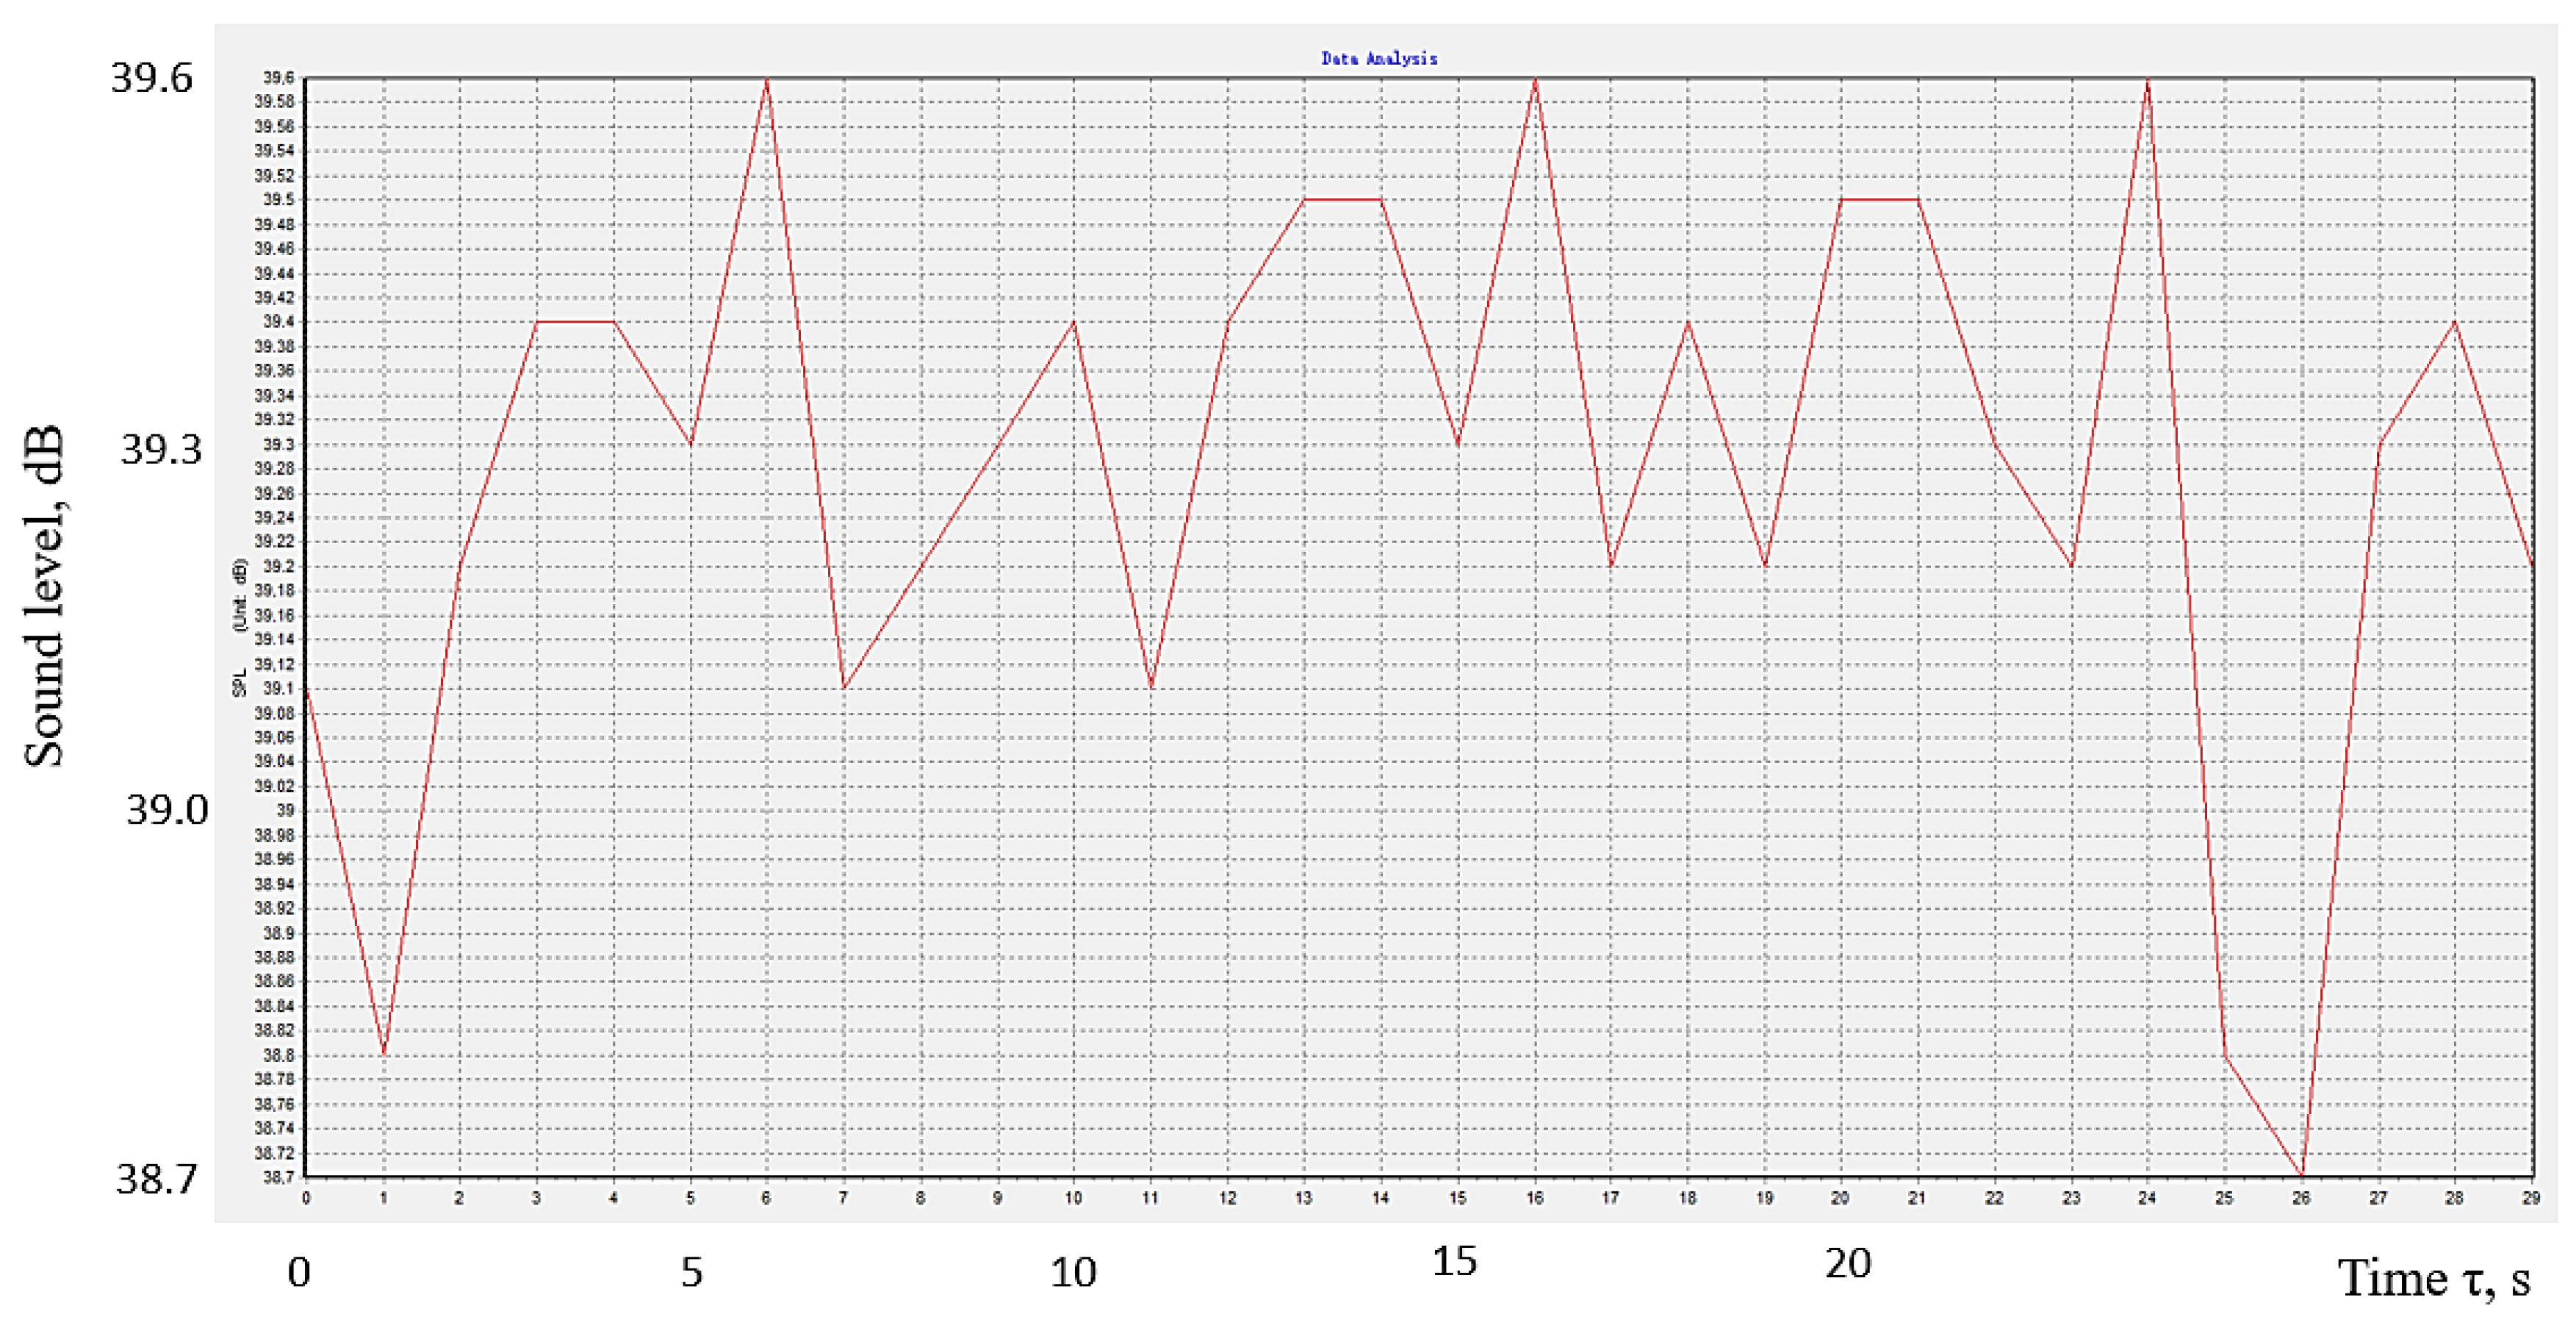
The graphic representation in
Figure 11 sought to highlight the time variation of the sound level reaching the sound level meter sensor. The graph corresponds to the use of the conditions corresponding to experiment no. 18. The sound level meter transmits the values to the computer software, which determines a mean sound level value after one-second intervals. Such mean values were considered when the computer software developed the diagram in
Figure 11. It can be seen that the sound level reaching the sound level meter sensor after passing through the polymer material panel is not constant. For the conditions of the experimental tests, the sound level registers a variation between relatively close limits, namely, between 38.7 dB and 39.6 dB.
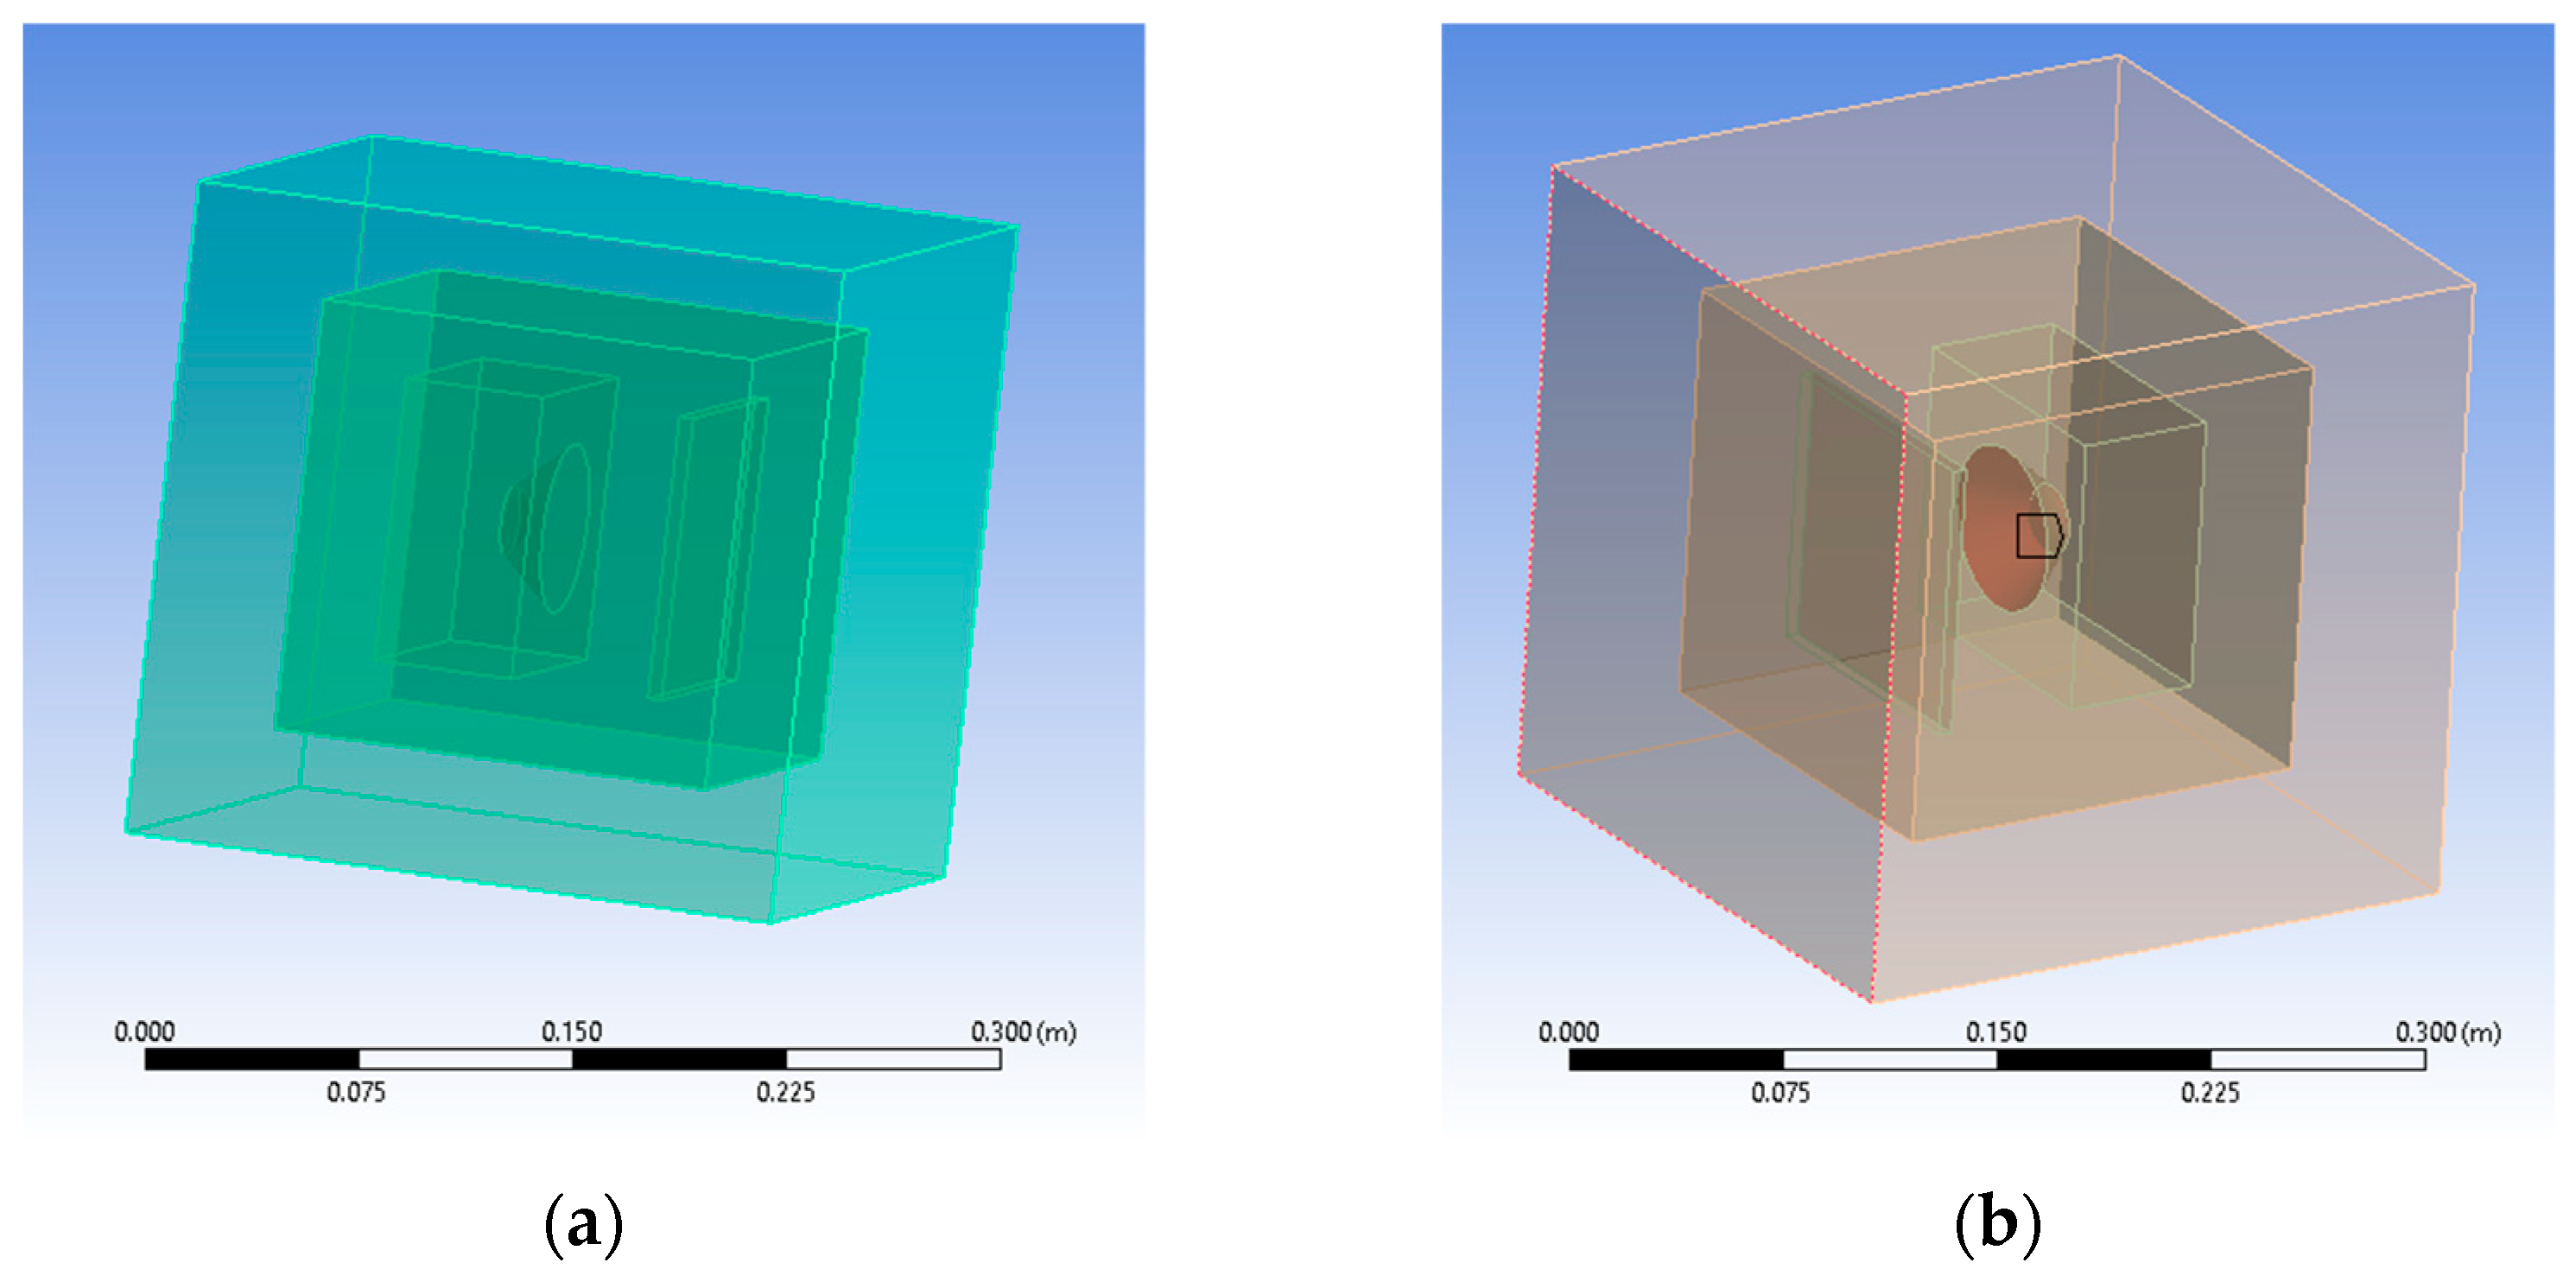
To simulate a perfect insulation environment, another medium had to be modeled as a perfectly matched layer (PML) which absorbs bouncing waves without reflecting them. In the Ansys Space Claim module, the boxed type of enclosure was chosen was for both media—computational domain (CD) and the perfectly matched layer (PML)—which were later imported in the analysis’s module (
Figure 12a). The entire geometry shares its topology among its components. Because the aim is to obtain acoustic pressure distribution results, air was added as the propagation medium and assigned as the default material for both enclosures. Mesh-wise, a face-sizing method was added to capture all facets of the newly designed assembly by suppressing the initial setup containing the speaker and the polymeric panel. That made the assignation of materials for the two-suppressed components irrelevant. Mesh resulted in 60,553 nodes and 38,745 elements. The mass excitation source was applied to the speaker’s membrane (
Figure 12b). When applied to a surface, one can divide the mass flow rate by the area on which it is applied. After this step, the speaker and polymeric panel are suppressed to mesh the entire geometry.
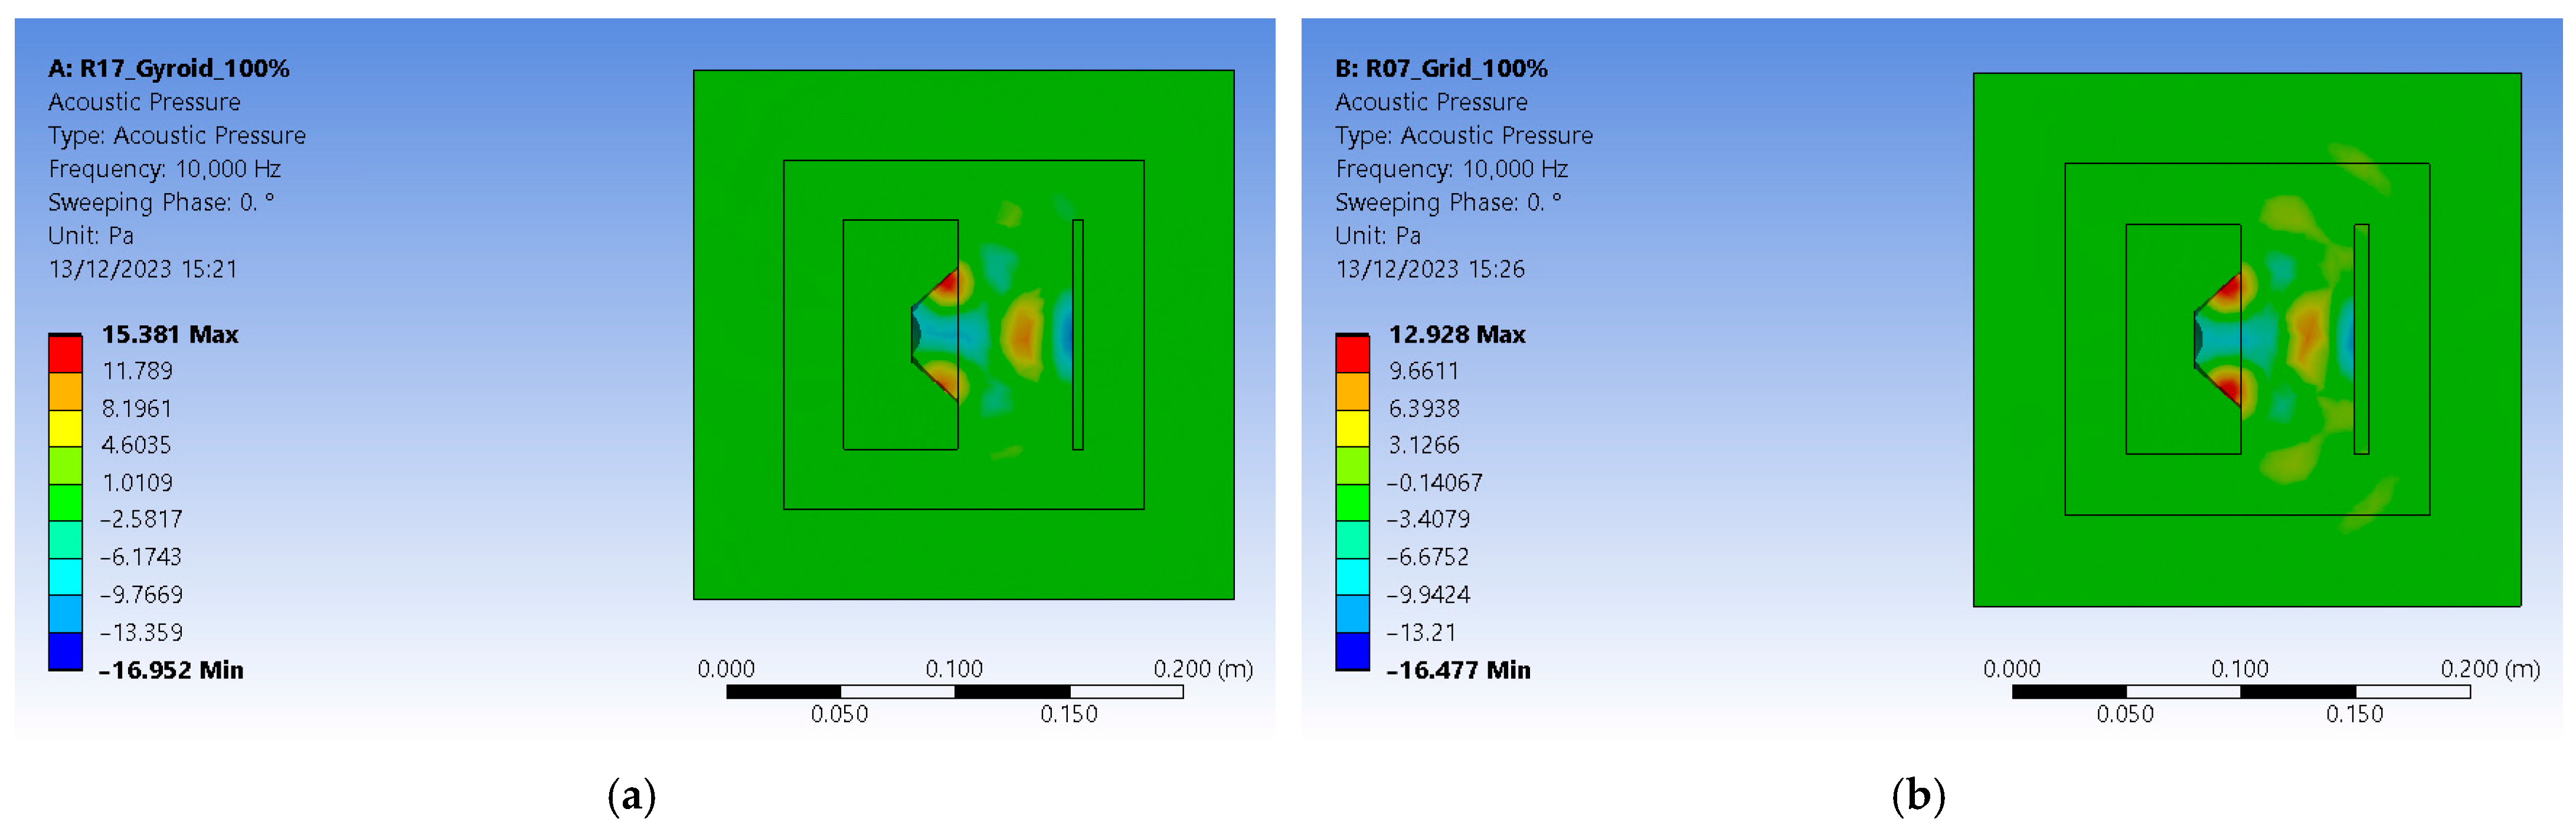
The analysis settings received a linear frequency spacing varying from zero to 10,000 Hz. The acoustic region is set to the DM enclosure, and a newly added physics region is added and assigned to the PML enclosure. This ensures that pressure builds up inside as acoustic waves do not escape the setup and are not reflected by its outer boundaries. The solution requires a sound pressure level and an acoustic pressure distribution. For the R17 experiment, the gyroid 18% infilled sample at 100% sound intensity level resulted in 119.66 dB (
Figure 12b). For the R7 experiment, the grid 48% infilled sample at 100% sound intensity level resulted in 119.01 dB (
Figure 12b). The values are greater than the ones recorded in experimental tests since Ansys uses a perfectly isolated medium.
Acoustic pressure builds up inside the computational domain (CD) and extends to the limits of PML enclosure. The R17 experiment setup peaks at 15.381 Pa, and the R7 experiment reaches 12.928 Pa (
Figure 13). Results show that gyroid infill better deflects the sound waves. They are consistent with experimental results that revealed a 26.6 dB loss in sound pressure level for the R7 experiment gyroid-infilled sample instead of just 16.8 dB for the R17 experiment grid-infilled one.
5. Conclusions
In some situations, reducing the intensity of sounds in certain spaces is necessary. In such situations, panels made of polymeric materials can be used to allow for the sound insulation of the respective spaces. For this reason, it is useful to know some information about the ability of some polymeric materials to absorb sound energy. On the other hand, the expansion of the use of parts made of polymeric materials through 3D printing has opened up new possibilities for modification, including the ability of some polymeric materials to absorb the energy of sound vibrations. The finite element method was employed to obtain initial information on the behavior of small polymeric-med panels. Later, experimental research was carried out, starting with a Taguchi L18-type factorial experiment. The experiment considered eight independent variables, of which one variable (the thickness of the polymer material panel) received values on two levels of variation. The other seven independent variables had values on three levels of variation. The input factors were the thickness of the panel, the nature of the polymer material of the panel, the 3D printing speed, the infill percentage, the infill pattern, the layer thickness, the frequency, and the sound volume. The output parameters taken into account as dependent variables were the acoustic pressure level of the sound wave after passing through the polymer material panel and, respectively, the acoustic pressure level corresponding to the energy absorbed by the panel. The experimental research was carried out using a sound-insulated enclosure. In this enclosure, in separate compartments, a mini audio speaker, a supporting wall of the sample in the form of a small panel, and, respectively, the sensor of a sound level meter were placed. Panels with an area of 100 × 100 mm2 and 5 mm thicknesses were manufactured by 3D printing from polylactic acid and polyethylene terephthalate glycol, respectively. The experimental results were mathematically processed using specialized software. Empirical mathematical models of the second-degree polynomial and power function were obtained in this way. The last type of function directly highlights the means and intensity of the influences exerted by the input factors on the values of the output parameters. As expected, it was found that an increase in the thickness of the polymer material panel leads to a decrease in the sound pressure level after sound passes through the polymer material panel. The strongest influence on the difference in acoustic pressure is due to the energy the panel absorbs, which is exerted by the frequency of the sounds. For the polymer materials used to make the small panels and for the conditions of the experimental tests, the variation of the acoustic pressure difference due to the change in the frequency of the sounds led to a maximum corresponding to a frequency of about 13,000 Hz. In the future, research is intended to continue considering the possible influence exerted by other factors that characterize the 3D printing process. Another direction for experimental research could consider panels manufactured by 3D printing from other materials.


 ,
, 


