3.1. Plasticizer Type
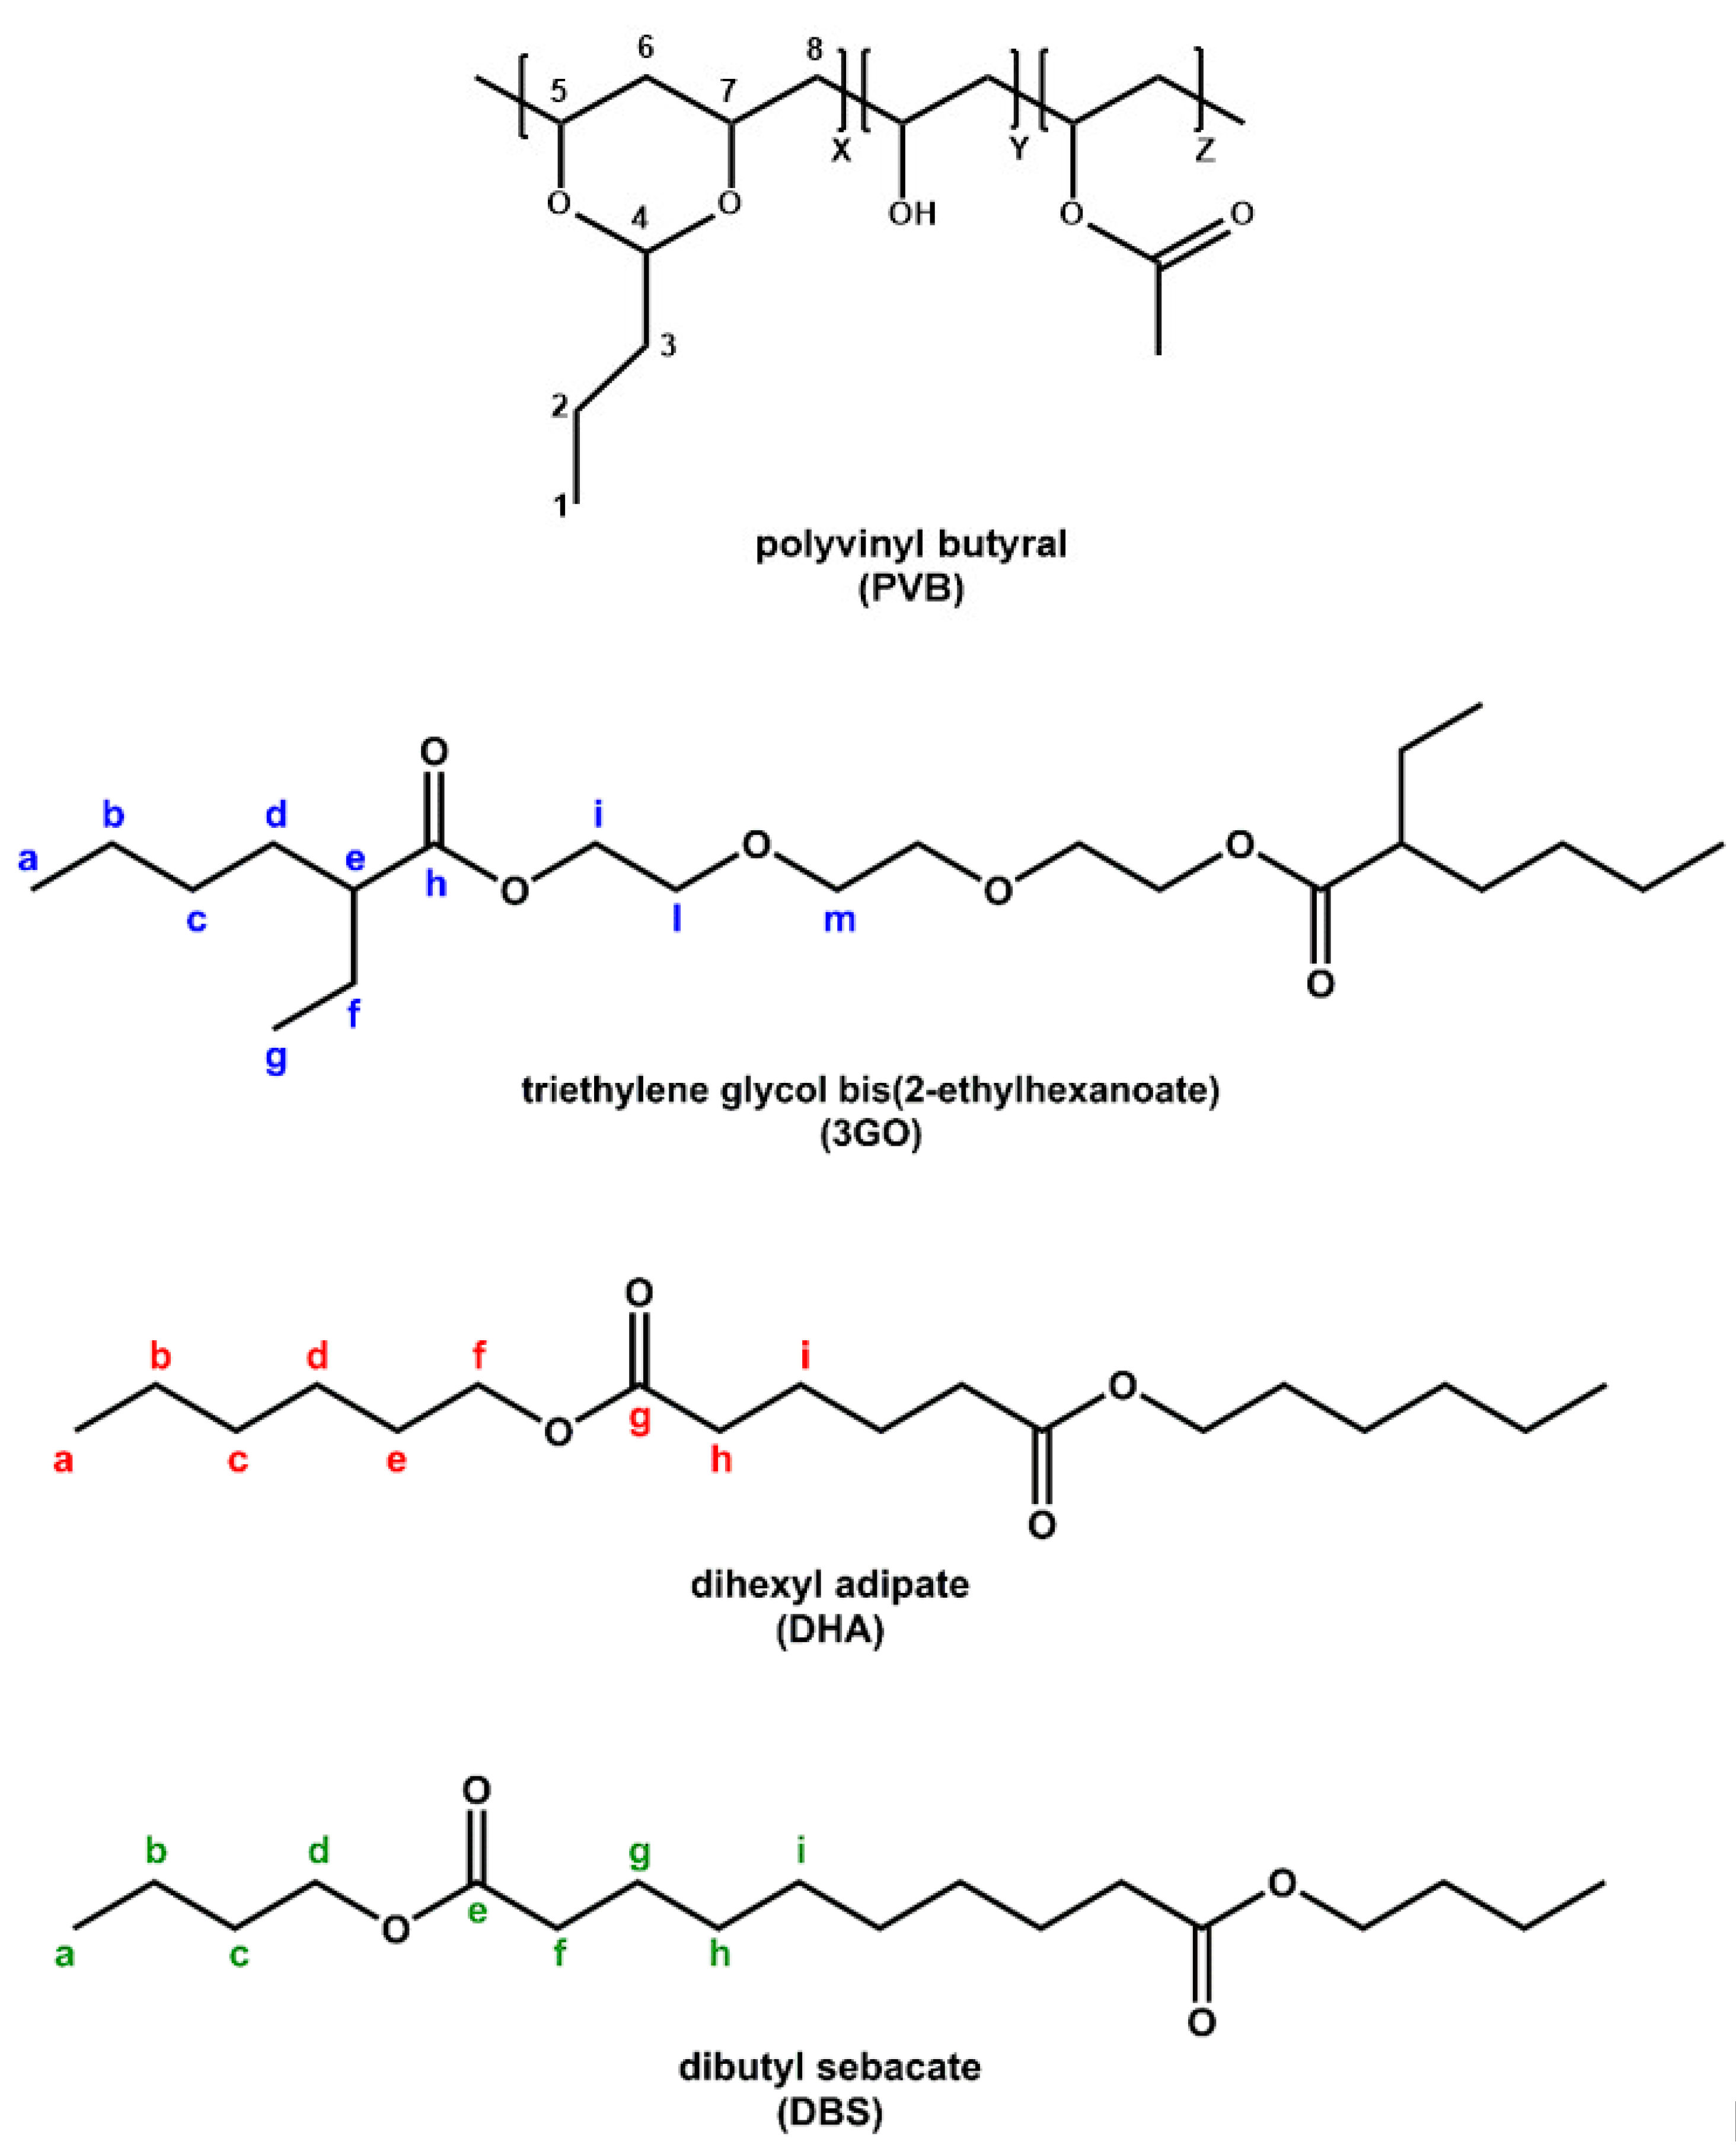
Polyvinyl butyral is a terpolymer that consists of three main segments, namely Vinyl Butyral (VB, 76–80 wt%), Vinyl Alcohol (VA, 18–22 wt%) and Vinyl Acetate (VAc, 1–2 wt%) (
Figure 1) [
10].
The acetalization degree (vinyl butyral, VB content) is related to the manufacturing process, meaning that the chemical composition (frequency of X, Y, and Z segments,
Figure 1) can differ among different PVB grades and suppliers, thus affecting the final properties of the end product [
29]. Nonetheless, PVB is found to be mainly composed of polyacetal, since it contains a predominant proportion of butyral, and much less hydroxyl and acetyl groups [
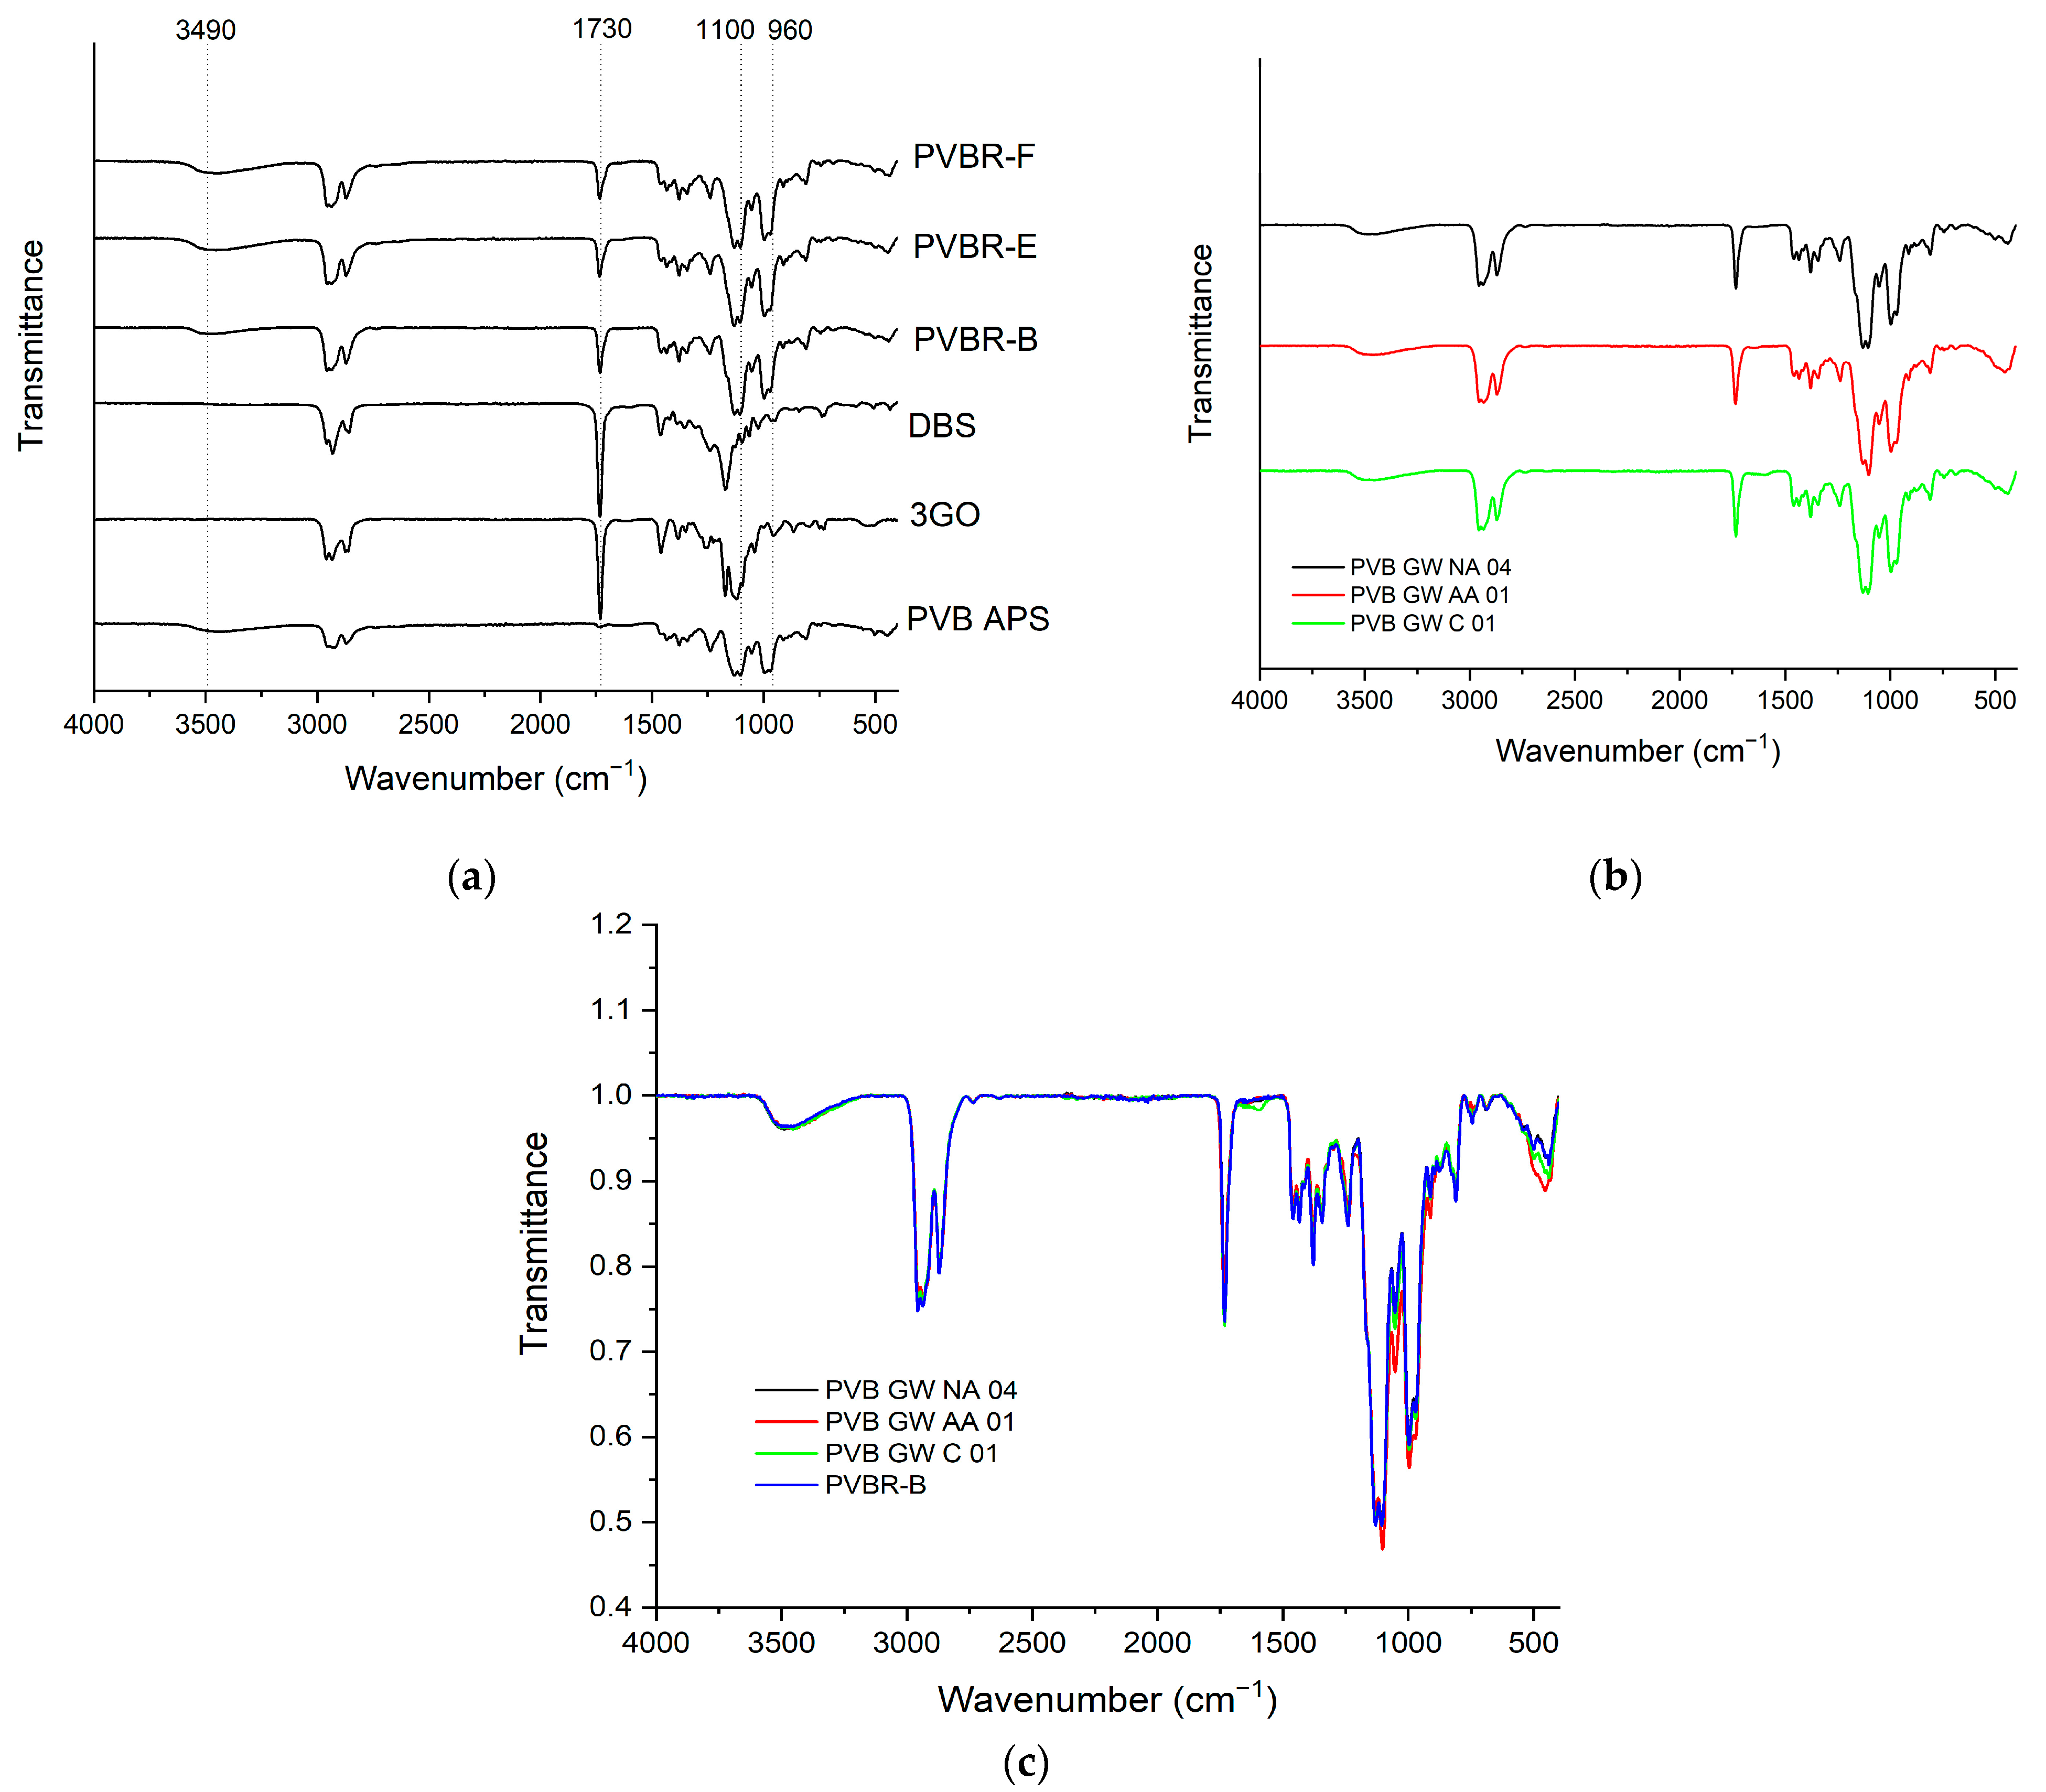
4]. FT-IR provides the means to identify the characteristic peaks of PVB moieties but without the possibility of a quantitative analysis of the chemical composition. For the neat PVB sample (PVB APS) (
Figure 2a), the peaks at about 1140 and 996 cm
−1 correspond to C–O–C stretching vibrations of butyraldehyde groups [
26]. A broad peak related to hydroxyl content (3490 cm
−1) is visible in the spectra of all PVB samples referring to vinyl alcohol (VA) content, while the vinyl acetate (VAc) part of PVB (1740 cm
−1) is almost indistinguishable for PVB APS due its low content (assumed <1%), which is close to the lower detection limit of the FT-IR technique. PVB films used for lamination also contain a high amount of plasticizer (15–45 wt.%), leading to a lowered
Tg value and enhanced film flexibility. Plasticizers used in PVB films for lamination typically involve ethylene glycol oligo-esters, or esters of dicarboxylic acids like dibutyl sebacate [
10,
23,
25,
30]. As for the spectra of pure 3GO and DBS plasticizers (
Figure 2), they exhibit different peaks than PVB in the range of 1000–1500 cm
−1, which are attributed to their different chemical structures (
Figure 1), but they cannot be easily determined when mixed with PVB, due to the overlapping of characteristic vibrational modes. The most characteristic peak is found at 1740 cm
−1 for both plasticizers, representing the C=O stretching, which is indicative of an ester moiety [
30]. Regarding the FT-IR analysis of the plasticized PVB grades (
Figure 2a), the peak assignment involves characteristic peaks of the PVB terpolymer (VA, VB, VAc units), as well as one at ca. 1740 cm
−1, proving the presence of the plasticizer. The particular peak is not observed in the spectrum of the unplasticized sample (PVB APS). Nevertheless, according to FT-IR, it is feasible to determine the plasticizer type (e.g., ester type) but not the exact species, 3GO or DBS. All the spectra were normalized for qualitative comparison purposes in order to assess the influence of plasticizer because carbonyl groups are associated with the presence of plasticizer molecules.
Regarding the FT-IR spectra analysis of GW samples (
Figure 2b), there is no clear difference from the reference samples (
Figure 2a). To clarify that, PVB waste grades were compared to PVBR-B (
Figure 2c), and all of them contain 3GO as a plasticizer (as shown by NMR analysis below). An overlapping of the characteristic peaks and minor differentiation in the intensity of the peaks were only observed, proving there is no great chemical variation between PVB films after their end-of-life. Therefore FT-IR cannot be used for the study of aging or degradation phenomena of this type and extent that are typical for the waste materials of practical interest.
SSNMR is another technique that was applied in the characterization of the PVBR- samples. Thanks to the variety of available experiments, it can easily be used for plastic materials, investigating the more rigid fraction (represented by the PVB polymer) or the dynamic fraction (consisting of the plasticizer). This can be promptly achieved by acquiring 13C CPMAS with short contact times or 13C MAS, respectively.
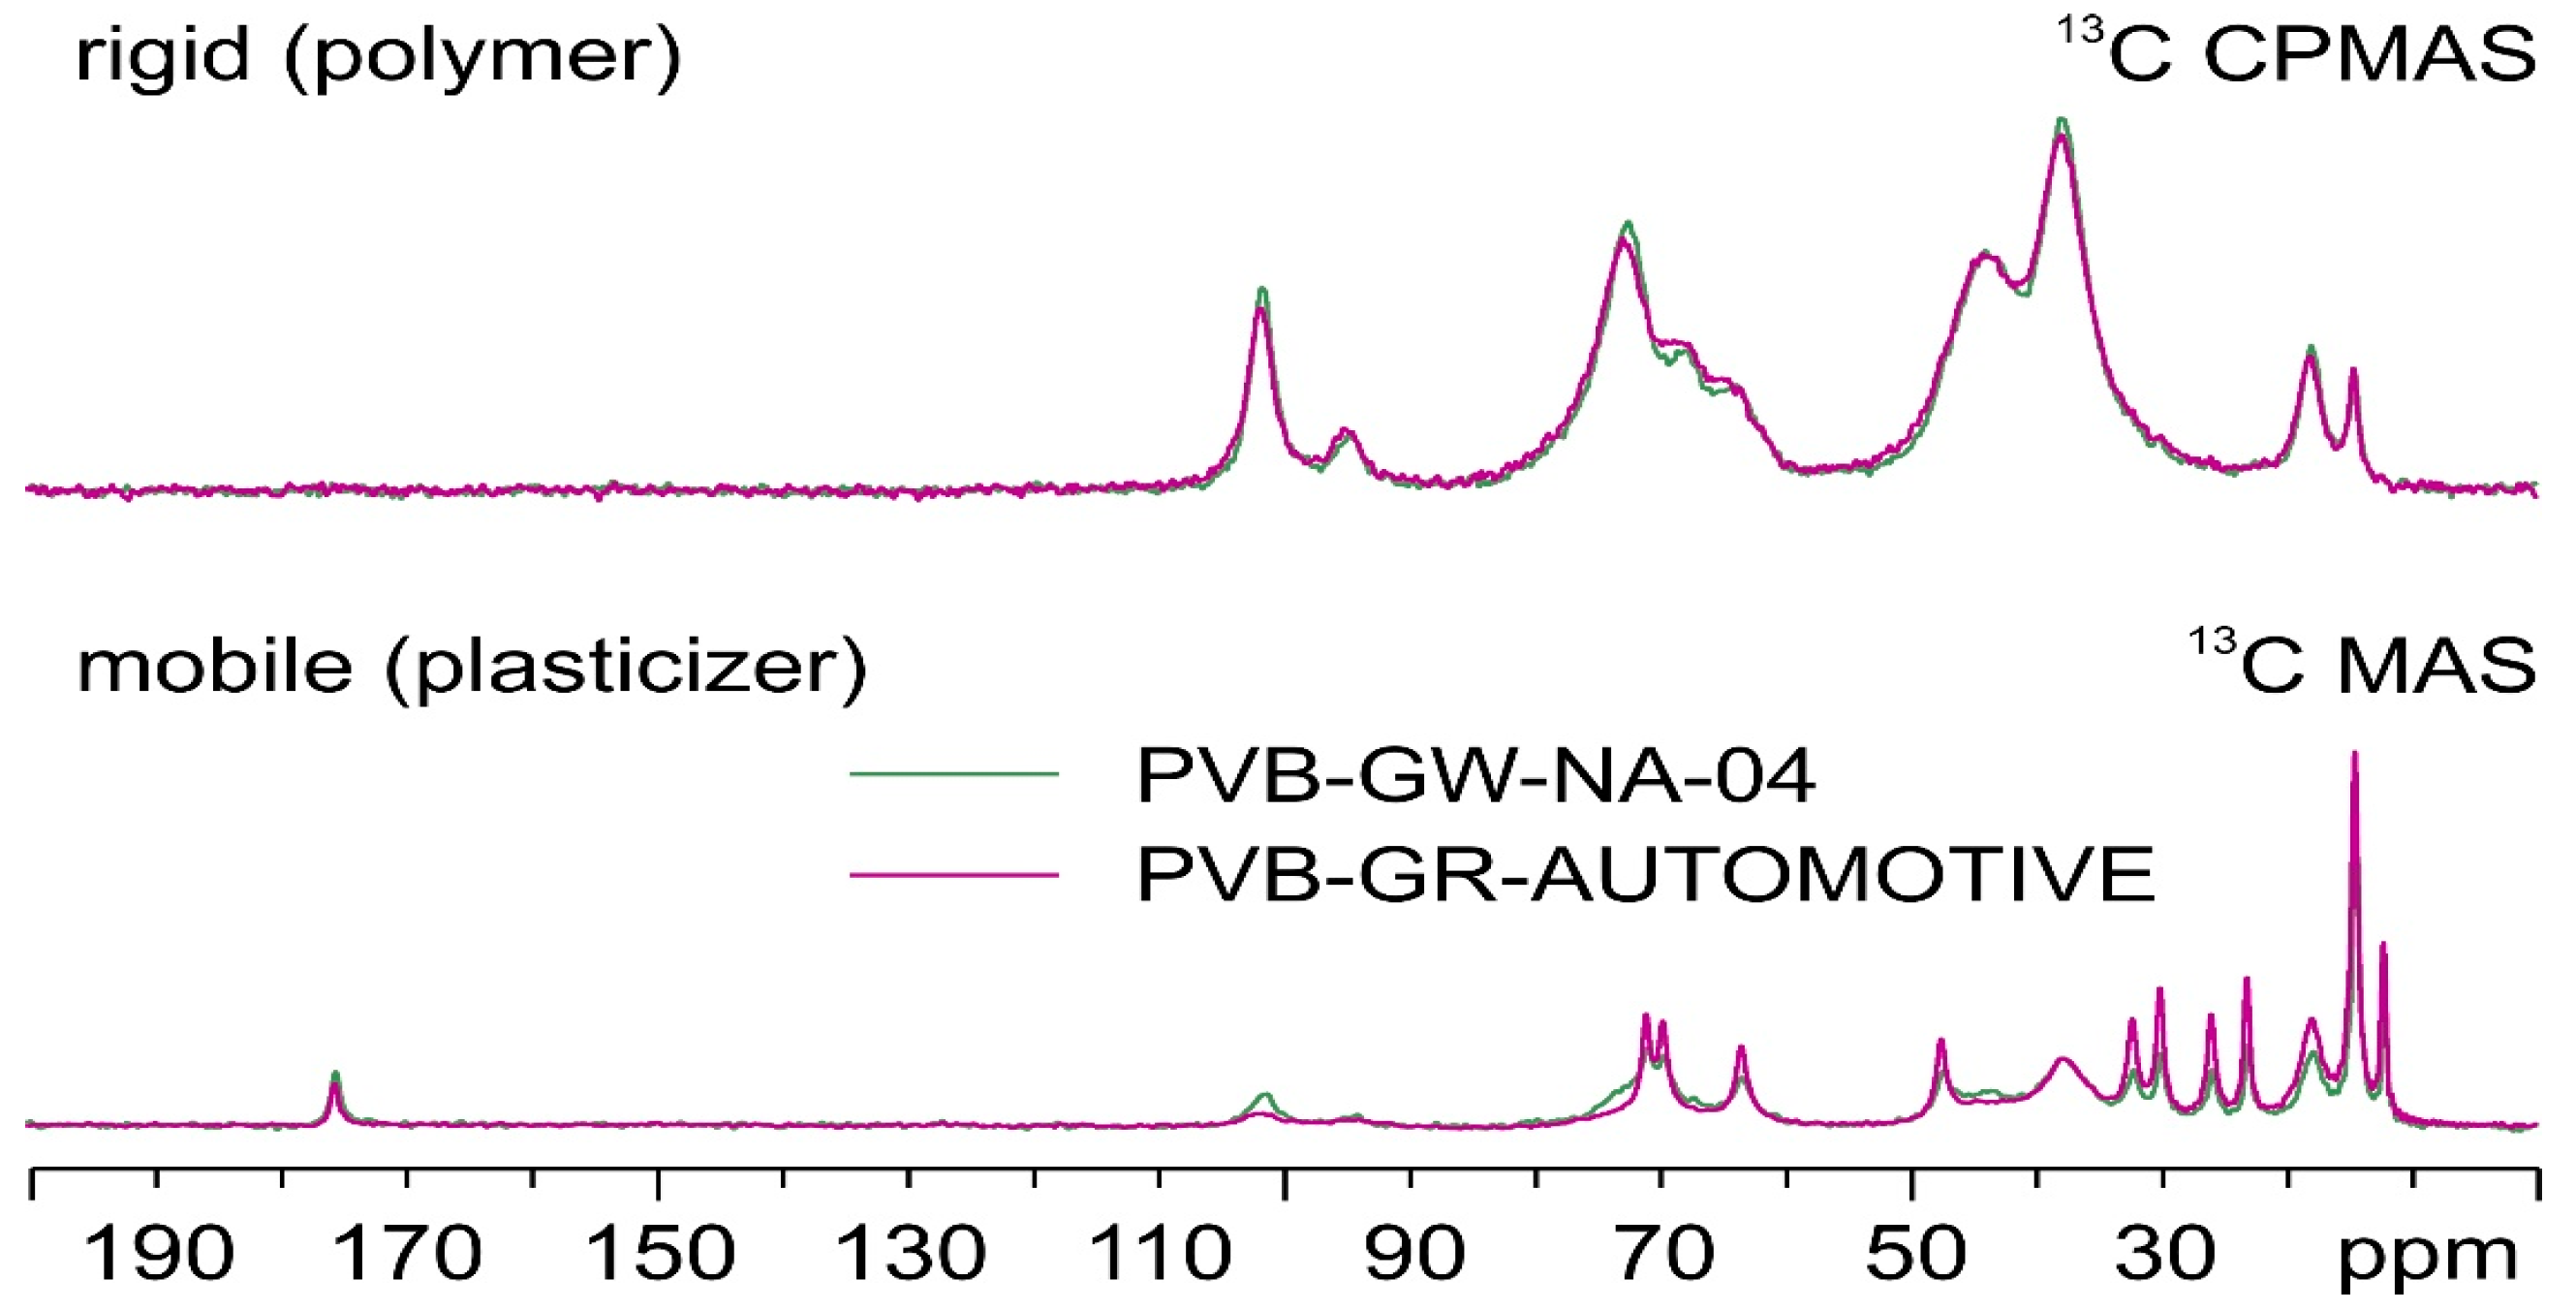
First, PVBR-B was compared to a reference sample from a new windshield abbreviated as PVB-GR-AUTOMOTIVE (
Figure 3). The two materials coincide, both in their rigid (PVB) and mobile (plasticizer) domains.
In the CPMAS spectra (top in
Figure 3), broad signals can be observed, corresponding to the C atoms of the main component of PVB (i.e., VB). As for the MAS spectra (bottom in
Figure 3), the signals appear much narrower, as they correspond to the C atoms of mobile 3GO. Peak assignments both for PVB and 3GO are proposed in the form of labels over the corresponding resonances in
Figure 3.
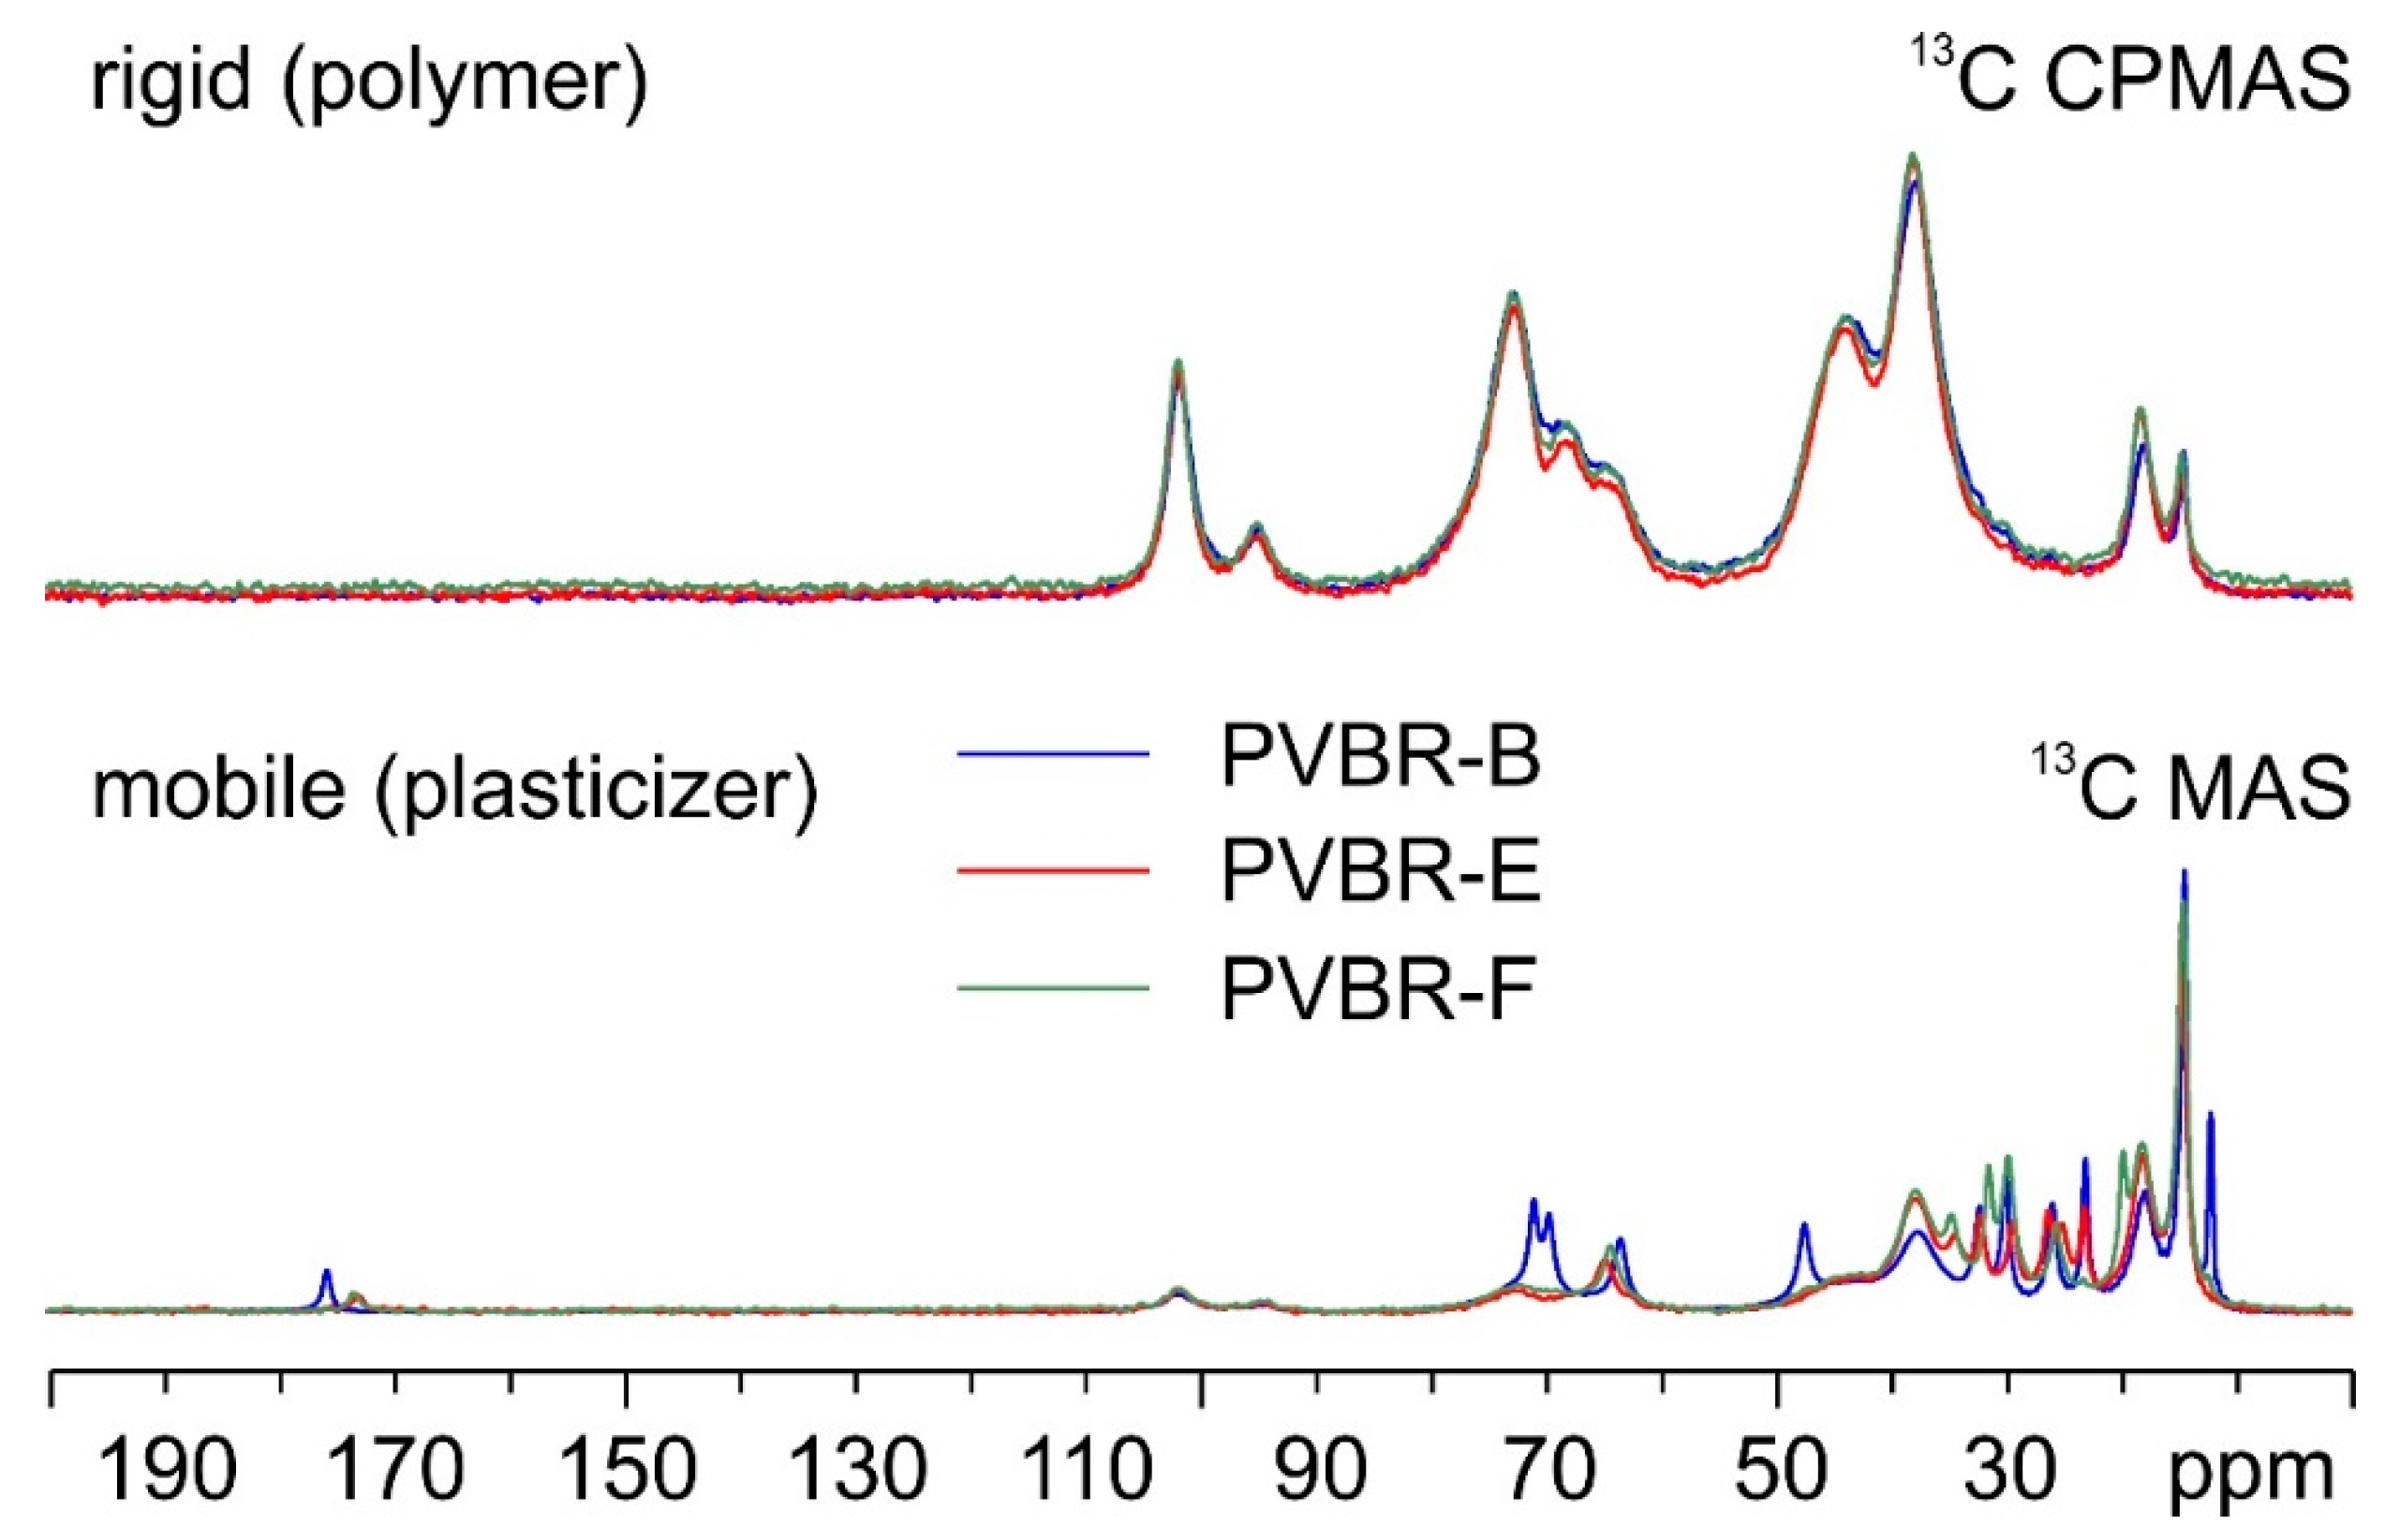
PVBR-B was further compared with samples PVBR-E and PVBR-F.
Figure 4 shows an overlay of their
13C CPMAS (top) and MAS (bottom) SSNMR spectra.
As shown by the spectra (
Figure 4 on top), no significant difference among the three samples is found in their rigid polymeric part. On the contrary, as expected, several evident variations are observed concerning the plasticizers included in the three samples. The details of colored arrows in
Figure 5 make it easier to see how specific signals can be identified in the three spectra that allow for the discrimination of the incorporated plasticizer.
PVBR-B, which is characterized by the presence of the 3GO plasticizer, is the sample whose spectrum differentiates itself the most. Many of the visible signals (e.g., those at 70.9, 69.6, 47.4, and 12.2 ppm) are well separated from those of DHA (in PVBR-E) and DBS (in PVBR-F). Nonetheless, the latter two plasticizers also offer certain specific diagnostic signals: DHA displays a characteristic couple of resonances at 26.3 and 25.1 ppm, while the peaks at 31.5 and 19.8 ppm appear to be uniquely ascribable to DBS. This shows how SSNMR has the potential of reliably assessing the chemical identity of the plasticizer included in the analyzed materials.
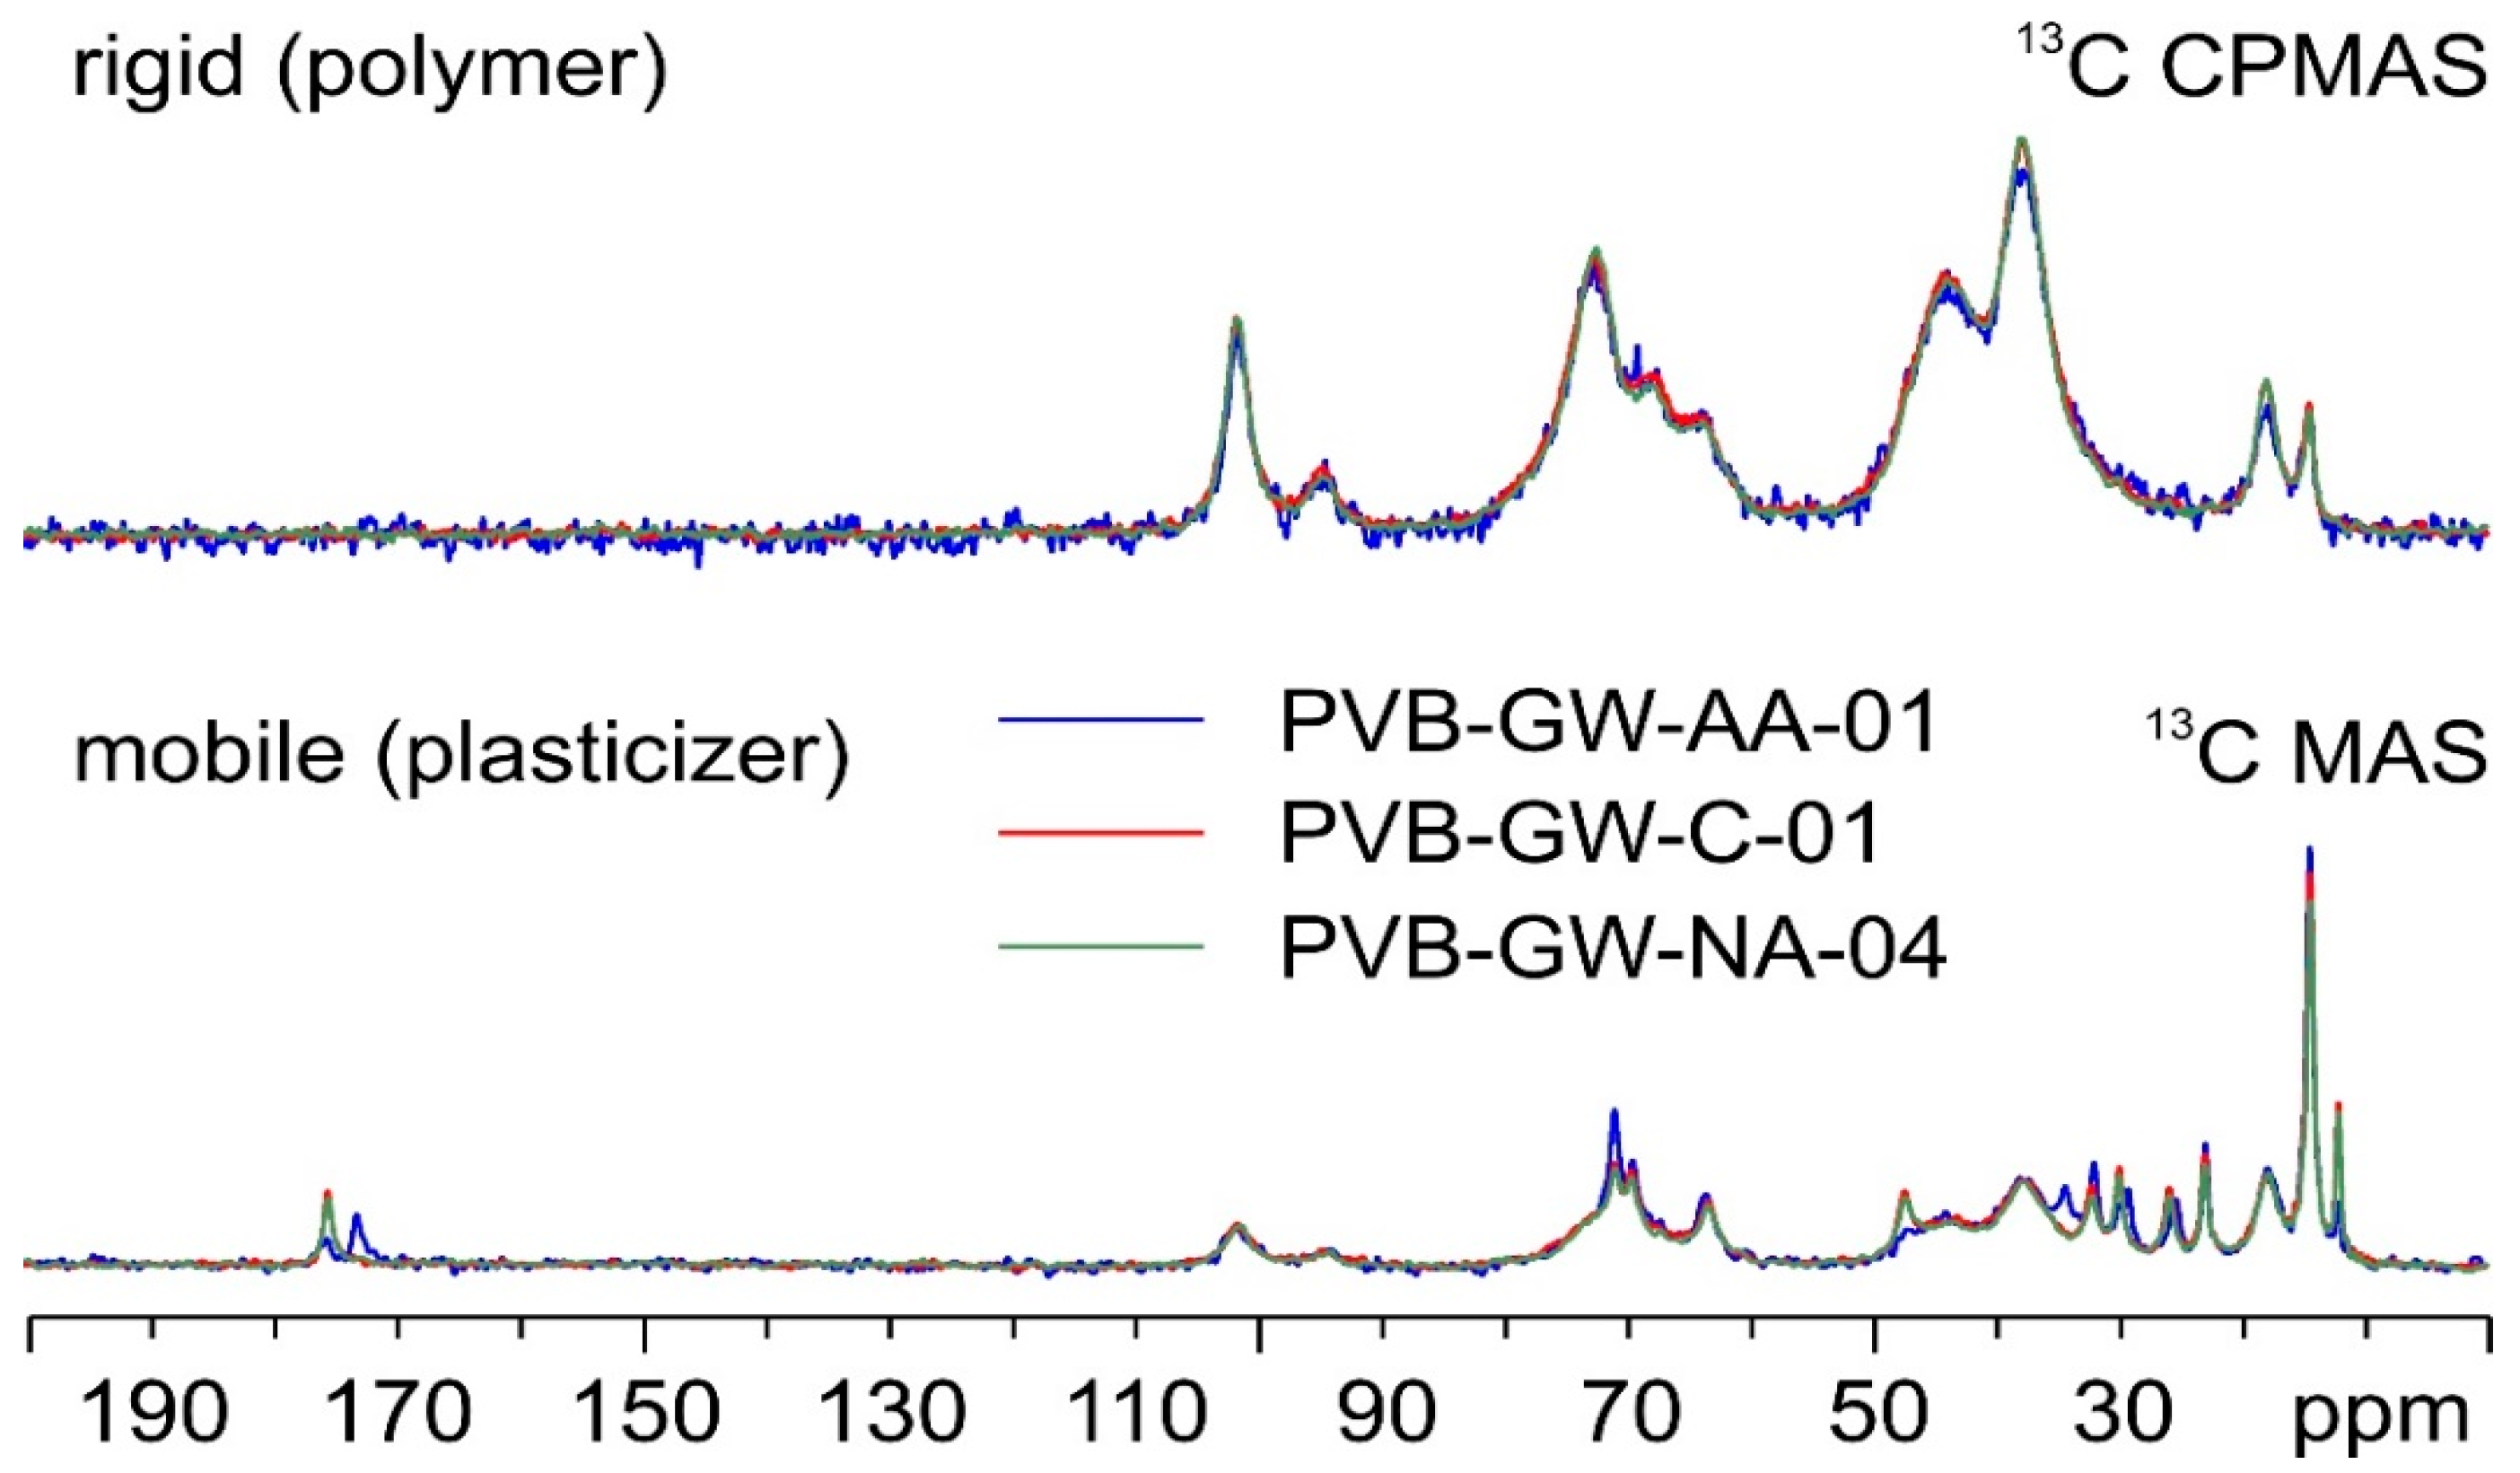
Regarding GW samples,
Figure 6 shows the
13C SSNMR spectra of the three analyzed batches of PVB, namely PVB-GW-AA-01, PVB-GW-C-01, and PVB-GW-NA-04.
Once again, if the signals referring to the polymer component of the materials (top in
Figure 6) are superposable, those ascribable to plasticizers are not; indeed, while PVB-GW-C-01 and PVB-GW-NA-04 are completely coincident, both exhibiting only signals relative to 3GO, PVB-GW-AA-01 (blue spectrum) appears to contain a mixture of plasticizers, as indicated by the additional signals at 173.1, 34.3, 29.2 and 25.3 ppm. Further comparisons with PVBR-E and PVBR-F indicate that this mixture of plasticizers does not include either DHA or DBS.
Notably, a comparison between the spectra of PVB-GW-NA-04 and PVB-GR-AUTOMOTIVE (
Figure 7) shows how, although the rigid part of the materials coincides, the former displays some broadening of the signals of the plasticizer (3GO) with respect to the latter. This is possibly due to a reduction in the mobility of the plasticizer associated with some degree of amorphization [
30].
3.2. Plasticizer Content by TGA
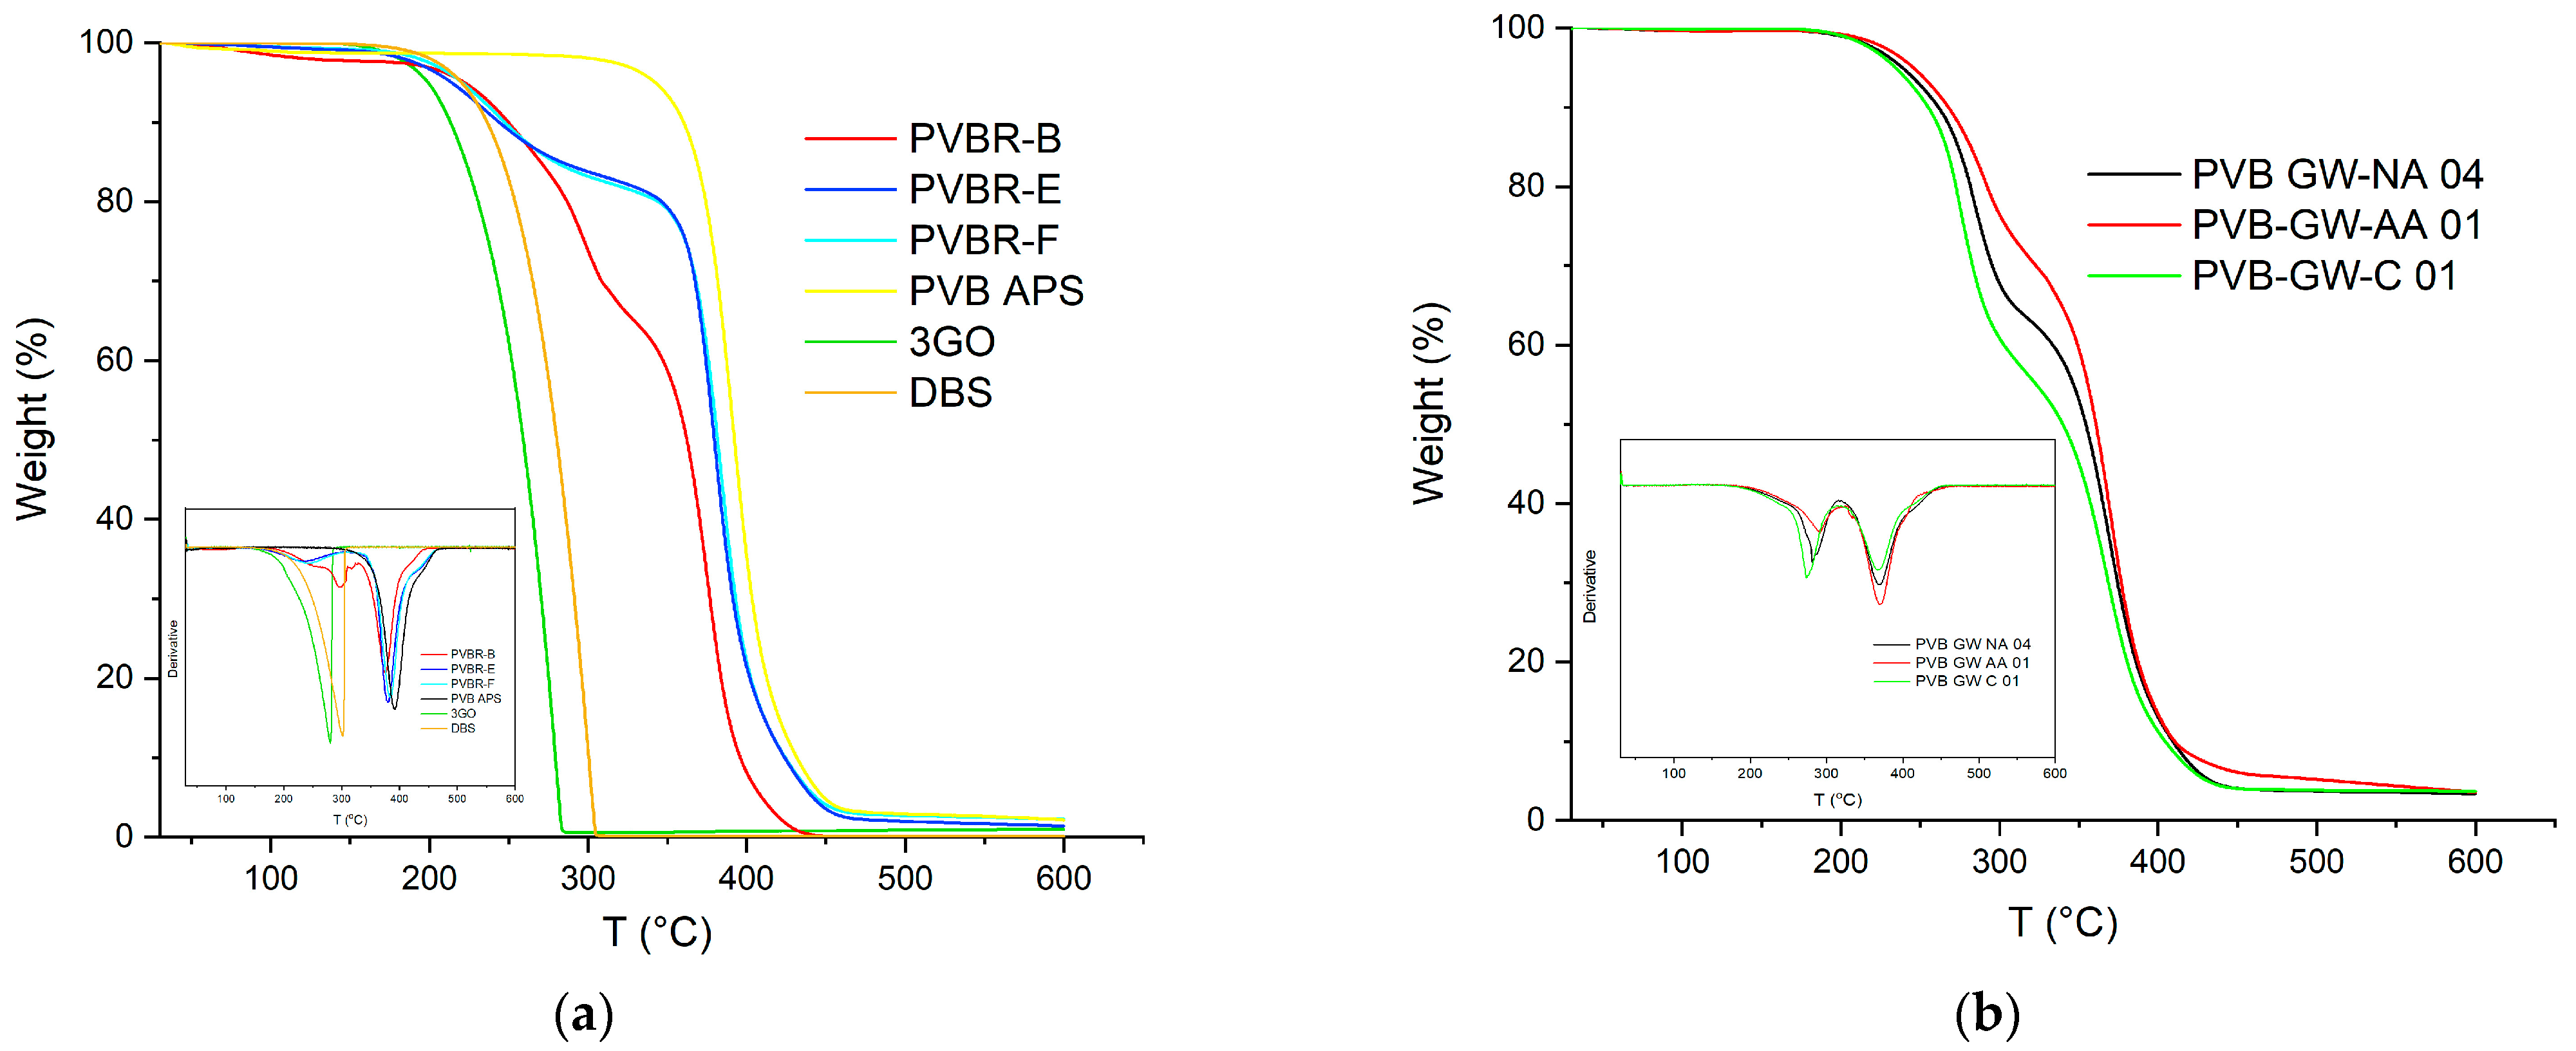
The satisfactory calculation of the plasticizer content was achieved through the application of TGA (
Figure 8). In the case of PVB APS, a single-step curve was obtained, with the onset of degradation determined at 329 °C (
T5%), while the maximum weight loss rate (
Td) was recorded at ca. 391 °C (
Table 2). This outcome was expected since the grade is unplasticized; thus, the
T5% and
Td correspond exclusively to the decomposition of the polymer. Finally, a char residue of ca. 1 wt.% remained at 600 °C. Similarly, in the case of the pure 3GO (
Figure 8a), again, one single step was observed, corresponding to the evaporation of the plasticizer, which began at ca. 188 °C, reached its maximum mass loss rate at ca. 273 °C, and was almost completely evaporated before 300 °C, leaving a low residue of ca. 1.6 wt.%. On the contrary, when looking at the mass loss curves of the plasticized PVB films (PVBR-B, E, and F) a multi-step mass loss curve is observed. A first small step can be found at ca. 100 °C with a mass loss of about 0.5 wt.%, which corresponds to moisture evaporation. The next mass loss step, usually assigned as the first step (Step 1), starts at ca. 150 °C and ends at 330 °C with a mass loss in the range of 18.5–31 wt.%. This step is attributed to the evaporation of the contained plasticizer [
23,
31], providing an accurate determination of the plasticizer content feasible via TGA. The last mass loss step (Step 2), with a mass loss in the range of 50–75 wt.% takes place between 320 °C and 420 °C and relates to the decomposition of the polymer backbone [
26,
31].
It is worth mentioning that the plasticizer contained in these samples begins to evaporate in the range of 215–240 °C (
T5%), the latter being ca. 28–55 °C higher than the
T5% value of the pure 3GO (
Table 2). This proves that the plasticizer is effectively embedded in the PVB matrix; thus, its evaporation shifts to higher temperatures. Moreover, the
T5% values of the PVBR series of samples do not correspond to the onset of polymer degradation, as in the case of unplasticized PVB, but to the onset of plasticizer evaporation. Similarly, the plasticizer removal reaches its maximum rate in the range of 244–310 °C (
Td1), which is higher than the
Td value of the neat 3GO, but much lower than the neat PVB. The variation in the decomposition temperatures of each PVBR- sample proves that a different plasticizer might affect differently the polymer matrix. More specifically, according to the
Td1 values of PVBR-B, E, and F, it can be concluded that 3GO is the plasticizer more effectively held in the polymer lattice, showing the highest value herein (
Table 2). This can be attributed to the more polar character of 3GO, interacting more with the polar groups of the PVB molecular structure. On the contrary, DHA, a molecule of reduced polarity compared to 3GO, is loosely attached to PVBR-E, since it begins to evaporate ca. 74 °C lower. PVBR-F with DBS as plasticizer shows an intermediate behavior closer to that of DHA. In addition, from the deconvolution of the second mass loss step and after subtracting the plasticizer content, the PVB content can be determined accordingly (
Table 2). The maximum decomposition rate at the second step (
Figure 8) was reached in the range of 382–392 °C (
Td2), very close to the respective value of the unplasticized PVB grade (391 °C). This confirms that the
Td2 values indeed correspond to the decomposition of the PVB fraction.
Turning to the TGA of GW samples (
Figure 8b), it can be deduced that they present the same thermal behavior as the reference samples, with their plasticizer content ranging from 28 to 41%
w/
w, depending on the application (automotive or construction) (
Table 2).
Moreover, for the analysis of TGA, it is more straightforward to distinguish the two discrete steps of the TGA curve when referring to the derivative (%/°C) of the curves. As shown on the inner graph of
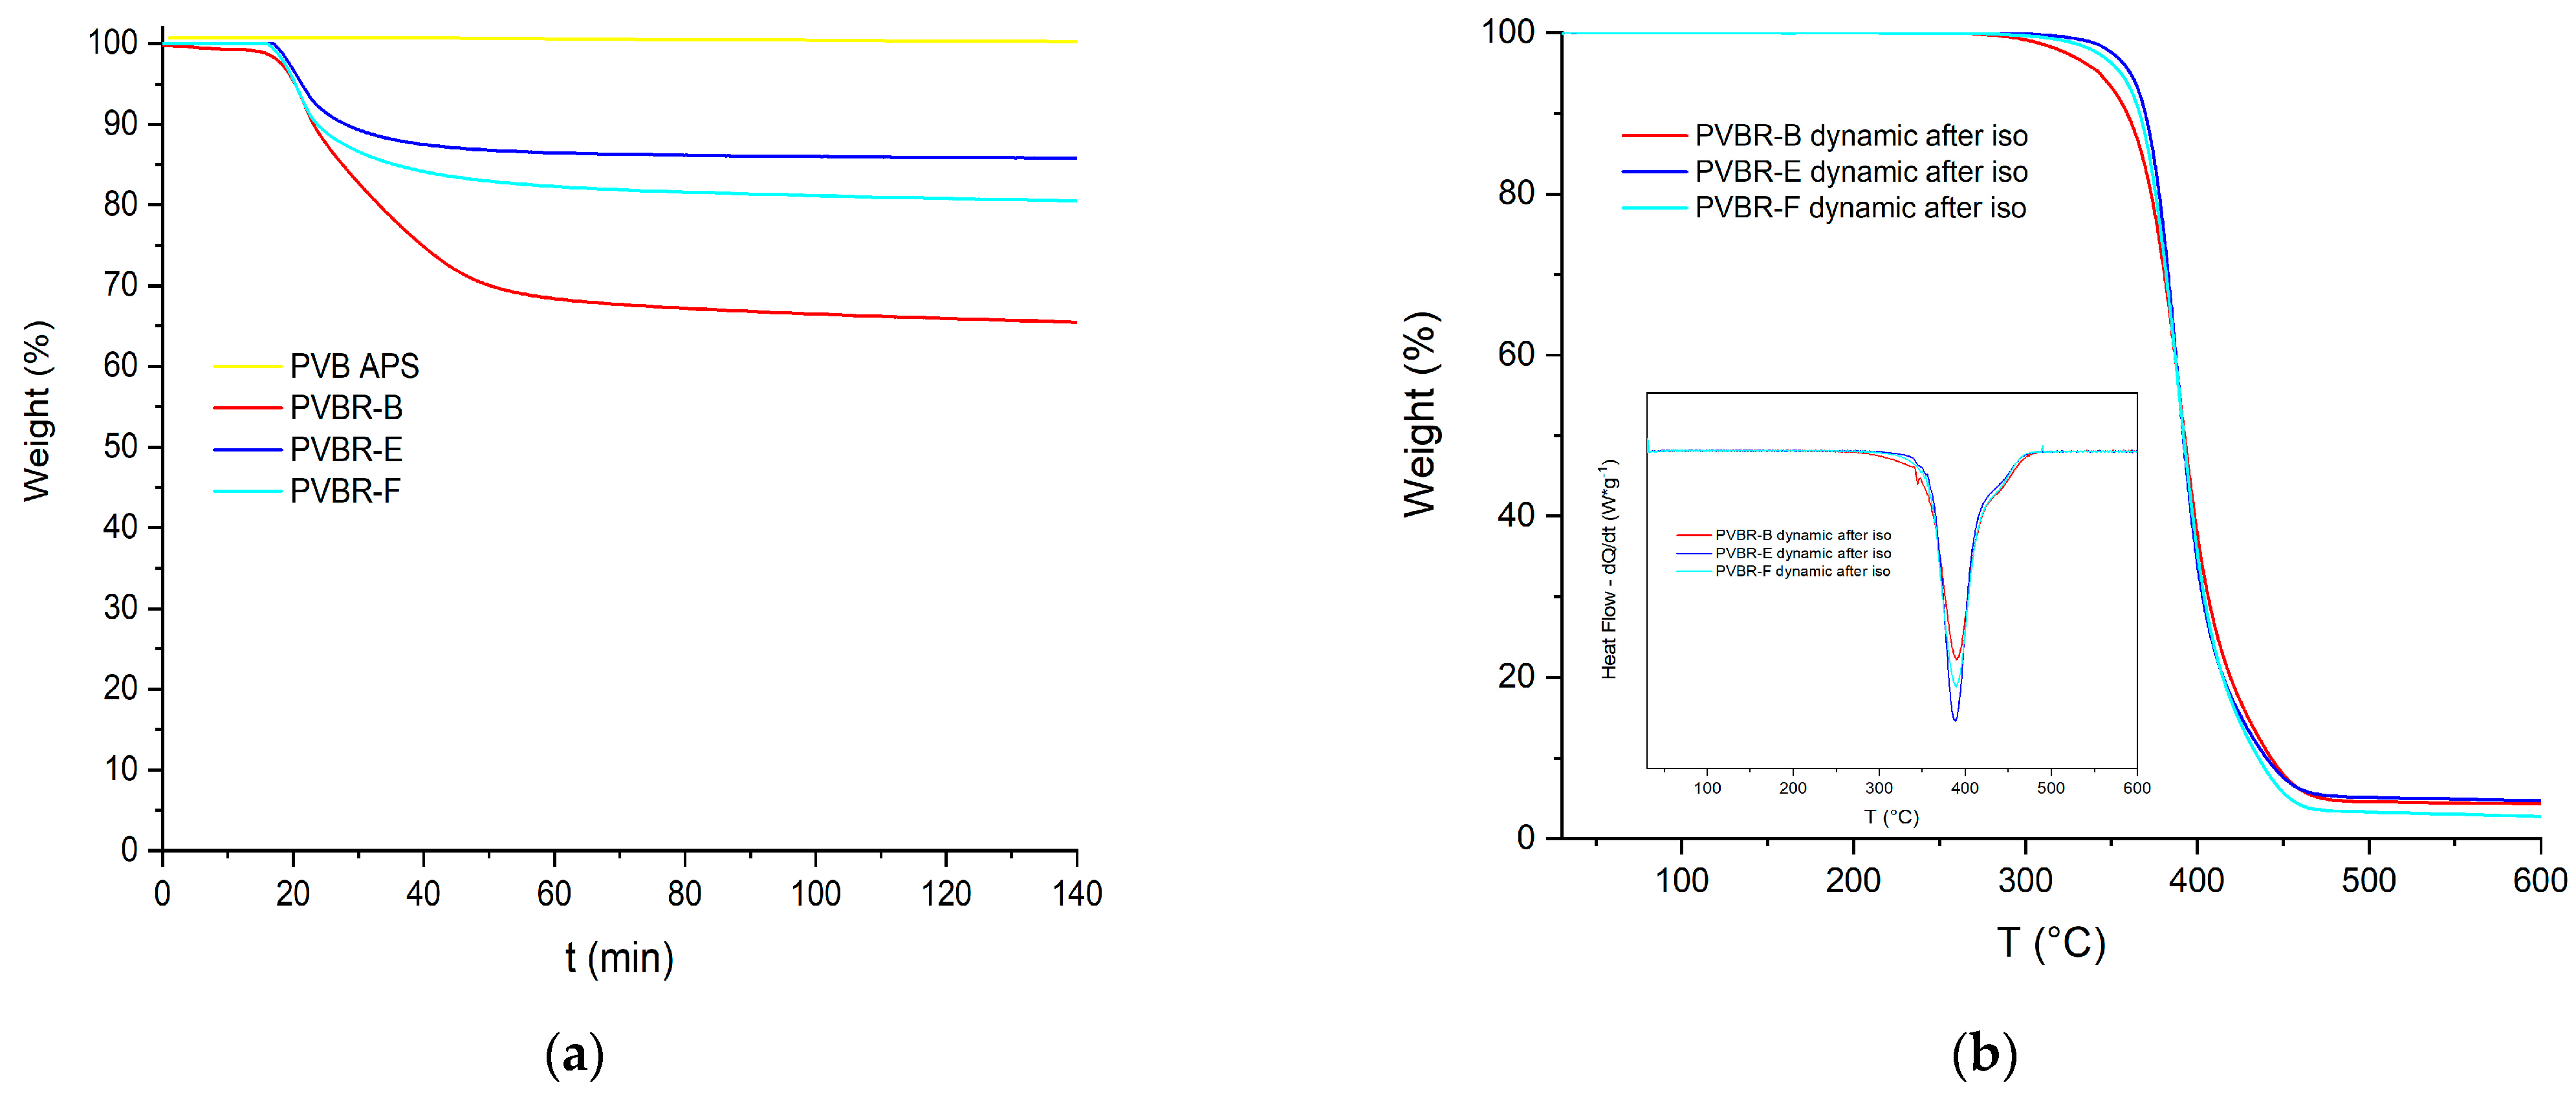
Figure 8a, there are two separate peaks, each showing a different decomposition process occurring. Although it is helpful to discriminate the two different processes in progress, the corresponding derivative signals are almost overlapped, making it hard to accurately estimate the limits of each process. To overcome this hurdle and more accurately estimate the plasticizer content, isothermal TGA runs were conducted so as to fully remove the plasticizer from the polymer matrix at a temperature, i.e., 250 °C, where the plasticizer can evaporate, but the PVB fraction would show only very limited mass loss due to thermal degradation (
Figure 9a).
After approximately 70 min at 250 °C, the rate of loss drops markedly, and it might be assumed that complete depletion of the plasticizer has taken place. A continuous slow further weight loss should be attributed to the slow degradation (<4%) of the polymer, as this drop is also observed in the case of the unplasticized polymer. The weight loss due to polymer degradation must be subtracted from the curves of the respective plasticized samples since it is not relative to plasticizer evaporation. In
Table 3, the determined plasticizer contents from dynamic and isothermal TGA runs are presented, showing some deviations, especially for PVBR-E. While dynamic analysis provides a better overall understanding of the samples, the isothermal analysis is considered more accurate for the estimation of plasticizer content, but it is more time-consuming and it does not provide further information for the PVB component of the sample (
Td2). Furthermore, the PVBR- series of samples, after the isothermal TGA runs, were scanned dynamically up to 600 °C (
Figure 9b). Indeed, the mass-loss curves of all PVBR- became one-step, and mass loss in the range of 200–300 °C is no longer observed, thus proving that the plasticizer was efficiently and totally removed during the previous isothermal step.
In order to verify the aforementioned TGA results on the plasticizer content, direct removal of the plasticizer was attempted by SE, which is a well-known process to extract oils or substances from PVB samples in many cases [
22,
24]. The process was applied on all the reference plasticized PVB samples (PVBR-B, E, F) for removing the plasticizers (3GO, DHA, DBS, respectively), and determining the mass balance. Plasticizers can be either internal or external. 3GO, DHA, and DBS are considered mainly as external plasticizers since they can be lost by evaporation, migration, or extraction [
31]. Hexane was used as a solvent, due to its relatively low boiling point (ca. 69 °C) and its miscibility with the contained plasticizers [
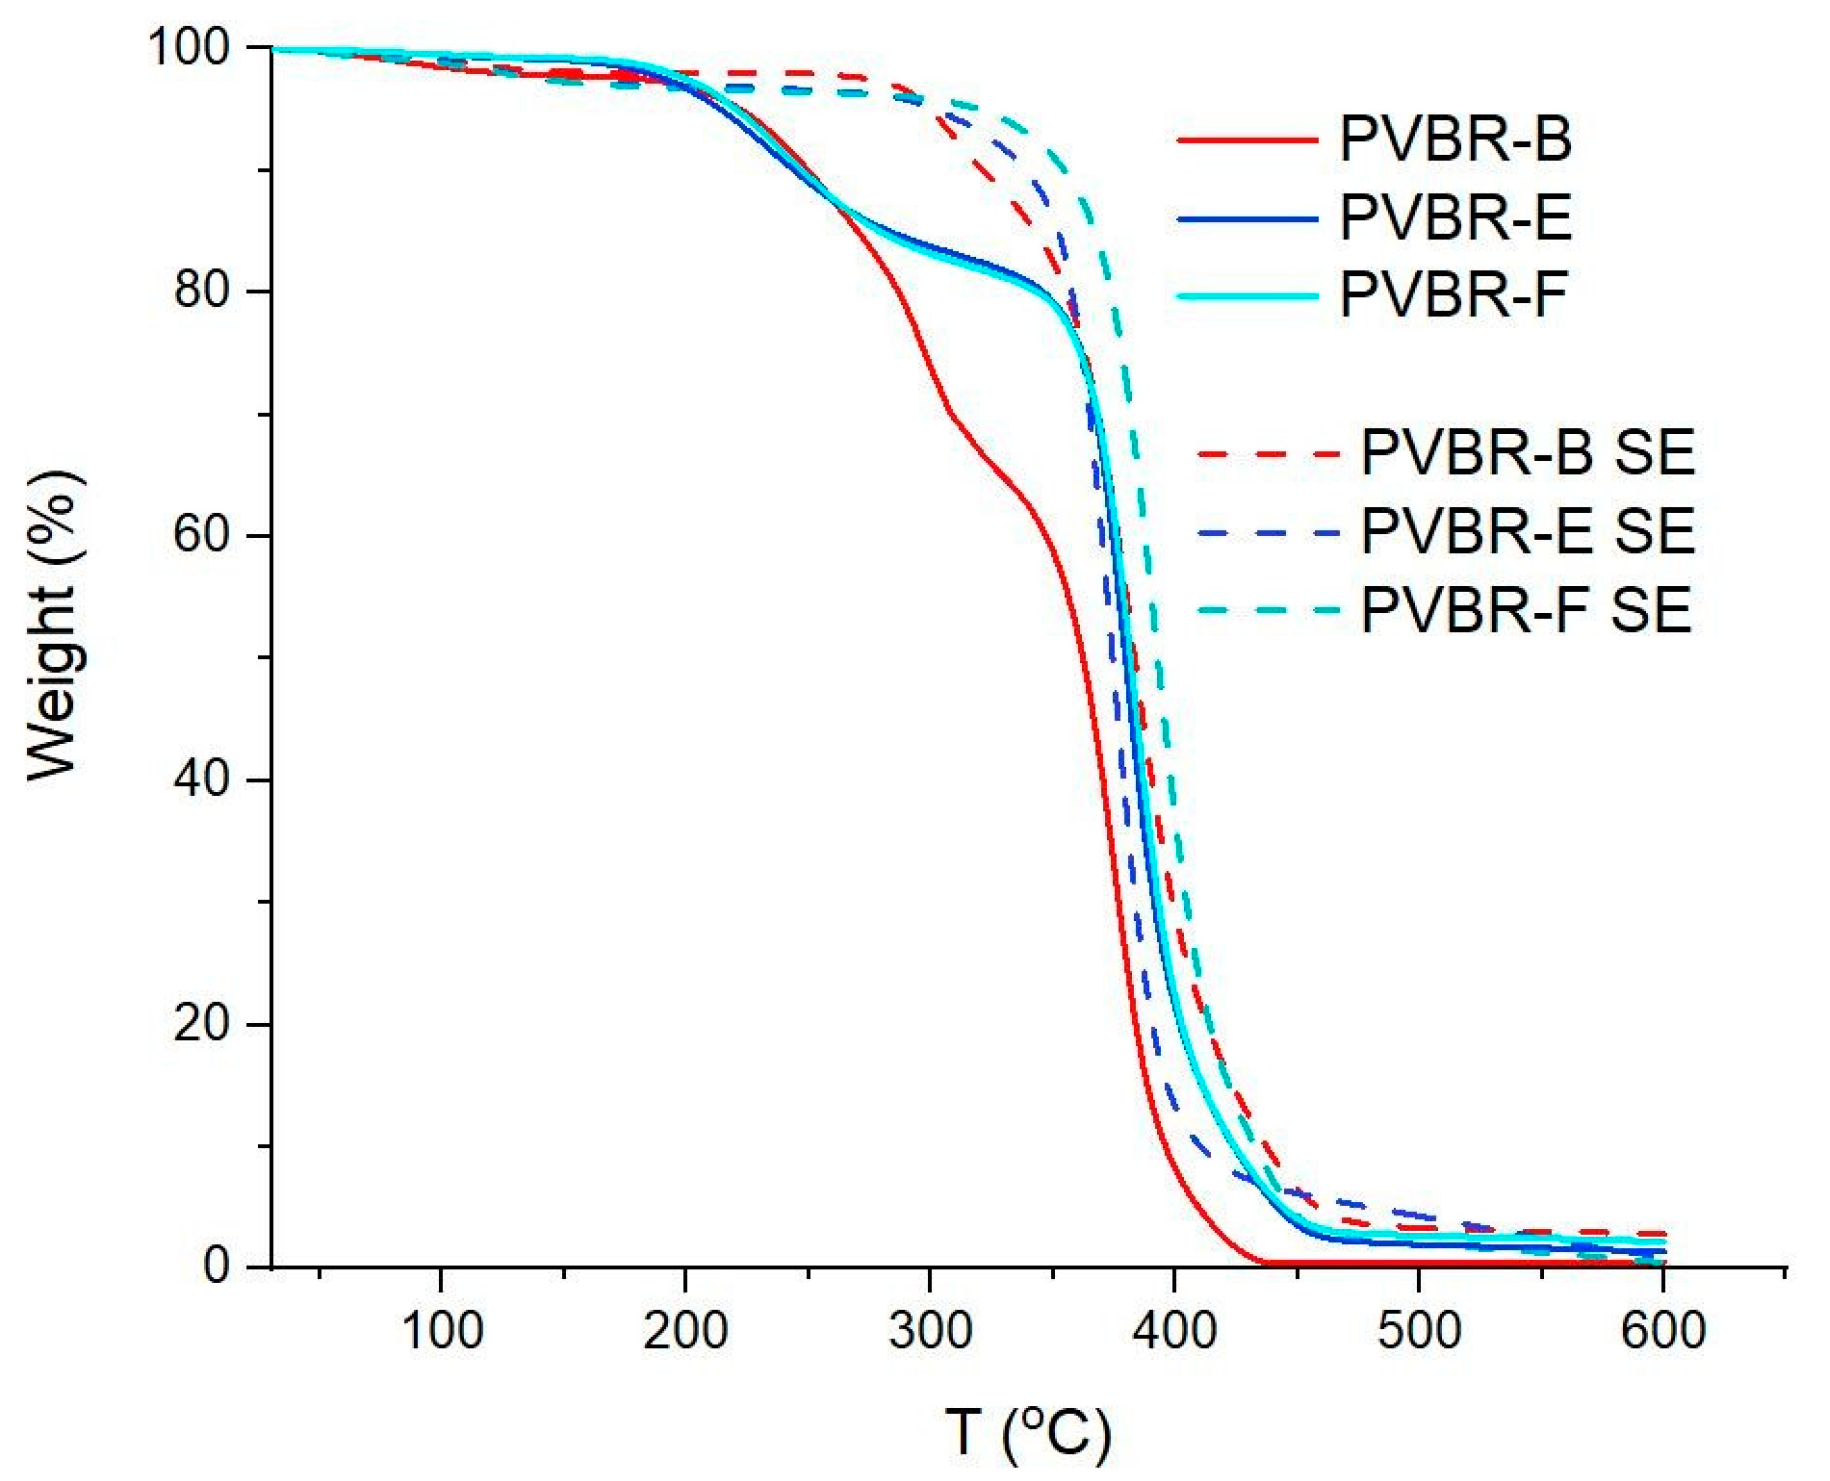
25]. All three PVBR- samples were subjected to SE for 12 h, after which the residual PVBR-SE samples were also characterized by TGA analysis. Accordingly (
Table 4), PVBR-E-SE and F-SE samples showed plasticizer removal values very close to the pre-determined values by TGA. Indeed, as shown by TGA analysis (
Figure 10) in the SE-treated samples, the curves became one step; thus, total removal of DHA or DBS should have been achieved. On the contrary, in the case of PVBR-B-SE, which contains 3GO, total removal was not successful since a two-step decomposition was still observed, with the 1st step determined at ca. 12%, which is much lower than the initial value of 31%
w/
w, that PVBR-B exhibited (
Table 3). 3GO seems to display a higher affinity for the polymeric matrix than for hexane in comparison with DBS and DHA, since the boiling points of these three plasticizers are very similar (in the range of 344–350 °C). The different polarity of each plasticizer could be an explanation, too, since 3GO has a different and more polar molecular structure as previously explained, compared to DHA and DBS, which are more similar to each other [
8].
3.3. Plasticizer Content by FT-IR Analysis
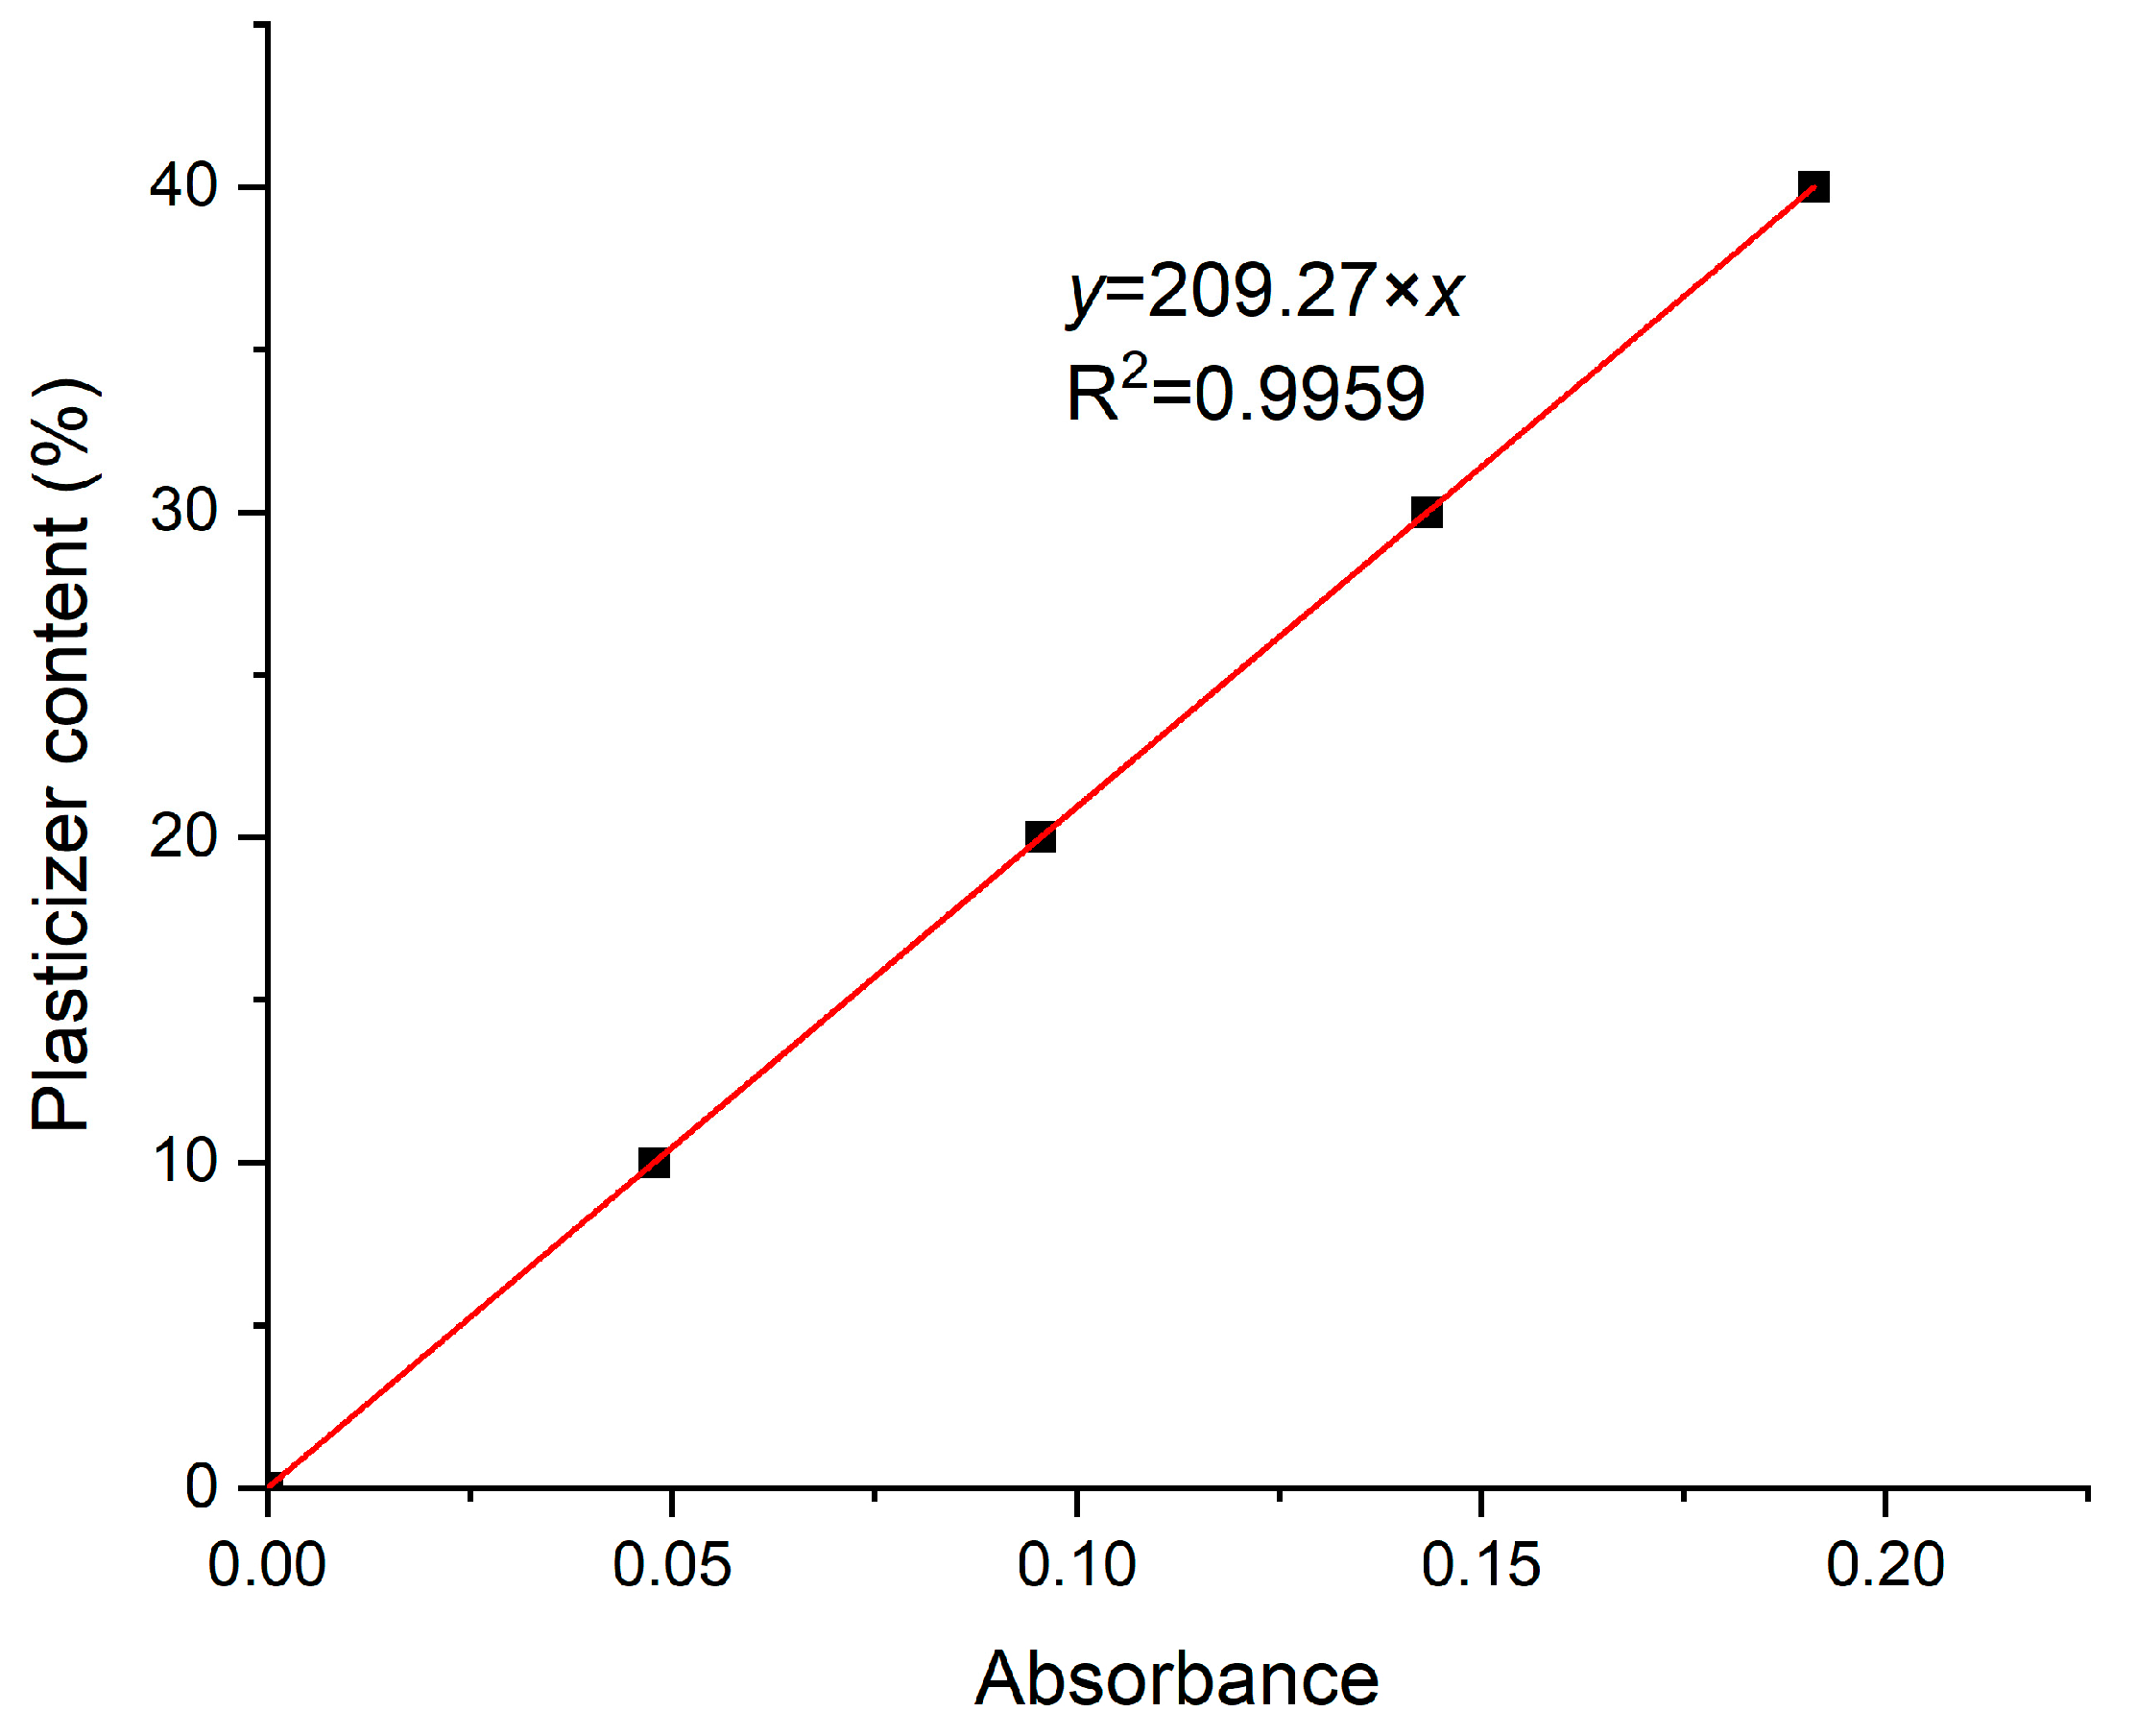
Alternatively, for a quicker and nondestructive estimation of the plasticizer content, FT-IR was used. According to the aforementioned FT-IR analysis, the qualitative identification of the main PVB and plasticizer peaks and plasticizer is feasible. In order to have a quantitative view of the plasticizer content, the development of an FT-IR master curve was performed, which was calibrated against the signal of the plasticizer peak at 1740 cm
−1 [
32]. To calibrate the master curve, five model samples of predefined plasticizer content were prepared by casting in THF. Accordingly, unplasticized PVB APS was solubilized in THF, and each time the desired 3GO fraction (0, 10, 20, 30, 40 wt.%) was added to the formed solution. After stirring, each solution was placed in a petri dish and was left overnight under the fume hood so as to evaporate the solvent and produce the casted film. Subsequently, the received films were further vacuum dried in the oven at 50 °C for total removal of THF. The thickness of the casting membranes varied, but this is no issue for ATR, since it estimates the superficial concentration of a solid and since all the films are homogenous. In addition, 10 different FT-IR spectra at different spots were received for each model-casted sample, and the average intensity of the C=O stretching peak at 1740 cm
−1 was determined. The extracted FT-IR master curve is shown in
Figure 11, where there is a clear linear equation (R
2 = 0.99)
y = 209.27 ×
x, where
y is the plasticizer content and
x is the determined absorbance. The intercept was assumed to be zero, since the VAc content is too low in most PVB to contribute to the estimations for most PVB products.
Assuming that most plasticizers exhibit the same absorbance intensity at 1740 cm
−1 as 3GO and that most PVB grades have a similar VAc content (<3%), the FT-IR master curve was tested for all the samples, and it was concluded that it could reliably estimate the plasticizer content within a deviation of ±6 wt.% (as reported above in
Table 4). This is considered a useful tool for a quick and fair estimation of the plasticizer content of a PVB film. Furthermore, in order tο ensure that membranes contained the actual dosed plasticizer content, determination of the real plasticizer quantity via dynamic TGA was performed, while the
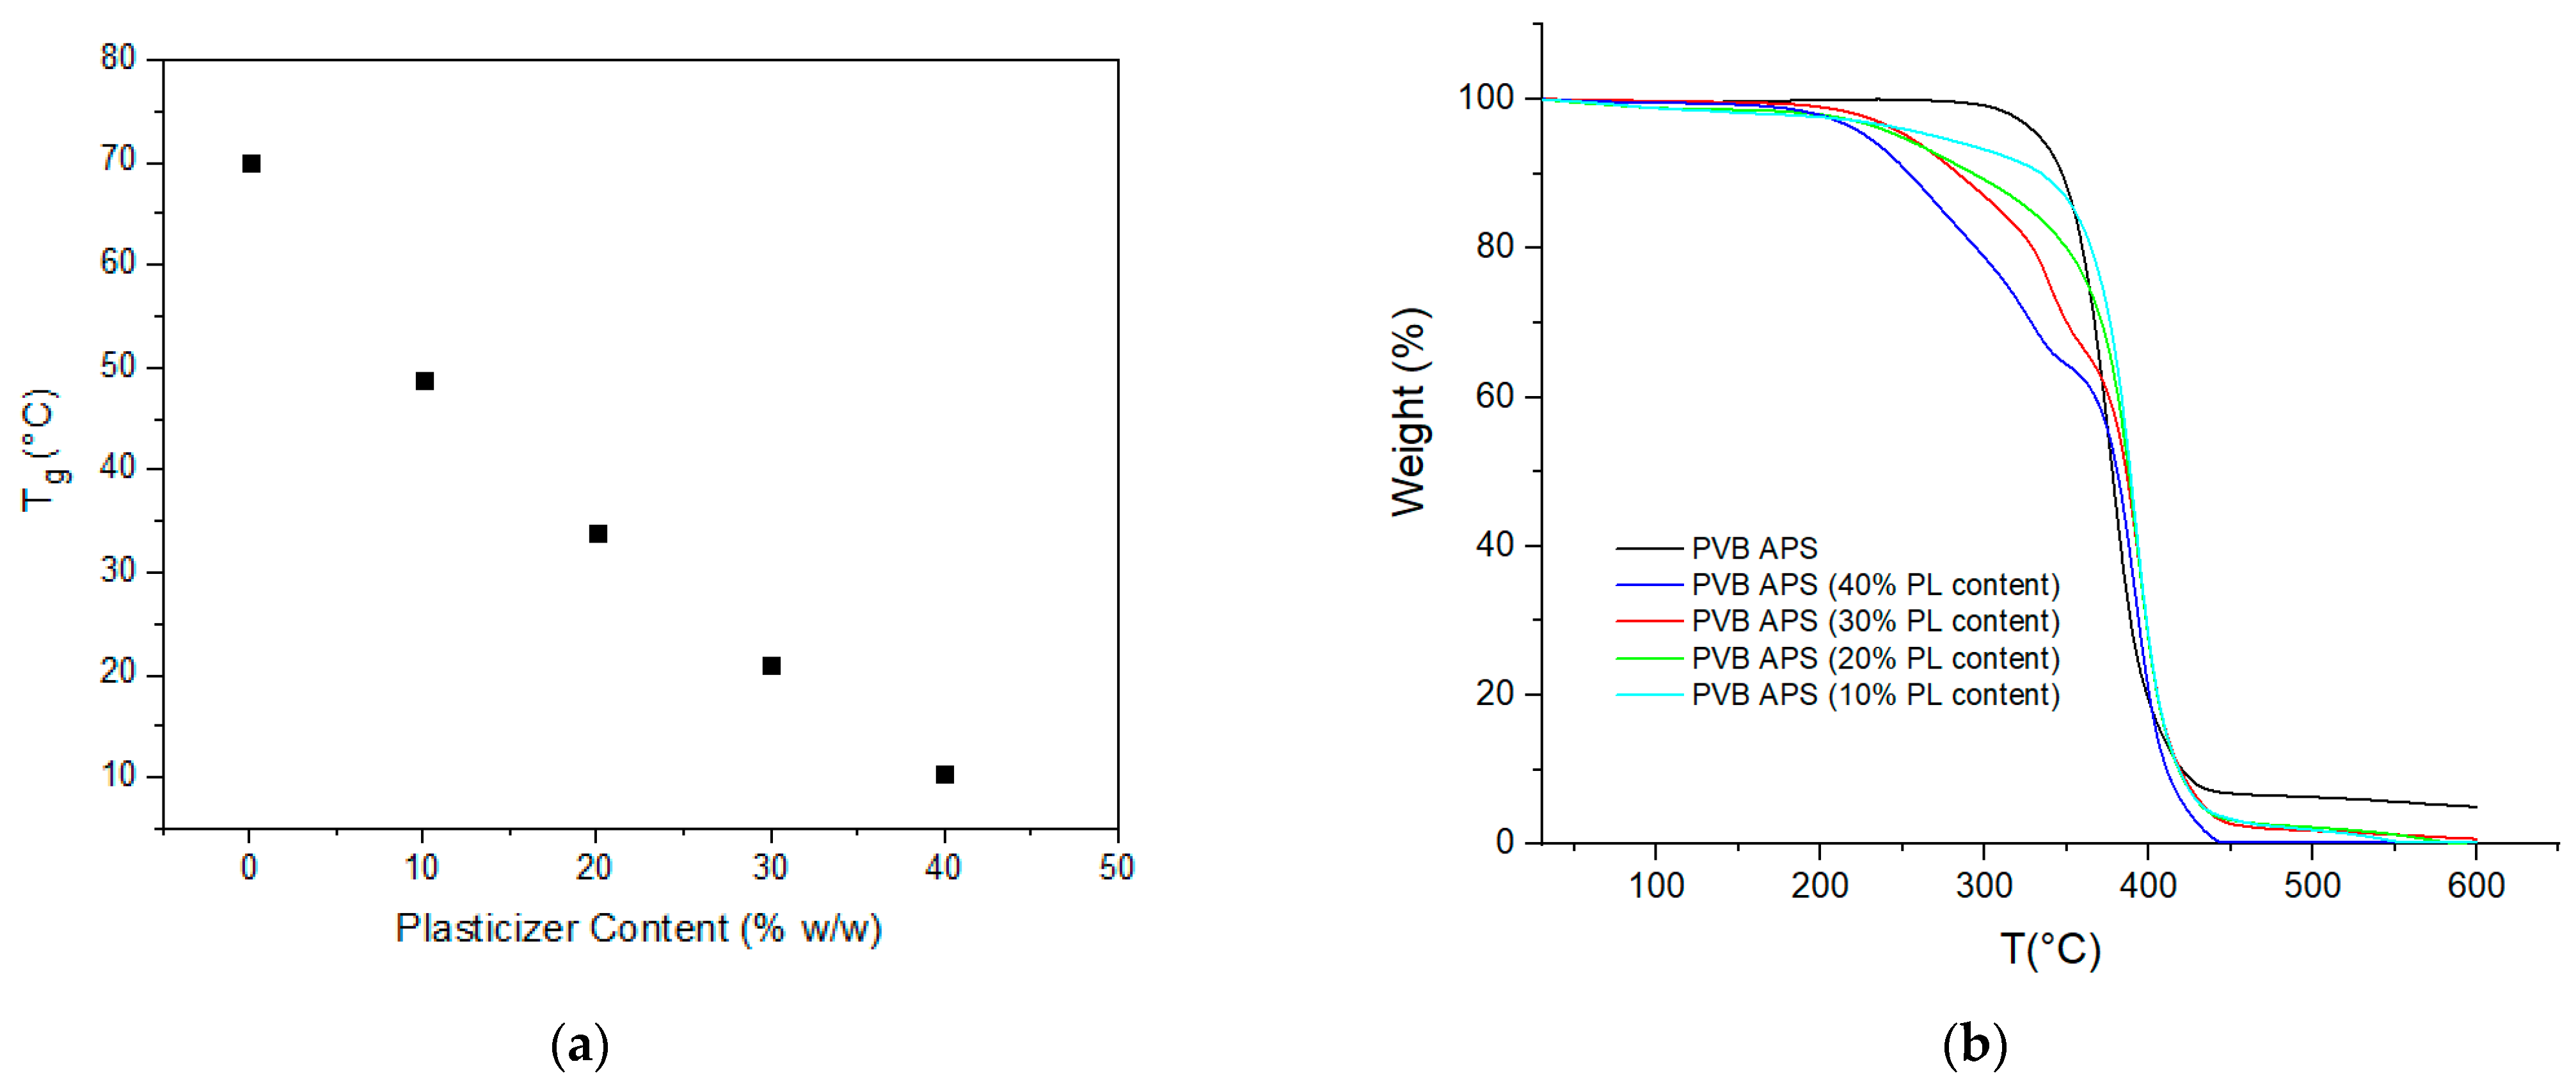
Tg value via DSC was determined and correlated to the plasticizer content. As expected, the 3GO content and determined
Tg value were inversely proportional according to DSC, while the 3GO content as determined by TGA matched the actual dosed quantity (
Figure 12).
3.4. Plasticizer Content by NMR
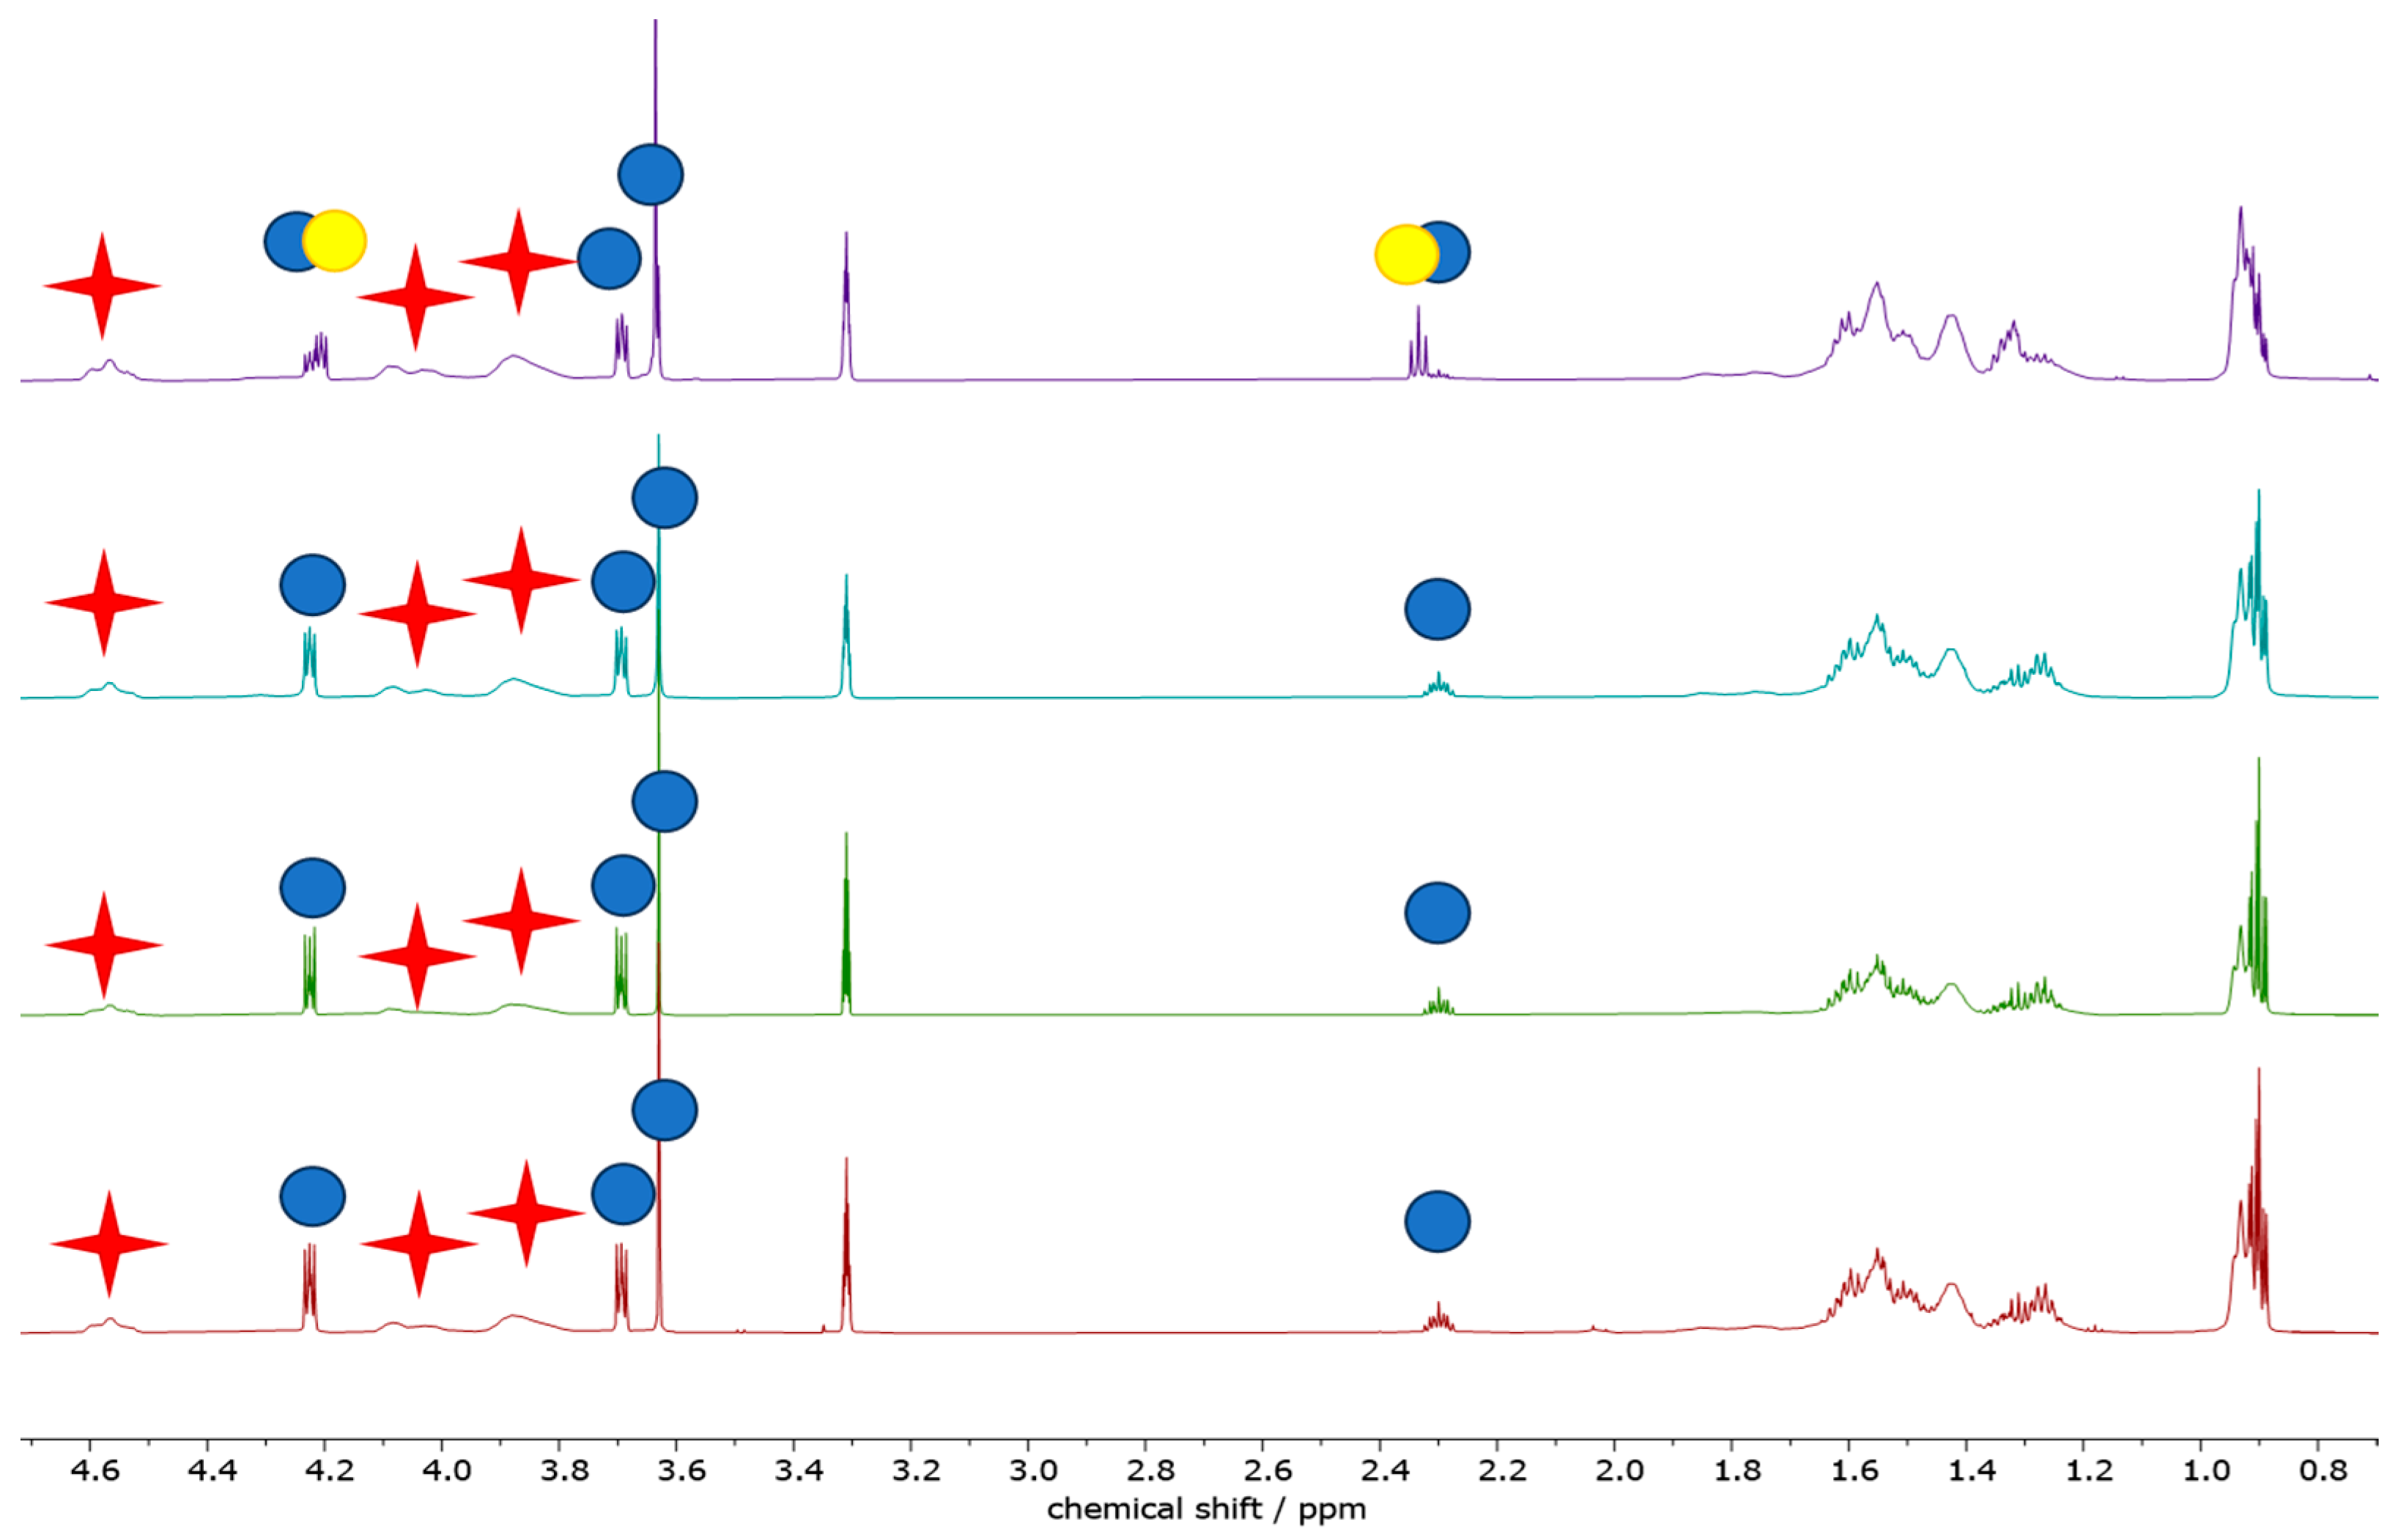
Aiming at a more chemistry-oriented investigation, liquid-phase NMR was exploited (
Figure 13), a powerful technique to analyze the chemical composition of a composite material (such as PVB) and/or to quantify the relative amounts of different components in a specific formulation (i.e., the presence of a plasticizer). In the present context, NMR would also be very useful to assess possible degradation suffered by the polymeric film undergoing different treatments. All the values discussed in the following paragraphs are summarized in
Table 5.
By comparing the integrated area under the NMR peaks, it is feasible to calculate the relative concentration of two compounds in a sample. All solution NMR spectra of the PVBR-R samples show the presence of the characteristic PVB signal, located at 4.53 ppm, along with the PV-OH (vinyl-alcohol residue) one at 4.28 ppm. The presence of PV-OH is expected as the reaction between polyvinyl alcohol and butyraldehyde is not quantitative. Quite similar PV-OH:PVB: molar (weight) ratios were found, slightly increasing from PVBR-B, 1:7.7 (4:96), to PVBR-F, 1:6.7 (4:96), to PVBR-E, 1:5.9 (5:95). It should be noted that these differences are too small to be considered significant. On the other hand, spectra differ in the peaks ascribable to the different plasticizers. PVBR-B shows a characteristic peak of 3GO located at 4.23 ppm, whose integration allows calculating the polymer-to-plasticizer molar (weight) ratio as high as 7.7 (33:67). Here, it is worth recalling that the weight ratio has been calculated using the molecular weight of the vinyl butyrate (or vinyl alcohol) monomeric unit. Only a slightly higher amount of a different plasticizer was found in PVBR-E (signals at 4.07 and 2.34 ppm for DHA) and PVBR-F (signals at 4.07 and 4.31 ppm for DBS) with a 34:66 and 41:59 weight ratio, respectively. It is worth noting that the molar ratios (i.e., 1:5.3 and 1:3.8, respectively) are more variable, being normalized for the (different) molecular weight of the plasticizers (i.e., 402.6 for 3GO and 314.67 g mol
−1 for both DBS and DHA). As distinguishing evidence, PVBR-F clearly shows the presence of some spurious peaks (highlighted with yellow circles in
Figure 13), ascribable to an additional (very likely 3GO) plasticizer accounting for 8% of the total plasticizer amount. With respect to plasticizer quantification, a remarkably good agreement with TGA data was found for PVBR-B only, whereas the plasticizer amount for both PVBR-E and PVBR-F resulted quite overestimated (
Table 3). Such a discrepancy could be justified considering different factors both from the TGA and NMR points of view. Starting from the latter, the overestimation found in the analyses could be related (i) to different relaxation times between the polymer and the plasticizer, showing much longer values or (ii) to a different solubility of the two components in the NMR solvent (MeOD—Deuterated methanol). Thus, we performed some experiments increasing the relaxation time (up to 60 s) or reducing the concentration (down to 5 mg/mL); yet, in both cases, no significant modification of the NMR spectra could be evidenced. On the other hand, an underestimation of plasticizer amount from TGA data could be ascribable to a sequestration of the plasticizer into the polymer structure: as a matter of fact, “entrapped” plasticizer will evaporate only when the associated structure of the polymer is broken.
Finally, some peaks in the aromatic region (between 6 and 9 ppm) are detected for all the analyzed spectra but with a remarkably weaker intensity compared to the main peaks (<0.1%). They were tentatively assigned to thermal and/or UV stabilizers (usually heterocyclic compounds) that could be likely present within the polymer formulation.
When glass waste samples were analyzed (
Figure 14), only minor changes could be observed, at least from a qualitative point of view, in the NMR spectra but for PVB-GW-AA-01. Indeed, in its spectrum 3GO appears as the secondary plasticizer, with the main one being different, generating characteristic peaks located at 4.21 ppm (multiplet) and 2.33 ppm (triplet). This is also associated with qualitative differences in the multiplet accounting for the aliphatic protons resonating below 1 ppm and around 1.2–1.3 ppm. Albeit it was not possible to figure out the nature of these plasticizers, due to the similarity in both chemical shift and shape of its signals compared to the homologous 3GO, we can propose two possible attributions: it could be a structural analogue of 3GO or a degradation product of the latter. On the other hand, PVB-GR-AUTOMOTIVE only presents a spurious peak (barely visible) at 3.49 ppm (quartet), whereas no meaningful difference in PVB-GW-C-01 and PVB-GW-NA-04 spectra, compared to the pristine PVB material, could be observed.
Going into detail with the quantification of both PVB and plasticizers, one could note that the relative amount of the latter increases, passing from PVB-GW-AA-01 (PVB:PL weight ratio = 1:0.22), to PVB-GW-C-01 (1:0.29), to PVB-GW-NA-04 (1:0.34), and reaching a maximum plasticizer amount in PVB-GR-AUTOMOTIVE (1:0.34). A similar trend could also be seen when PV-OH is considered (
Table 5).
3.5. Molecular Weight
Dilute solution viscosity analysis is an accurate analytical tool for indirectly estimating the molecular weight of polymers. Solution viscometry was performed in the case of PVB films in tetrahydrofuran (THF) [
20]. The concentration of the solutions is 0.5 g·dL
−1 [
33], but in the case of measuring plasticized PVB grades, the concentration of the solution was corrected for the plasticizer content as determined by TGA analysis, so as to have an actual polymer concentration of 0.5 wt.%. That way, any impact of the plasticizer on the viscosity was reduced. In fact, this viscosity statement is only true if there is no close interaction between the polymer and the plasticizer in the diluted solution. If the hydrodynamic volume is changed through interactions the determined value is not any more correct. Nevertheless, the particular analytical technique is considered reliable to relatively compare the molecular weight of the different PVB samples. PVB APS exhibited an [
η] value of 1.75 dL g
−1, while the plasticized grades were determined in the range of 1.50–2.02 dL g
−1 (
Table 6).
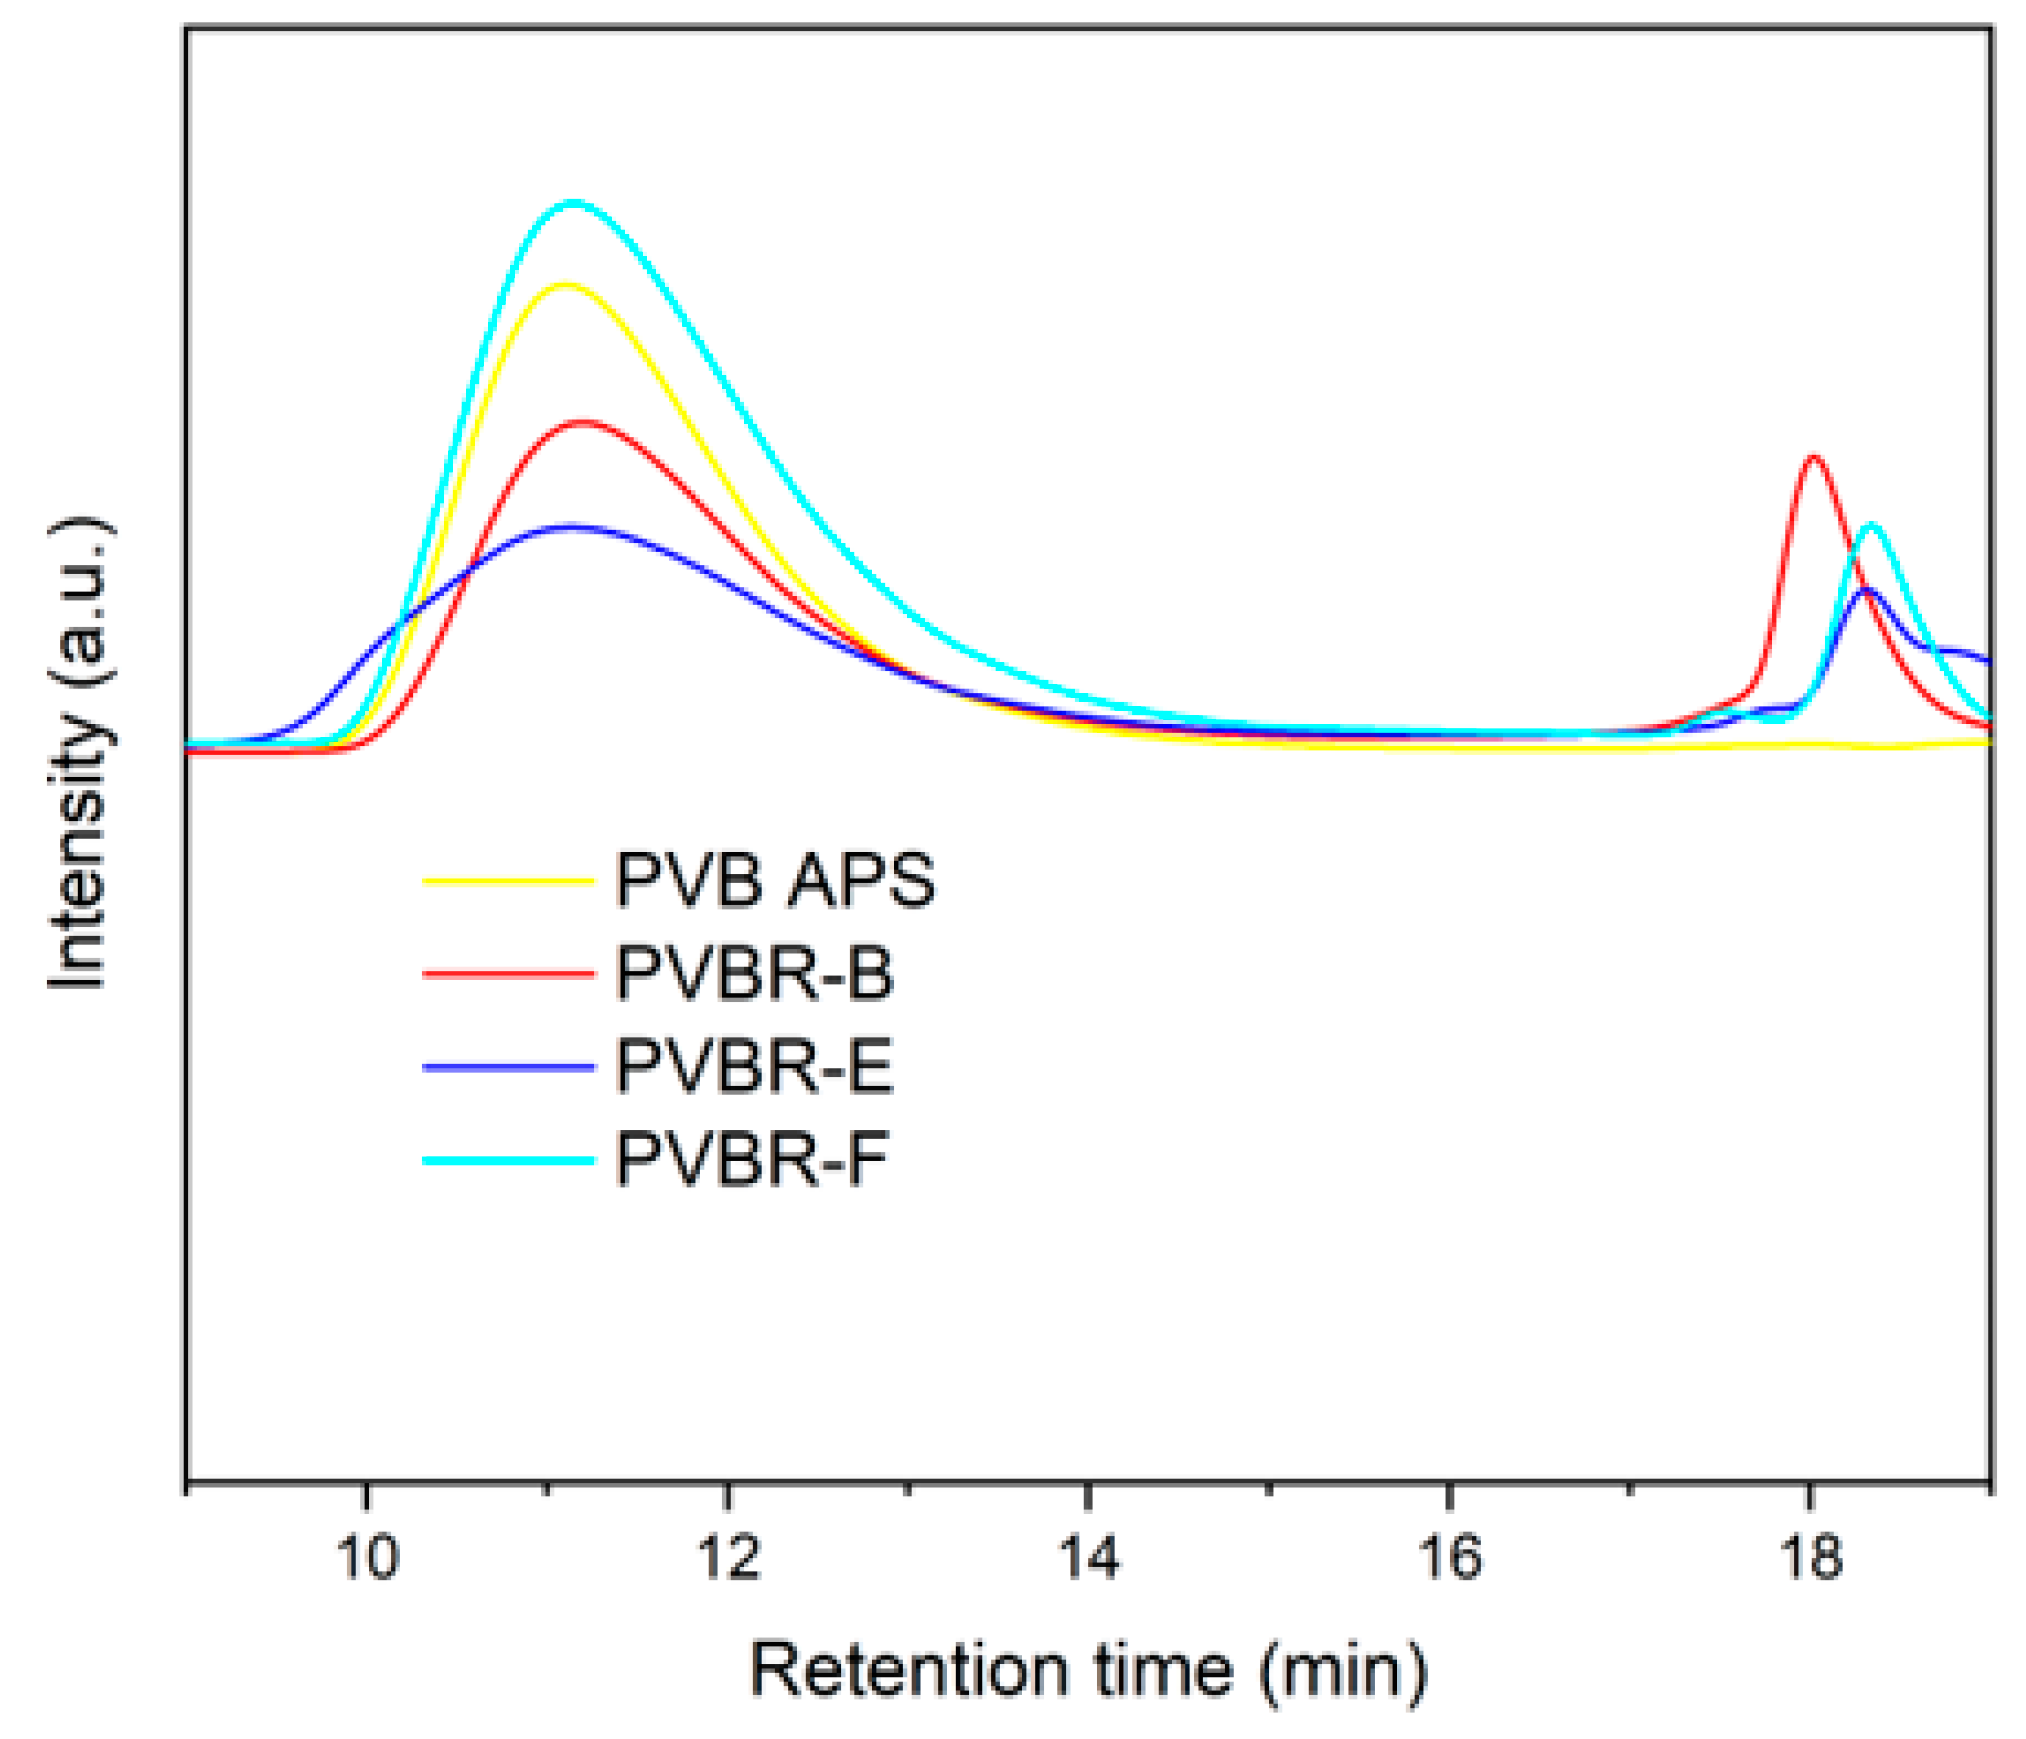
To clarify this, supplementary GPC measurements in THF were also performed (
Figure 15). As shown, there are two different distributions; the first corresponds to the higher molecular weight of polymer (PVB), and the second one to the plasticizer moiety. On the contrary, for the unplasticized PVB samples (PVB APS) only one peak corresponding to the polymer was determined. The viscosity average molecular weights (
Μν) of the tested samples were found in the range of 95,000–135,000 g mol
−1 and correlates nicely to the trend of intrinsic viscosity as determined by DSV (
Table 6) only for the case of the neat PVB grades.
Apart from qualitative results for the molecular weight of PVB, it is worthwhile mentioning that the chromatographs of plasticized PVB samples can be exploited for the identification of the plasticizer type. As shown in
Figure 15, the retention time for the second region differs in each sample, pinpointing the different plasticizers used. 3GO (402.6 g/mol), is a moiety with a higher molecular weight than DHA (314.5) g/mol) and DBS (314.4 g/mol), since it eludes earlier than the other two. In this way, GPC measurements again verify the presence of 3GO in PVBR-B, found by NMR, and show that it is also feasible to identify the plasticizer type, by comparing the retention times for the second part of the chromatograph. Furthermore, a fair estimation of the plasticizer content that correlates quite well to the isothermal TGA values (
Table 3) can be made from the plasticizer peaks at the GPC graph, either by the intensity of the peaks or by the area under the peaks, corrected to each individual response.
