

Mechano-Chemistry across Phase Transitions in Heated Albumin Protein Solutions

 , and
, and 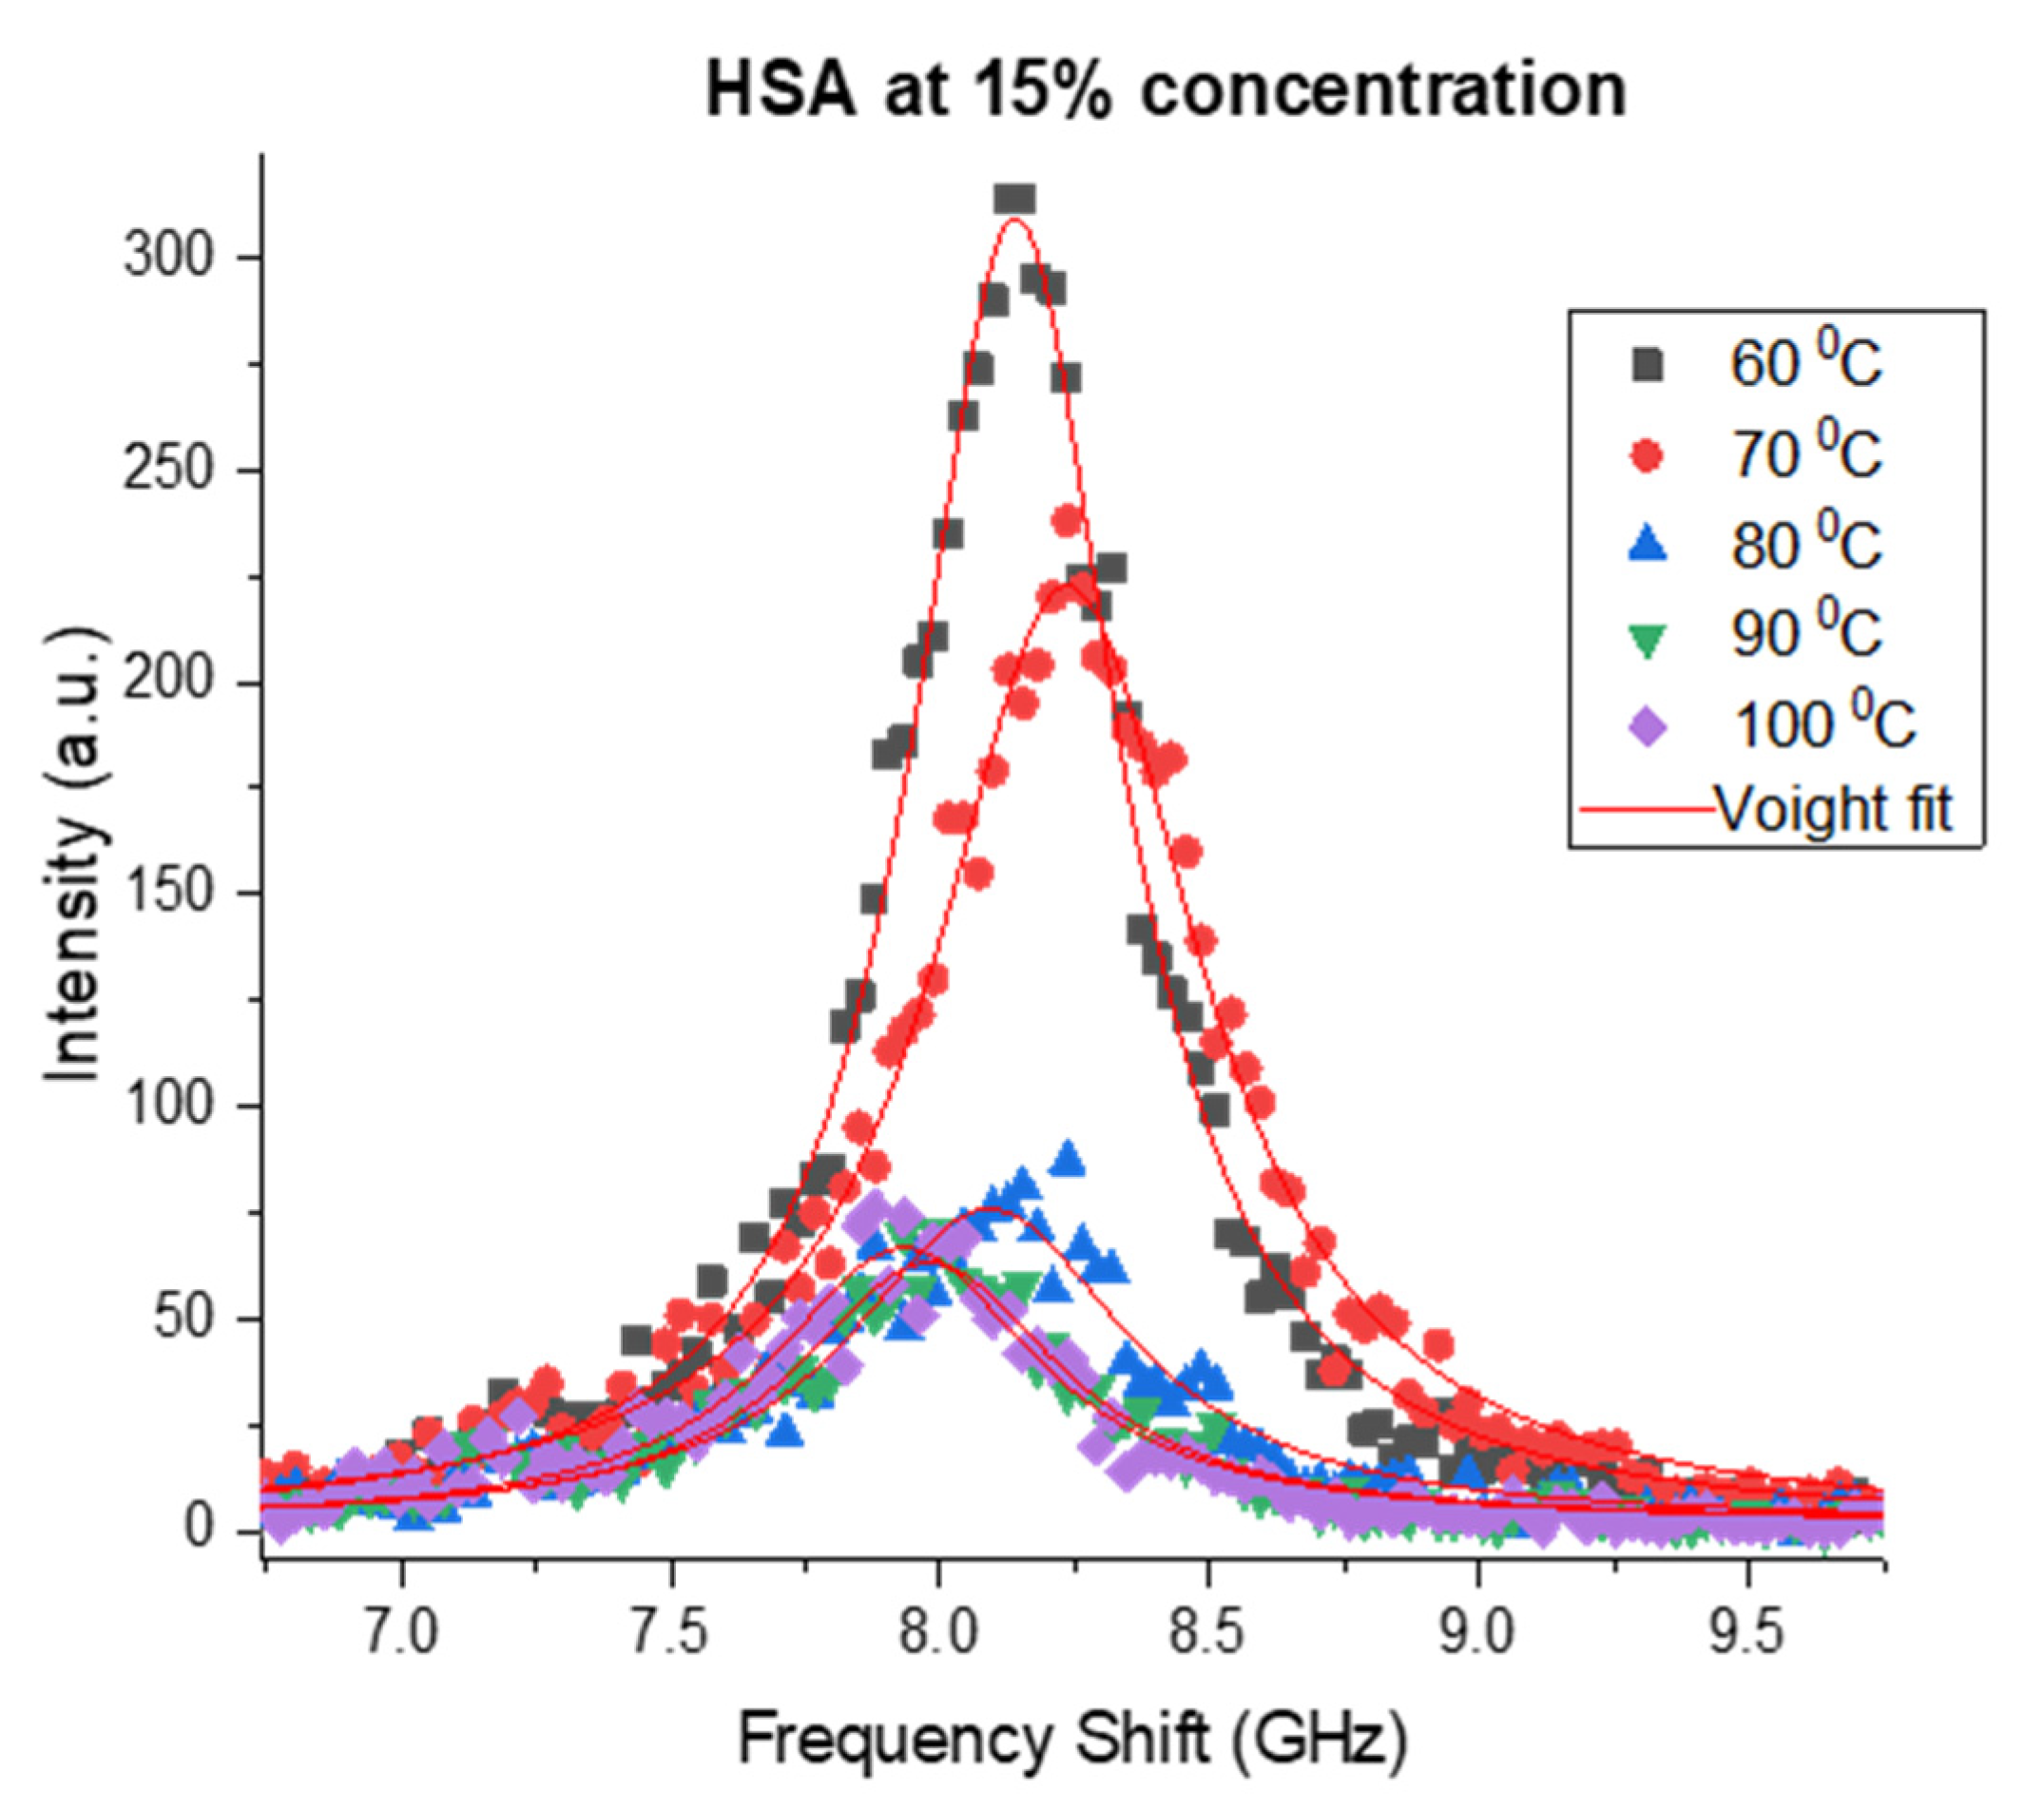
Abstract
1. Introduction
2. Materials and Methods
3. Results and Discussion
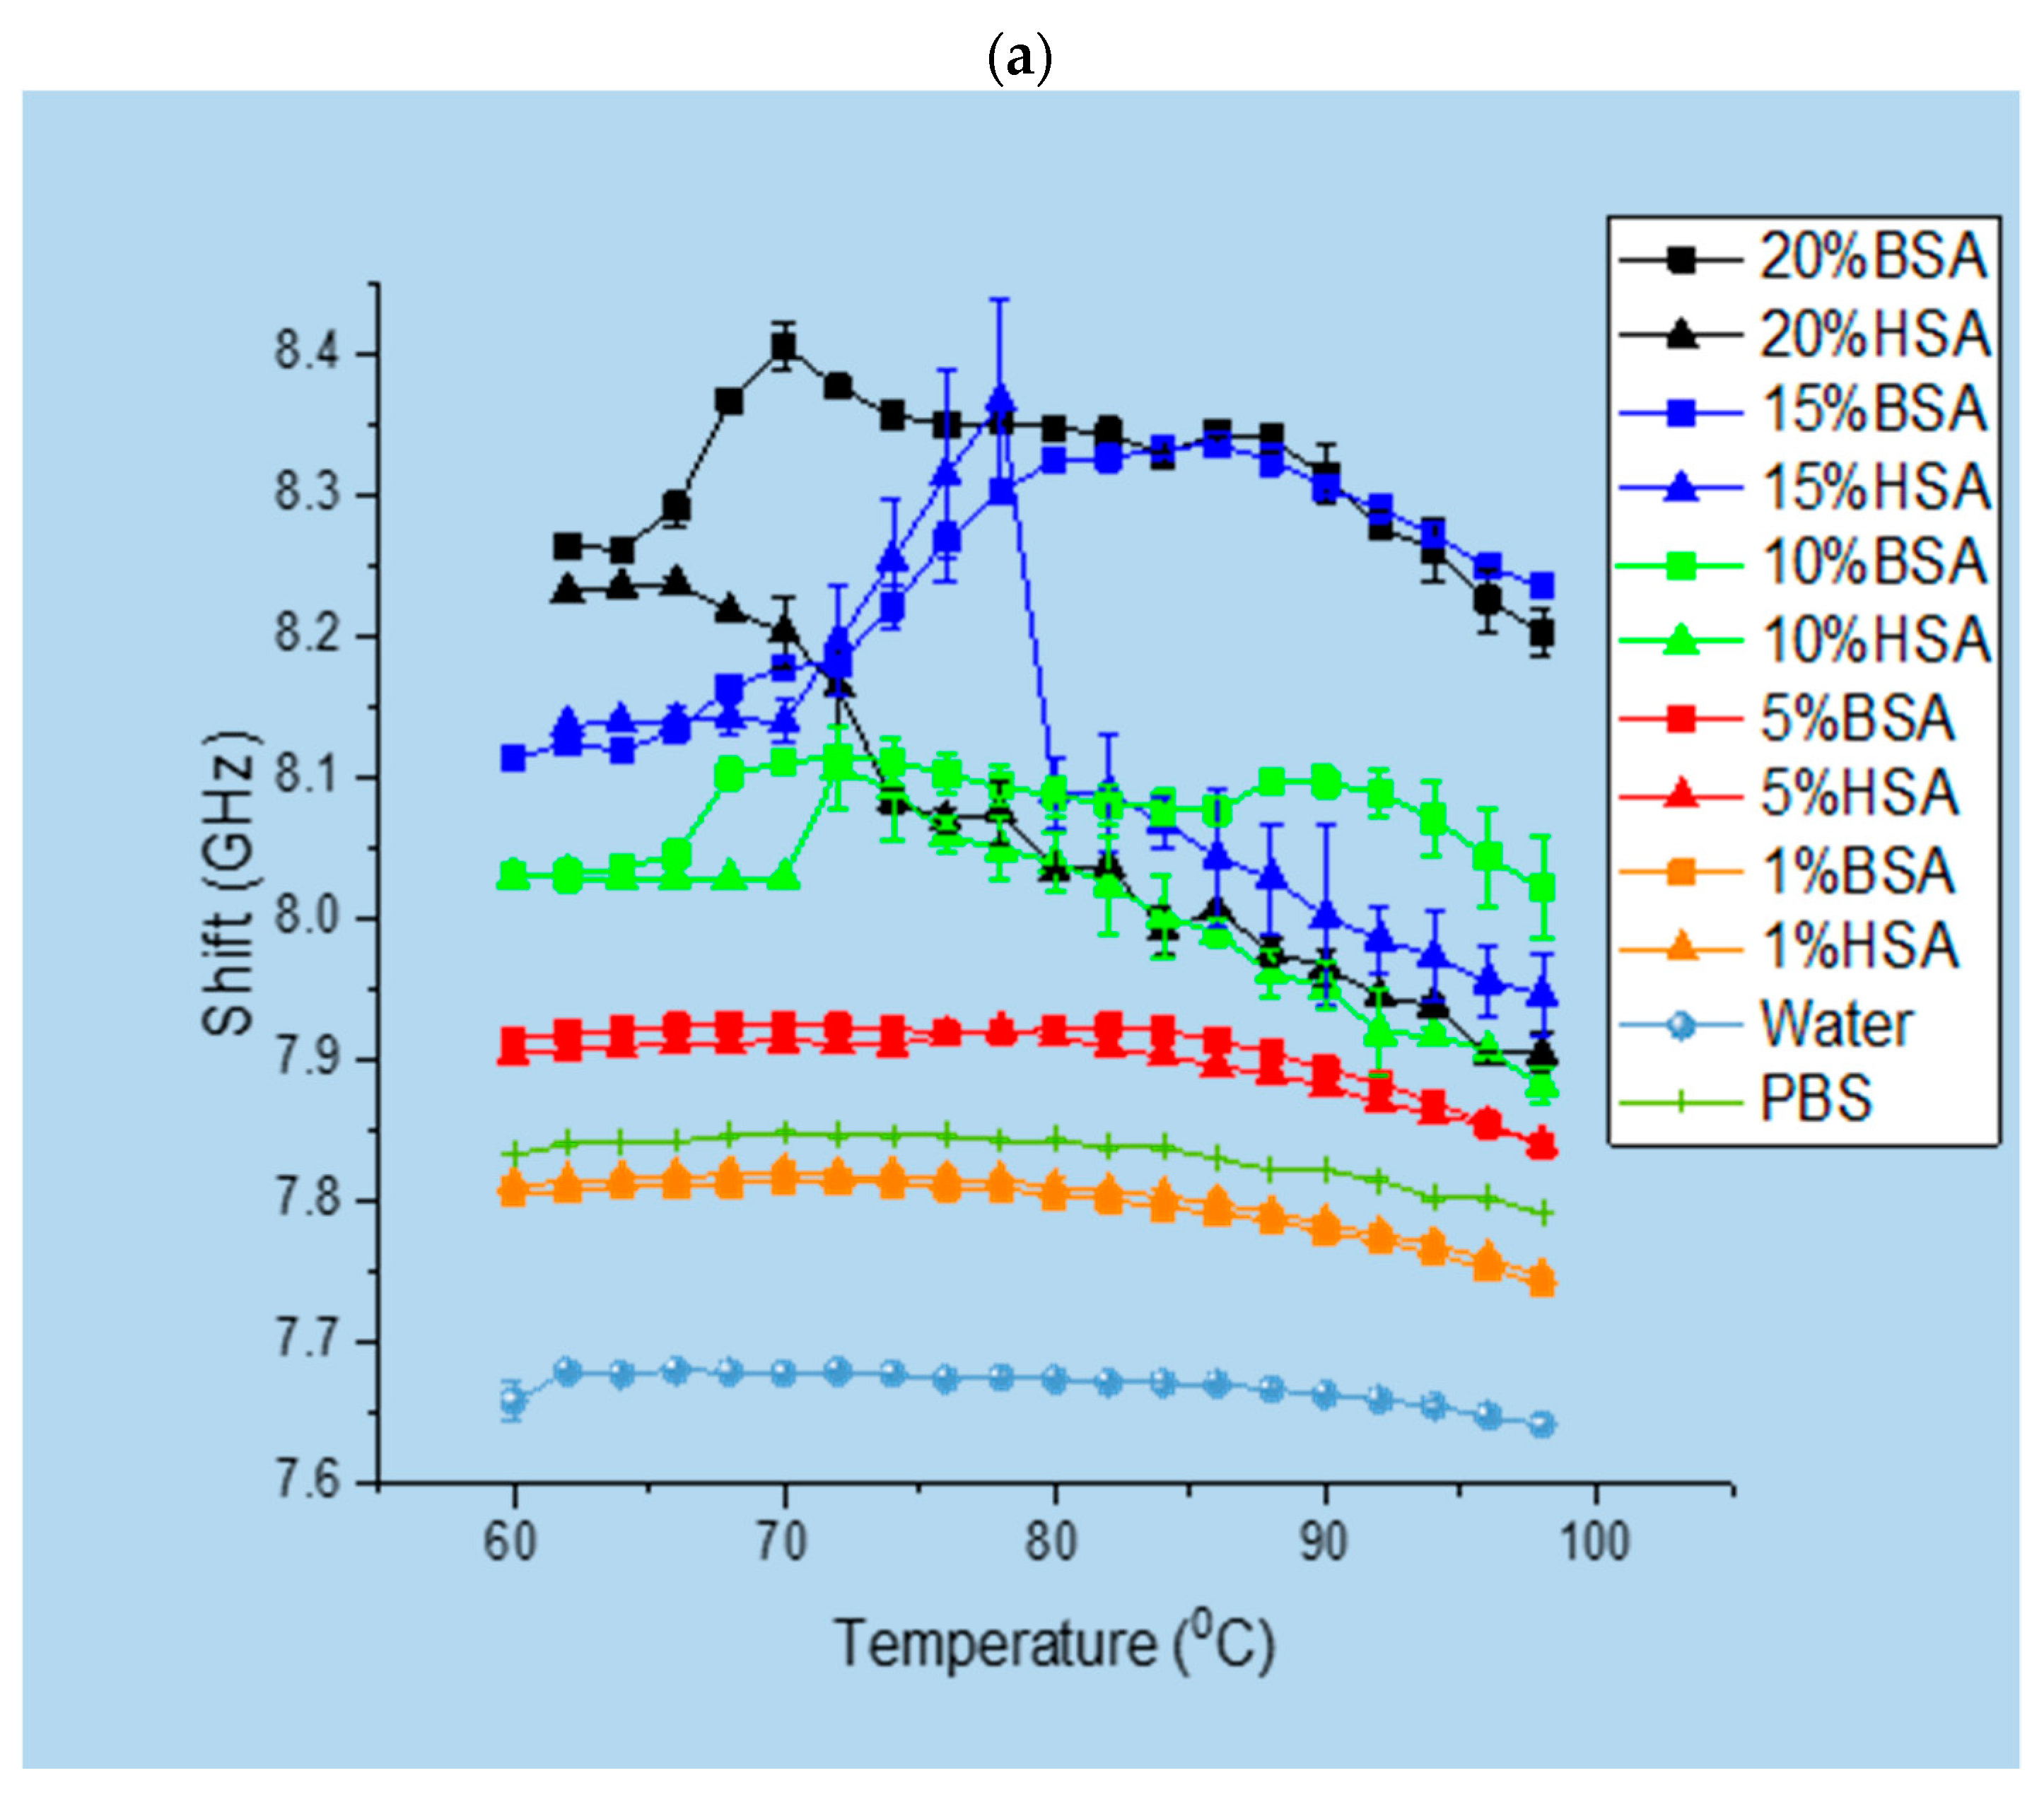
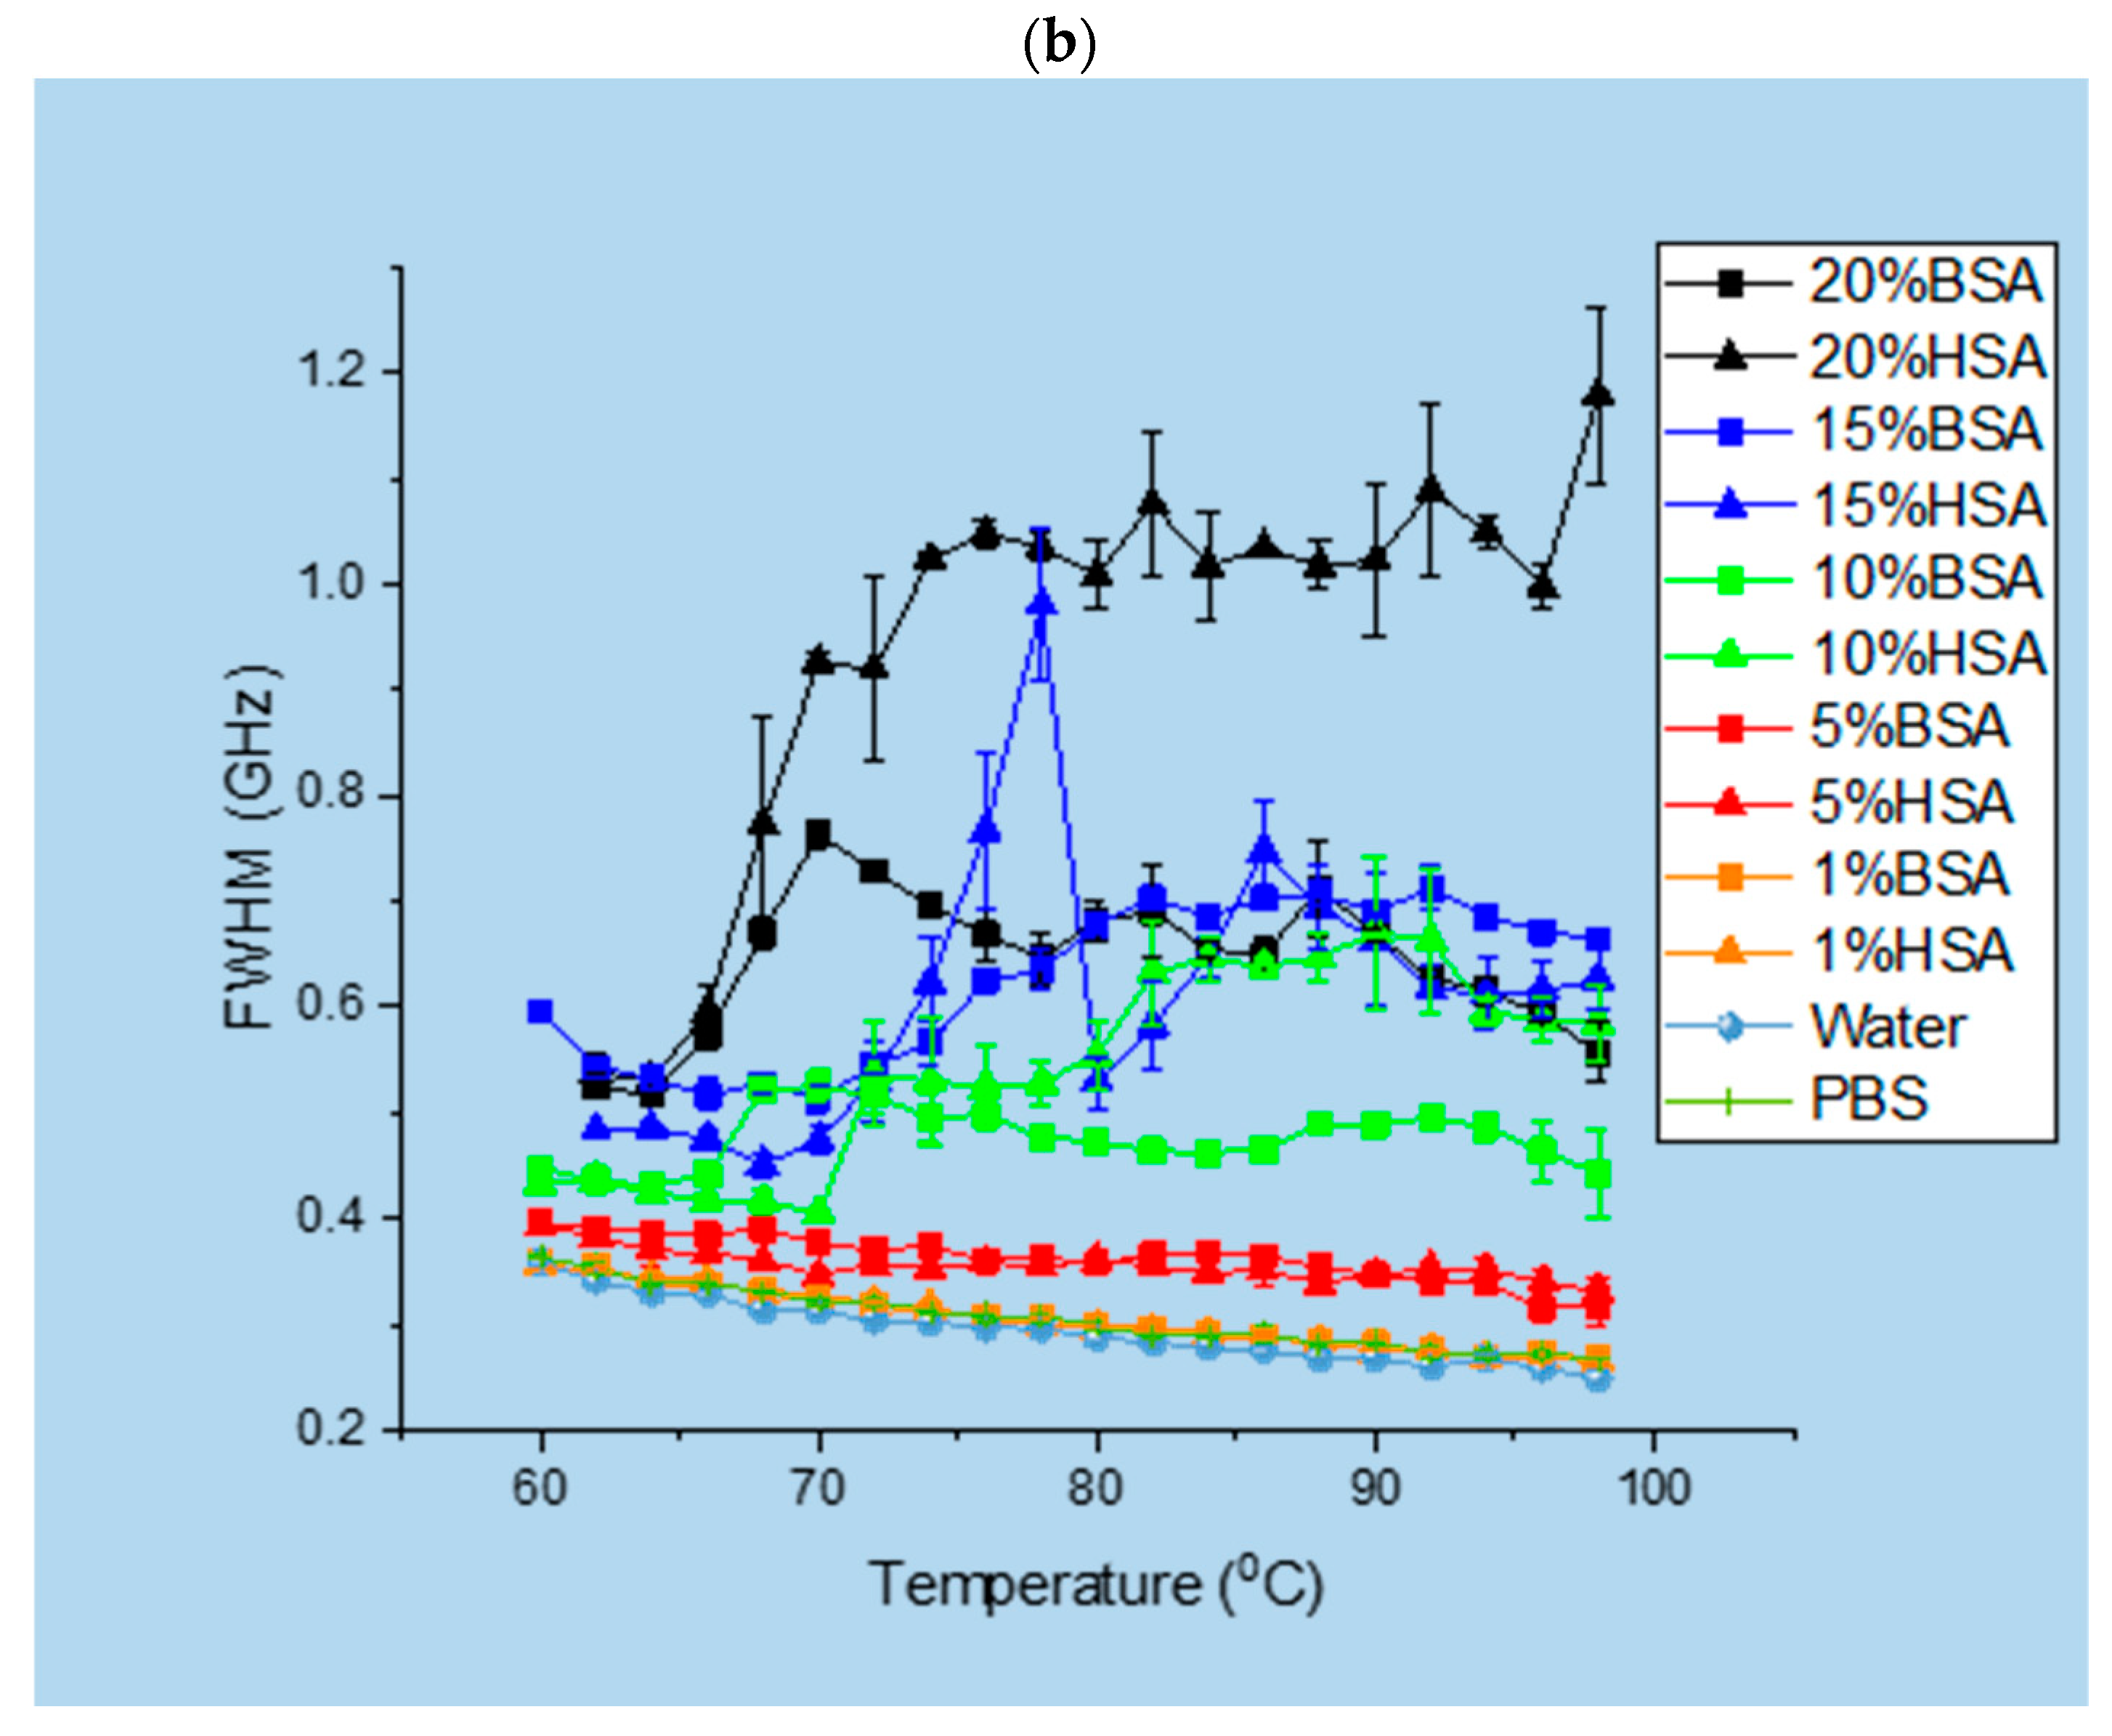
3.1. Brillouin Scattering of BSA and HSA Solutions
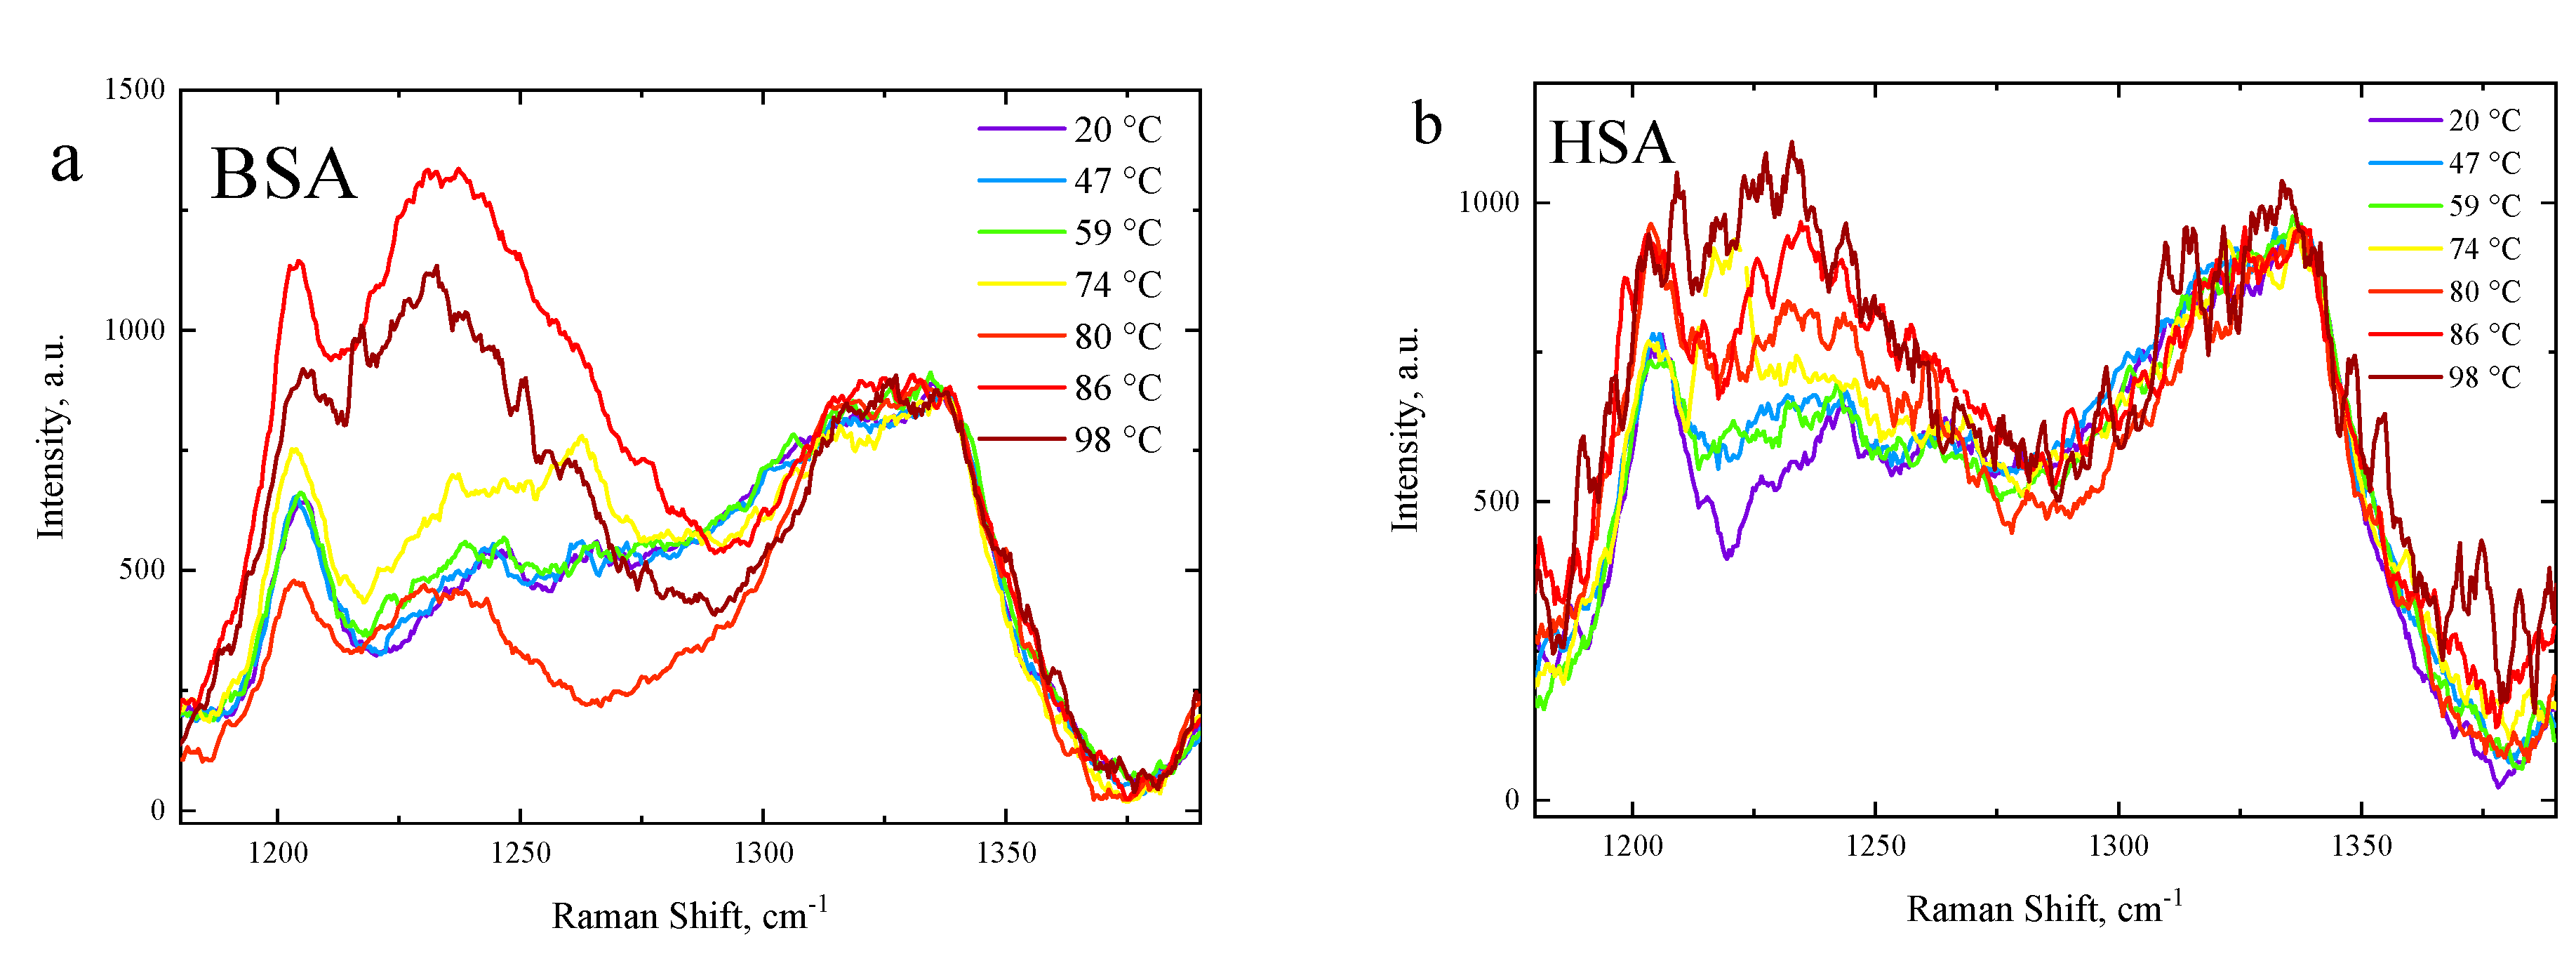
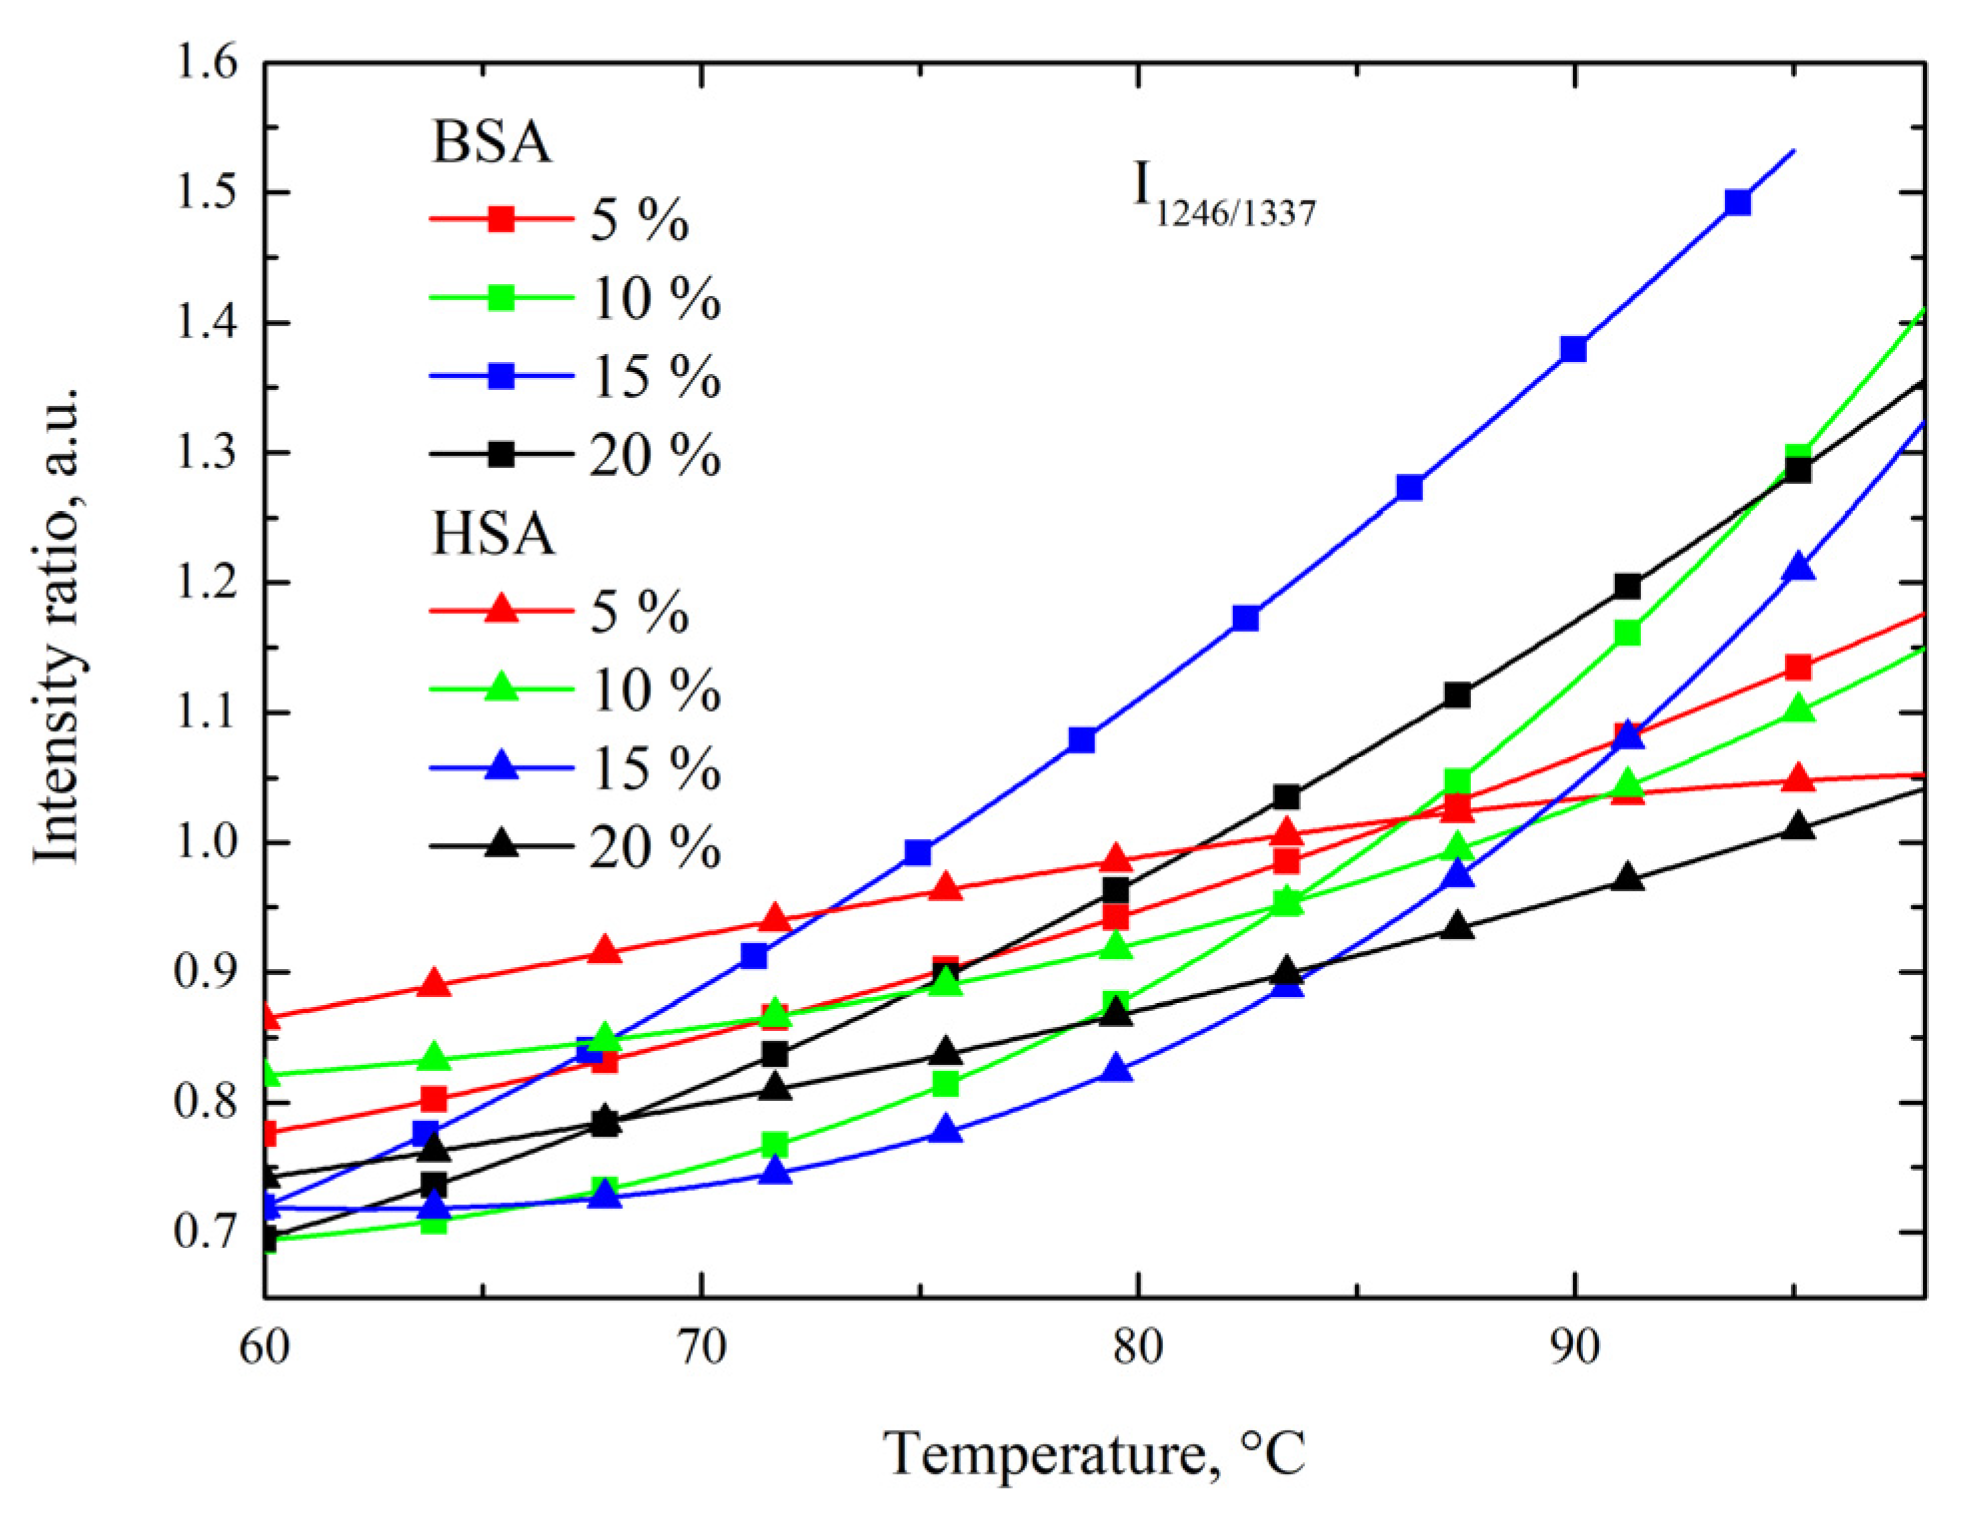
3.2. The Secondary Structure
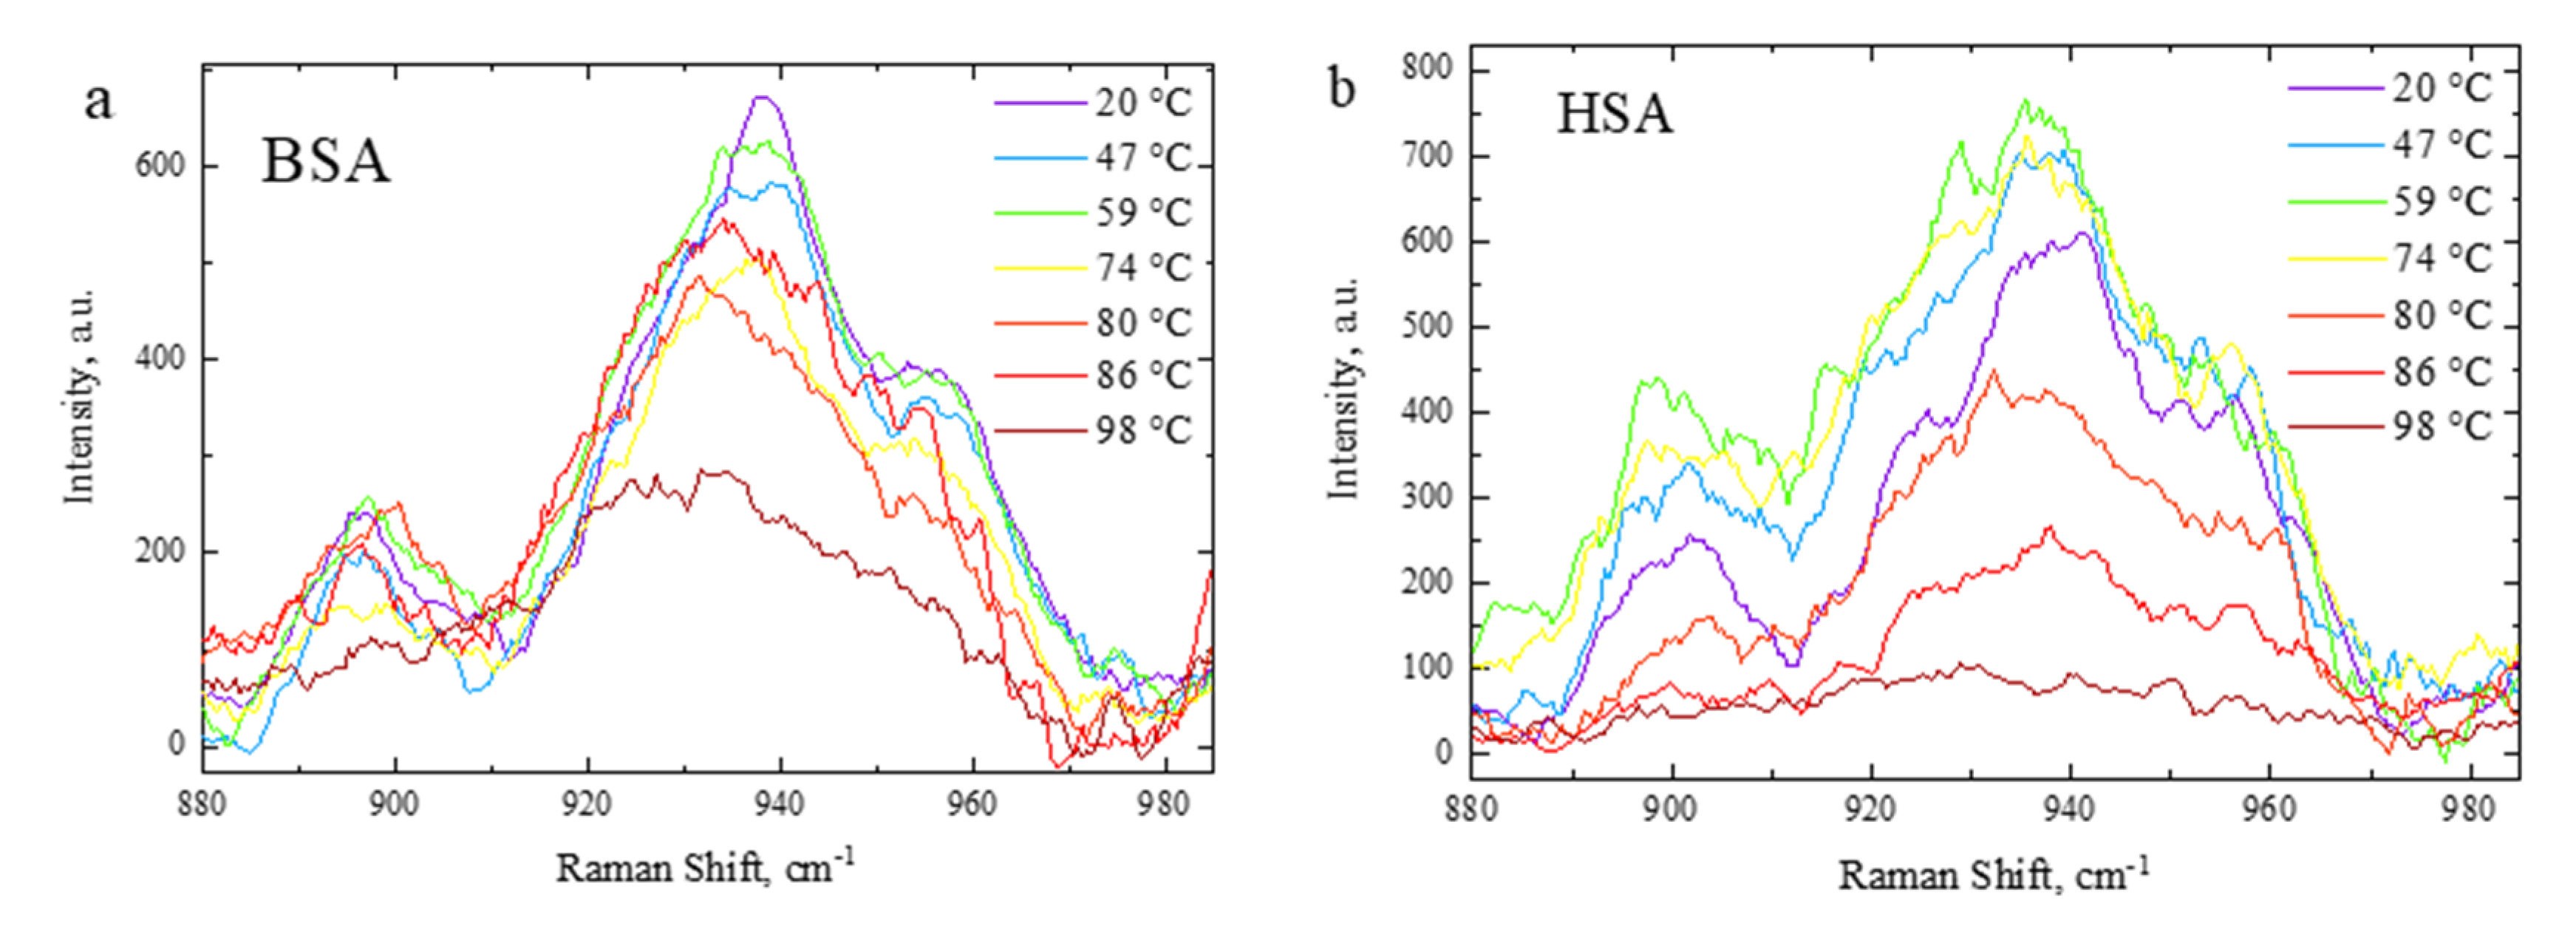
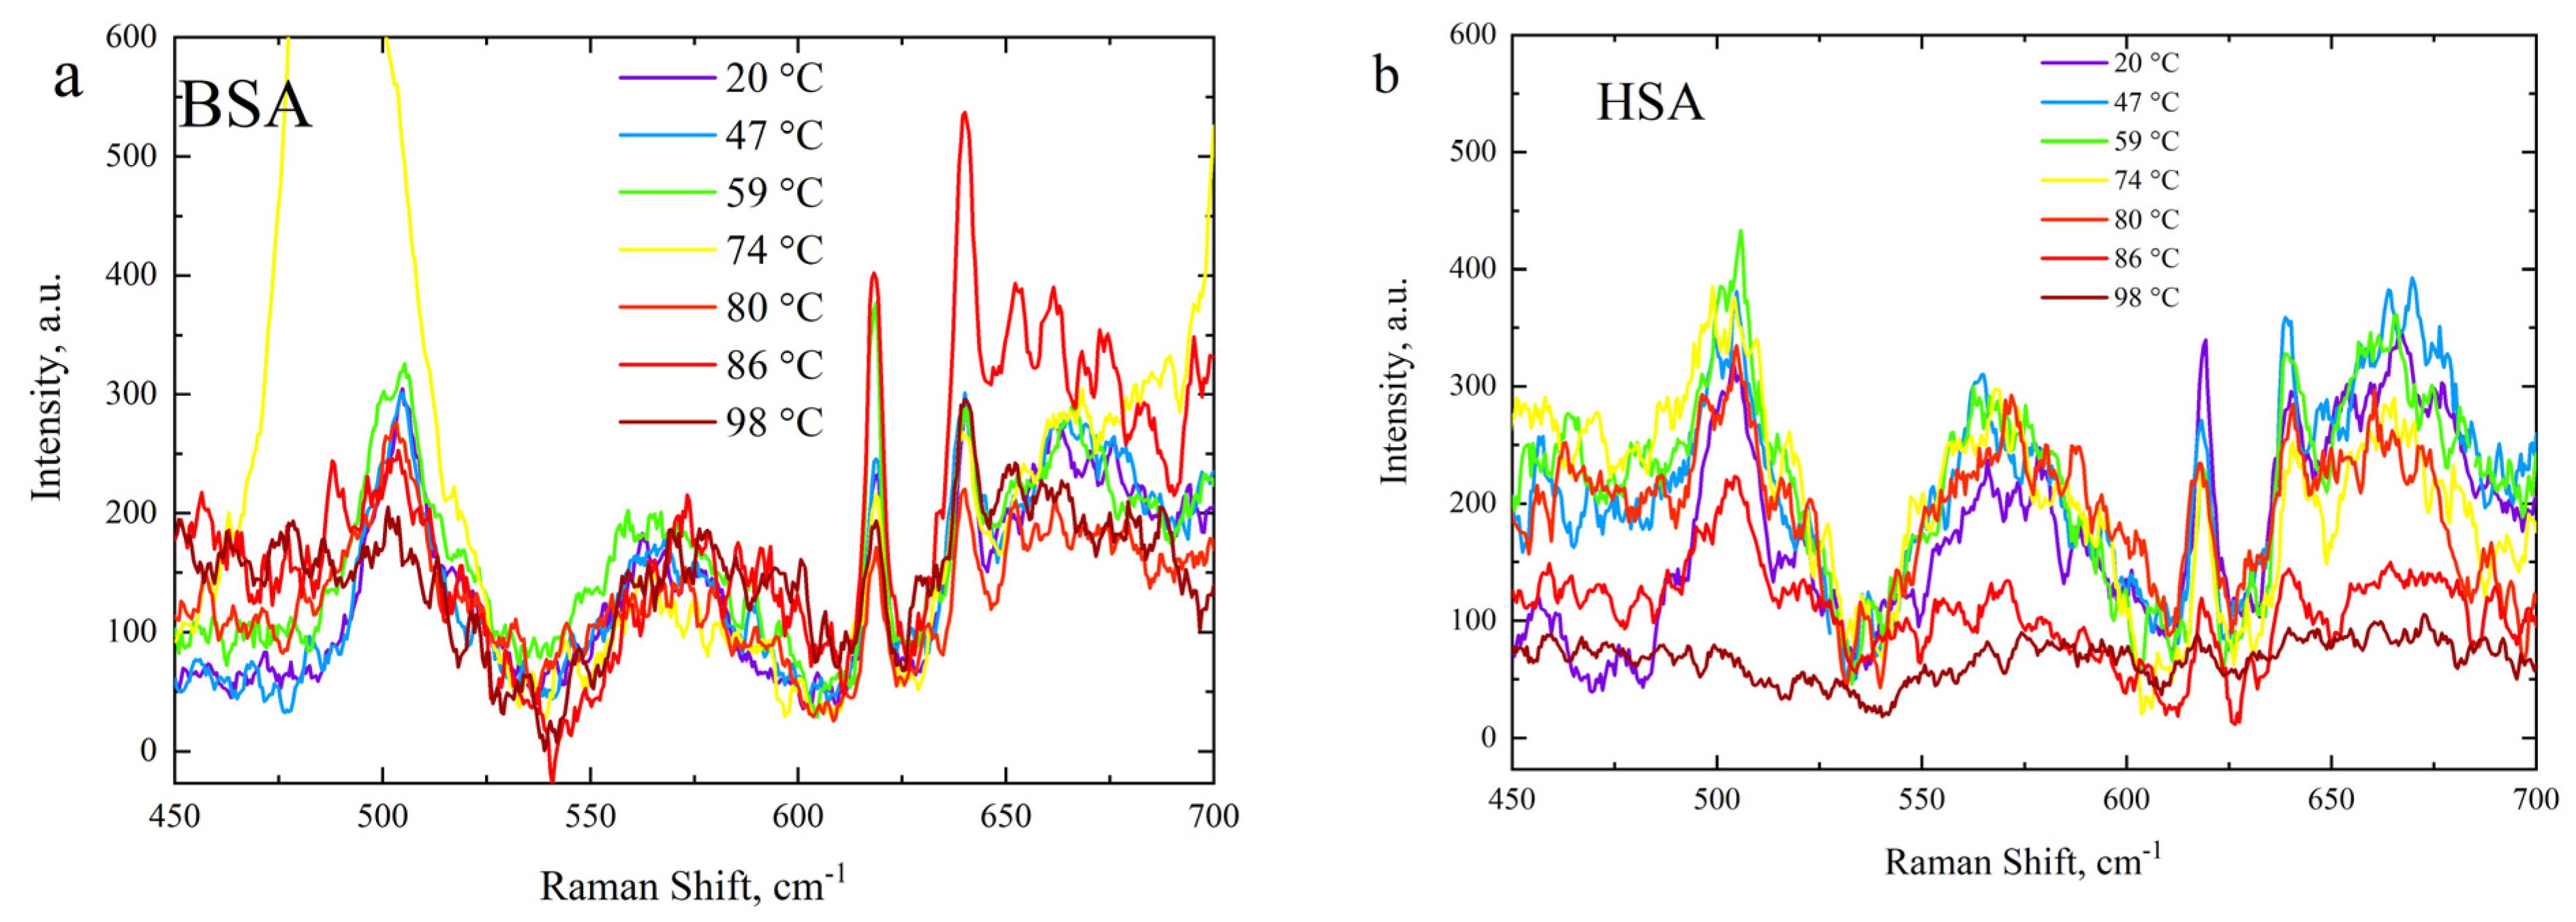
3.3. Side-Chain Exposure and Arrangement of Tertiary Structure
4. Conclusions
Author Contributions
Funding
Institutional Review Board Statement
Data Availability Statement
Conflicts of Interest
References
- Jiang, D.; Liang, J.; Noble, P.W. Hyaluronan as an Immune Regulator in Human Diseases. Physiol. Rev. 2011, 91, 221–264. [Google Scholar] [CrossRef] [PubMed]
- Lu, G.; Li, T.; Ye, H.; Liu, S.; Zhang, P.; Wang, W. D-dimer in the diagnosis of periprosthetic joint infection: A systematic review and meta-analysis. J. Orthop. Surg. Res. 2020, 15, 1–11. [Google Scholar] [CrossRef] [PubMed]
- van der Helm-van Mil, A.H.; Verpoort, K.N.; Breedveld, F.C.; Toes, R.E.M.; Huizinga, T.W.J. Antibodies to citrullinated proteins and differences in clinical progression of rheumatoid arthritis. Arthritis Res. Ther. 2005, 7, R949. [Google Scholar] [CrossRef]
- Guo, Y.; Wei, T.; Hu, N.; Zhou, X. Disrupted homeostasis of synovial hyaluronic acid and its associations with synovial mast cell proteases of rheumatoid arthritis patients and collagen-induced arthritis rats. Immunol. Res. 2021, 69, 584–593. [Google Scholar] [CrossRef] [PubMed]
- Lowe, G.D.O.; Lee, A.J.; Rumley, A.; Price, J.F.; Fowkes, F.G.R. Blood viscosity and risk of cardiovascular events: The Edinburgh Artery Study. Br. J. Haematol. 1997, 96, 168–173. [Google Scholar] [CrossRef] [PubMed]
- Jeong, S.-K.; Cho, Y.I.; Duey, M.; Rosenson, R.S. Cardiovascular Risks of Anemia Correction with Erythrocyte Stimulating Agents: Should Blood Viscosity Be Monitored for Risk Assessment? Cardiovasc. Drugs Ther. 2010, 24, 151–160. [Google Scholar] [CrossRef]
- Rasyid, A.; Harris, S.; Kurniawan, M.; Mesiano, T.; Hidayat, R. Fibrinogen and LDL Influence on Blood Viscosity and Outcome of Acute Ischemic Stroke Patients in Indonesia. Ann. Neurosci. 2019, 26, 30–34. [Google Scholar] [CrossRef]
- Bateman, R.J.; Xiong, C.; Benzinger, T.L.S.; Fagan, A.M.; Goate, A.; Fox, N.C.; Marcus, D.S.; Cairns, N.J.; Xie, X.; Blazey, T.M.; et al. Clinical and Biomarker Changes in Dominantly Inherited Alzheimer’s Disease. N. Engl. J. Med. 2012, 367, 795–804. [Google Scholar] [CrossRef]
- Gaipov, A.; Utegulov, Z.; Bukasov, R.; Turebekov, D.; Tarlykov, P.; Markhametova, Z.; Nurekeyev, Z.; Kunushpayeva, Z.; Sultangaziyev, A. Development and validation of hybrid Brillouin-Raman spectroscopy for non-contact assessment of mechano-chemical properties of urine proteins as biomarkers of kidney diseases. BMC Nephrol. 2020, 21, 1–9. [Google Scholar] [CrossRef]
- Aitekenov, S.; Gaipov, A.; Bukasov, R. Review: Detection and quantification of proteins in human urine. Talanta 2021, 223, 121718. [Google Scholar] [CrossRef]
- Aitekenov, S.; Sultangaziyev, A.; Abdirova, P.; Yussupova, L.; Gaipov, A.; Utegulov, Z.; Bukasov, R. Raman, Infrared and Brillouin Spectroscopies of Biofluids for Medical Diagnostics and for Detection of Biomarkers. Crit. Rev. Anal. Chem. 2022, 1–30. [Google Scholar] [CrossRef]
- Zhu, T.; Du, J.; Cao, W.; Fan, J.; Peng, X. Microenvironment-Sensitive Fluorescent Dyes for Recognition of Serum Albumin in Urine and Imaging in Living Cells. Ind. Eng. Chem. Res. 2016, 55, 527–533. [Google Scholar] [CrossRef]
- Wang, S.S.S.; Good, T.A. An Overview of Alzheimer. J. Chin. Inst. Chem. Eng. 2005, 36, 533–559. [Google Scholar]
- Dobson, C.M. Protein misfolding, evolution and disease. Trends Biochem. Sci. 1999, 24, 329–332. [Google Scholar] [CrossRef] [PubMed]
- Doster, W.; Simon, B.; Schmidt, G.; Mayr, W. Compressibility of lysozyme in solution from time-resolved Brillouin difference spectroscopy. Biopolymers 1985, 24, 1543–1548. [Google Scholar] [CrossRef]
- Weidlich, T.; Lindsay, S.M.; Rupprecht, A. Counterion Effects on the Structure and Dynamics of Solid DNA. Phys. Rev. Lett. 1988, 61, 1674–1677. [Google Scholar] [CrossRef]
- Sokolov, A.; Roh, J.; Mamontov, E.; Sakai, V.G. Role of hydration water in dynamics of biological macromolecules. Chem. Phys. 2008, 345, 212–218. [Google Scholar] [CrossRef]
- Lee, S.A.; Flowers, M.R.; Oliver, W.F.; Rupprecht, A.; Lindsay, S.M. Brillouin-scattering study of hyaluronic acid: Dynamic coupling with the water of hydration and phase transitions. Phys. Rev. E 1993, 47, 677–683. [Google Scholar] [CrossRef]
- Uversky, V.N.; Fink, A.L. Conformational constraints for amyloid fibrillation: The importance of being unfolded. Biochim. Biophys. Acta (BBA)-Proteins Proteom. 2004, 1698, 131–153. [Google Scholar] [CrossRef]
- Westh, P.; Koga, Y. Intermolecular Interactions of Lysozyme and Small Alcohols: A Calorimetric Investigation. J. Phys. Chem. B 1997, 101, 5755–5758. [Google Scholar] [CrossRef]
- Yamaguchi, T.; Yagi, H.; Goto, Y.; Matsuzaki, K.; Hoshino, M. A Disulfide-Linked Amyloid-β Peptide Dimer Forms a Protofibril-like Oligomer through a Distinct Pathway from Amyloid Fibril Formation. Biochemistry 2010, 49, 7100–7107. [Google Scholar] [CrossRef] [PubMed]
- Roberts, C.J. Non-native protein aggregation kinetics. Biotechnol. Bioeng. 2007, 98, 927–938. [Google Scholar] [CrossRef] [PubMed]
- Yan, H.; Saiani, A.; Miller, A.F. Gelation of a Model Globular Protein. Macromol. Symp. 2007, 251, 112–117. [Google Scholar] [CrossRef]
- Andrews, J.M.; Roberts, C.J. A Lumry−Eyring Nucleated Polymerization Model of Protein Aggregation Kinetics: 1. Aggregation with Pre-Equilibrated Unfolding. J. Phys. Chem. B 2007, 111, 7897–7913. [Google Scholar] [CrossRef]
- Buss, H.; Chan, T.P.; Sluis, K.B.; Domigan, N.M.; Winterbourn, C.C. Protein Carbonyl Measurement by a Sensitive ELISA Method. Free. Radic. Biol. Med. 1997, 23, 361–366. [Google Scholar] [CrossRef]
- Koski, K.J.; Yarger, J.L. Brillouin imaging. Appl. Phys. Lett. 2005, 87, 061903. [Google Scholar] [CrossRef]
- Scarcelli, G.; Yun, S.H. Confocal Brillouin microscopy for three-dimensional mechanical imaging. Nat. Photonics 2008, 2, 39–43. [Google Scholar] [CrossRef]
- Bailey, M.; Alunni-Cardinali, M.; Correa, N.; Caponi, S.; Holsgrove, T.; Barr, H.; Stone, N.; Winlove, C.P.; Fioretto, D.; Palombo, F. Viscoelastic properties of biopolymer hydrogels determined by Brillouin spectroscopy: A probe of tissue micromechanics. Sci. Adv. 2020, 6, eabc1937. [Google Scholar] [CrossRef]
- Coker, Z.; Troyanova-Wood, M.; Traverso, A.J.; Yakupov, T.; Utegulov, Z.N.; Yakovlev, V.V. Assessing performance of modern Brillouin spectrometers. Opt. Express 2018, 26, 2400–2409. [Google Scholar] [CrossRef]
- Rakymzhan, A.; Yakupov, T.; Yelemessova, Z.; Bukasov, R.; Yakovlev, V.; Utegulov, Z. Time-resolved assessment of drying plants by Brillouin and Raman spectroscopies. J. Raman Spectrosc. 2019, 50, 1881–1889. [Google Scholar] [CrossRef]
- Akilbekova, D.; Ogay, V.; Yakupov, T.; Sarsenova, M.; Umbayev, B.; Nurakhmetov, A.; Tazhin, K.; Yakovlev, V.V.; Utegulov, Z.N. Brillouin spectroscopy and radiography for assessment of viscoelastic and regenerative properties of mammalian bones. J. Biomed. Opt. 2018, 23, 097004. [Google Scholar] [CrossRef] [PubMed]
- Bot, A.; Schram, R.P.C.; Wegdam, G.H. Brillouin light scattering from a biopolymer gel: Hypersonic sound waves in gelatin. Colloid Polym. Sci. 1995, 273, 252–256. [Google Scholar] [CrossRef]
- Meng, Z.; Traverso, A.J.; Ballmann, C.W.; Troyanova-Wood, M.A.; Yakovlev, V.V. Seeing cells in a new light: A renaissance of Brillouin spectroscopy. Adv. Opt. Photonics 2016, 8, 300–327. [Google Scholar] [CrossRef]
- Rioboó, R.; Gontán, N.; Sanderson, D.; Desco, M.; Gómez-Gaviro, M. Brillouin Spectroscopy: From Biomedical Research to New Generation Pathology Diagnosis. Int. J. Mol. Sci. 2021, 22, 8055. [Google Scholar] [CrossRef]
- Svanidze, A.V.; Huth, H.; Lushnikov, S.G.; Kojima, S.; Schick, C. Phase transition in tetragonal hen egg-white lysozyme crystals. Appl. Phys. Lett. 2009, 95, 263702. [Google Scholar] [CrossRef]
- Sasanuma, K.; Seshimo, Y.; Hashimoto, E.; Ike, Y.; Kojima, S. Dynamical Properties on the Thermal Denaturation of Lysozyme-Trehalose Solution. In Proceedings of the AIP Conference Proceedings, Minneapolis, MN, USA, 10–13 September 2008. [Google Scholar] [CrossRef]
- Sassi, P.; Perticaroli, S.; Comez, L.; Lupi, L.; Paolantoni, M.; Fioretto, D.; Morresi, A. Reversible and irreversible denaturation processes in globular proteins: From collective to molecular spectroscopic analysis. J. Raman Spectrosc. 2012, 43, 273–279. [Google Scholar] [CrossRef]
- Svanidze, A.V.; Lushnikov, S.G.; Kojima, S. Protein dynamics in Brillouin light scattering: Termal denaturation of hen egg white lysozyme. JETP Lett. 2009, 90, 80–84. [Google Scholar] [CrossRef]
- Varanko, A.; Saha, S.; Chilkoti, A. Recent trends in protein and peptide-based biomaterials for advanced drug delivery. Adv. Drug Deliv. Rev. 2020, 156, 133–187. [Google Scholar] [CrossRef]
- Gelamo, E.L.; Silva, C.H.T.P.; Imasato, H.; Tabak, M. Interaction of bovine (BSA) and human (HSA) serum albumins with ionic surfactants: Spectroscopy and modelling. Biochim. Biophys. Acta (BBA)-Protein Struct. Mol. Enzymol. 2002, 1594, 84–99. [Google Scholar] [CrossRef]
- Tubio, G.; Nerli, B.; Picó, G. Relationship between the protein surface hydrophobicity and its partitioning behaviour in aqueous two-phase systems of polyethyleneglycol–dextran. J. Chromatogr. B 2004, 799, 293–301. [Google Scholar] [CrossRef]
- Kosa, T.; Maruyama, T.; Otagiri, M. Species differences of serum albumins: II. Chemical and thermal stability. Pharm. Res. 1998, 15, 449–454. [Google Scholar] [CrossRef] [PubMed]
- Miller, I.; Gemeiner, M. Peculiarities in electrophoretic behavior of different serum albumins. Electrophoresis 1993, 14, 1312–1317. [Google Scholar] [CrossRef] [PubMed]
- Tayyab, S.; Khan, N.J.; Khan, M.A.; Kumar, Y. Behavior of various mammalian albumins towards bilirubin binding and photochemical properties of different bilirubin–albumin complexes. Int. J. Biol. Macromol. 2003, 31, 187–193. [Google Scholar] [CrossRef] [PubMed]
- Bujacz, A. Structures of bovine, equine and leporine serum albumin. Acta Crystallogr. Sect. D Biol. Crystallogr. 2012, 68, 1278–1289. [Google Scholar] [CrossRef] [PubMed]
- Michnik, A.; Michalik, K.; Kluczewska-Gałka, A.; Drzazga, Z. Comparative DSC study of human and bovine serum albumin. J. Therm. Anal. Calorim. 2006, 84, 113–117. [Google Scholar] [CrossRef]
- Akdoğan, Y.; Reichenwallner, J.; Hinderberger, D. Evidence for Water-Tuned Structural Differences in Proteins: An Approach Emphasizing Variations in Local Hydrophilicity. PLoS ONE 2012, 7, e45681. [Google Scholar] [CrossRef]
- Han, X.-L.; Tian, F.-F.; Ge, Y.-S.; Jiang, F.-L.; Lai, L.; Li, D.-W.; Yu, Q.-L.; Wang, J.; Lin, C.; Liu, Y. Spectroscopic, structural and thermodynamic properties of chlorpyrifos bound to serum albumin: A comparative study between BSA and HSA. J. Photochem. Photobiol. B Biol. 2012, 109, 1–11. [Google Scholar] [CrossRef]
- Ramachandran, T.S.; Gunasekaran, S.; Sreedevi, S.M.; Vinod, S.M.; Rajendran, K.; Perumal, T.; Ganesh, P.S. Comparative studies on biophysical interactions between 4-dicyanomethylene-2,6-dimethyl-4H-pyran (DDP) with bovine serum albumin (BSA) and human serum albumin (HSA) via photophysical approaches and molecular docking techniques. J. Saudi Chem. Soc. 2021, 25, 101364. [Google Scholar] [CrossRef]
- Steelman, Z.; Meng, Z.; Traverso, A.J.; Yakovlev, V.V. Brillouin spectroscopy as a new method of screening for increased CSF total protein during bacterial meningitis. J. Biophotonics 2014, 8, 408–414. [Google Scholar] [CrossRef]
- Wang, S.H.; Lee, L.P.; Lee, J.S. A linear relation between the compressibility and density of blood. J. Acoust. Soc. Am. 2001, 109, 390–396. [Google Scholar] [CrossRef]
- Urbonaite, V.; de Jongh, H.; van der Linden, E.; Pouvreau, L. Permeability of gels is set by the impulse applied on the gel. Food Hydrocoll. 2015, 50, 7–15. [Google Scholar] [CrossRef]
- Singh, G.; Kaur, M.; Aswal, V.K.; Kang, T.S. Aqueous colloidal systems of bovine serum albumin and functionalized surface active ionic liquids for material transport. RSC Adv. 2020, 10, 7073–7082. [Google Scholar] [CrossRef] [PubMed]
- Wynendaele, E.; Ma, G.J.; Xu, X.; Cho, N.-J.; De Spiegeleer, B. Conformational stability as a quality attribute for the cell therapy raw material human serum albumin. RSC Adv. 2021, 11, 15332–15339. [Google Scholar] [CrossRef]
- Giancola, C.; De Sena, C.; Fessas, D.; Graziano, G.; Barone, G. DSC studies on bovine serum albumin denaturation Effects of ionic strength and SDS concentration. Int. J. Biol. Macromol. 1997, 20, 193–204. [Google Scholar] [CrossRef] [PubMed]
- Dmitriev, A.; Vashchenkov, V.; Fedoseev, A.; Lushnikov, S. Phase transformations of bovine serum albumin: Evidences from Rayleigh-Brillouin light scattering. J. Raman Spectrosc. 2019, 50, 537–547. [Google Scholar] [CrossRef]
- Dmitriev, A.V.; Fedoseev, A.I.; Lushnikov, S.G. Mandelstam–Brillouin Light Scattering in Bovine Serum Albumin Solutions with Different Concentrations in the Vicinity of Thermal Denaturation. Tech. Phys. 2020, 65, 1546–1550. [Google Scholar] [CrossRef]
- Jana, S.; Ghosh, S.; Dalapati, S.; Guchhait, N. Exploring structural change of protein bovine serum albumin by external perturbation using extrinsic fluorescence probe: Spectroscopic measurement, molecular docking and molecular dynamics simulation. Photochem. Photobiol. Sci. 2012, 11, 323–332. [Google Scholar] [CrossRef]
- Grimaldo, M.; Roosen-Runge, F.; Hennig, M.; Zanini, F.; Zhang, F.; Jalarvo, N.; Zamponi, M.; Schreiber, F.; Seydel, T. Hierarchical molecular dynamics of bovine serum albumin in concentrated aqueous solution below and above thermal denaturation. Phys. Chem. Chem. Phys. 2015, 17, 4645–4655. [Google Scholar] [CrossRef]
- Hennig, M.; Roosen-Runge, F.; Zhang, F.; Zorn, S.; Skoda, M.W.A.; Jacobs, R.M.J.; Seydel, T.; Schreiber, F. Dynamics of highly concentrated protein solutions around the denaturing transition. Soft Matter 2012, 8, 1628–1633. [Google Scholar] [CrossRef]
- Murayama, K.; Tomida, M. Heat-Induced Secondary Structure and Conformation Change of Bovine Serum Albumin Investigated by Fourier Transform Infrared Spectroscopy. Biochemistry 2004, 43, 11526–11532. [Google Scholar] [CrossRef]
- Lu, R.; Li, W.-W.; Katzir, A.; Raichlin, Y.; Yu, H.-Q.; Mizaikoff, B. Probing the secondary structure of bovine serum albumin during heat-induced denaturation using mid-infrared fiberoptic sensors. Analyst 2015, 140, 765–770. [Google Scholar] [CrossRef]
- van Stokkum, I.H.M.; Linsdell, H.; Hadden, J.M.; Haris, P.I.; Chapman, D.; Bloemendal, M. Temperature-Induced Changes in Protein Structures Studied by Fourier Transform Infrared Spectroscopy and Global Analysis. Biochemistry 1995, 34, 10508–10518. [Google Scholar] [CrossRef] [PubMed]
- Aswal, V.K.; Chodankar, S.; Kohlbrecher, J.; Vavrin, R.; Wagh, A.G. Small-angle neutron scattering study of protein unfolding and refolding. Phys. Rev. E 2009, 80, 011924. [Google Scholar] [CrossRef] [PubMed]
- Kumar, S.; Piplani, P.; Mehan, S.; Aswal, V.K. Probing structural evolution in heat induced protein gelation by scattering techniques. AIP Conf. Proc. 2017, 1832, 040005. [Google Scholar] [CrossRef]
- Dahal, E.; Choi, M.; Alam, N.; Bhirde, A.A.; Beaucage, S.L.; Badano, A. Structural evaluation of an amyloid fibril model using small-angle X-ray scattering. Phys. Biol. 2017, 14, 046001. [Google Scholar] [CrossRef]
- Rüegg, M.; Moor, U.; Blanc, B. A calorimetric study of the thermal denaturation of whey proteins in simulated milk ultrafiltrate. J. Dairy Res. 1977, 44, 509–520. [Google Scholar] [CrossRef]
- Molodenskiy, D.; Shirshin, E.; Tikhonova, T.; Gruzinov, A.; Peters, G.; Spinozzi, F. Thermally induced conformational changes and protein–protein interactions of bovine serum albumin in aqueous solution under different pH and ionic strengths as revealed by SAXS measurements. Phys. Chem. Chem. Phys. 2017, 19, 17143–17155. [Google Scholar] [CrossRef]
- Perez, B.C.; Morris, H.J.; Hart, R.T.; Liu, J. Finite element modeling of the viscoelastic responses of the eye during microvolumetric changes. J. Biomed. Sci. Eng. 2013, 06, 29–37. [Google Scholar] [CrossRef]
- Gonçalves, A.D.; Alexander, C.; Roberts, C.J.; Spain, S.G.; Uddin, S.; Allen, S. The effect of protein concentration on the viscosity of a recombinant albumin solution formulation. RSC Adv. 2016, 6, 15143–15154. [Google Scholar] [CrossRef]
- Lonetti, B.; Fratini, E.; Chen, S.H.; Baglioni, P. Viscoelastic and small angle neutron scattering studies of concentrated protein solutions. Phys. Chem. Chem. Phys. 2004, 6, 1388–1395. [Google Scholar] [CrossRef]
- Sharma, V.; Jaishankar, A.; Wang, Y.-C.; McKinley, G.H. Rheology of globular proteins: Apparent yield stress, high shear rate viscosity and interfacial viscoelasticity of bovine serum albumin solutions. Soft Matter 2011, 7, 5150. [Google Scholar] [CrossRef]
- Yadav, S.; Shire, S.J.; Kalonia, D.S. Viscosity Analysis of High Concentration Bovine Serum Albumin Aqueous Solutions. Pharm. Res. 2011, 28, 1973–1983. [Google Scholar] [CrossRef] [PubMed]
- Gaylord, N.G.; Gibbs, J.H. Physical chemistry of macromolecules. C. TANFORD. Wiley, New York, 1961. vii+7lOpp. $18.00. J. Polym. Sci. 1962, 62, S22–S23. [Google Scholar] [CrossRef]
- Lin, V.J.C.; Koenig, J.L. Raman studies of bovine serum albumin. Biopolymers 1976, 15, 203–218. [Google Scholar] [CrossRef] [PubMed]
- Taillandier, E.; Liquier, J.; Ghomi, M. Conformational transitions of nucleic acids studied by IR and Raman spectroscopies. J. Mol. Struct. 1989, 214, 185–211. [Google Scholar] [CrossRef]
- Cai, S.; Singh, B.R. Identification of β-turn and random coil amide III infrared bands for secondary structure estimation of proteins. Biophys. Chem. 1999, 80, 7–20. [Google Scholar] [CrossRef]
- Fabian, H.; Anzenbacher, P. New developments in Raman spectroscopy of biological systems. Vib. Spectrosc. 1993, 4, 125–148. [Google Scholar] [CrossRef]
- Iconomidou, V.; Chryssikos, G.D.; Gionis, V.; Pavlidis, M.; Paipetis, A.; Hamodrakas, S. Secondary Structure of Chorion Proteins of the Teleostean Fish Dentex dentex by ATR FT-IR and FT-Raman Spectroscopy. J. Struct. Biol. 2000, 132, 112–122. [Google Scholar] [CrossRef] [PubMed]
- Synytsya, A.; Alexa, P.; de Boer, J.; Loewe, M.; Moosburger, M.; Würkner, M.; Volka, K. Raman spectroscopic study of serum albumins: An effect of proton- and γ-irradiation. J. Raman Spectrosc. 2007, 38, 1646–1655. [Google Scholar] [CrossRef]
- Frushour, B.G.; Koenig, J.L. Raman spectroscopic study of tropomyosin denaturation. Biopolymers 1974, 13, 1809–1819. [Google Scholar] [CrossRef]
- Rygula, A.; Majzner, K.; Marzec, K.M.; Kaczor, A.; Pilarczyk, M.; Baranska, M. Raman spectroscopy of proteins: A review. J. Raman Spectrosc. 2013, 44, 1061–1076. [Google Scholar] [CrossRef]
- Meersman, F.; Dobson, C.M.; Heremans, K. Protein unfolding, amyloid fibril formation and configurational energy landscapes under high pressure conditions. Chem. Soc. Rev. 2006, 35, 908–917. [Google Scholar] [CrossRef] [PubMed]
- Burton, S.J.; Quirk, A.V.; Wood, P.C. Refolding human serum albumin at relatively high protein concentration. Eur. J. Biochem. 1989, 179, 379–387. [Google Scholar] [CrossRef] [PubMed]
- Kurbanova, B.; Ashikbayeva, Z.; Amantayeva, A.; Sametova, A.; Blanc, W.; Gaipov, A.; Tosi, D.; Utegulov, Z. Thermo-Visco-Elastometry of RF-Wave-Heated and Ablated Flesh Tissues Containing Au Nanoparticles. Biosensors 2023, 13, 8. [Google Scholar] [CrossRef]


Disclaimer/Publisher’s Note: The statements, opinions and data contained in all publications are solely those of the individual author(s) and contributor(s) and not of MDPI and/or the editor(s). MDPI and/or the editor(s) disclaim responsibility for any injury to people or property resulting from any ideas, methods, instructions or products referred to in the content. |
© 2023 by the authors. Licensee MDPI, Basel, Switzerland. This article is an open access article distributed under the terms and conditions of the Creative Commons Attribution (CC BY) license (https://creativecommons.org/licenses/by/4.0/).
Share and Cite
Kharmyssov, C.; Sekerbayev, K.; Nurekeyev, Z.; Gaipov, A.; Utegulov, Z.N. Mechano-Chemistry across Phase Transitions in Heated Albumin Protein Solutions. Polymers 2023, 15, 2039. https://doi.org/10.3390/polym15092039
Kharmyssov C, Sekerbayev K, Nurekeyev Z, Gaipov A, Utegulov ZN. Mechano-Chemistry across Phase Transitions in Heated Albumin Protein Solutions. Polymers. 2023; 15(9):2039. https://doi.org/10.3390/polym15092039
Chicago/Turabian StyleKharmyssov, Chingis, Kairolla Sekerbayev, Zhangatay Nurekeyev, Abduzhappar Gaipov, and Zhandos N. Utegulov. 2023. "Mechano-Chemistry across Phase Transitions in Heated Albumin Protein Solutions" Polymers 15, no. 9: 2039. https://doi.org/10.3390/polym15092039
APA StyleKharmyssov, C., Sekerbayev, K., Nurekeyev, Z., Gaipov, A., & Utegulov, Z. N. (2023). Mechano-Chemistry across Phase Transitions in Heated Albumin Protein Solutions. Polymers, 15(9), 2039. https://doi.org/10.3390/polym15092039