3.1. Characterization of the Modified TiO2 Nanoparticles
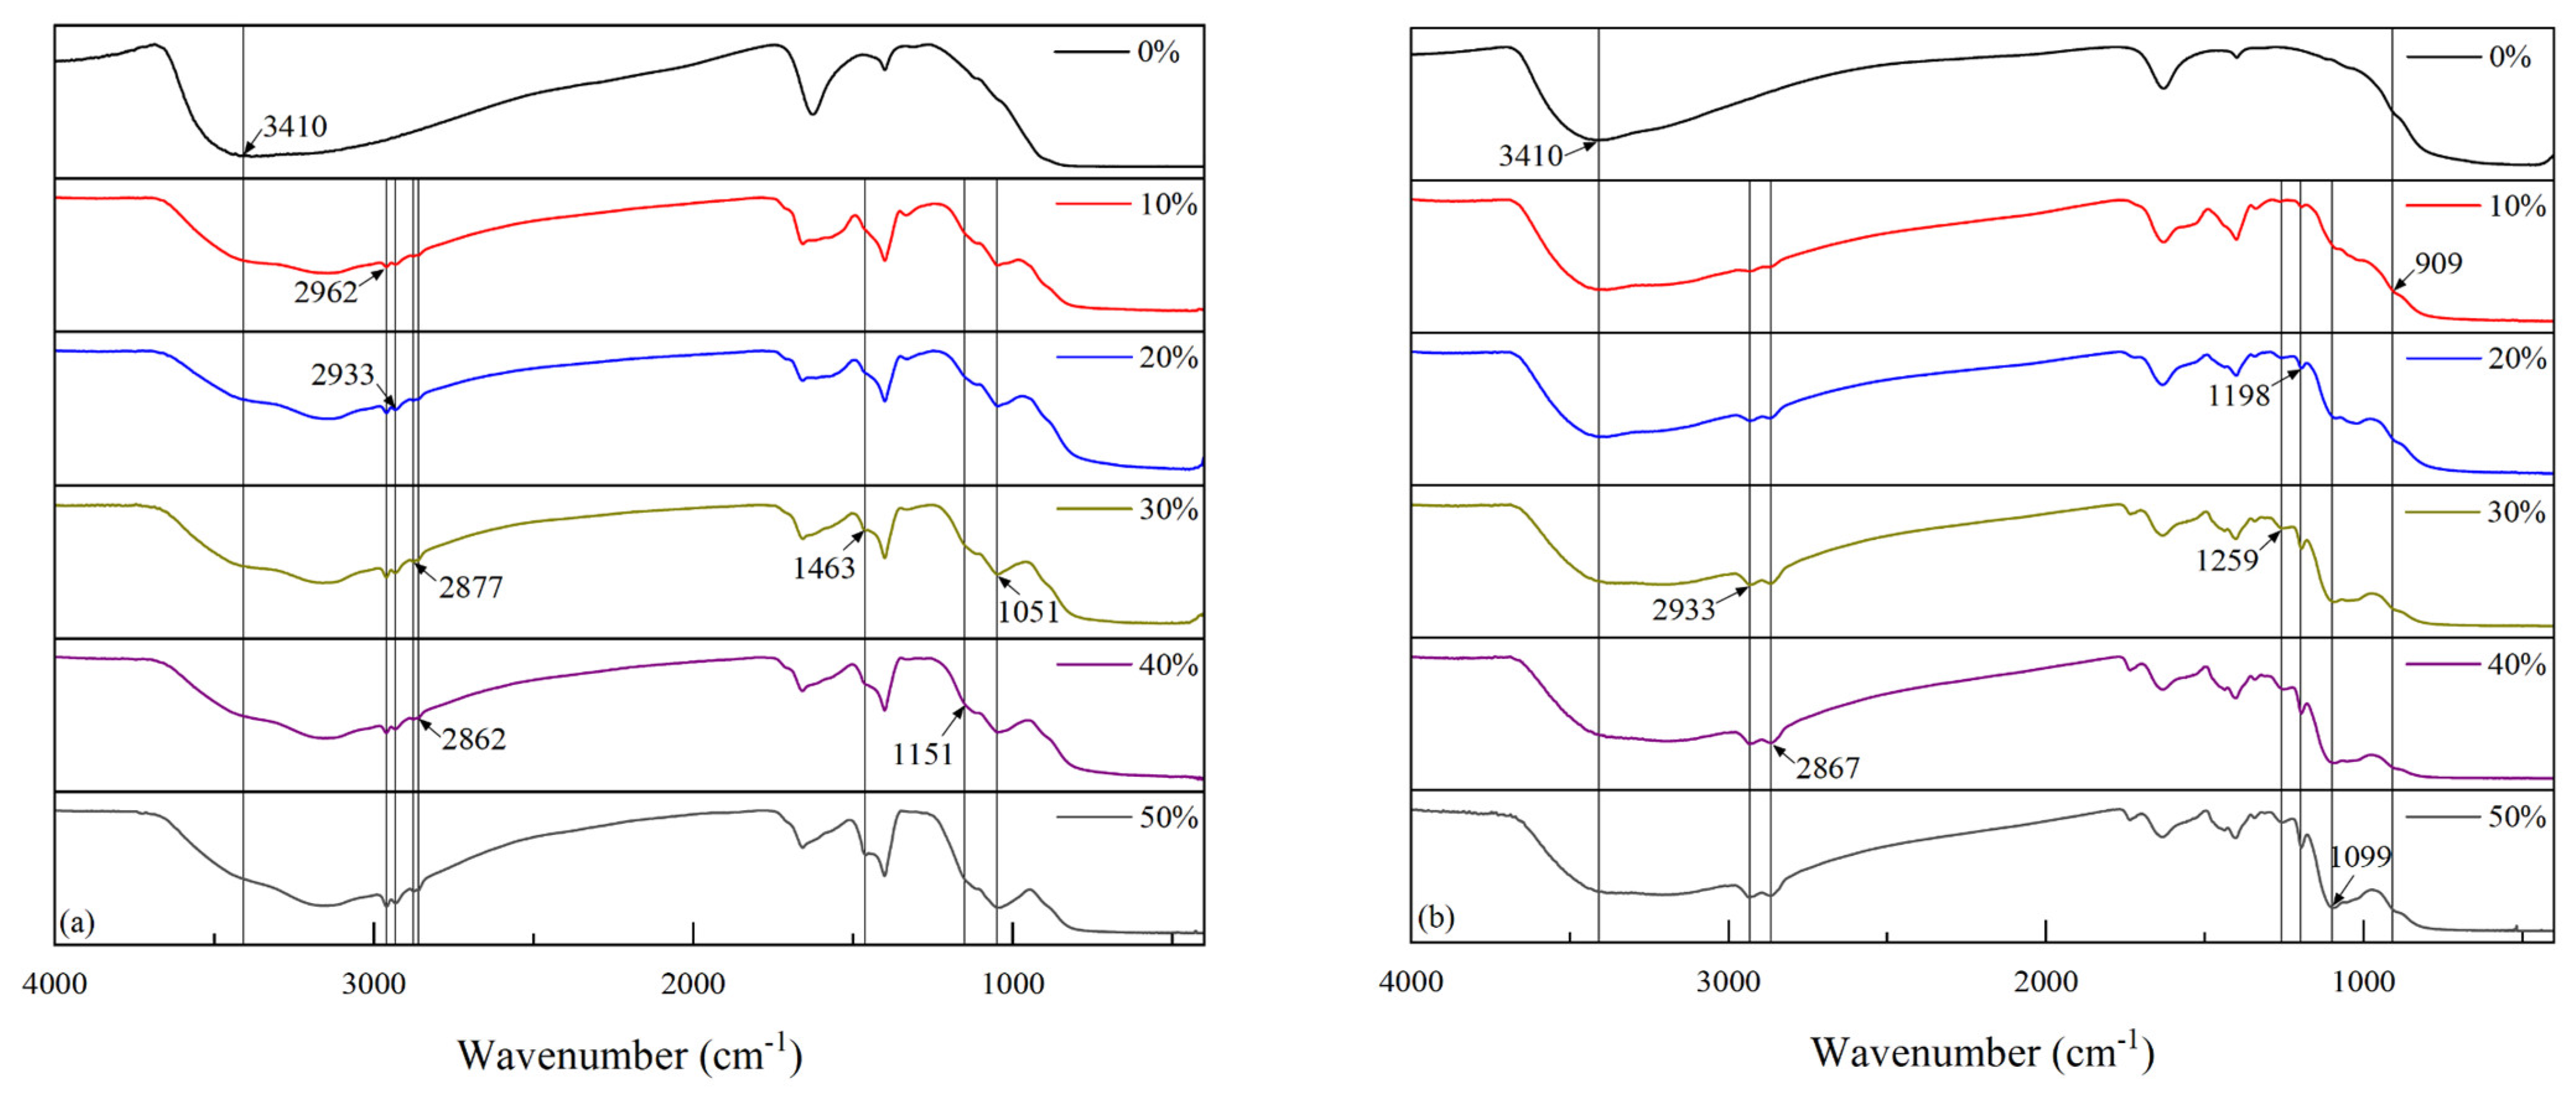
FT-IR spectroscopy was used to characterize the chemical bonding changes before and after the modification of the two coupling agents with different proportions, and the IR spectral analysis of the NDZ-201-modified nano-TiO
2 with different modification ratios is shown in
Figure 3a. With an increase in the ratio, we observed a gradual increase in the absorption peaks at 2962, 2933, 2877, 2862, 1463, 1151, and 1051 cm
−1 for the NDZ-201-modified TiO
2 nanoparticles. Combined with related reports [
24], the peaks at 2962, 2933, 2877, and 2862 cm
−1 were identified as the C–H stretching vibration peaks; 1463 cm
−1 as the C–H bending vibration peak; 1151 cm
−1 as the P = O characteristic peak; and 1051 cm
−1 as the P–O–P characteristic peak. In addition, the stretching vibration peak corresponding to –OH at 3410 cm
−1 first weakened and remained roughly unchanged with an increase in the modification ratio, indicating that the –OH groups on the nano-TiO
2 surface were initially continuously consumed during the reaction, and then they reacted completely with the coupling agent molecules when the ratio was near 30 wt%.
The IR spectra analysis of the KH-560-modified nano-TiO
2 with different modification ratios is shown in
Figure 3b. With an increase in the ratio, we observed a gradual increase in the absorption peaks at 2933, 2867, 1259, 1198, 1099, and 909 cm
−1 for the KH-560-modified TiO
2 nanoparticles. Combined with related reports [
25], the peaks at 2933 cm
−1 and 2867 cm
−1 were identified as the C–H stretching vibration peaks; 1259 cm
−1 as the asymmetric stretching vibration peak of the epoxy group; 1198 cm
−1 as the C–O–C stretching vibration peak; 1099 cm
−1 as the Si–O–Si stretching vibration peak; and 909 cm
−1 as the symmetric stretching vibration peak of the epoxy group. The absorption peak at 3410 cm
−1 did not change significantly with an increase in the ratio, which was related to the silanol produced by the hydrolysis of KH-560. The intensity of this absorption peak was approximately unchanged when the ratio was near 30 wt%, indicating that the –OH groups on the surface of the TiO
2 had reacted completely with the coupling agent molecules.
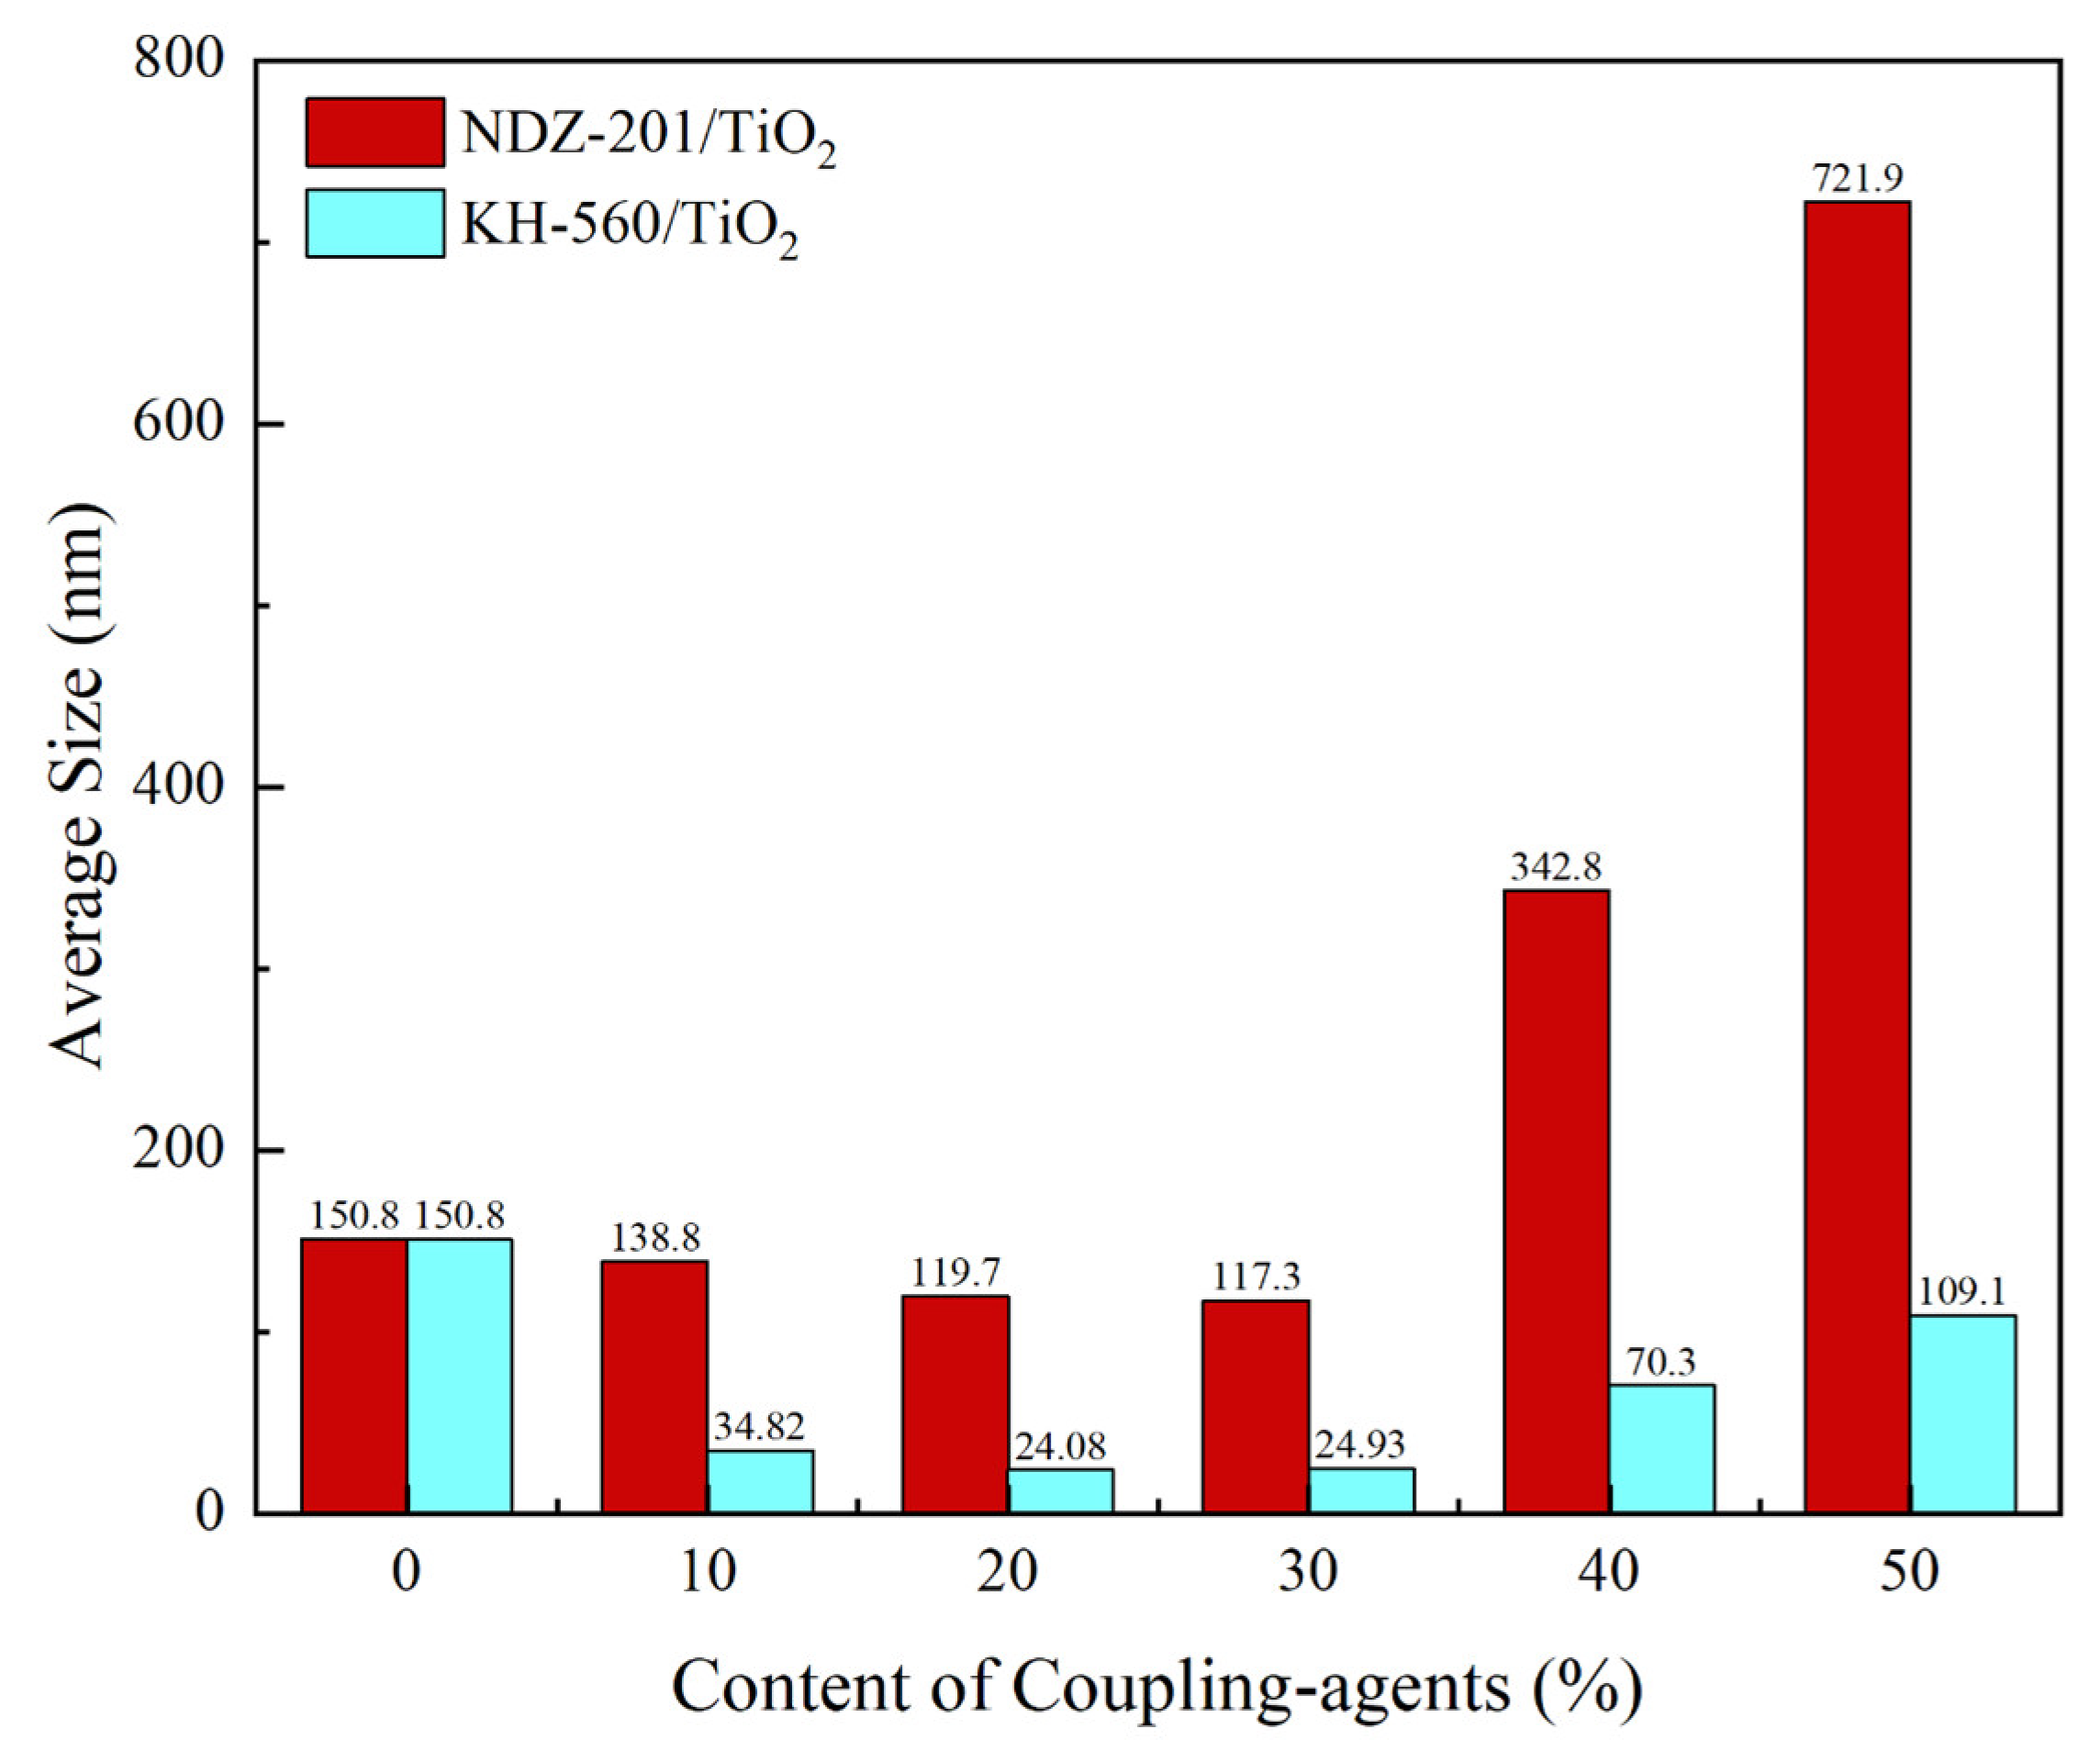
The average particle size of nano-TiO
2 modified by the two coupling agents at different modification ratios was tested by a Malvern laser particle size analyzer, and the results are shown in
Figure 4. From the overall effect of coupling agents on the average particle size, the average particle size of nano-TiO
2 could be reduced by the modification of the coupling agents within a certain ratio, which meant that the surface energy of nano-TiO
2 was reduced during the surface modification process, implying that the surface modification of nano-TiO
2 by the coupling agents with an appropriate modification ratio could inhibit the tendency of the nanoparticles to agglomerate. However, the average particle size of modified TiO
2 increased with an increase in the modification ratio when the ratio was greater than a certain value, along with a greater absolute increase in the NDZ-201 group. The reason was different for each coupling agent. The NDZ-201 molecule had three dioctyl pyrophosphate acyloxy groups per molecule, so the intermolecular force of the coupling agent was larger, and it was difficult to disperse the modified TiO
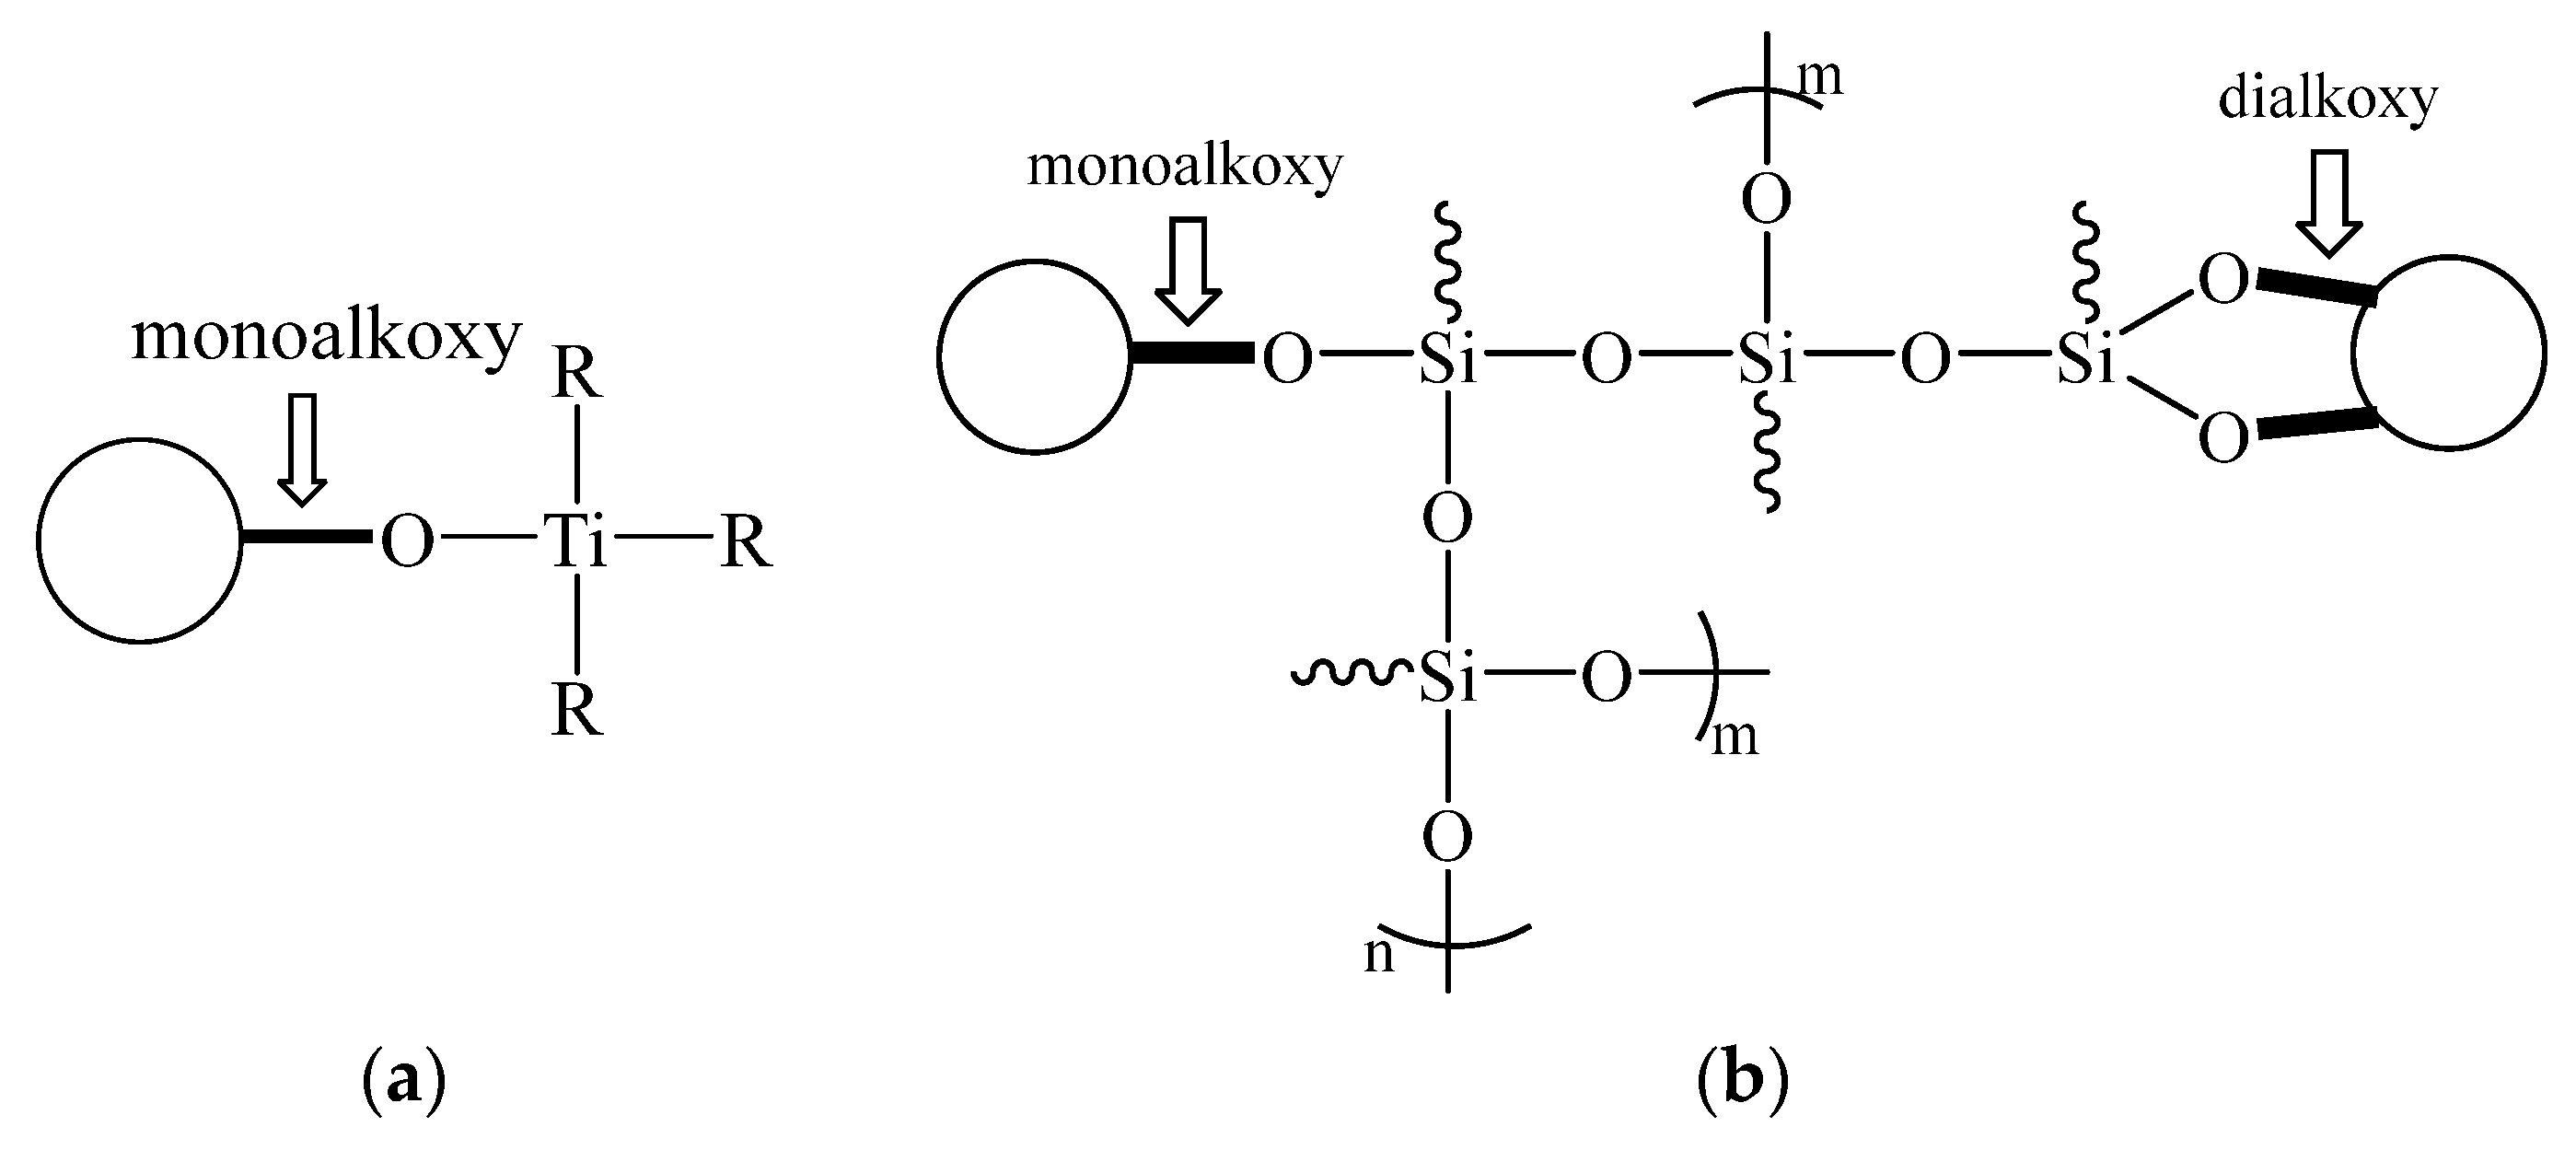
2 in anhydrous ethanol when the coupling agent quantity exceeded a certain value. The KH-560 molecules could form Si–O–Si bridge bonds between the modified TiO
2 particles (shown in
Figure 1b), which was more significant when the coupling agent was overdosed, leading to an increase in the average particle size. We concluded that KH-560 could inhibit the agglomeration tendency of the TiO
2 nanoparticles to a greater extent compared to NDZ-201 in an anhydrous ethanol environment. For NDZ-201, the suitable modification ratio was about 30 wt% (relative to nano-TiO
2), while the ratio was 20 wt% for KH-560.
The two kinds of modified nano-TiO
2 particles (for ease of comparison, the modified ratios were all 30 wt%) were characterized by an X-ray photoelectron spectrometer (XPS), and the results are shown in
Figure 5. The surface of nano-TiO
2 modified by NDZ-201 contained P, and the surface modified by KH-560 contained Si, which proved that the two coupling agents were successfully grafted onto the nano-TiO
2 particle surface. In addition, KH-560 did not contain Ti, so the absorption peak intensity of Ti in
Figure 5b was significantly smaller than that in
Figure 5a. It was determined that C all came from the two coupling agents themselves. The mass fraction of C in NDZ-201 (C
51H
112O
22P
6Ti, MW. = 1311.13) was 46.91%, while that in KH-560 (C
9H
20O
5Si, MW. = 236.34) was 45.93%. There was little difference between the number of C atoms in the two coupling agents of equal mass, but the absorption peak intensity of C in
Figure 5a was much less than that in
Figure 5b. The results showed that the adsorption mass of NDZ-201 on the surface of nano-TiO
2 was less than KH-560 at the modification ratio of 30 wt%. Moreover, the chemical shifts of each element in
Figure 5a,b were very close, which showed that the valence state of each element did not change significantly during the modification process.
The peaks of the surface elements were fitted by the peak fitting process, according to the conclusions found in the literature [
26], and the results are shown in
Figure 6 and
Figure 7. As shown in
Figure 6, the characteristic peak of the –P
2O
7 group appeared in the spectrum, which proved that the pyrophosphate structure within the NDZ-201 molecule was not destroyed after the modification reaction. The intensity of the –CH
3 peak was much smaller than the C–C peak, which indicated that the isopropoxy group in the molecular structure of NDZ-201 no longer existed, and the –CH
3 group in the structure was only present in the –C
8H
17 group after modification. This was because the isopropoxy group reacted with the surface –OH group of the surface of the nanoparticles during the modification process, connecting the surface of the nano-TiO
2 with NDZ-201. As presented in
Figure 7, the XPS spectrum no longer showed the presence of the –CH
3 peak, which proved that the –OCH
3 group in KH-560 was completely hydrolyzed after the reaction. In addition, the binding energy of the C–O peak in
Figure 7 was larger than in
Figure 6, due to the large binding energy of C–O in the epoxy structure of KH-560, indicating that the epoxy groups of KH-560 remained stable during the modification process.
3.2. Isothermal Curing Process of the Prepolymers
The UV-normal temperature synergistic curing process mechanism of prepolymers can be divided into two stages: the UV irradiation initiation reaction and the normal-temperature curing reaction [
27]:
The photoinitiator Ar
3S
+SbF
6− reacted with trace amounts of active hydrogen compounds HY (such as H
2O) in the system under UV irradiation to produce the super-acid HSbF
6, as shown in
Scheme 1, where
k1 denotes the reaction rate constant in this reaction, and HSbF
6 is extremely acidic and will easily dissociate the hydrogen ion.
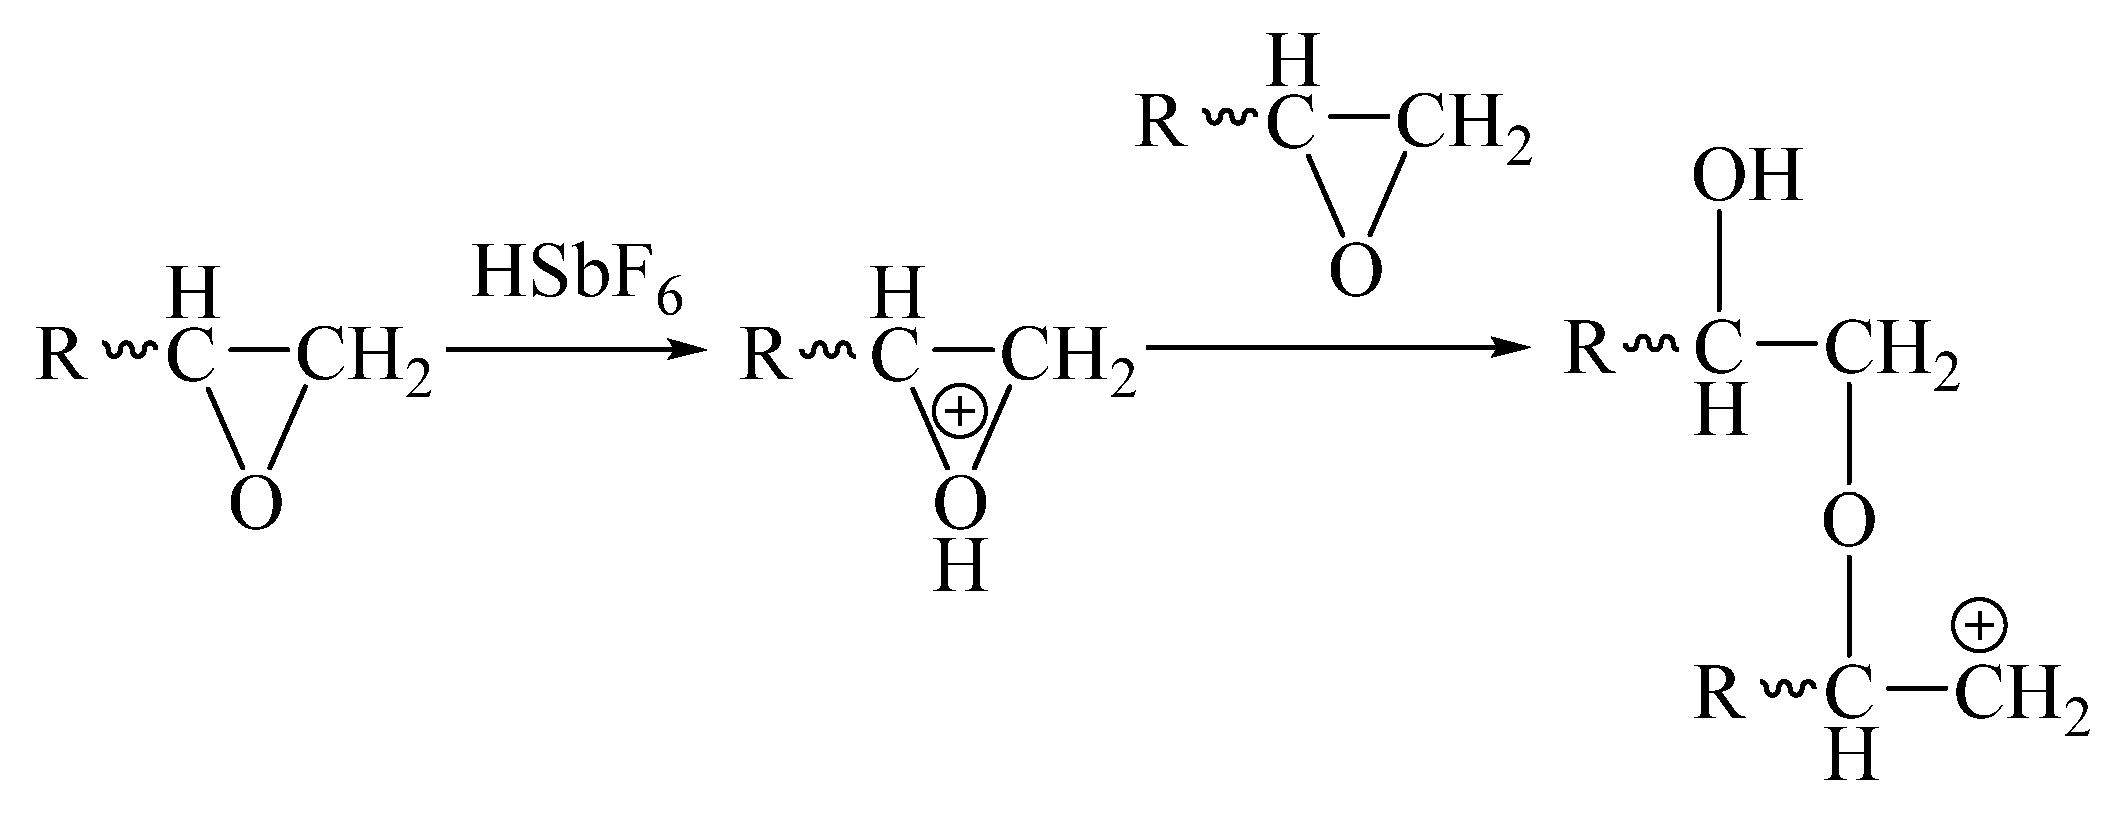
As shown in
Scheme 2, the positively charged group formed by the dissociated H
+ combined with the epoxy group and attacked the next epoxy resin macromolecular chain, opening the ring of the epoxy group and connecting the two epoxy resin macromolecules. As a result, a positive charge was transferred to the new epoxy macromolecular chain. This cycle repeated itself and eventually built a large cross-linked network.
Under UV irradiation, the prepolymer was cured according to the cationic polymerization mechanism described above. As a result, the epoxy polymer chains were connected to each other with –CH
2O–groups, with
k1 as the initiation reaction rate, which mainly depended on the efficiency of the initiator to produce H
+ by UV irradiation. According to the formation of super-acid HSbF
6, the concentration of active hydrogen compound
cHY and irradiation coefficient
K were the main factors for determining
k1, as shown in Equation (3), where
A is a constant,
is the concentration of triarylsulfonium hexafluoroantimonate salts, and
m and
n are defined as the orders of the reaction. It can be seen that nano-TiO
2 and the coupling agents played a role in the UV initiation reaction; in accordance with Equation (3), nano-TiO
2 acted as a scattering agent to reduce the irradiation coefficient
K, resulting in a decrease in
k1 [
28]. However, the –OH group on the surface could provide active hydrogen, causing
cHY to increase and
k1 to rise.
For the two coupling agents NDZ-201 and KH-560, the effect of surface modification on cHY had to be determined by comparing their structure with the consumption surface –OH groups during the modification process. Each NDZ-201 molecule contained three pyrophosphate groups, and each pyrophosphate group contained one –OH group, while there were no –OH groups in the molecular structure of KH-560. Therefore, compared to unmodified nano-TiO2, modification by NDZ-201 could increase cHY and by KH-560 could reduce cHY, eventually leading to differences in the performance of nano-TiO2 modified by different coupling agents in the UV irradiation initiation reaction.
Triethylenetetramine, as a normal-temperature curing agent, reacted with the epoxy groups through the nucleophilic addition mechanism. Each triethylenetetramine molecule contained four reaction sites, including two primary amine nitrogen atoms and two secondary amine nitrogen atoms. The reaction process of the primary amine nitrogen atom with the epoxy group is shown in
Scheme 3.
After the above reaction, the primary amine nitrogen atom was converted into the secondary amine nitrogen atom, and the reaction process between the secondary amine nitrogen atom and the epoxy group is shown in
Scheme 4.
Each triethylenetetramine molecule could connect six epoxy polymer chains together. Turi et al. [
29] studied the effect of nanoparticles (such as nano-TiO
2) on the reaction rate in the heat curing reaction. First, nano-TiO
2 provided more reaction sites for the curing reaction, and second, the –OH groups on the nano-TiO
2 surface could catalyze the ring-opening reaction of the epoxy groups. Both points increased the reaction rate of the curing process.
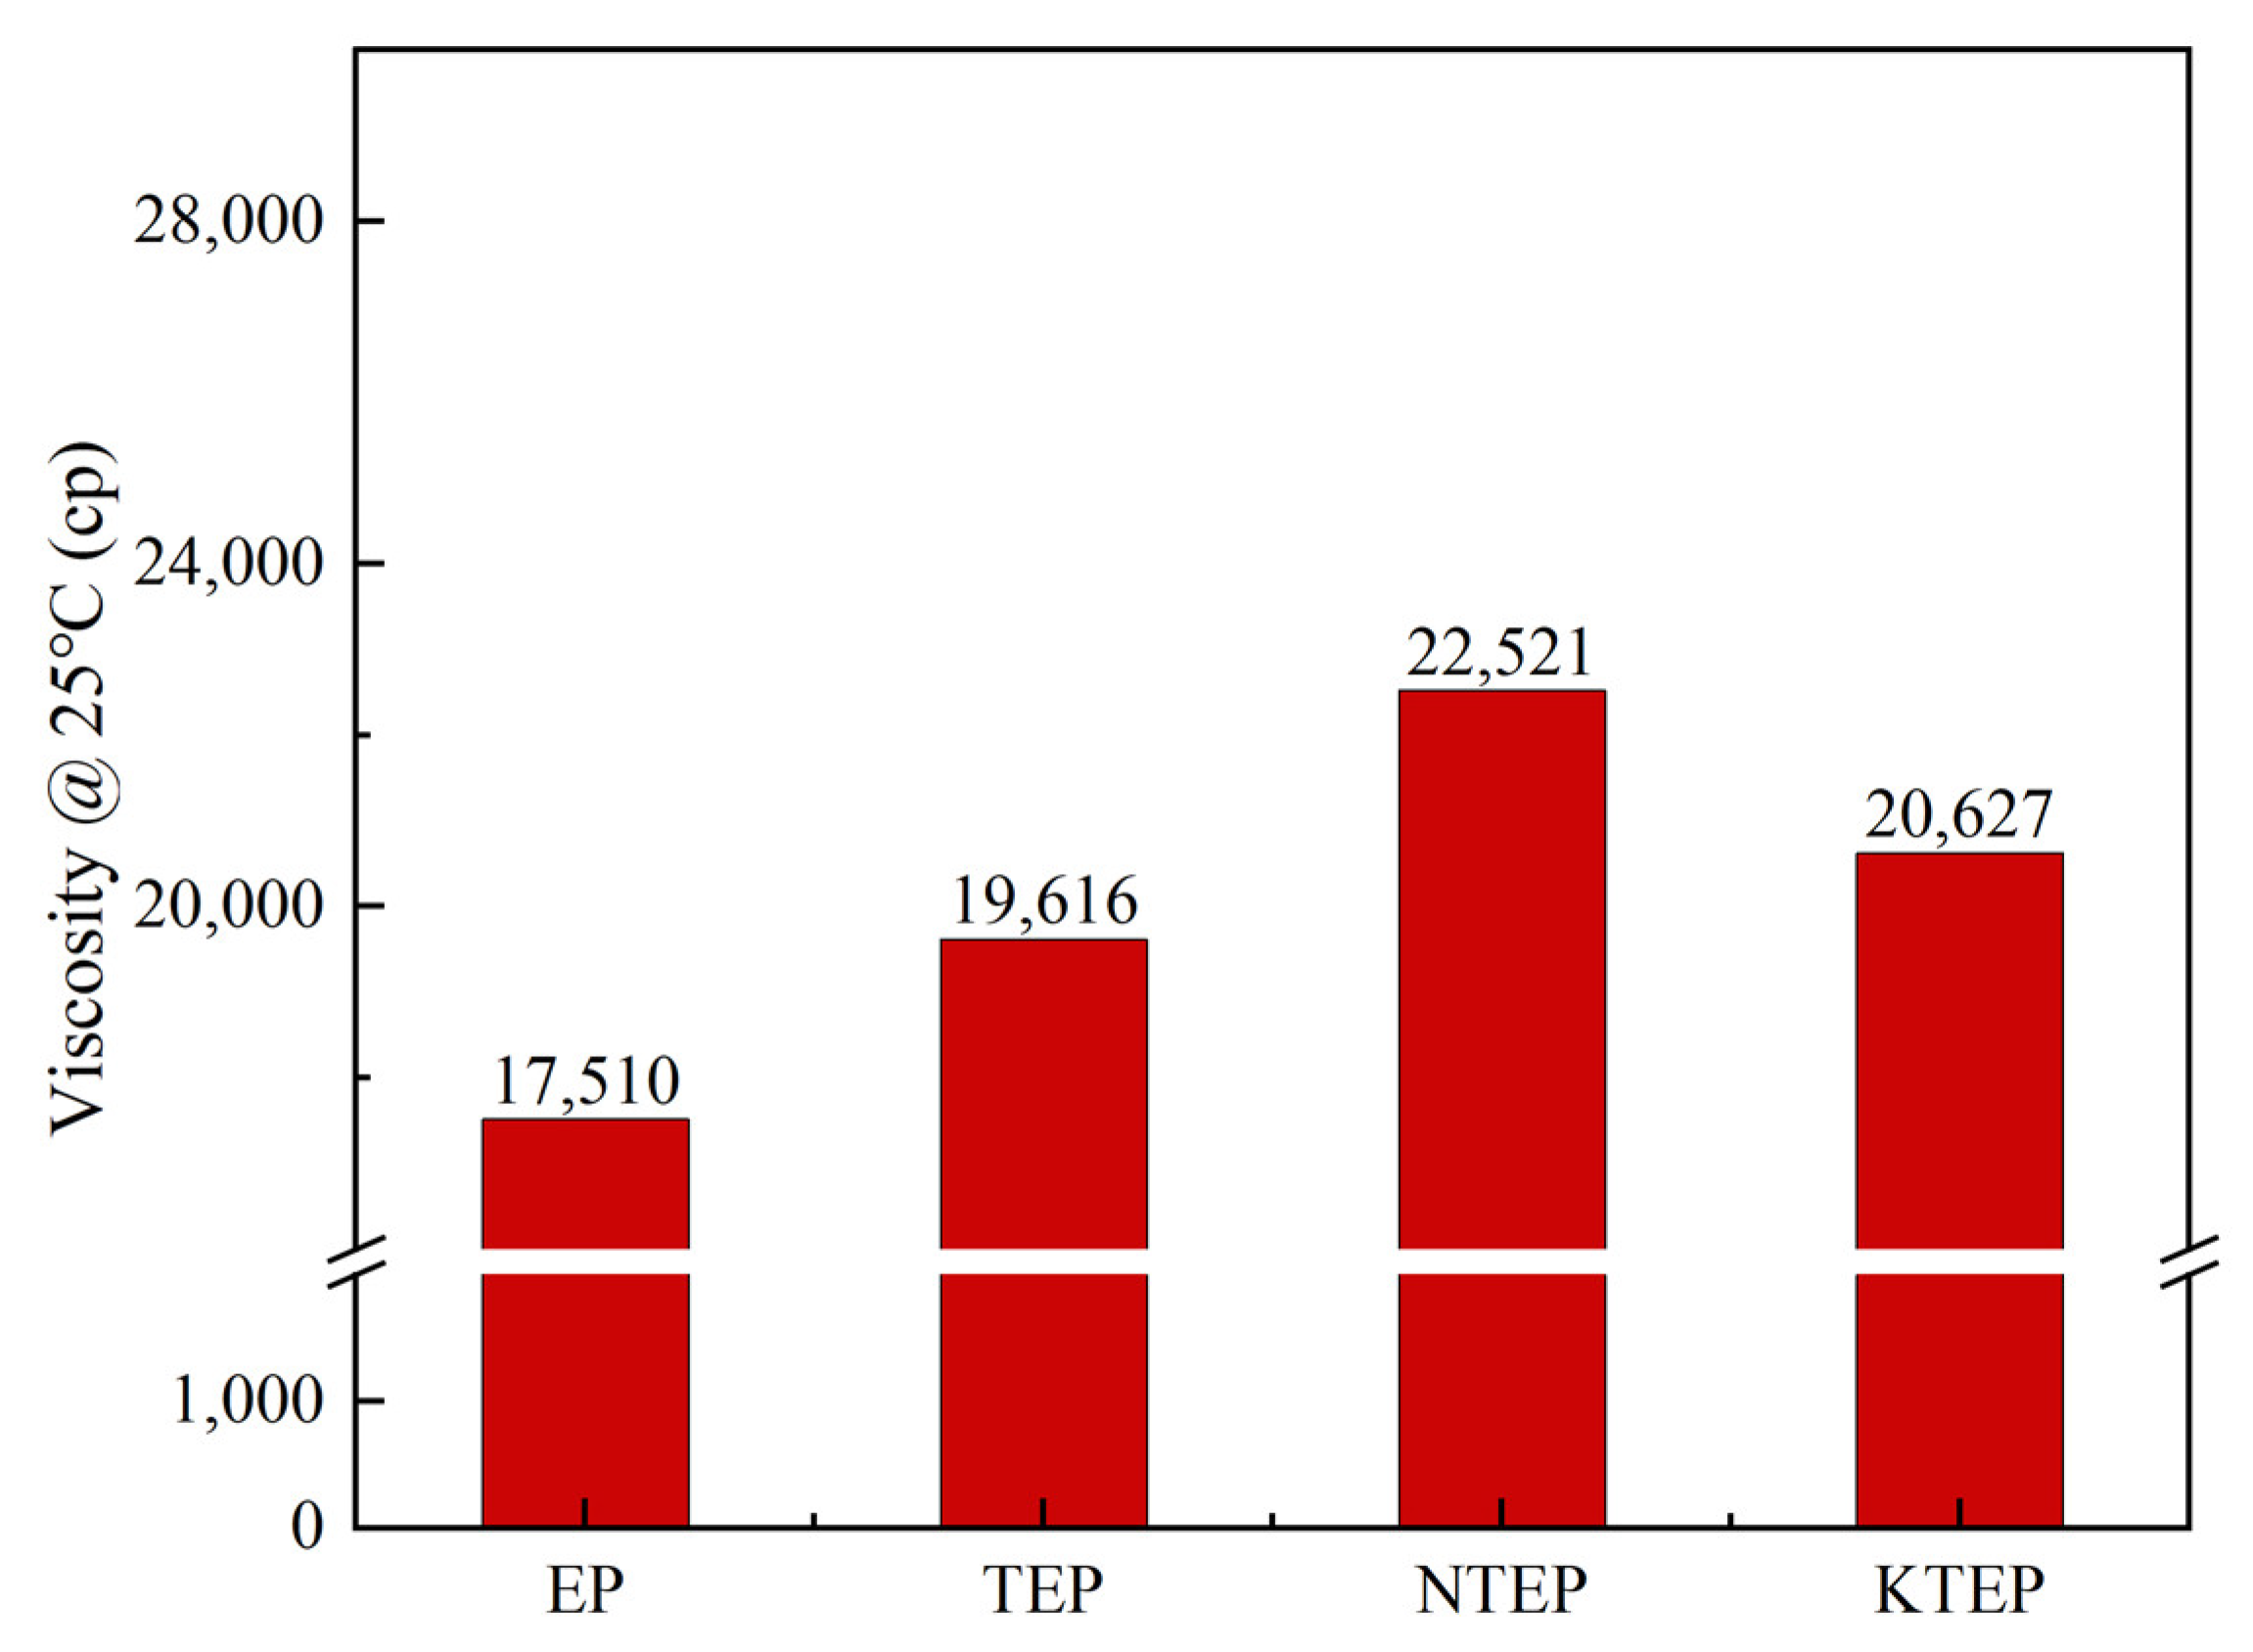
However, the viscosity of the curing system gradually became the dominant factor affecting the curing reaction rate after the middle and later periods of the curing reaction, where the greater the viscosity of the system, the greater the resistance of the polymer chain segment, and the more difficult the curing reaction. The viscosities of the four prepolymer systems, namely EP, TEP, NTEP, and KTEP (for ease of comparison, the modification ratios relative to fillers were all 30 wt%; the ratios of fillers to E-51were all 1 wt%), were measured at room temperature, as shown in
Figure 8, and the relative viscosity order of the prepolymers was NTEP > KTEP > TEP > EP. The viscosity of the prepolymer containing nano-TiO
2 was greater than the pure epoxy resin. Due to the addition of filler particles, the epoxy resin matrix changed from a homogeneous system to a heterogeneous system, where the high surface energy and agglomeration tendency of the nanoparticles further increased the viscosity of the prepolymer. The coupling agents could reduce the viscosity of the system by inhibiting the agglomeration of the nanoparticles and improving the viscosity due to their inherent high intermolecular forces. The NTEP system had the greatest viscosity due to the large tail chain and intermolecular force of the NDZ-201 molecules, which became an important factor that affected the curing rate of the NTEP system.
In the isothermal curing process, at time
t, the heat flow rate could be defined as
dH/
dt, and the current heat of reaction Σ
Ht was defined by Equation (4).
When the reaction was nearly complete, the time was
tmax, and the curing degree of the system was
α =
αmax. The heat flow rate
dH/
dt of the system conformed to Equation (5).
Assuming the curing process was complete at this point, i.e.,
α = 1, the total heat emitted in this reaction Σ
H could be defined by Equation (6).
Because
dH/
dt was proportional to
dα/dt (the ring-opening rate of the epoxy group and also the curing reaction rate) in the isothermal curing reaction, the heat of reaction Σ
Ht was proportional to the curing degree
α, as shown in Equation (7).
Subsequently,
dα/
dt could be defined by Equation (8).
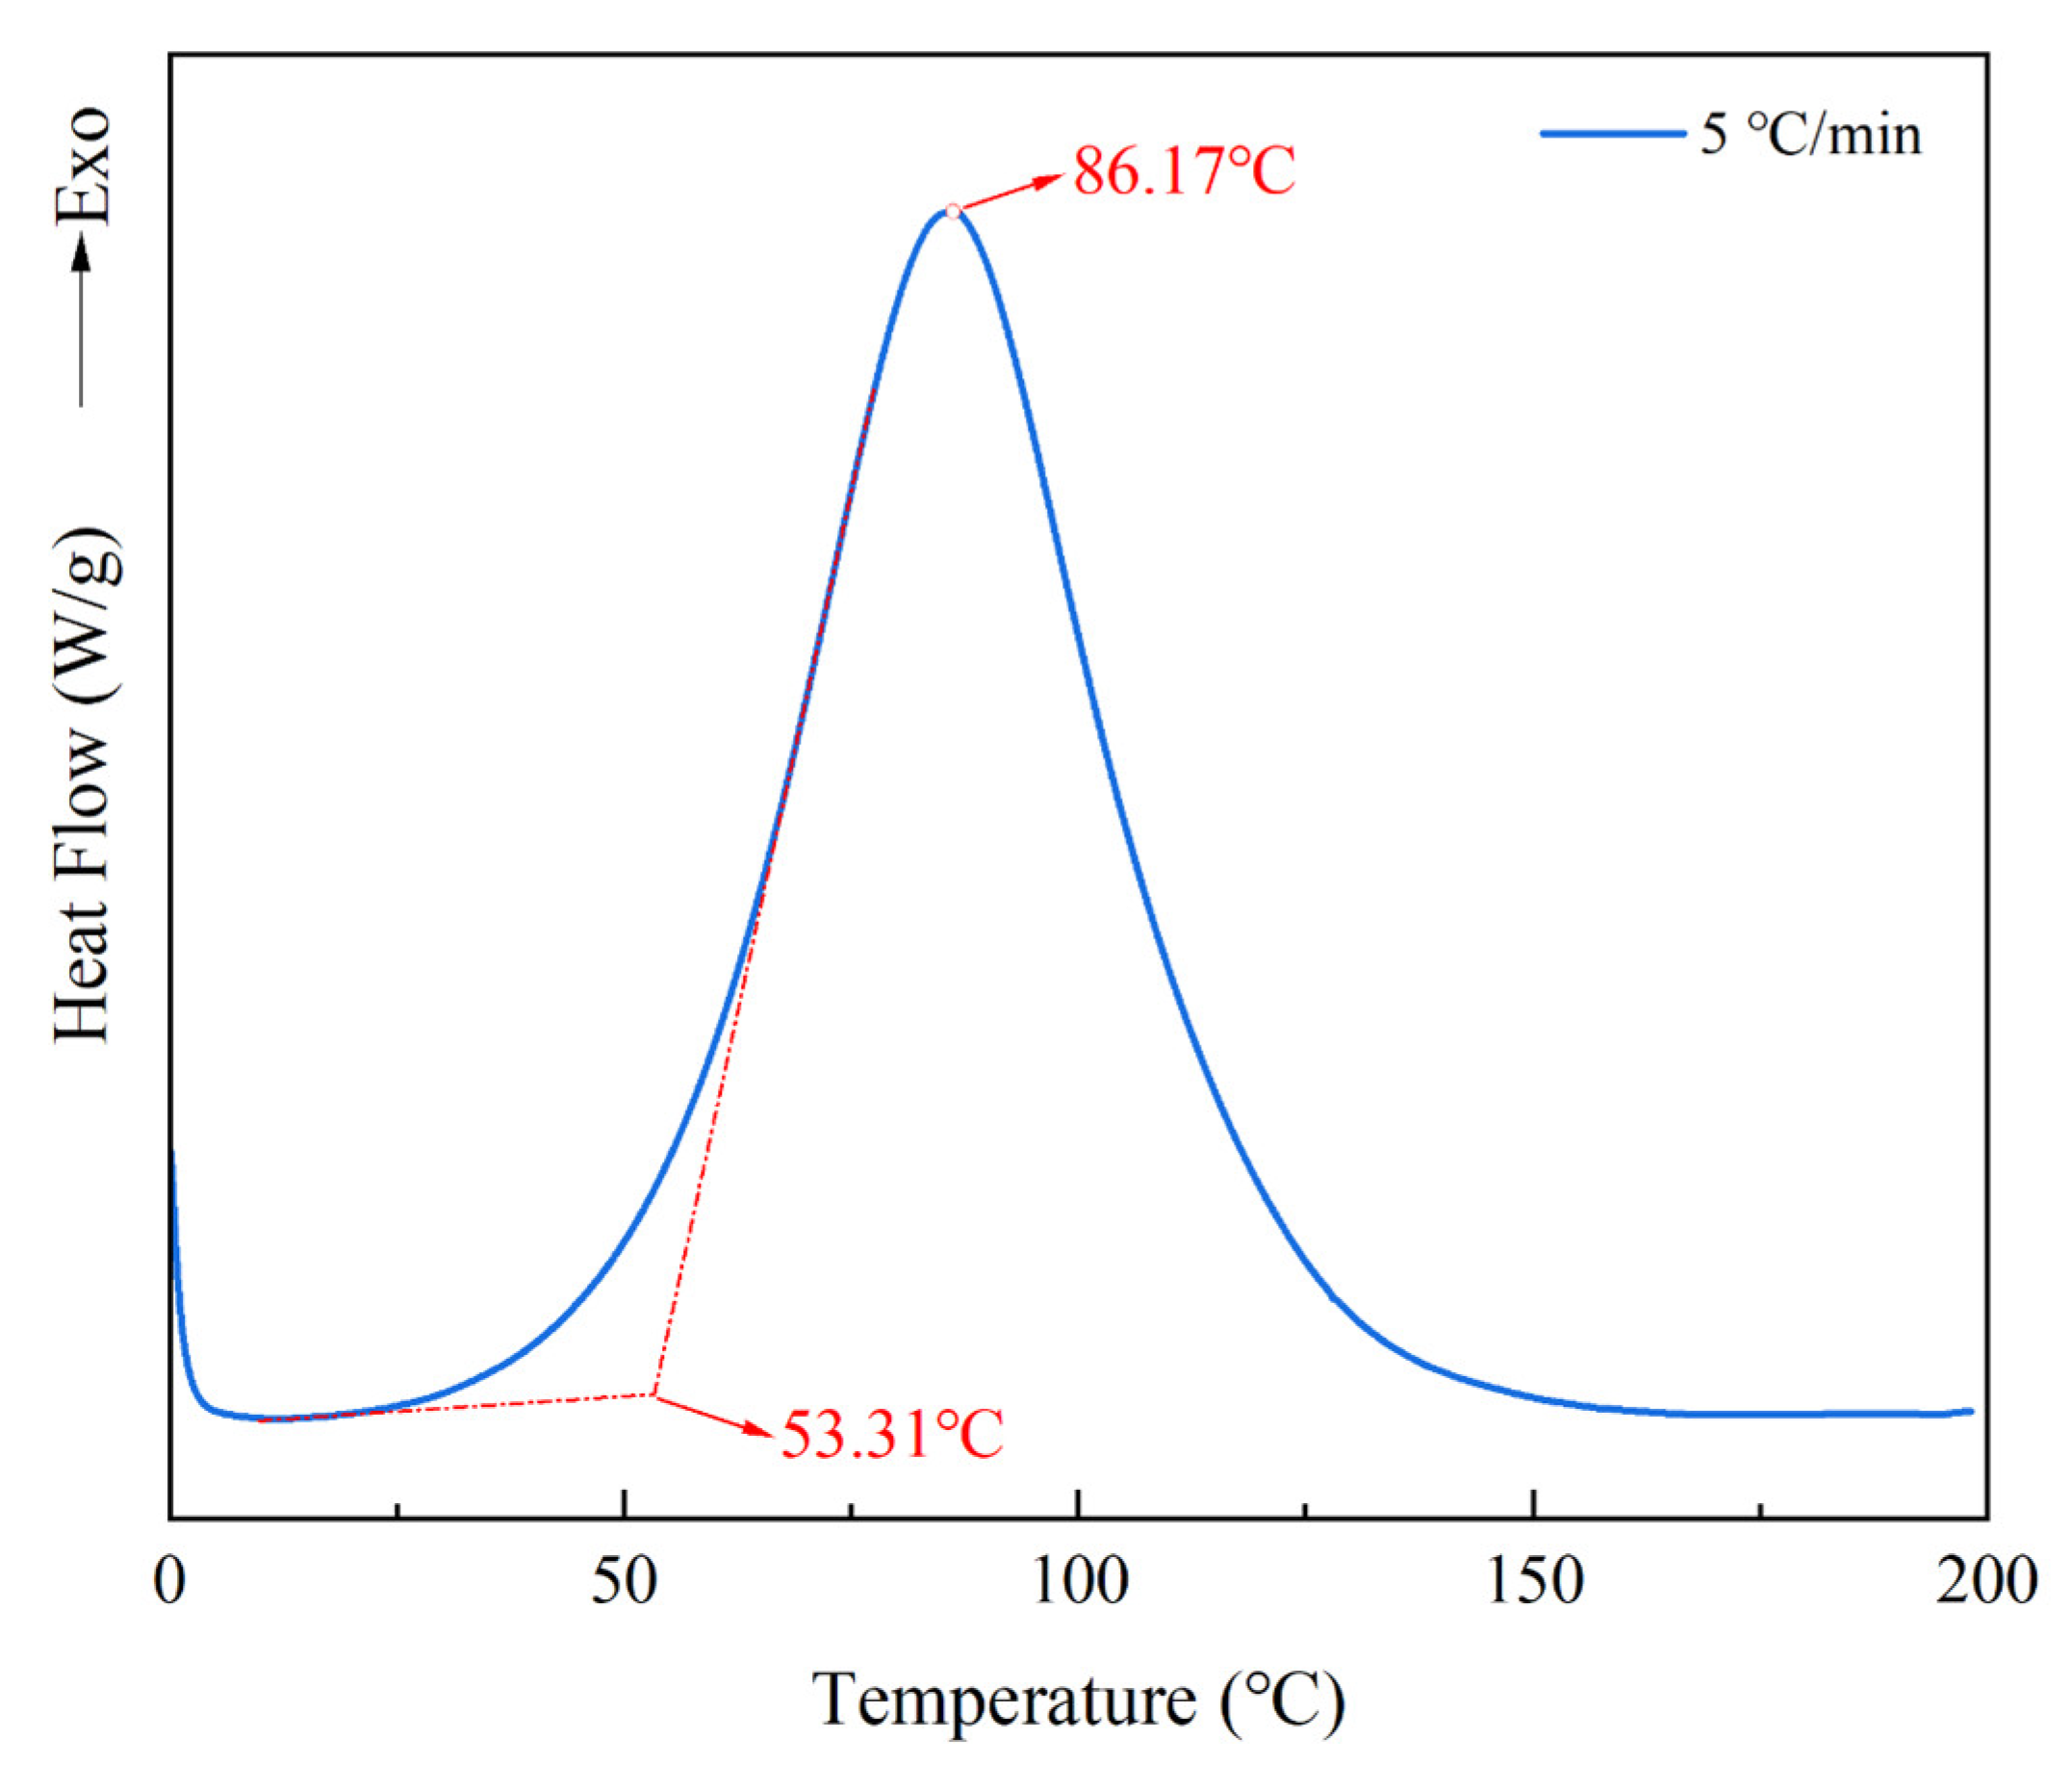
The EP system prepolymer was irradiated in the UV light box (the UV irradiation condition in this step was 60 s per cycle), and then we performed dynamic DSC scanning to determine the suitable isothermal curing temperature range. The results are shown in
Figure 9. The initial curing temperature
Ti of the EP-60 system was 53.31 °C, and the peak temperature
Tp was 86.17 °C. The
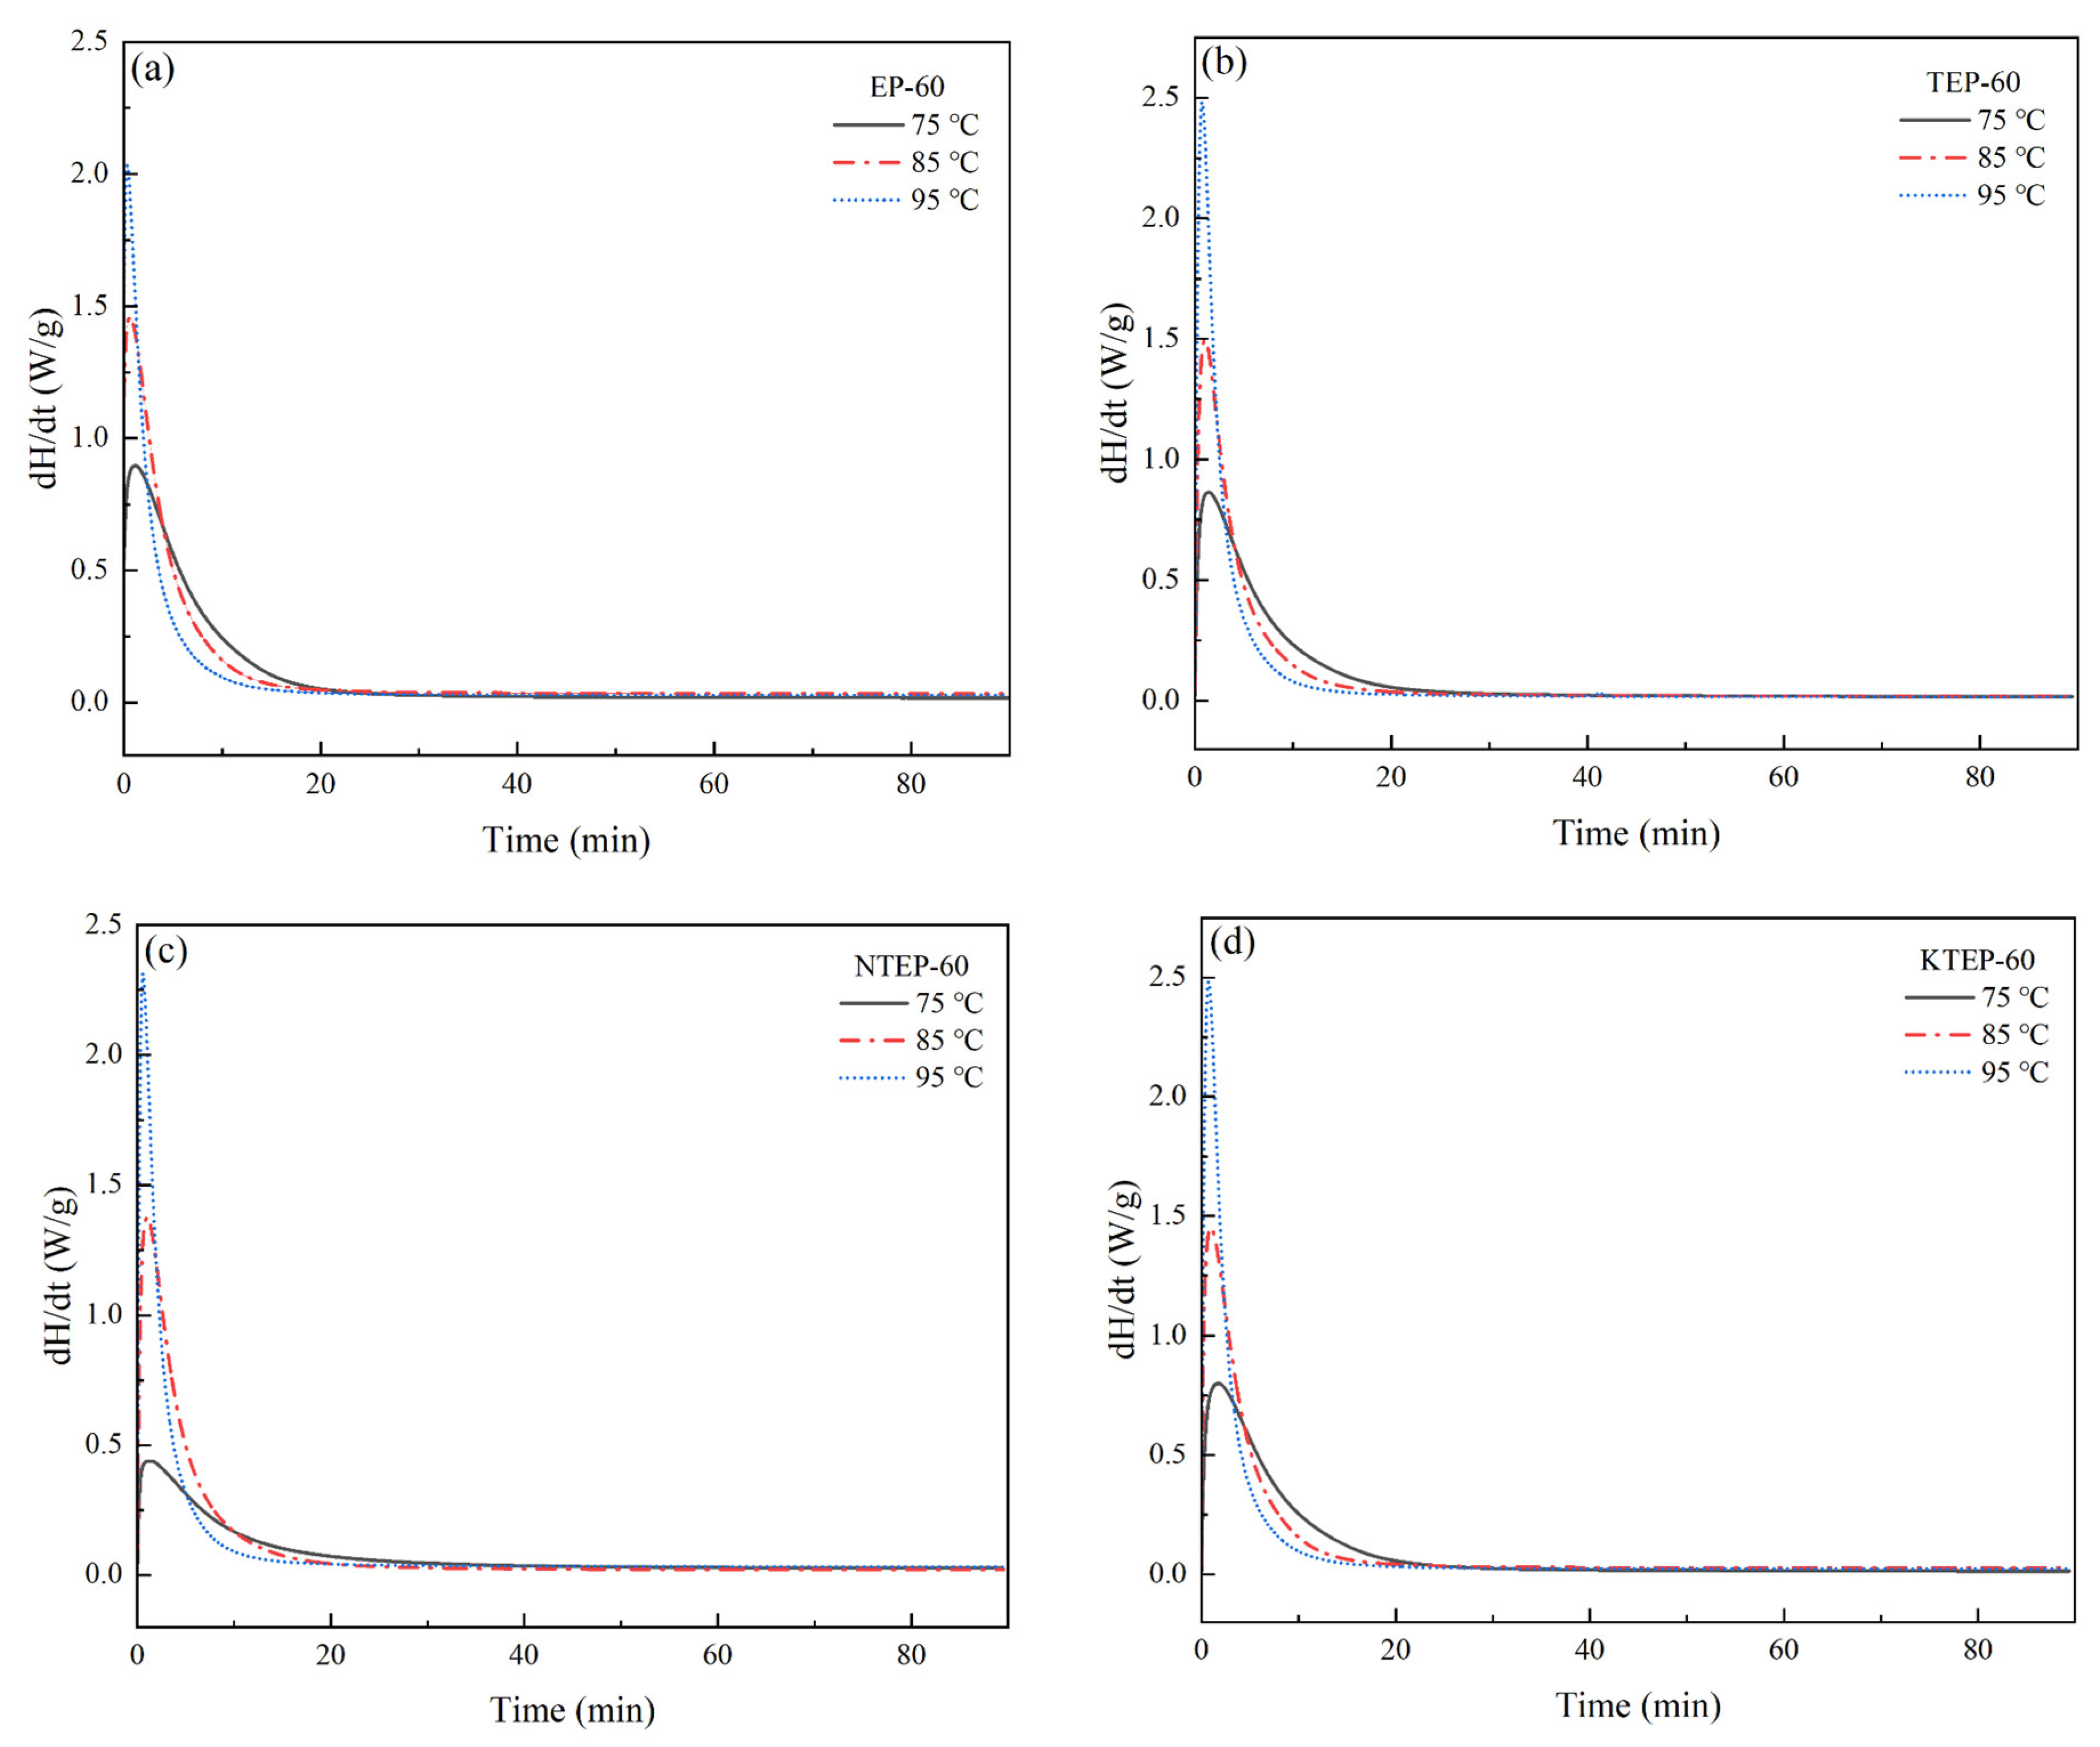
Tp values of the four systems EP-60, TEP-60, NTEP-60, and KTEP-60 were relatively close, considering that the curing conditions of the modified epoxy resin prepolymer were not significantly different from those of the pure epoxy resin prepolymers. We selected 75 °C, 85 °C, and 95 °C as the isothermal curing temperatures of each system, and the isothermal curing curves of the four systems after UV irradiation are shown in
Figure 10. The data in
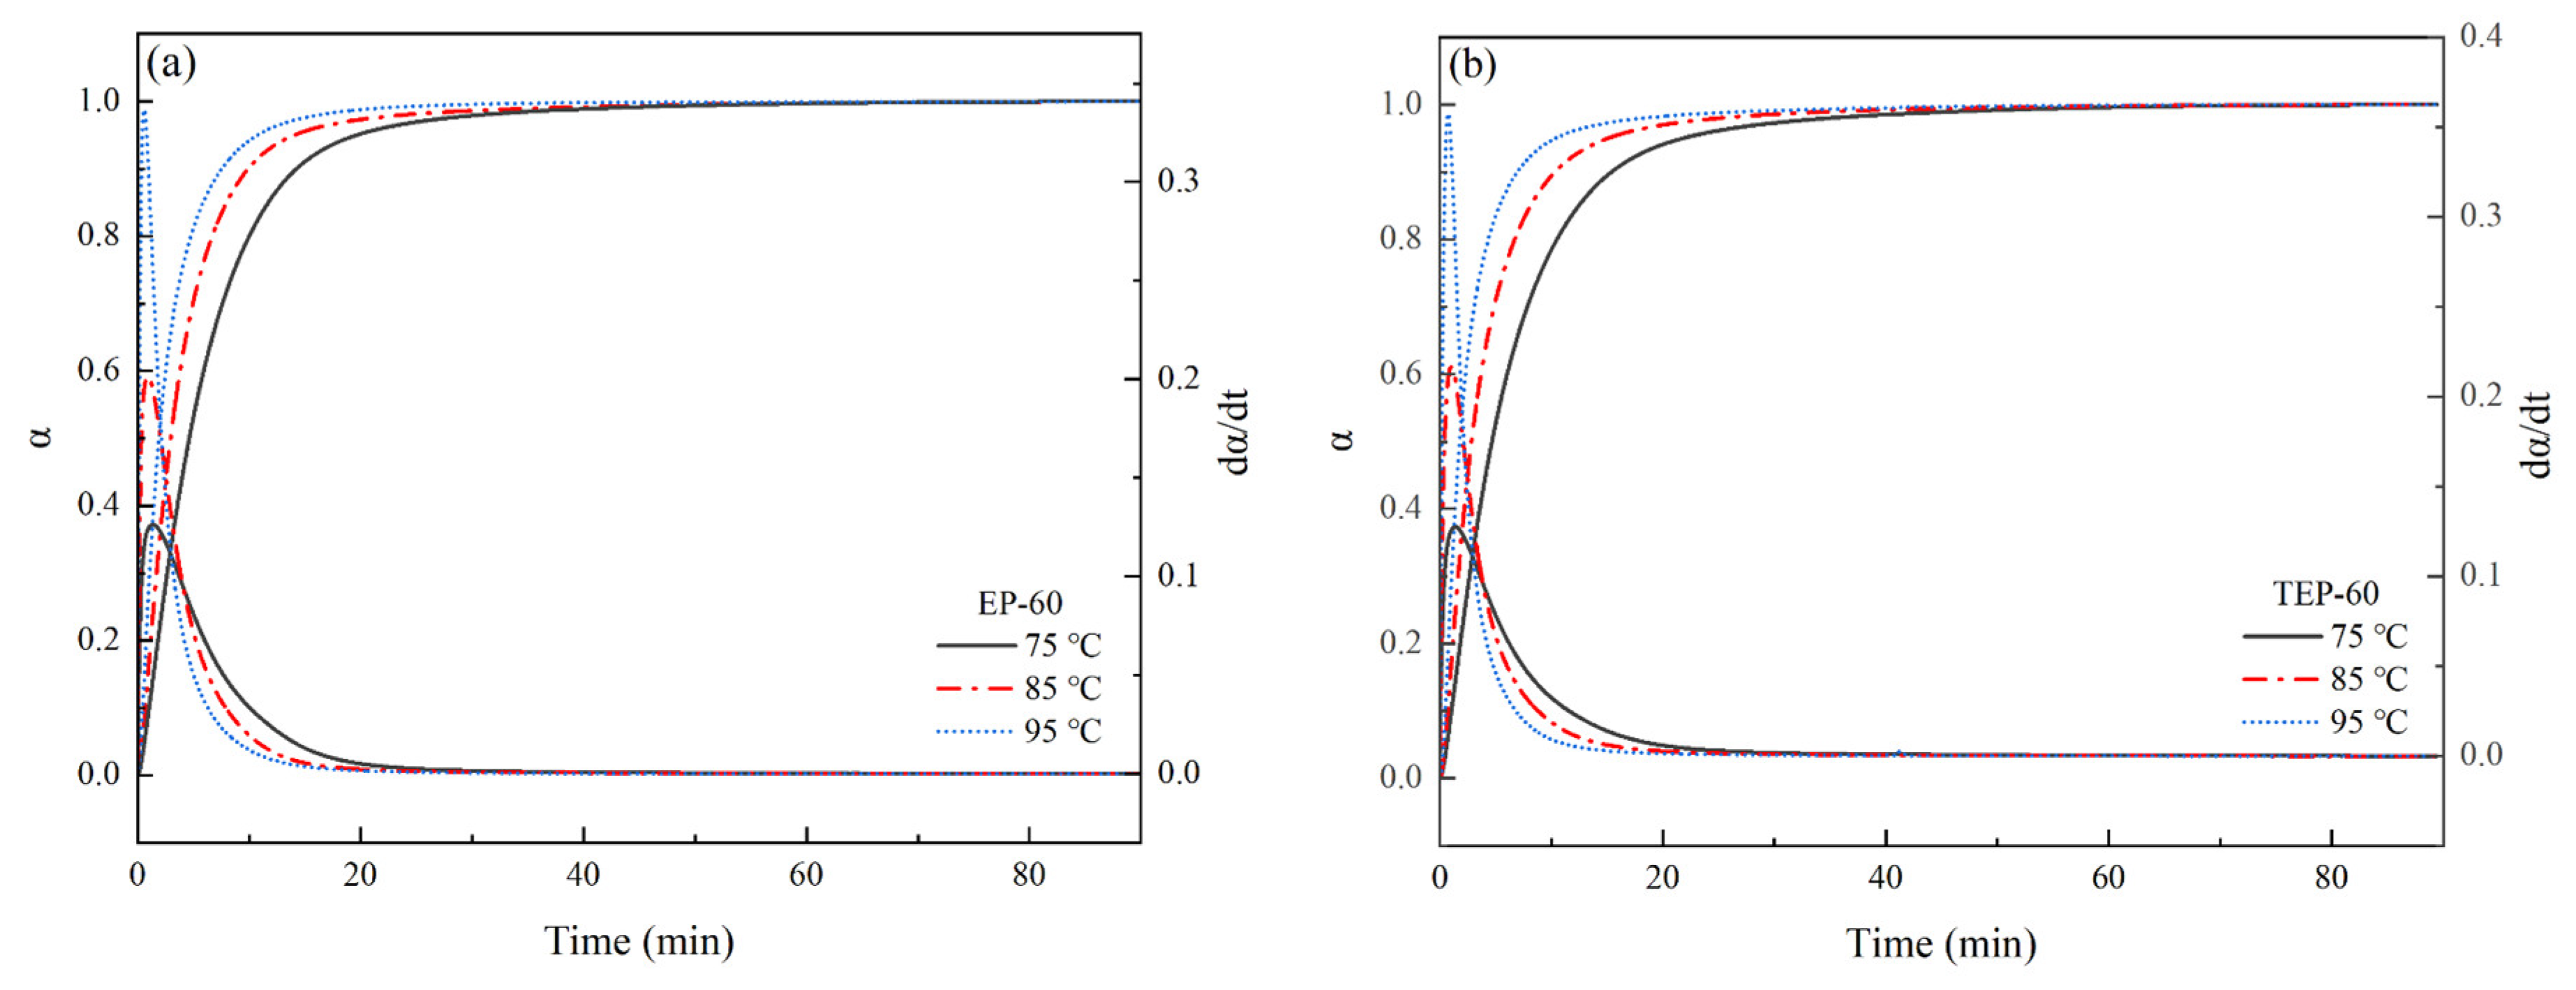
Figure 10 were processed according to Equations (7) and (8), and the relationships of
α–t and
dα/
dt–
t were obtained, respectively, as shown in
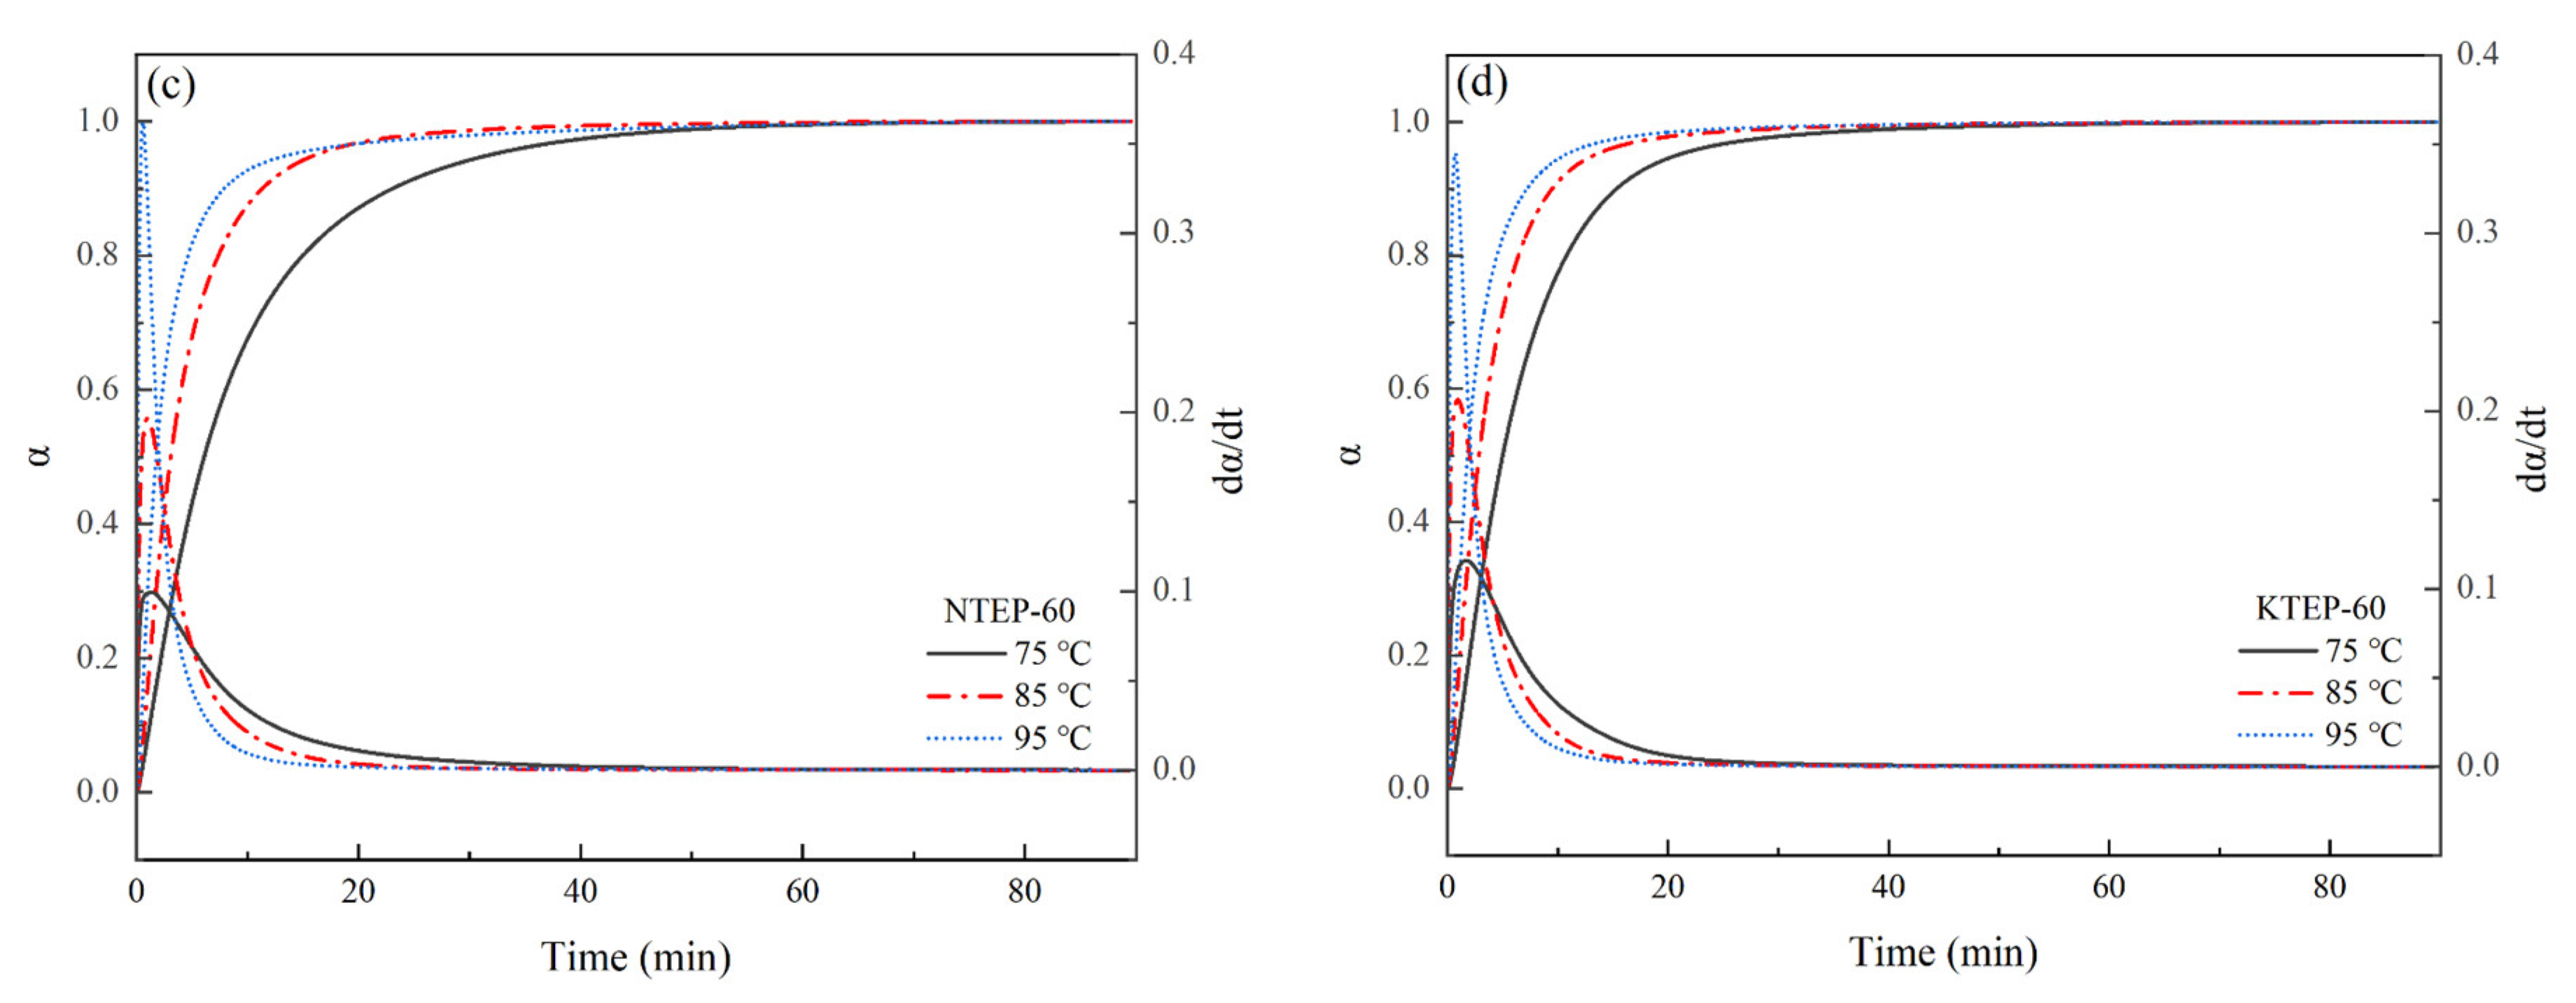
Figure 11.
As shown in
Figure 10 and
Figure 11, the times for each system to reach the maximum curing heat flow rate (
dH/
dt)
max gradually shifted forward with an increase in isothermal curing temperature, and the times required to reach the maximum curing degree
αmax gradually shortened, where the higher the temperature, the higher the chain segment movement rate, the higher the number of epoxy groups and curing agent molecules that participated in the curing reaction, the more intense the cross-linking reaction during the curing process, and the faster the increase in
α. With an increase in the curing degree
α, the viscosity of the system gradually increased, and the movement of the chain segment was hindered. Therefore, the curing rate
dα/
dt of the system gradually decreased after the corresponding time of (
dH/
dt)
max. In addition, the corresponding time of (
dH/
dt)
max was not the time when the normal-temperature curing started, but the period of time after the start of curing, indicating that the relationship between the curing reaction rate
dα/
dt and time
t conformed to the characteristics of the autocatalytic reaction model. The Kamal model is a commonly used model for describing the kinetics of autocatalytic reactions, following the form shown in Equation (9), where
k1 and
k2 denote the rate constants of the reaction, and
m and
n are the stages of the reaction. With the assistance of the Kamal model, the difference between the isothermal curing rate and the curing activation energy of each curing system could be discussed in detail, and the influence of nano-TiO
2 and the coupling agents on the isothermal curing process could be studied. According to the data shown in
Figure 10 and
Figure 11, the
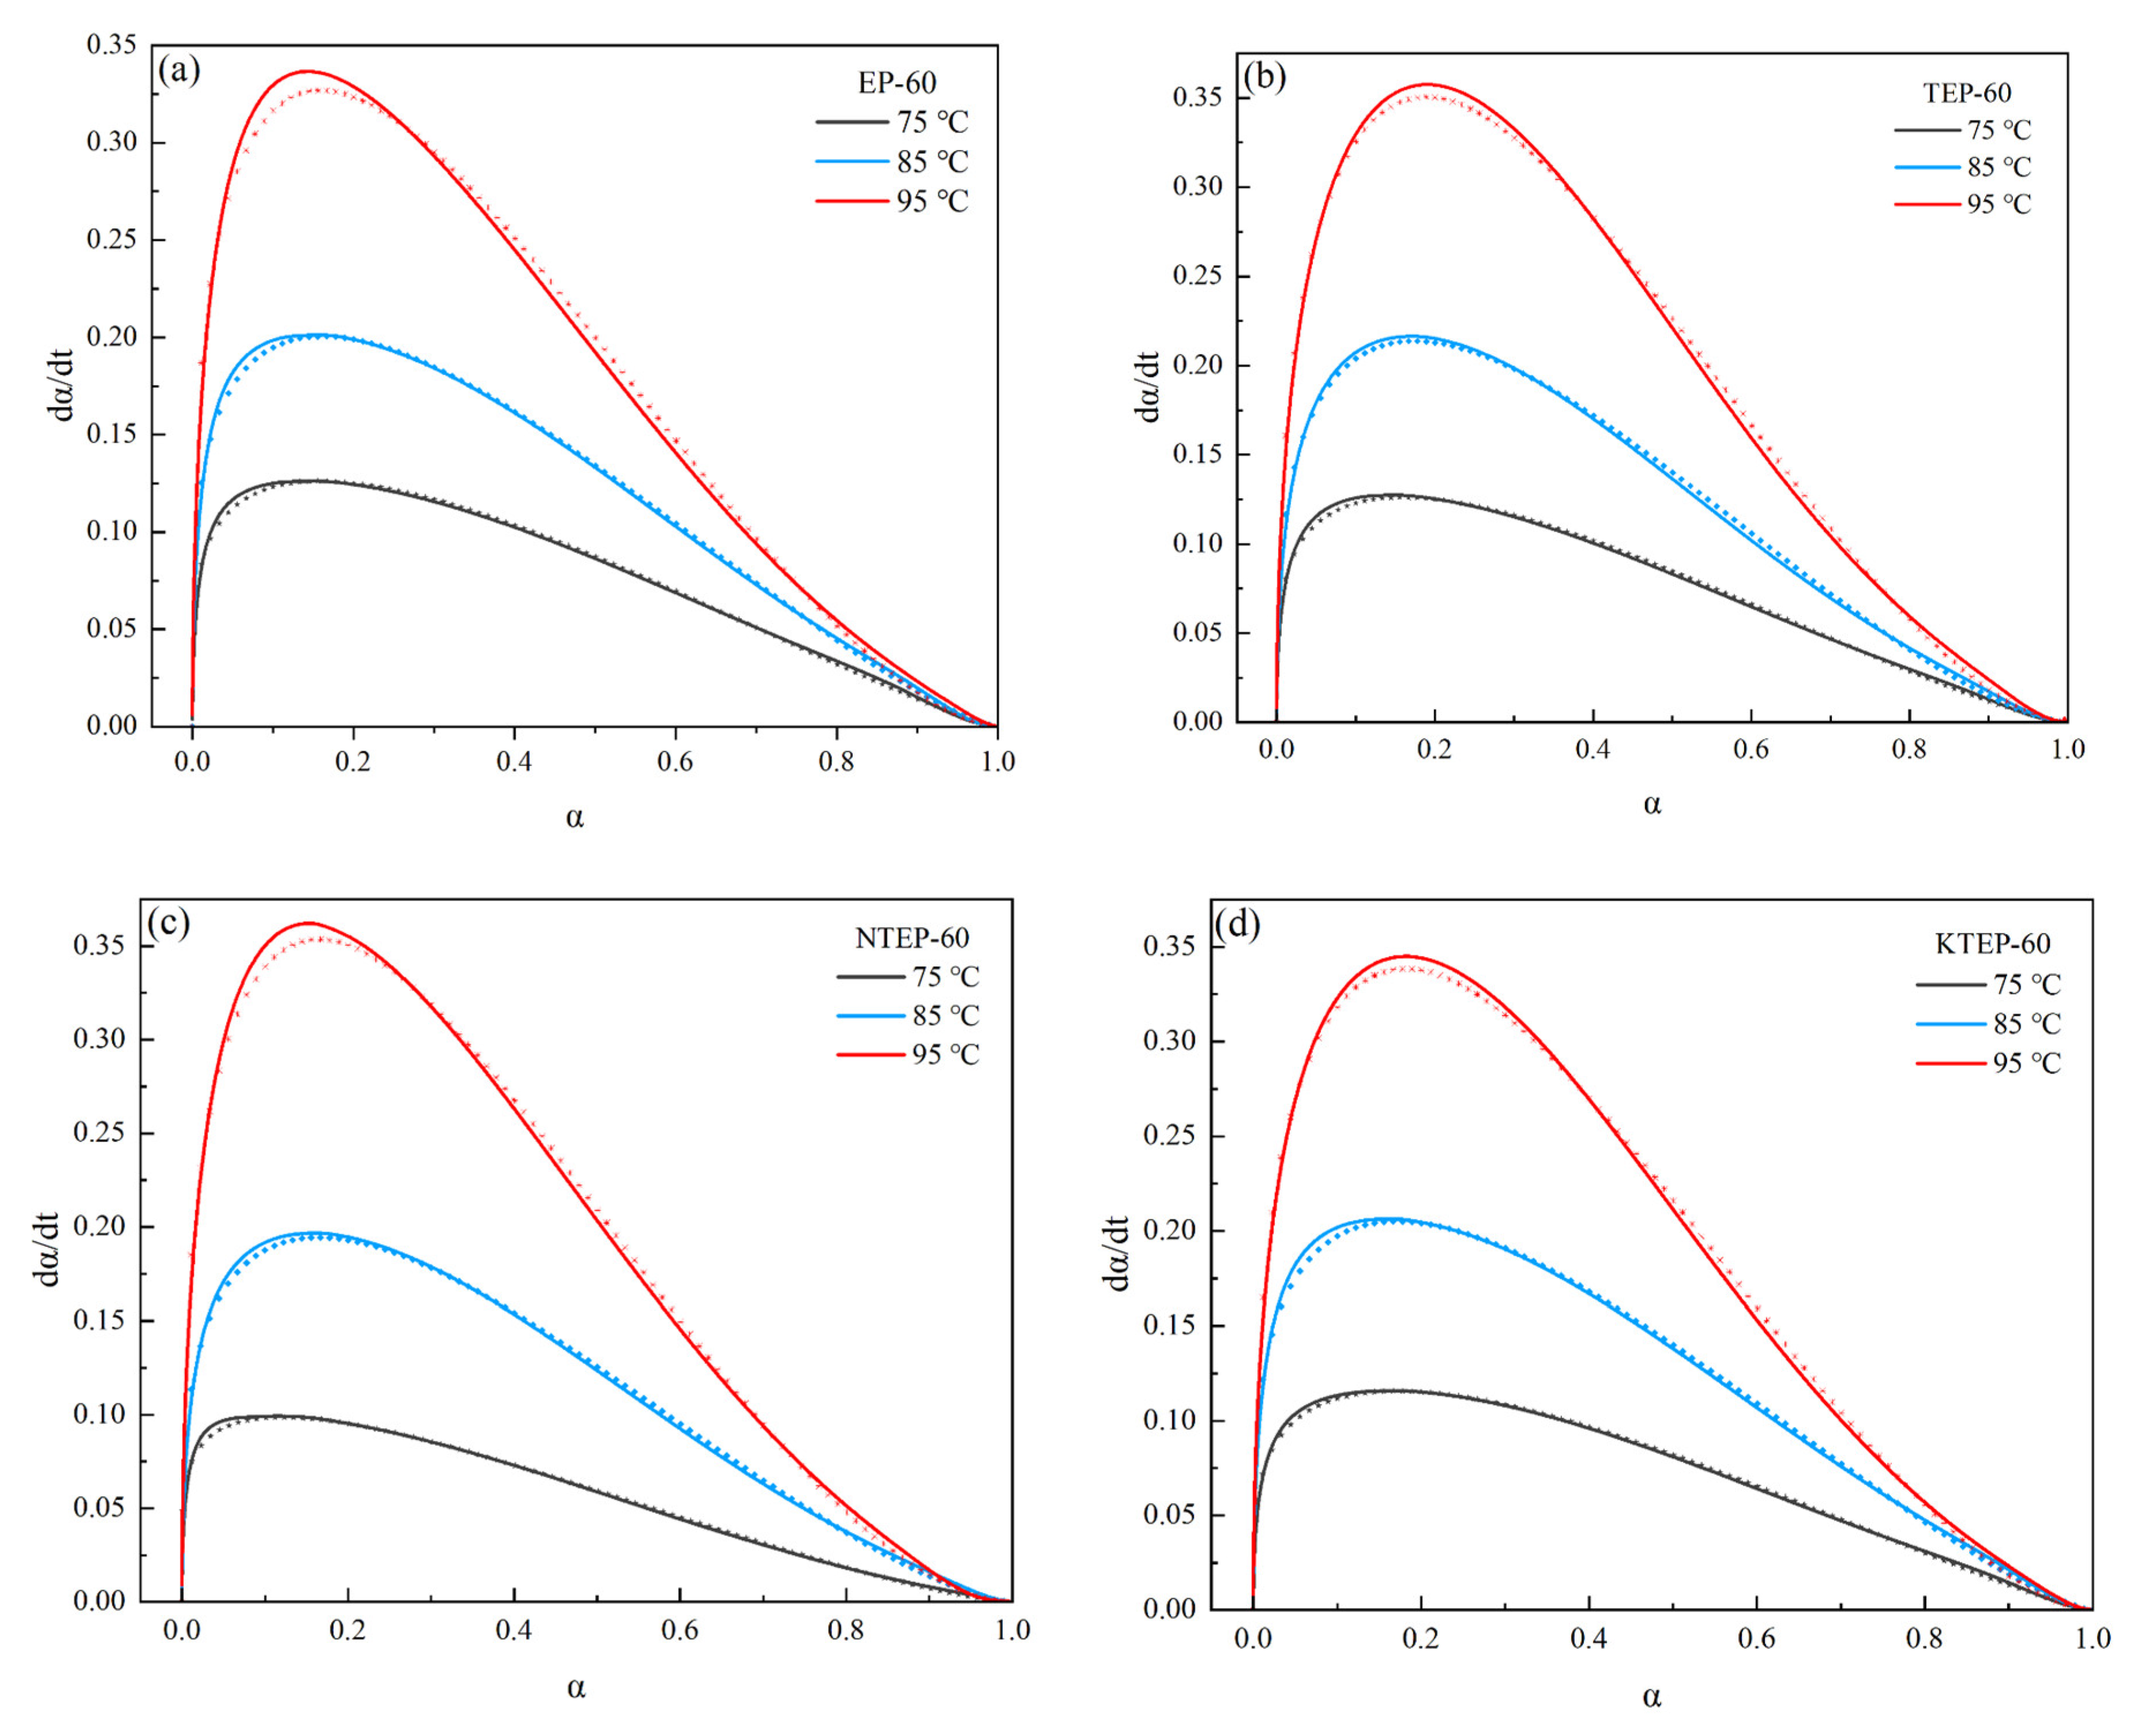
dα/
dt-
α relationships of EP-60, TEP-60, NTEP-60, and KTEP-60 were fitted by curve nonlinear regression. The curves obtained by experimentation (solid lines in the figure) and the fitted curves (dashed lines in the figure) are shown in
Figure 12.
As shown in
Figure 12, the curing reaction rate
dα/
dt increased first with an increase in the curing degree
α, and gradually decreased close to 0 after reaching the maximum, which was in line with the characteristics of an autocatalytic reaction. The fitting results were in high agreement with the experimental results, and the values of the kinetic parameters
k1,
k2,
m, and
n are shown in
Table 3.
As shown in
Table 3,
k1 and
k2 for each system increased significantly with an increase in the reaction temperature, where the higher the temperature, the stronger the chain movement; the greater the number of epoxy groups, initiator molecules, and curing agent molecules that participated in the reaction; and the faster the reaction. Equation (10) can easily be obtained from Equation (9).
Equation (10) shows that
k1 was the curing rate constant when
t = 0, which corresponded to the curing reaction rate of the prepolymer after UV irradiation. As shown in
Table 3, the distribution of
k1 values in the EP-60 system was generally larger than the other three systems containing nano-TiO
2, indicating that nano-TiO
2 had a greater influence on the curing reaction rate as the scattering agent for UV irradiation, compared to the active hydrogen provider, decreasing the curing reaction rate during the initial reaction period. When the key parameter determined the reaction process in the middle and later periods of the autocatalytic reaction [
30], the
k2 of each system was much greater than
k1 at the same curing temperature, indicating that the influence of the autocatalytic reaction rate constant (
k2) on the curing system was much greater than the initial reaction rate constant (
k1). In addition, the distribution of
k2 values in the three systems containing nano-TiO
2 was generally higher than in the EP-60 system. This indicated that nano-TiO
2 had a greater influence on the curing reaction rate as the reaction site and catalyst for the ring-opening reaction, compared to the viscosity enhancer for the epoxy prepolymer, increasing the curing reaction rate more significantly in the middle and later periods of the curing reaction. The distribution of the
k2 values of the TEP-60 system was generally higher than in the two systems containing coupling agents, indicating that the presence of coupling agents had a negative impact on the curing reaction rate of the nano-TiO
2-containing system (the above discussion is based on the isothermal curing reaction temperature in the range of 75–95 °C).
The rate constants
k1 and
k2 of the isothermal curing reaction were affected by temperature and could be described by the Arrhenius equation, as shown in Equation (11), where
A is a constant,
Ea is the activation energy of the reaction,
R = 8.314 J/(mol∙K) is the molar gas constant, and
T is the reaction temperature (measured in K). We took the logarithm of both sides of Equation (11) to obtain Equation (12).
According to Equation (12), the activation energies
Ea1 and
Ea2 corresponding to the reaction rate constants
k1 and
k2 were obtained by plotting the ln
k-1/
T relationship and performing linear regression fitting by OriginPro 2021b, and the results are shown in
Figure 13 and
Table 4. Similar to the definitions of
k1 and
k2 in the curing reaction, the size of
Ea1 reflected the height of the reaction energy barrier of the curing system after UV irradiation, and the size of
Ea2 reflected the height of the reaction energy barrier of the curing system in the middle and later periods of the reaction. The
Ea1 values of the TEP-60, NTEP-60, and KTEP-60 systems were smaller than the EP-60 system, indicating that the addition of nano-TiO
2 reduced the energy barrier of the curing system after UV irradiation because the presence of nano-TiO
2 increased the number of active hydrogen atoms in the system. The
Ea1 value of the NTEP-60 system was smaller than TEP-60, and that of the KTEP-60 system was greater than TEP-60, due to the inconsistency in the number of active hydrogen atoms of the two coupling agents. Compared to EP-60, the
Ea2 values of TEP-60, NTEP-60, and KTEP-60 all increased to varying degrees. The order of
Ea2 values for the four systems was consistent with the order of relative viscosity of the systems in
Figure 8, indicating that the
Ea2 for each system was mainly related to the viscosity of the prepolymer. Based on the above results, nano-TiO
2 and the coupling agents reduced the energy barrier of the curing reaction of the system after UV irradiation and improved the energy barrier in the middle and later periods of the curing reaction. Therefore, to improve the curing efficiency in the actual production process, the curing temperatures of the epoxy resin prepolymers containing nano-TiO
2 and the coupling agents were slightly higher than the pure epoxy resin prepolymers.
3.3. Characterization of the TiO2/Epoxy Resin Composites
To study the influence of different components on the microstructure of the composites, the fracture surfaces of the three composite materials TEP-60, NTEP-60, and KTEP-60 were observed by scanning electron microscopy (from the perspective of fixed irradiation time as a variable and ensuring the success rate of material preparation, the UV irradiation time of each composite material was 60 s per cycle), and the results are shown in
Figure 14.
The white dots on the surfaces were nano-TiO
2. We found that the phenomenon of particle agglomeration in TEP-60 was significantly more serious, with more even particle distributions in NTEP-60 and KTEP-60. According to the crack nailing theory [
31], the solid rigid nanoparticles played the role of nailing points, increasing the energy required for crack propagation during the crack propagation process inside the composite, resulting in the improved mechanical properties of the materials. The stress of crack propagation mainly depended on the particle size and the distance between the particles inside the composite. Compared to the evenly dispersed nano-TiO
2 particles, agglomerated nano-TiO
2 particles showed larger particle cluster spacing, which was more conducive to crack propagation. As a result, the crack propagation resistance of the TEP-60 composite material was poor.
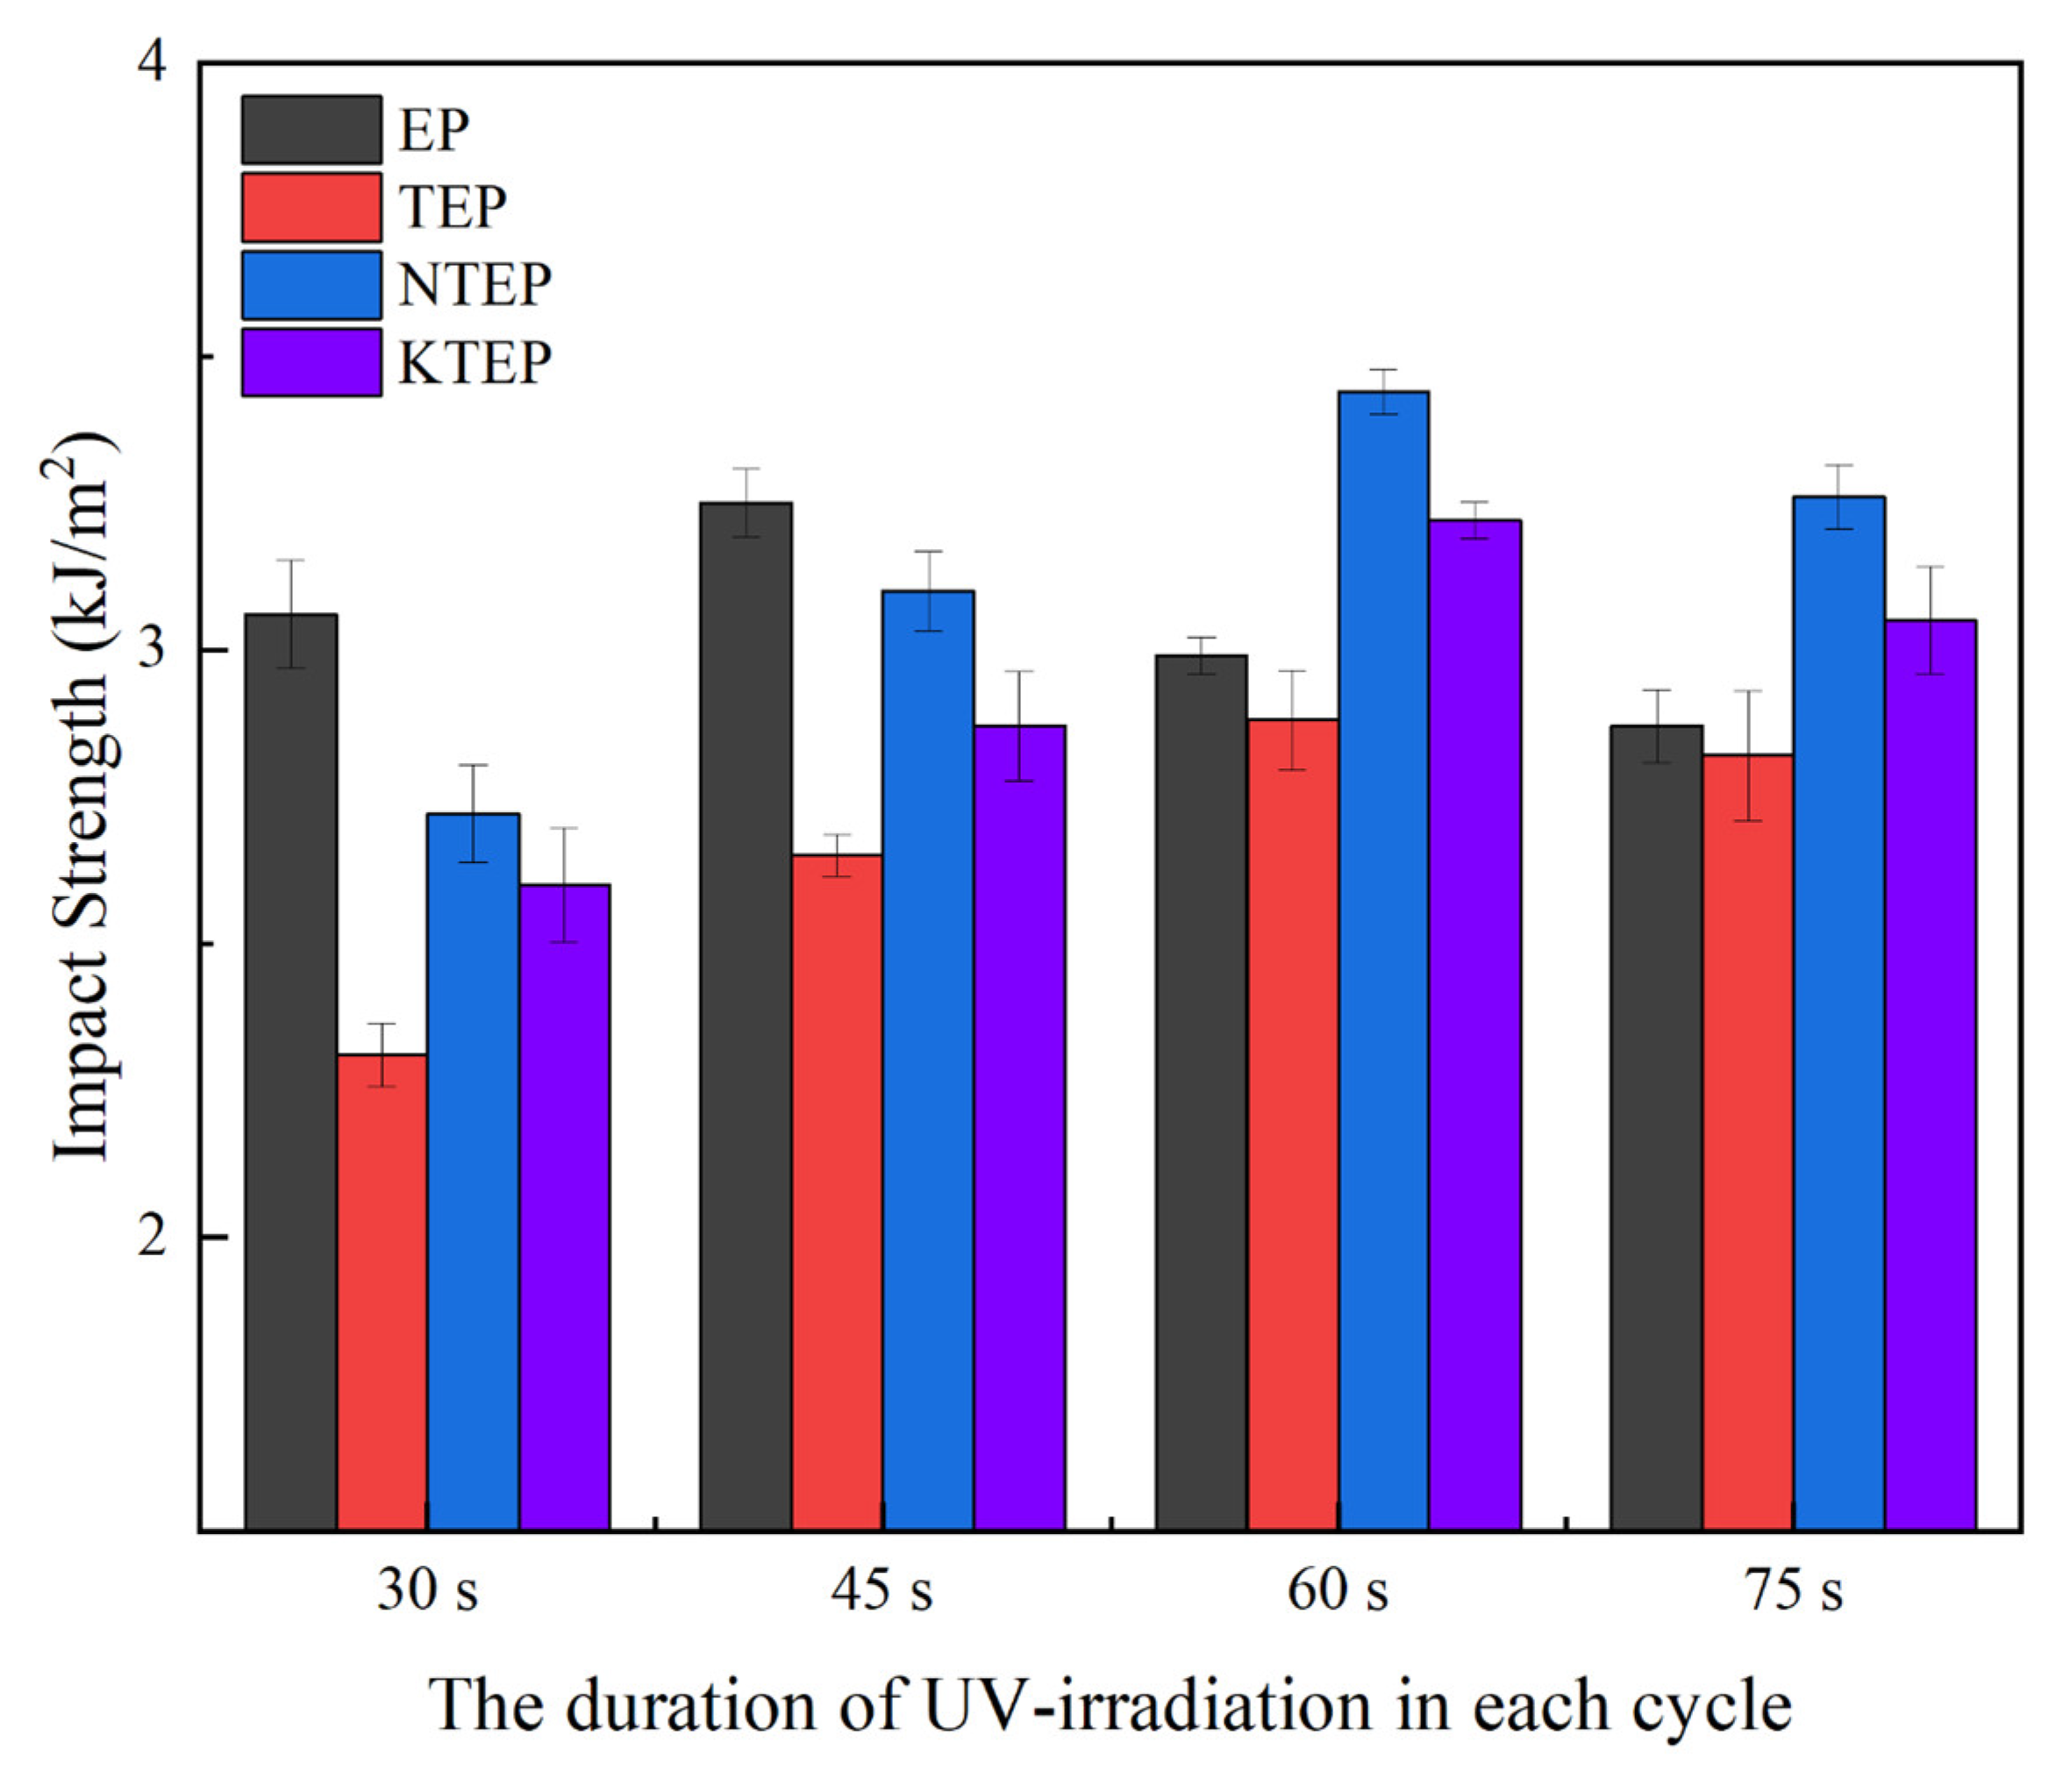
Figure 15 shows the impact strengths of the four systems of the composite materials made under different UV irradiation conditions. The impact strength of each composite material system first increased and then decreased with an increase in irradiation time. There was a small number of cross-linking points in the curing system with insufficient UV irradiation, and the cross-linking degree of the sample was low after curing, resulting in poor toughness of the material, which manifested as low impact strength. With an increase in irradiation time, the degree of the yellowing of the cured composites increased, as shown in
Figure 16. In the TEP-75 sample, the bisphenol A structure of the material was oxidized, producing carbonyl groups, and the free triethylenetetramine molecules (functioning as the curing agent originally) were directly polymerized with the epoxy resin. The polymer chains were partially damaged in this sample, and as a result, the curing efficiency of the curing agent decreased. In addition, the curing reaction of the photoinitiator was too fast with an increase in irradiation time, and the heat accumulation of the system increased significantly, which was not conducive to the formation of a regular internal structure in the composite material.
In the EP system, EP-45 showed the greatest property impact, while the systems with nano-TiO
2, X-60 (X = TEP, NTEP, and KTEP), had the largest impact strength. The maximum impact strength of the system containing nano-TiO
2 corresponded to 1/3 more irradiation time than the EP system, because nano-TiO
2 in the composite matrix decreased the utilization efficiency of the photo-initiator for UV irradiation as a scattering agent. The impact strength of the TEP system was significantly lower than the other systems. As shown in
Figure 14, the average particle size of nano-TiO
2 in TEP was relatively larger, with an obvious agglomeration of the particles in the matrix. The agglomeration of particles not only weakened the resistance to crack propagation of the composites but also reduced the number of reaction sites in the curing system, resulting in a decline in the cross-linking degree of the system and an increase in the stress concentration degree within the material when impacted. Compared to the TEP system, the average particle size of the nanoparticles in the systems containing coupling agents was smaller, with better dispersion of particles in the matrix, so the composite had a larger cross-linking degree and higher impact strength. The impact strength of the NTEP system was slightly higher than the KTEP system, due to the different molecular structures between the two coupling agents. The lipophilic end of the KH-560 molecule was the epoxy group, which was relatively rigid, while the lipophilic end of the NDZ-201 molecule was the –C
8H
17 group, which was relatively flexible. The rigid groups exhibited a poor ability to disperse the impact energy through chain segment motion compared to the flexible groups.
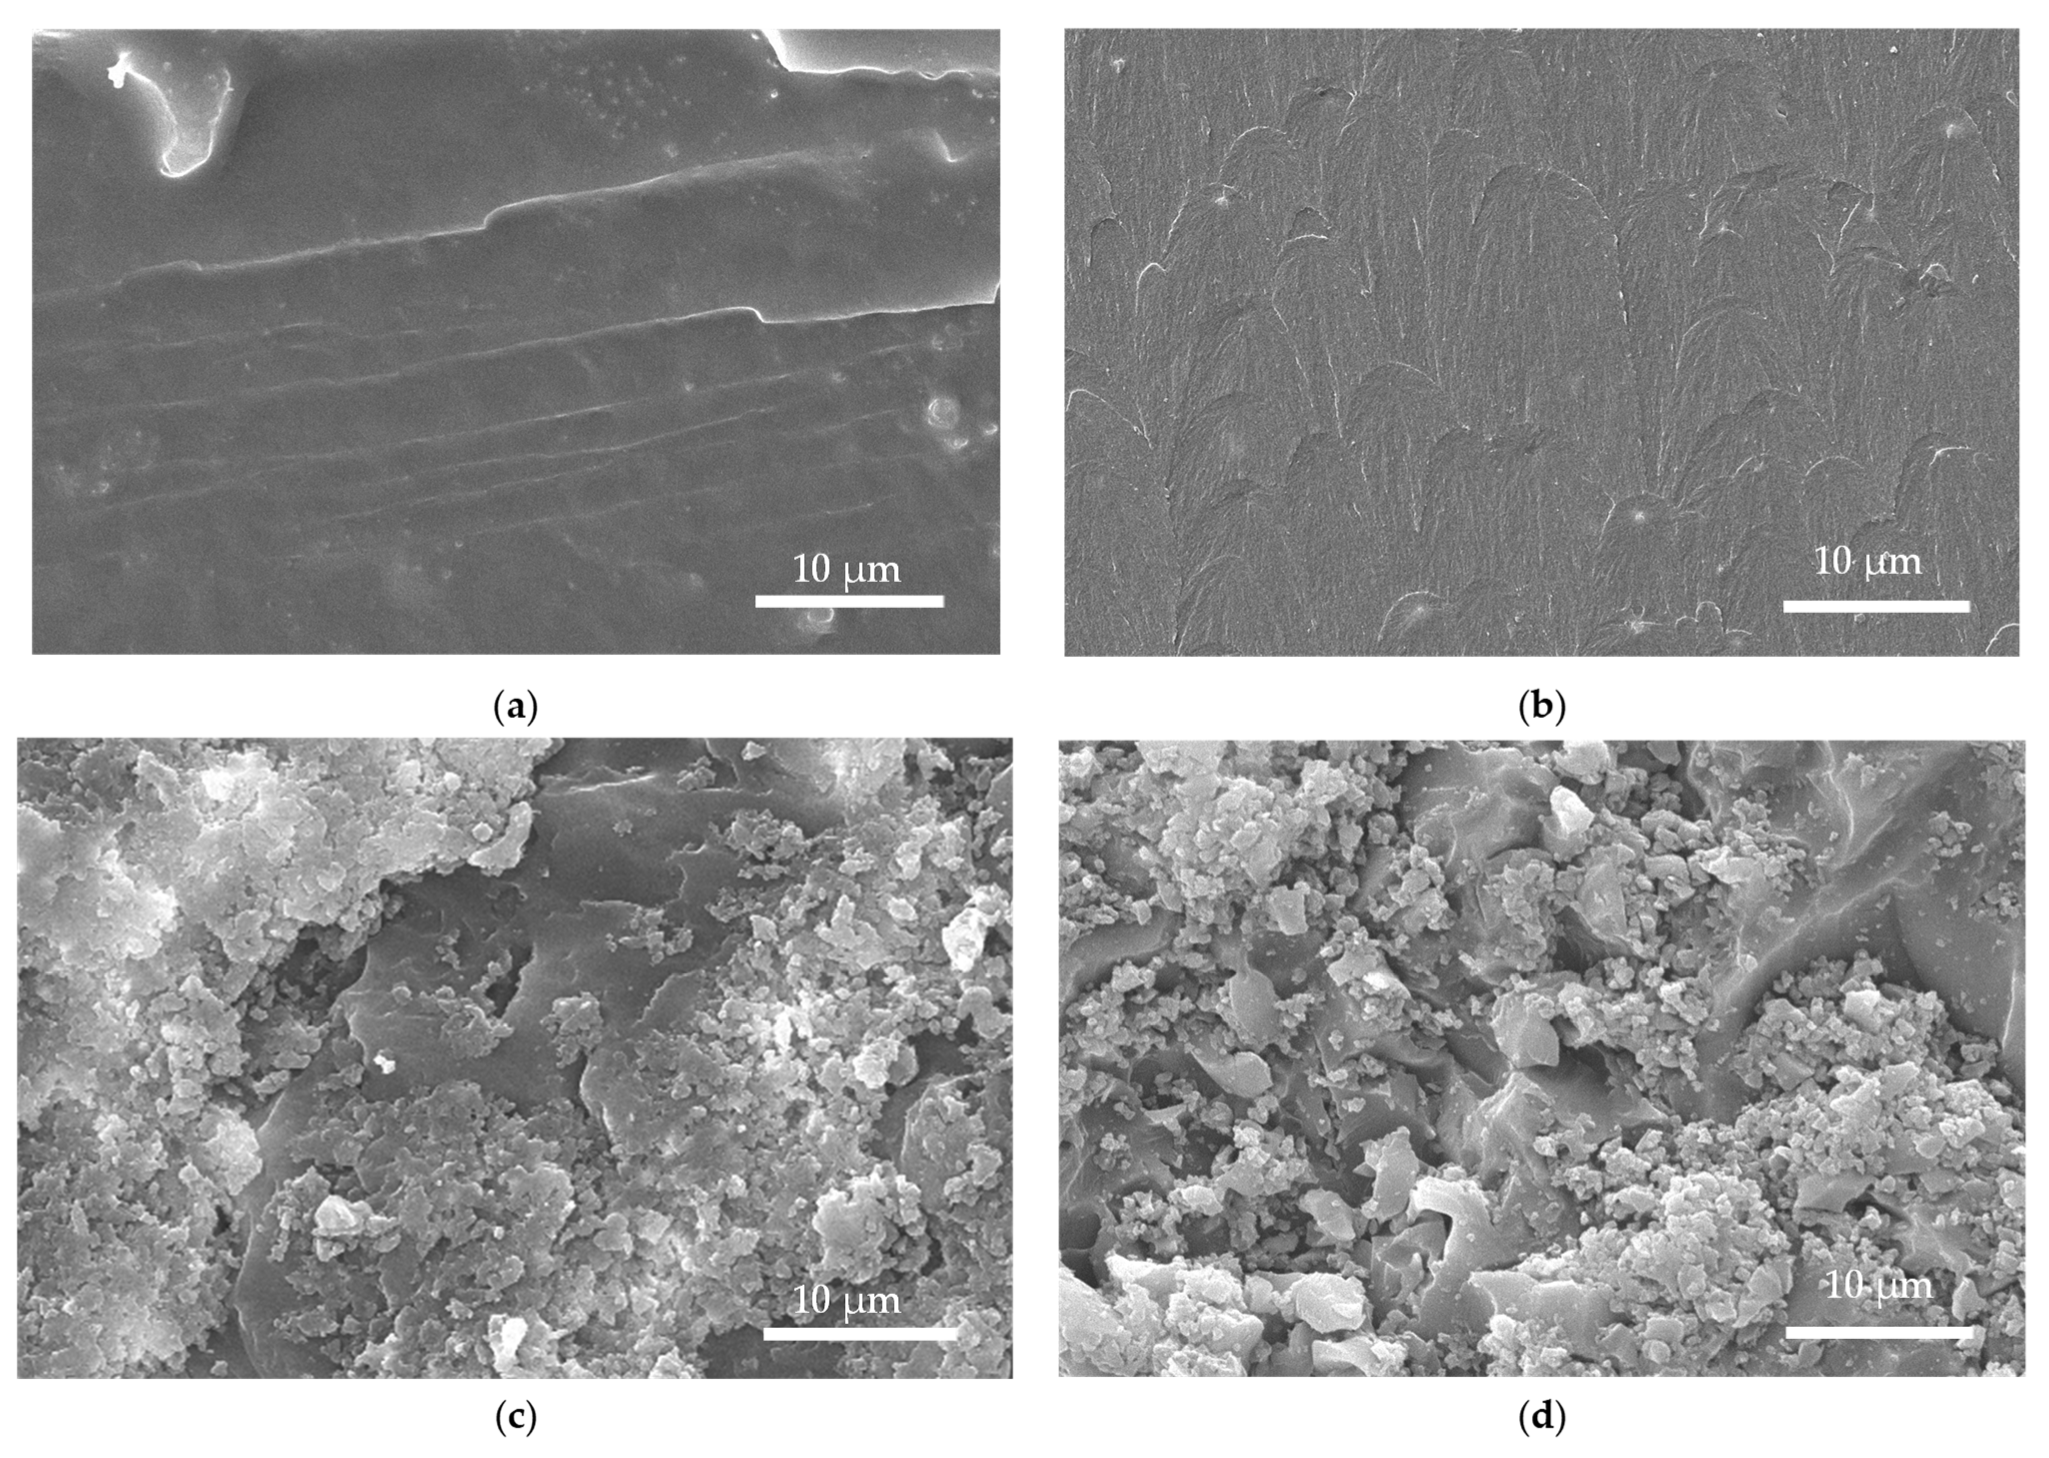
Figure 17 shows the morphologies of the impact fracture surfaces of the X-60 (X = EP, TEP, NTEP, and KTEP) composite splines, where the fracture surfaces of EP-60 and TEP-60 were relatively smooth, reflecting obvious brittle fracture characteristics.
Meanwhile, the fracture surfaces of NTEP-60 and KTEP-60 were much rougher, reflecting certain ductile fracture characteristics and greater fracture energy compared to EP-60 and TEP-60. As indicated by the discussion in this section, NDZ-201 imparted more toughness on the composites than KH-560, and among all the composites, NTEP-60 had the highest impact strength.
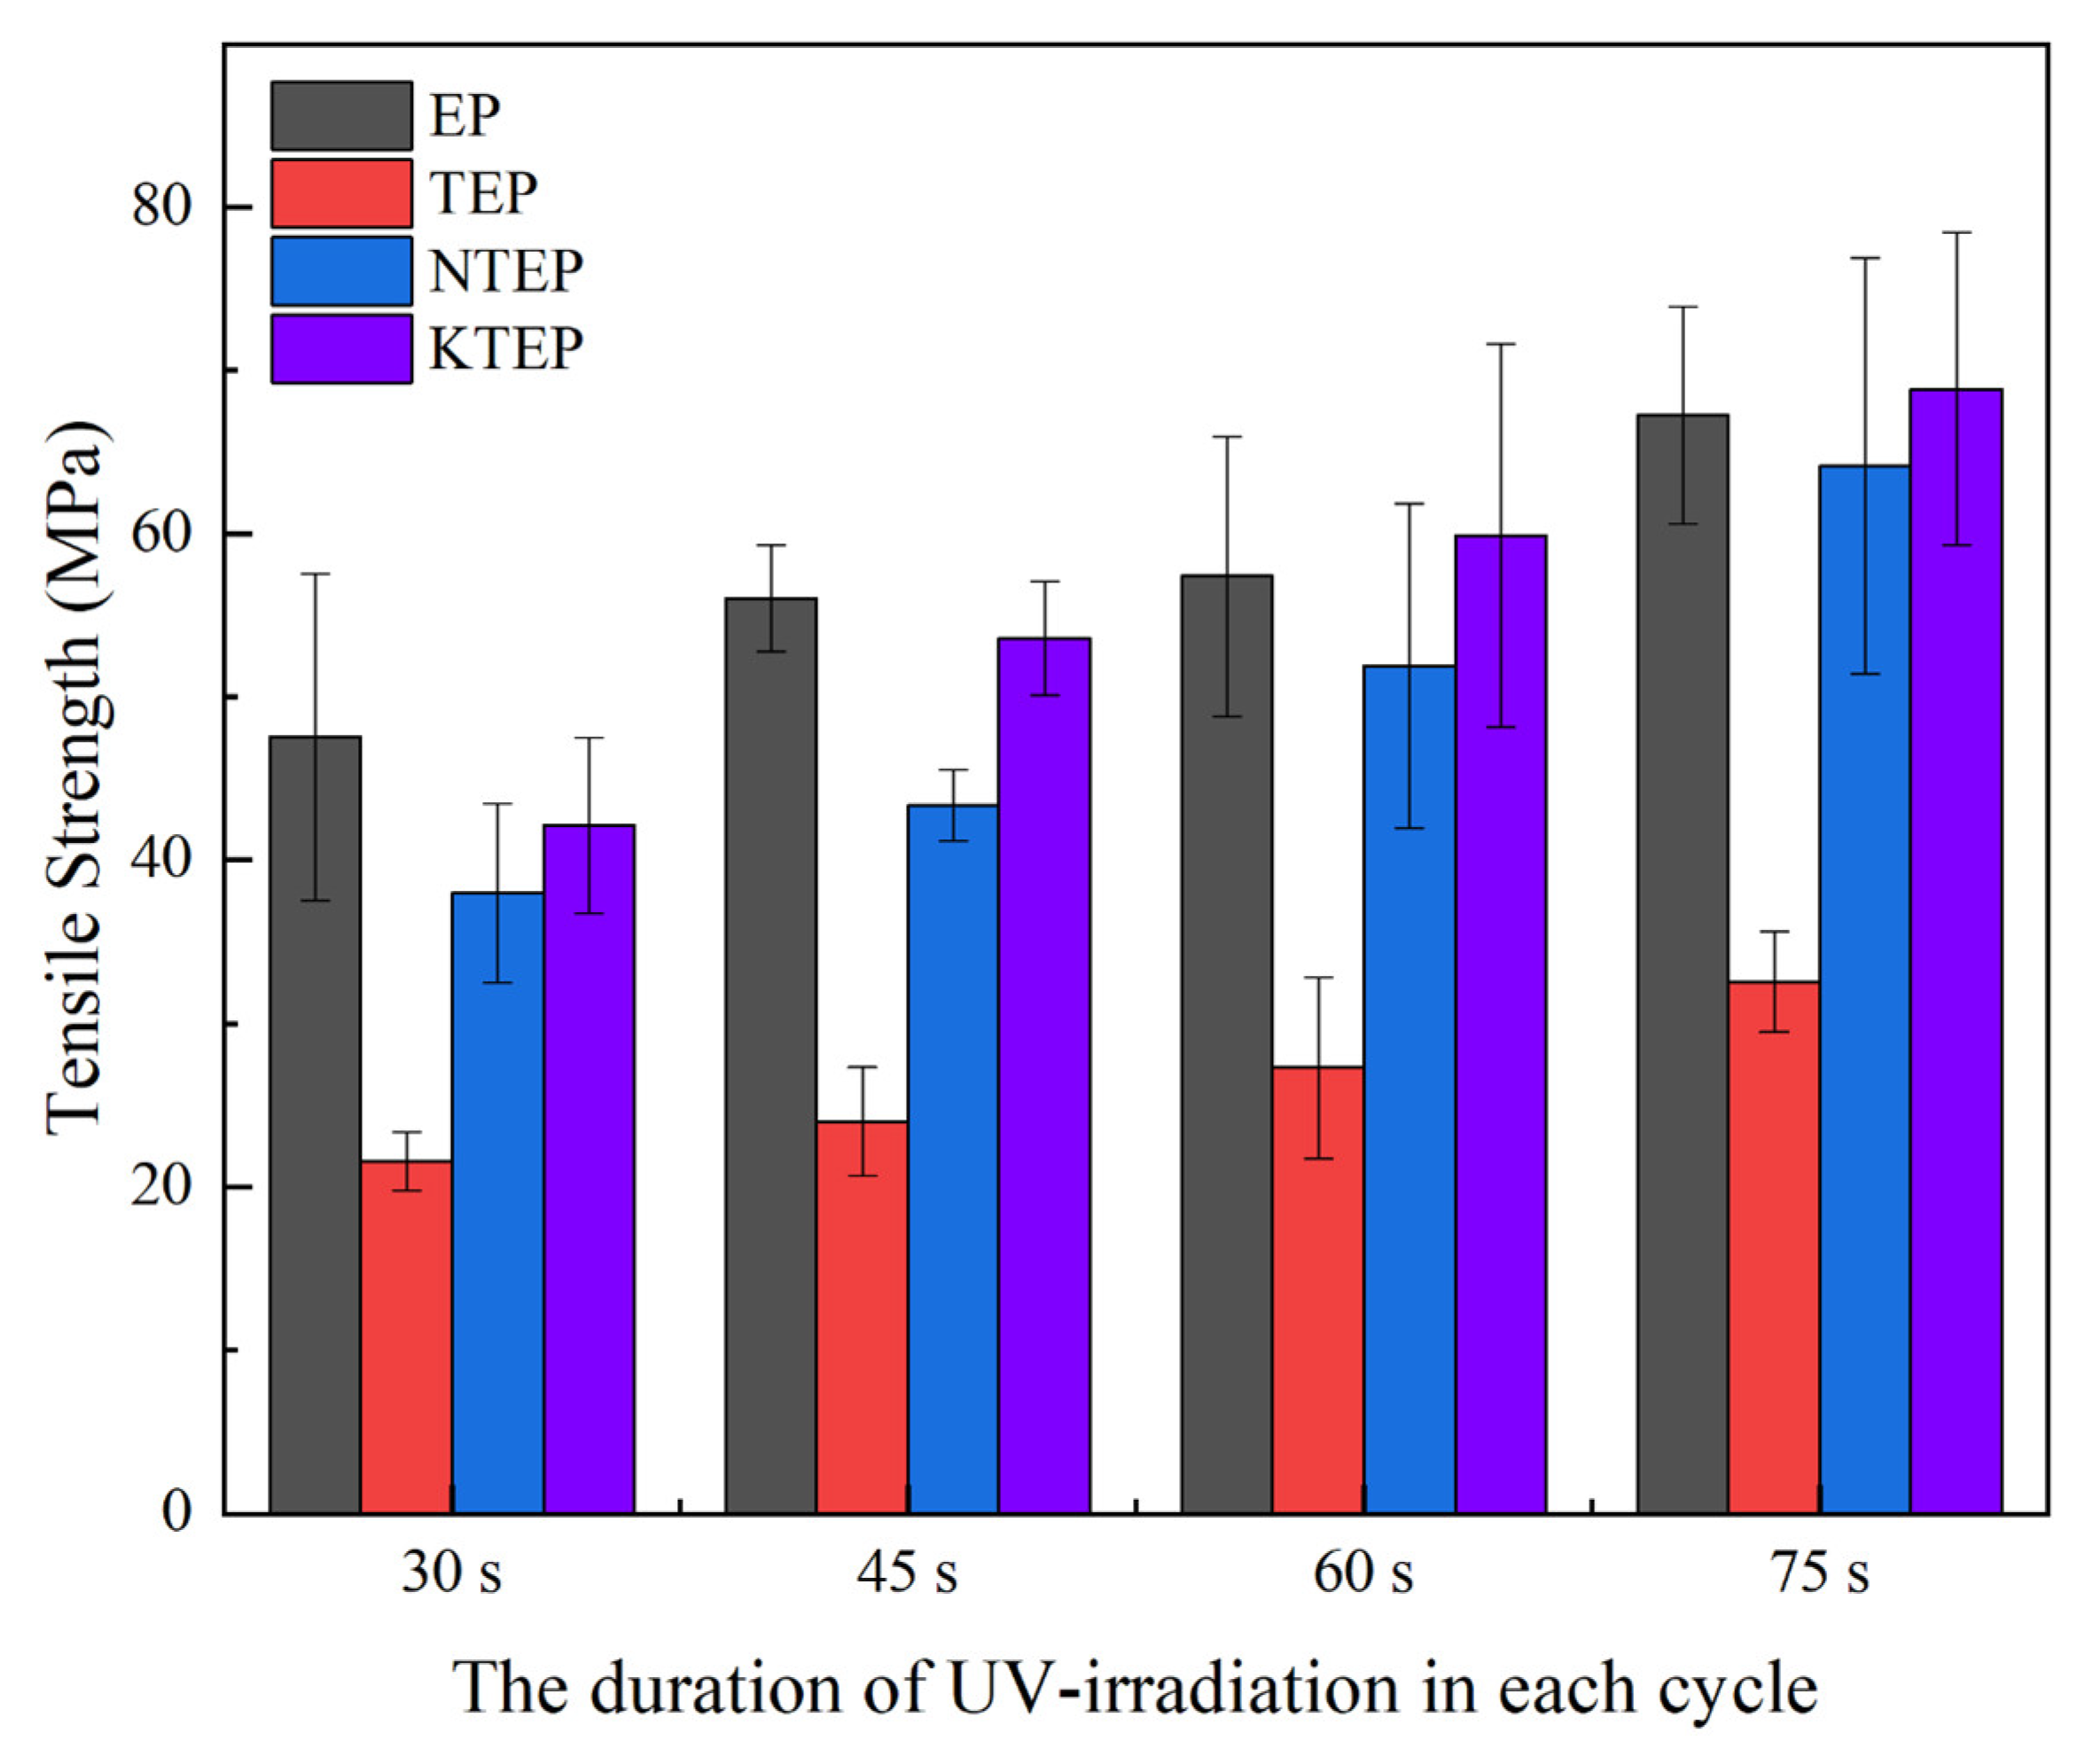
Figure 18 shows the tensile strengths (breaking strengths) of the composite materials composed of the four systems under different UV irradiation conditions. The tensile strengths of the composites of each system increased with an increase in the irradiation time, where the longer the irradiation time, the higher the proportion of cross-links among the epoxy resin polymer chains in the composites. The polymer chains were mainly connected by –CH
2O–bonds in the UV irradiation reaction, which had a stronger rigidity, while the polymer chains were mainly connected by –CH
2–N(R)–CH
2– in the normal-temperature curing reaction, which had a weaker rigidity. Therefore, the longer the irradiation time, the greater the rigidity of the composite material. Due to its low cross-linking degree, the tensile strength of the TEP system was significantly lower than the other systems. With an increase in irradiation time, the leading amplitude in tensile strength of the EP system was gradually reduced or even surpassed the system containing coupling agents, due to the increase in irradiation time, which caused damage to the polymer chain, as it improved the rigidity of the connection between the polymer chains. Due to the scattering effect of nano-TiO
2 under UV irradiation, the systems containing nano-TiO
2 were more resistant to excessive irradiation, indicating that the degree of damage among these polymer chains was smaller. Due to the smaller particle size of KH-560-modified nano-TiO
2, the KTEP curing system had more reaction sites and a greater cross-linking degree. Therefore, the tensile strength of the KTEP system was greater than the NTEP system. In addition, the KH-560 molecule contained an epoxy group, which was relatively rigid and improved the ability of the polymer chain to resist traction.
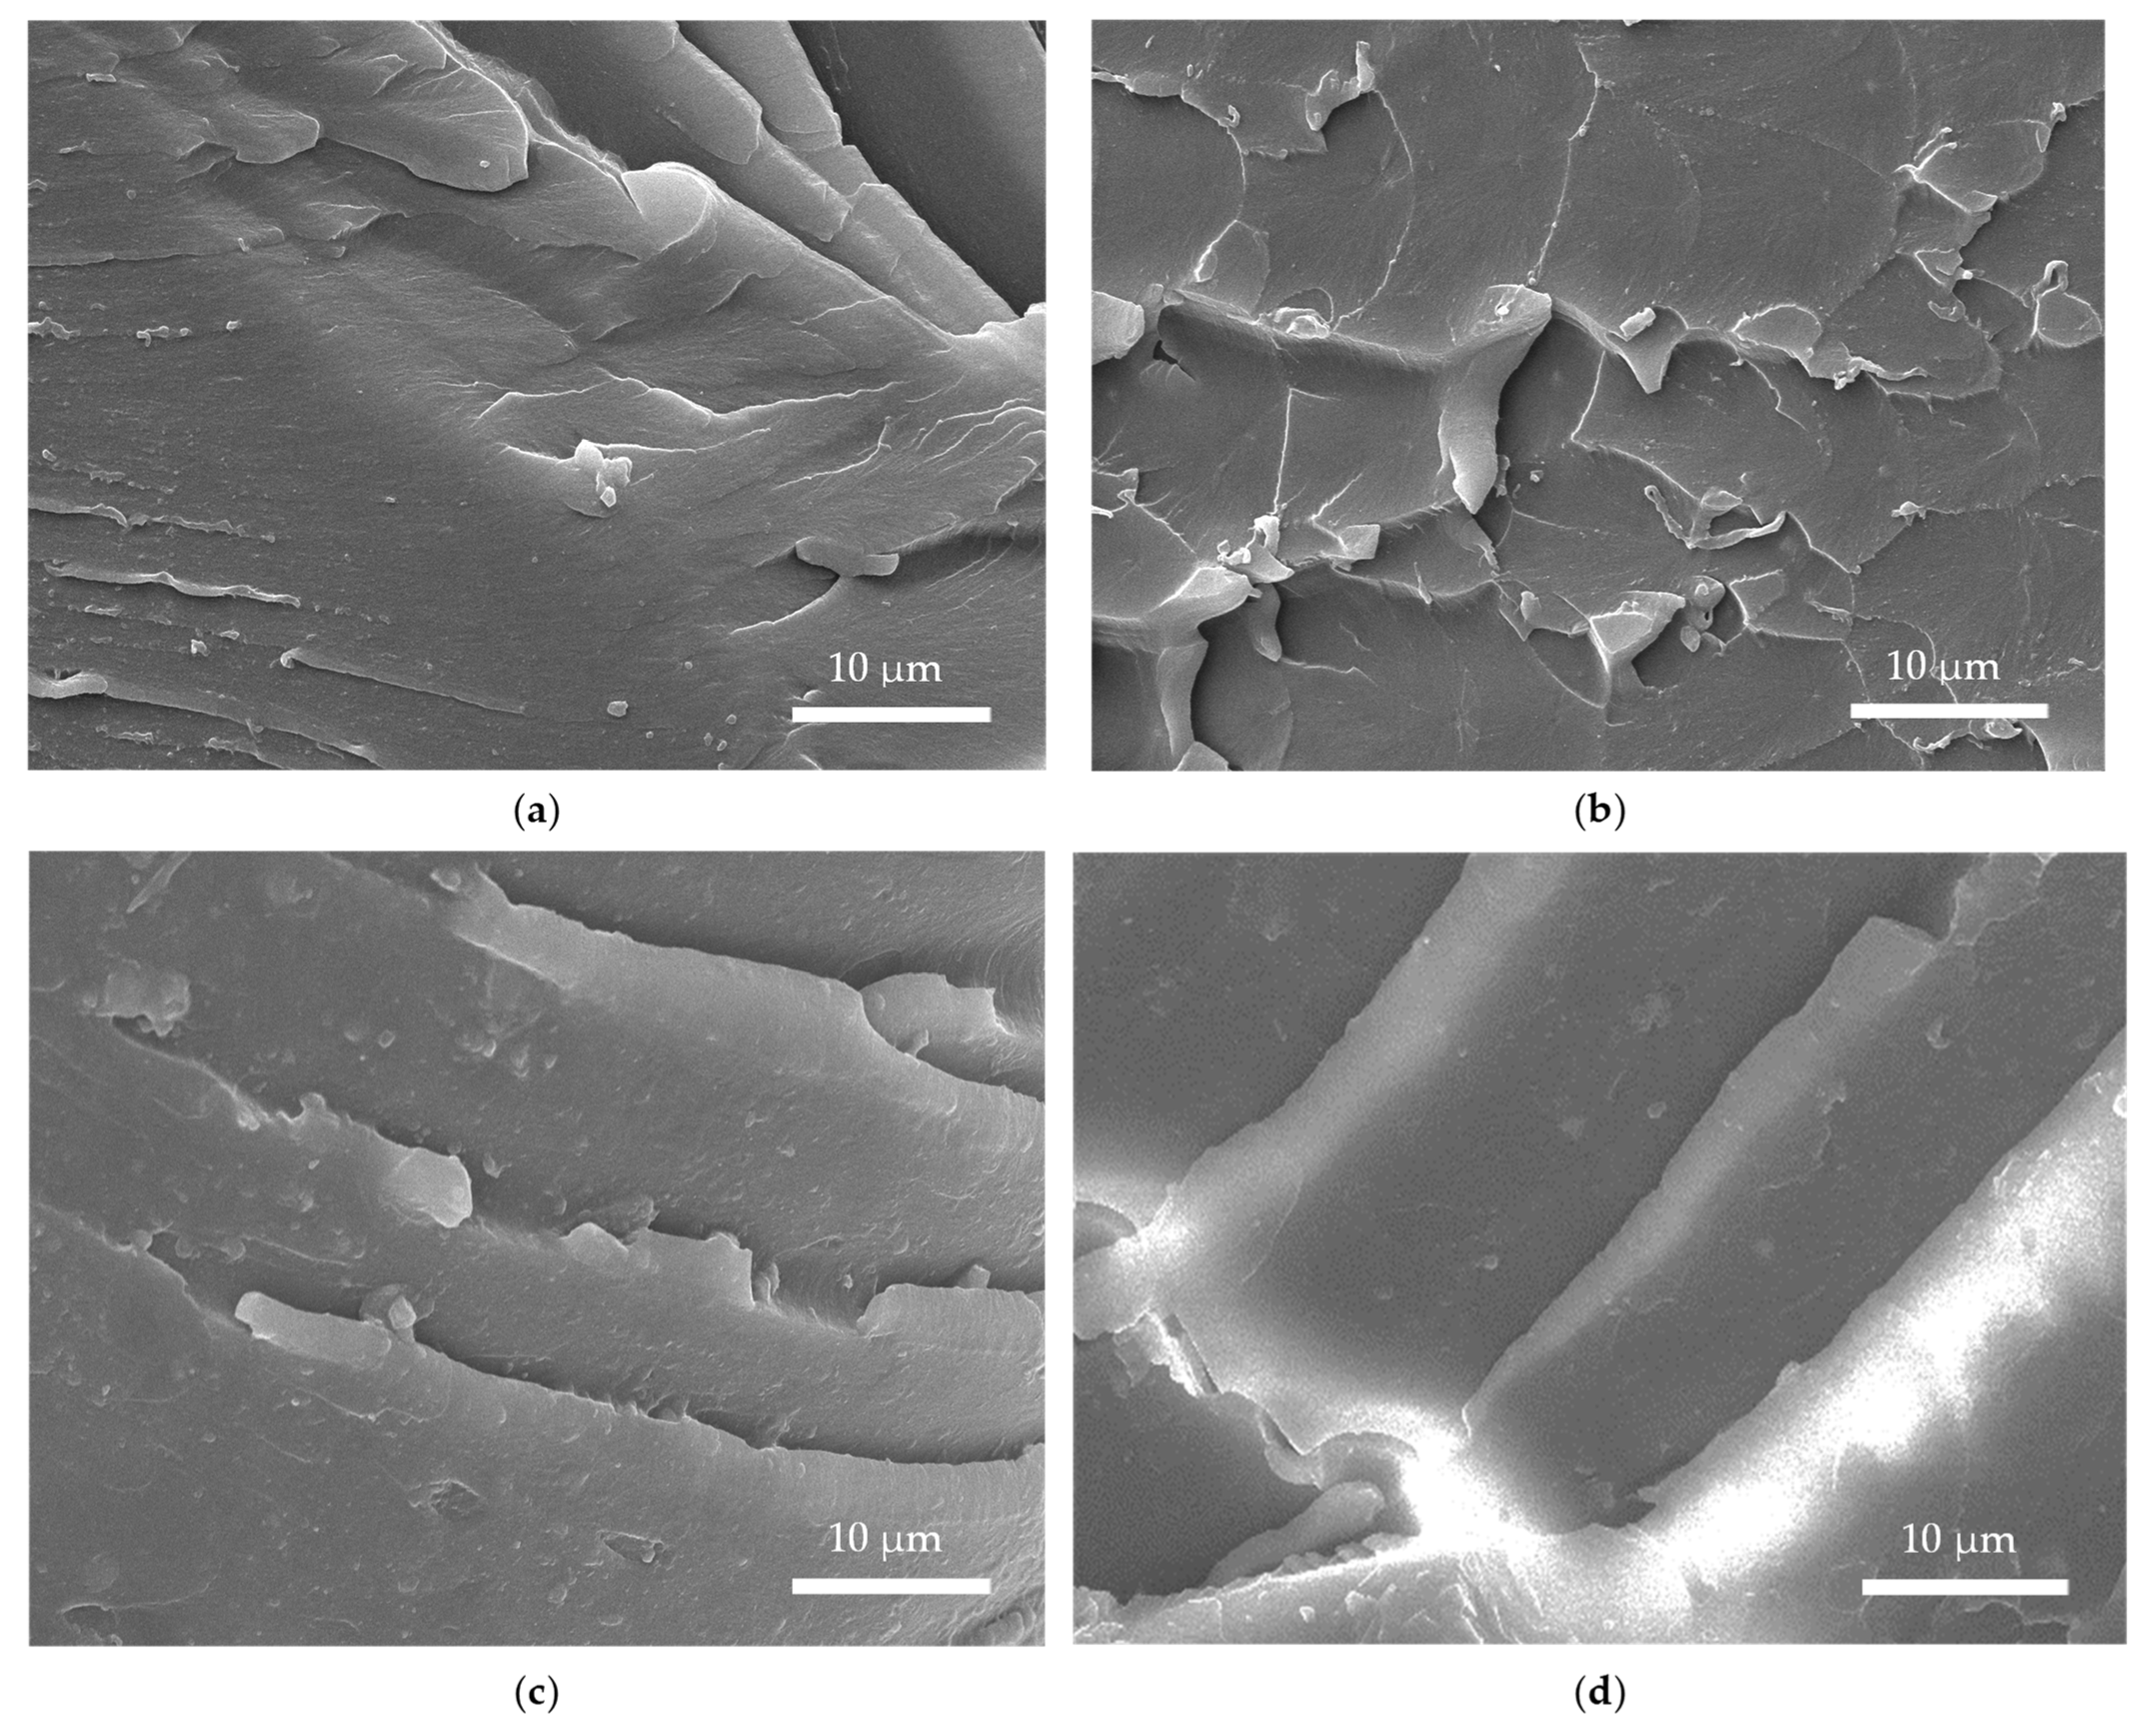
Figure 19 shows the morphologies of the tensile fracture surfaces of the X-75 (X = EP, TEP, NTEP, and KTEP) composite test splines, where each fracture surface showed obvious brittle fracture characteristics. Compared to the fracture surface of TEP-75, the cracks of the other three surfaces were deeper, and the corresponding fracture energies were greater. As indicated by the discussion in this section, KH-560 imparted more rigidity on the composites than NDZ-201, and among all the composites, KTEP-75 had the highest tensile strength.
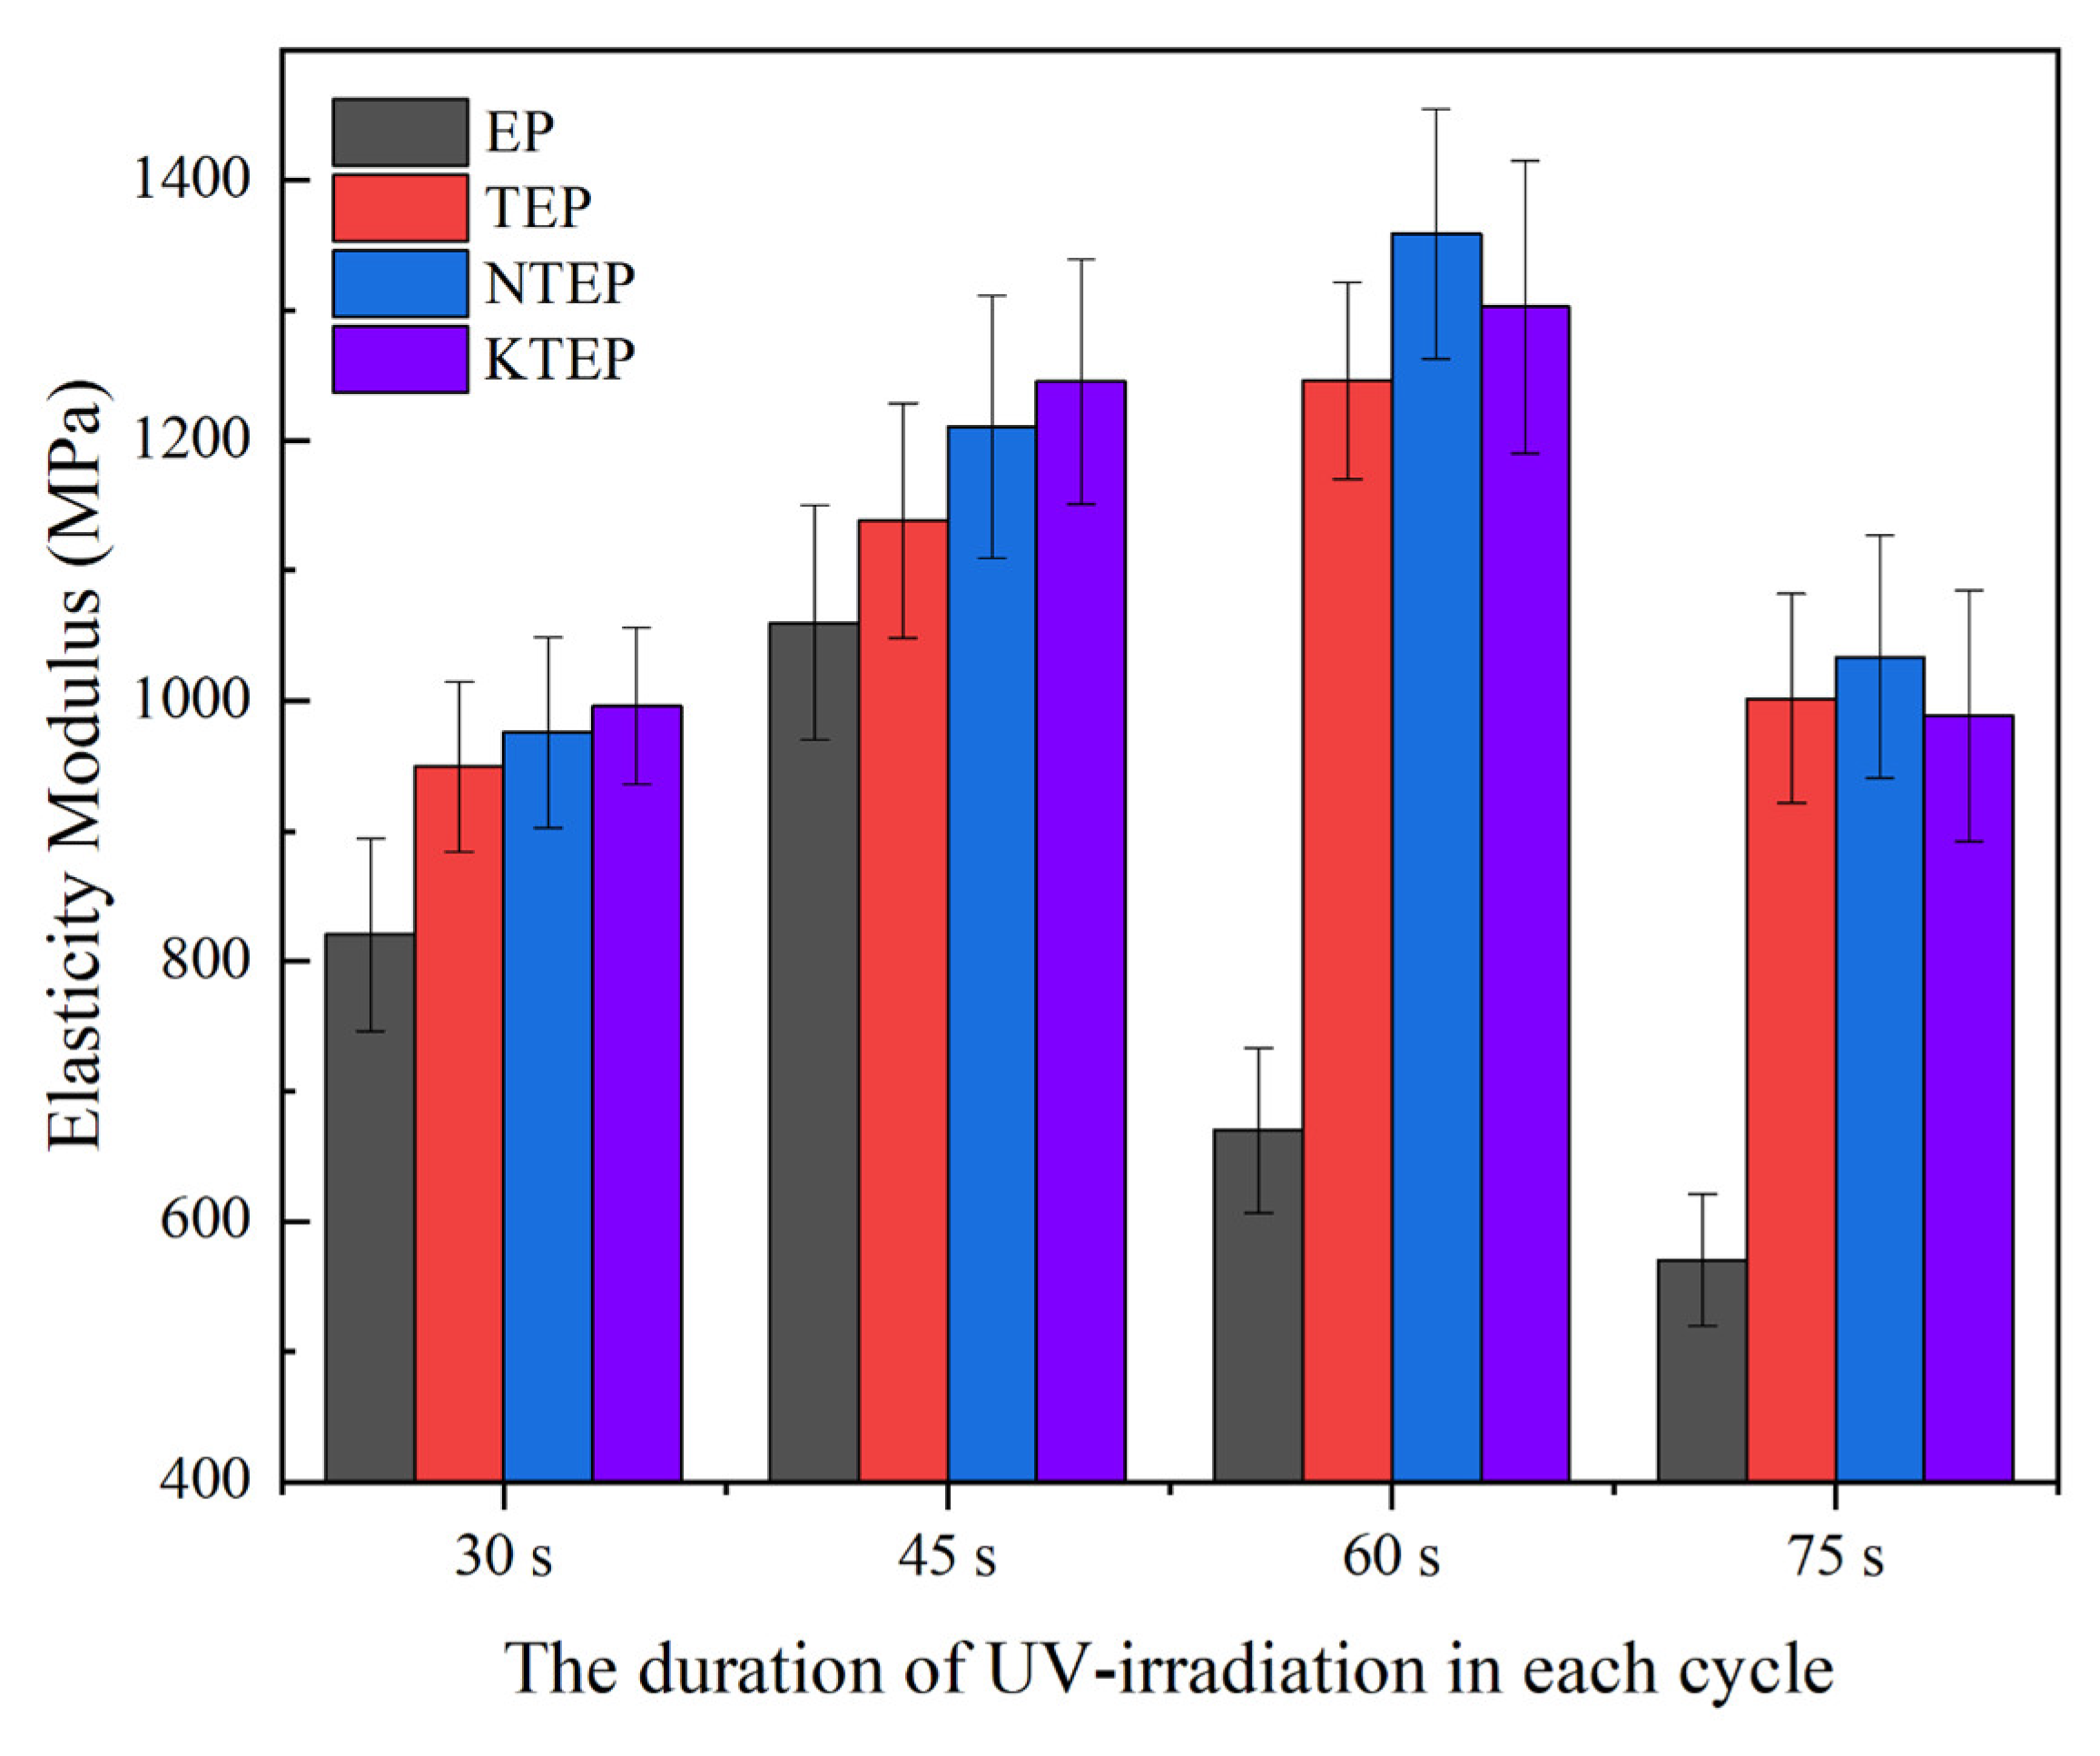
Figure 20 shows the elastic modulus values of the composite materials made of the four systems under different UV irradiation conditions, where the elastic modulus of each composite material showed the same trend as impact strength. In addition, the elastic modulus trend of each system also showed the following characteristics. In the EP system, the elastic modulus values of EP-60 and EP-75 changed more significantly than EP-45, compared to the previous sample, which was still related to the destruction of the polymer chains caused by excessive irradiation. The elastic modulus values of the systems containing nano-TiO
2 were significantly greater than the EP system because the –OH groups on the surface of nano-TiO
2 particles could form hydrogen bonds with the oxygen atoms of the epoxy resin polymer chains, strengthening the forces between the polymer chains and increasing the energy required for polymer chain sliding. The elastic modulus of the systems containing the coupling agents was greater than the TEP system, indicating that the coupling agent could strengthen the ligation effect of nano-TiO
2 as the linker between the polymer chains. In addition, A and B showed convergence in the elastic modulus test results.
The glass transition temperatures (
Tg) of the EP, TEP, NTEP, and KTEP composites are shown in
Figure 21, indicating that EP-45 had the largest
Tg in the EP system, while X-60 (X = TEP, NTEP, and KTEP) had the largest
Tg in the corresponding system. These results were similar to the previous impact strength results, which were still related to the scattering effect of nano-TiO
2 under UV irradiation. The
Tg for each system first increased and then decreased with an increase in irradiation time, which was also similar to the trend of the cross-linking density of each system. When compared to each other, the
Tg of the TEP system was smaller than the EP system and had a lower cross-linking degree. Preghenella et al. [
32] noted that this phenomenon was related to the large viscosity of the prepolymer of the TEP system. In addition, Sun et al. [
33] showed that nanoparticles played a plasticizing role in the epoxy resin matrix, which increased the free volume of the system and decreased
Tg. The value of the
Tg of the NTEP system was similar to the TEP system because NDZ-201 was connected to the epoxy resin matrix with a flexible alkyl tail chain, –C
8H
17, which had less effect on
Tg. Compared to the TEP and NTEP systems, the
Tg of the KTEP system was significantly larger for several reasons. The KH-560-modified nano-TiO
2 had a small particle size and could easily disperse, which was conducive to increasing the cross-linking density of the system. KH-560 could also easily form Si–O–Si bonds during the reaction, resulting in an increase in the cross-linking degree of the system. The epoxy group at the tail end of the KH-560 molecule was rigid, which restricted polymer chain activity.
To study the effects of different components on the heat resistance of the composites, EP-60, TEP-60, NTEP-60, and KTEP-60 were assessed by thermogravimetry. The thermogravimetric curve of each sample is shown in
Figure 22, with the thermal decomposition temperature of each sample shown in
Table 5. In
Table 5,
T5% refers to the initial decomposition temperature,
T30% refers to the temperature corresponding to the loss of 30% of the sample mass, and
Tm refers to the temperature corresponding to the maximum rate of thermal decomposition. In general, the thermal decomposition of each sample mainly consisted of two steps: the carbonization of each composite material and the combustion of the residual carbon of each system. The
T5% and
T30% values of the composites containing nano-TiO
2 were higher than EP-60, which indicated that nano-TiO
2 could improve the heat resistance of the composite to a certain temperature range due to its high thermal stability and strong binding force with the epoxy resin polymer chain. This strong binding made the carbon layer denser after combustion, which could hinder the transfer of combustion heat and the infiltration of oxygen. Compared to TEP-60 and KTEP-60, the
T5% of NTEP-60 was significantly lower because the pyrophosphate groups in the molecular structure of NDZ-201 could easily decompose when heated. The
Tm of the composites containing coupling agents improved relative to TEP-60 because of the smaller particle size of the modified nano-TiO
2, which increased the cross-linking degree of the material.
