
Synthesis of Calcium Peroxide Nanoparticles with Starch as a Stabilizer for the Degradation of Organic Dye in an Aqueous Solution

 , ,
, , 
 ,
,  ,
, 
Abstract
1. Introduction
2. Materials and Methods
2.1. Materials
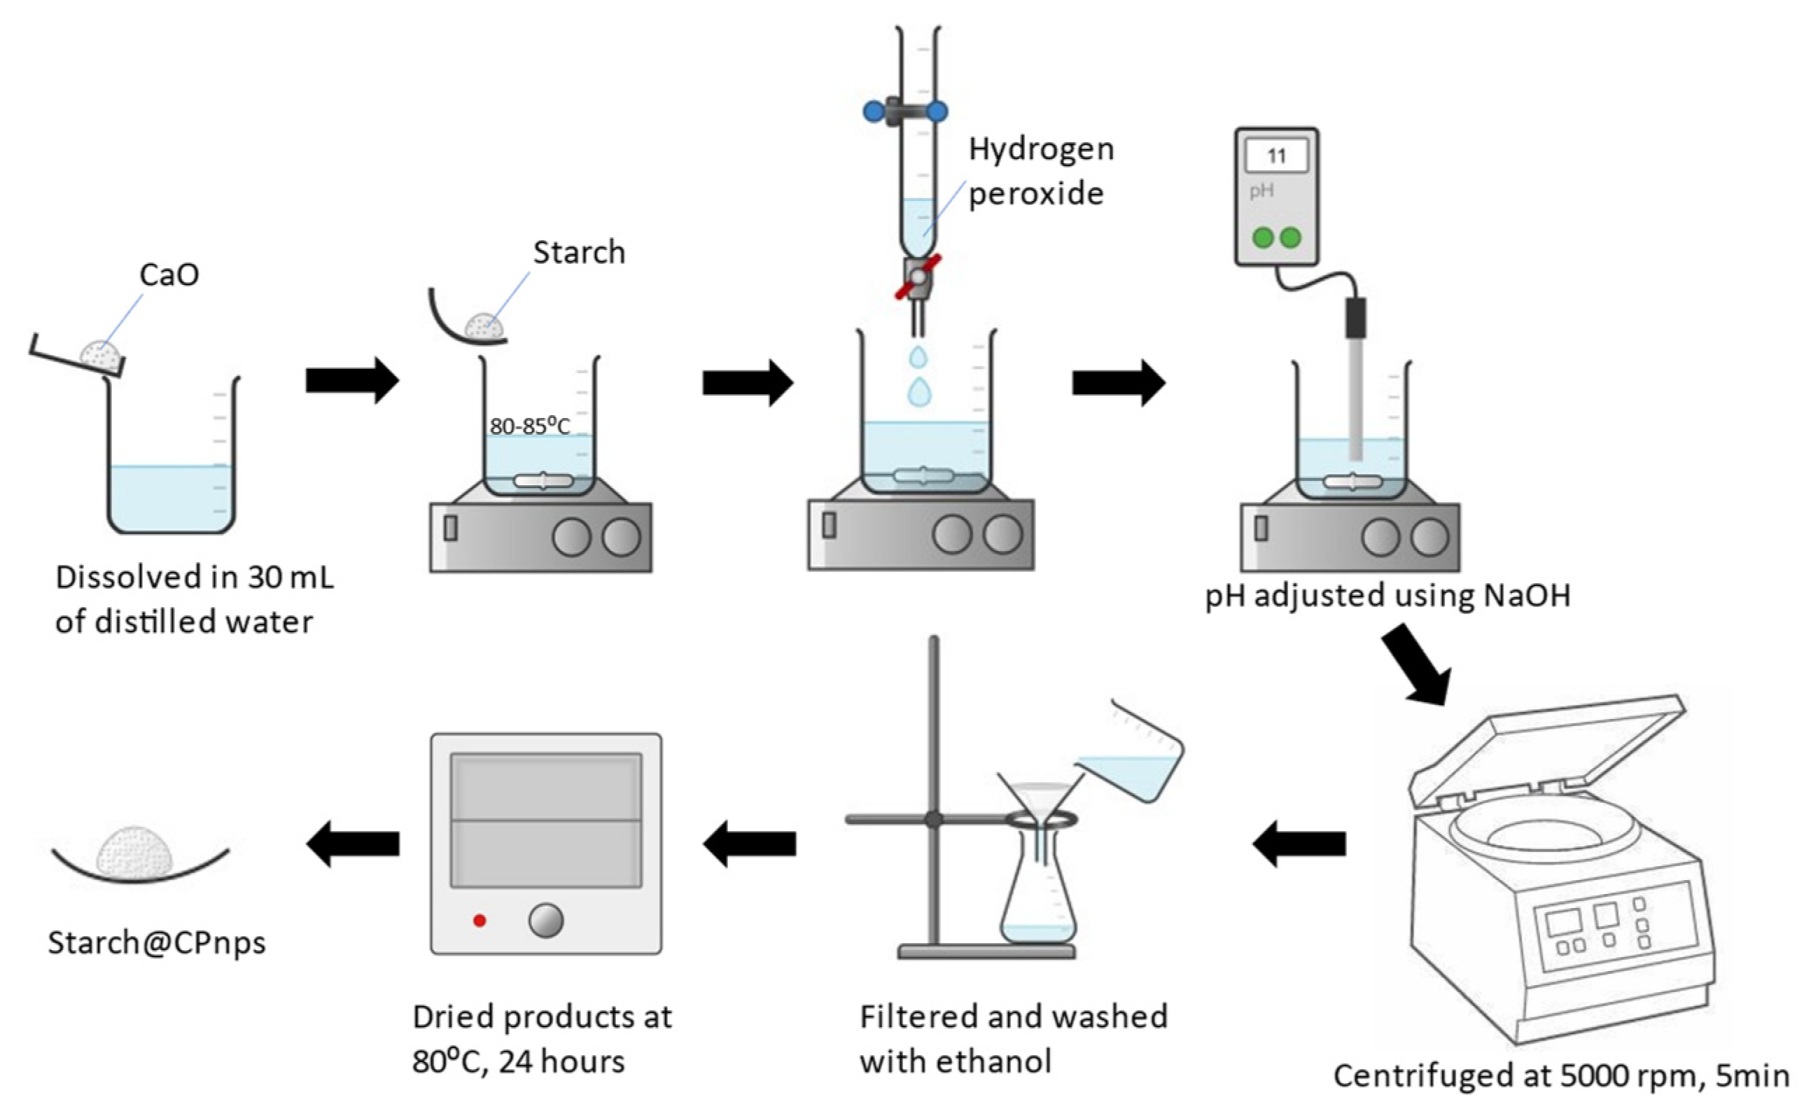
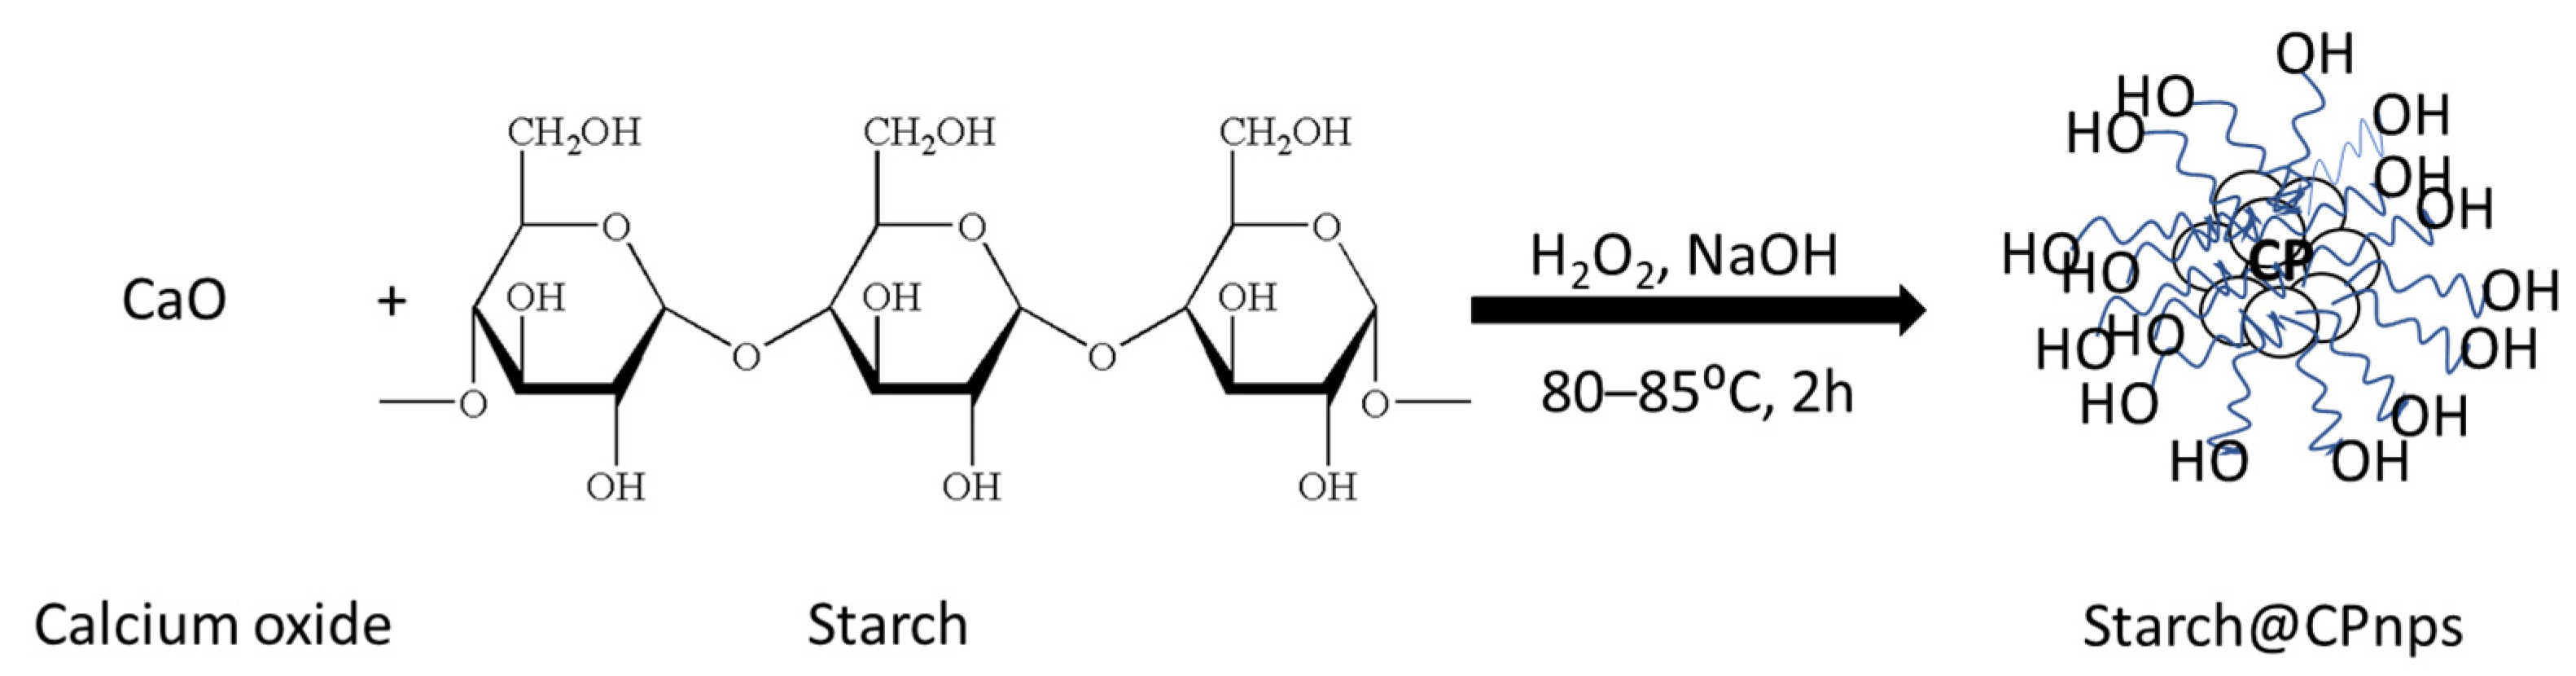
2.2. Synthesis of Calcium Peroxide Nanoparticles with Starch as a Stabilizer (Starch@CPnps)
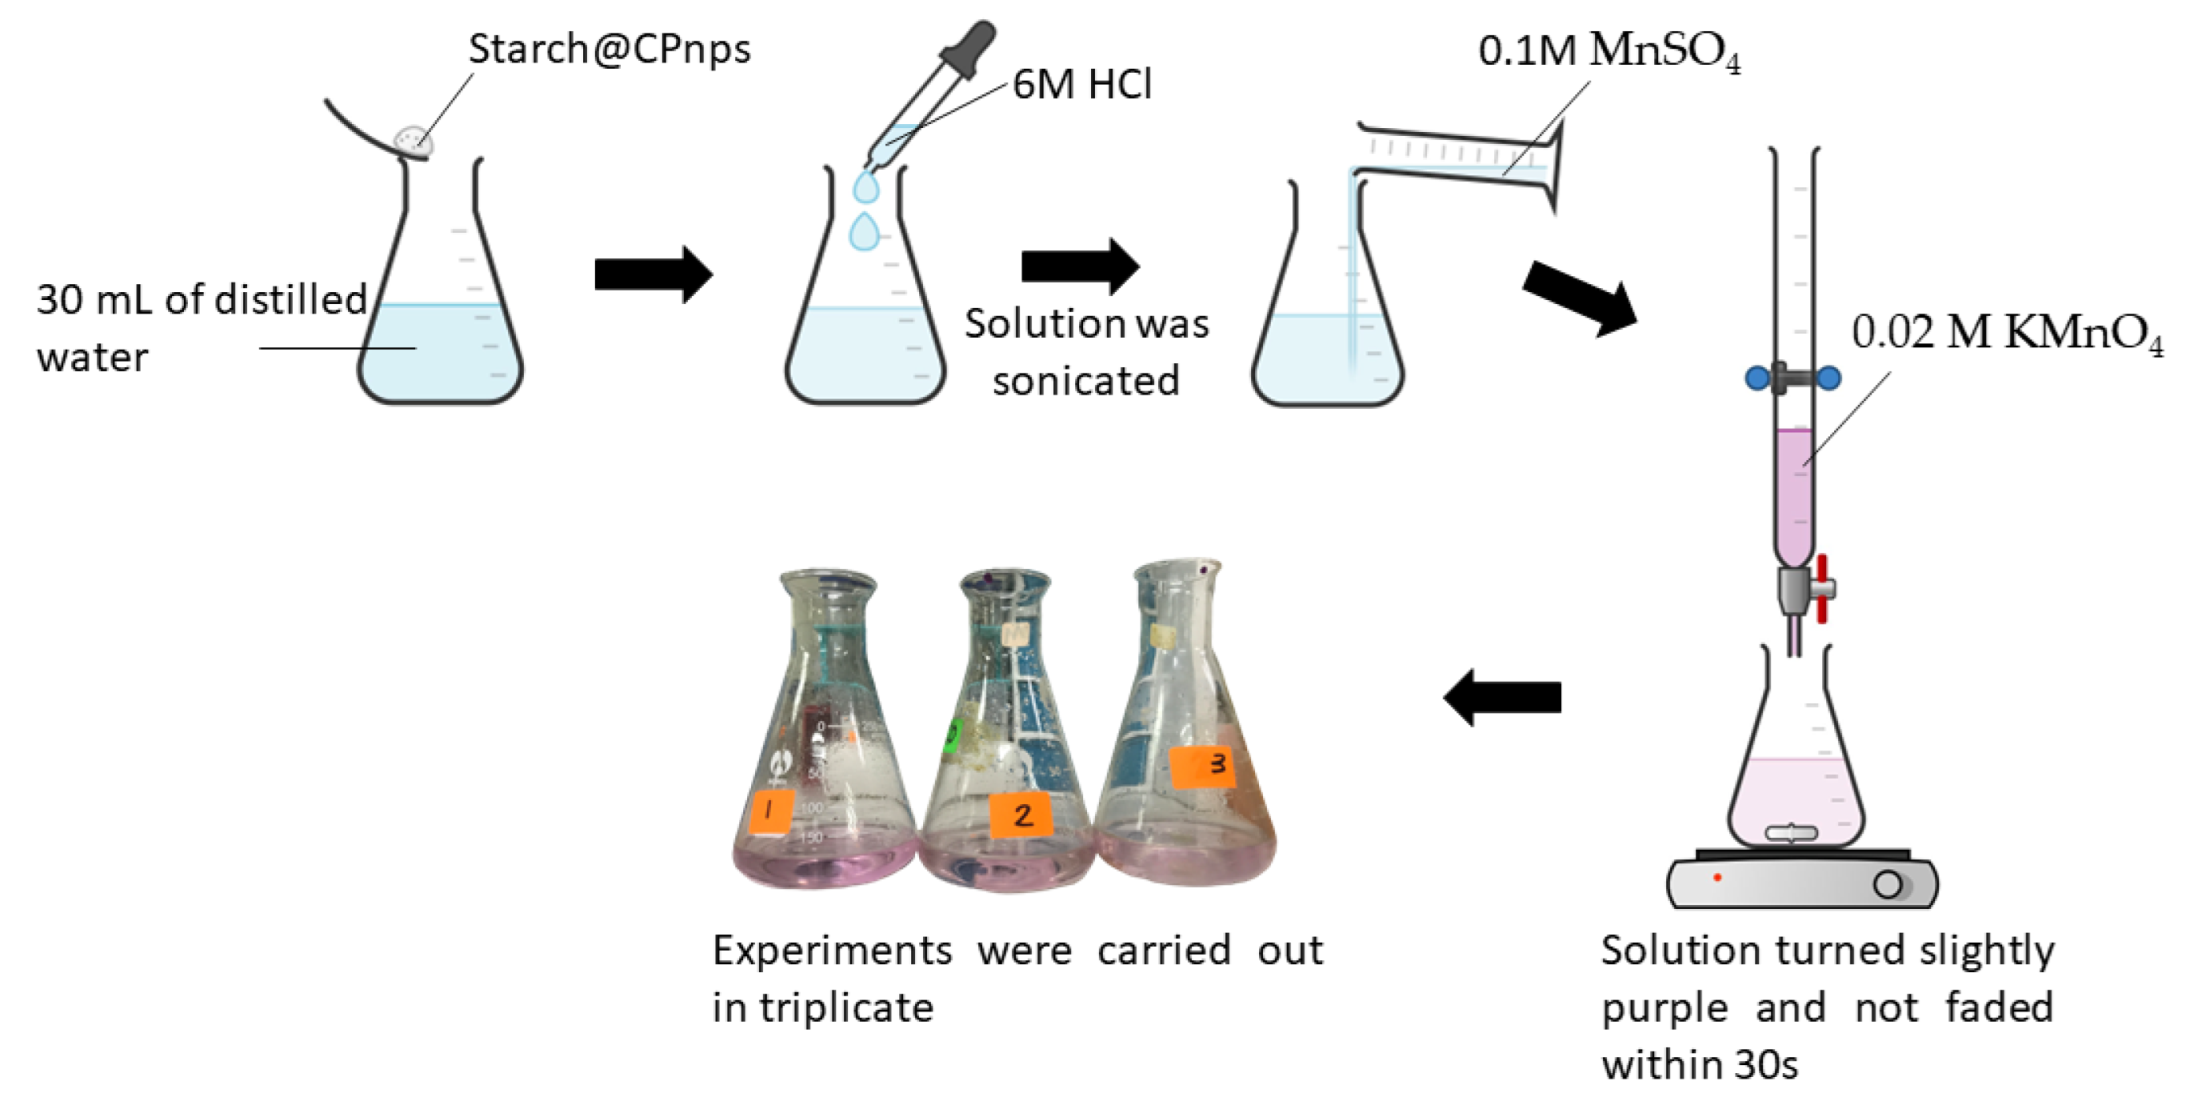
2.3. Determination of Calcium Peroxide Content in the Starch@CPnps
2.4. Degradation Experiments for CP Commercial and Starch@CPnps
2.5. Characterization of Starch@CPnps
3. Results and Discussions
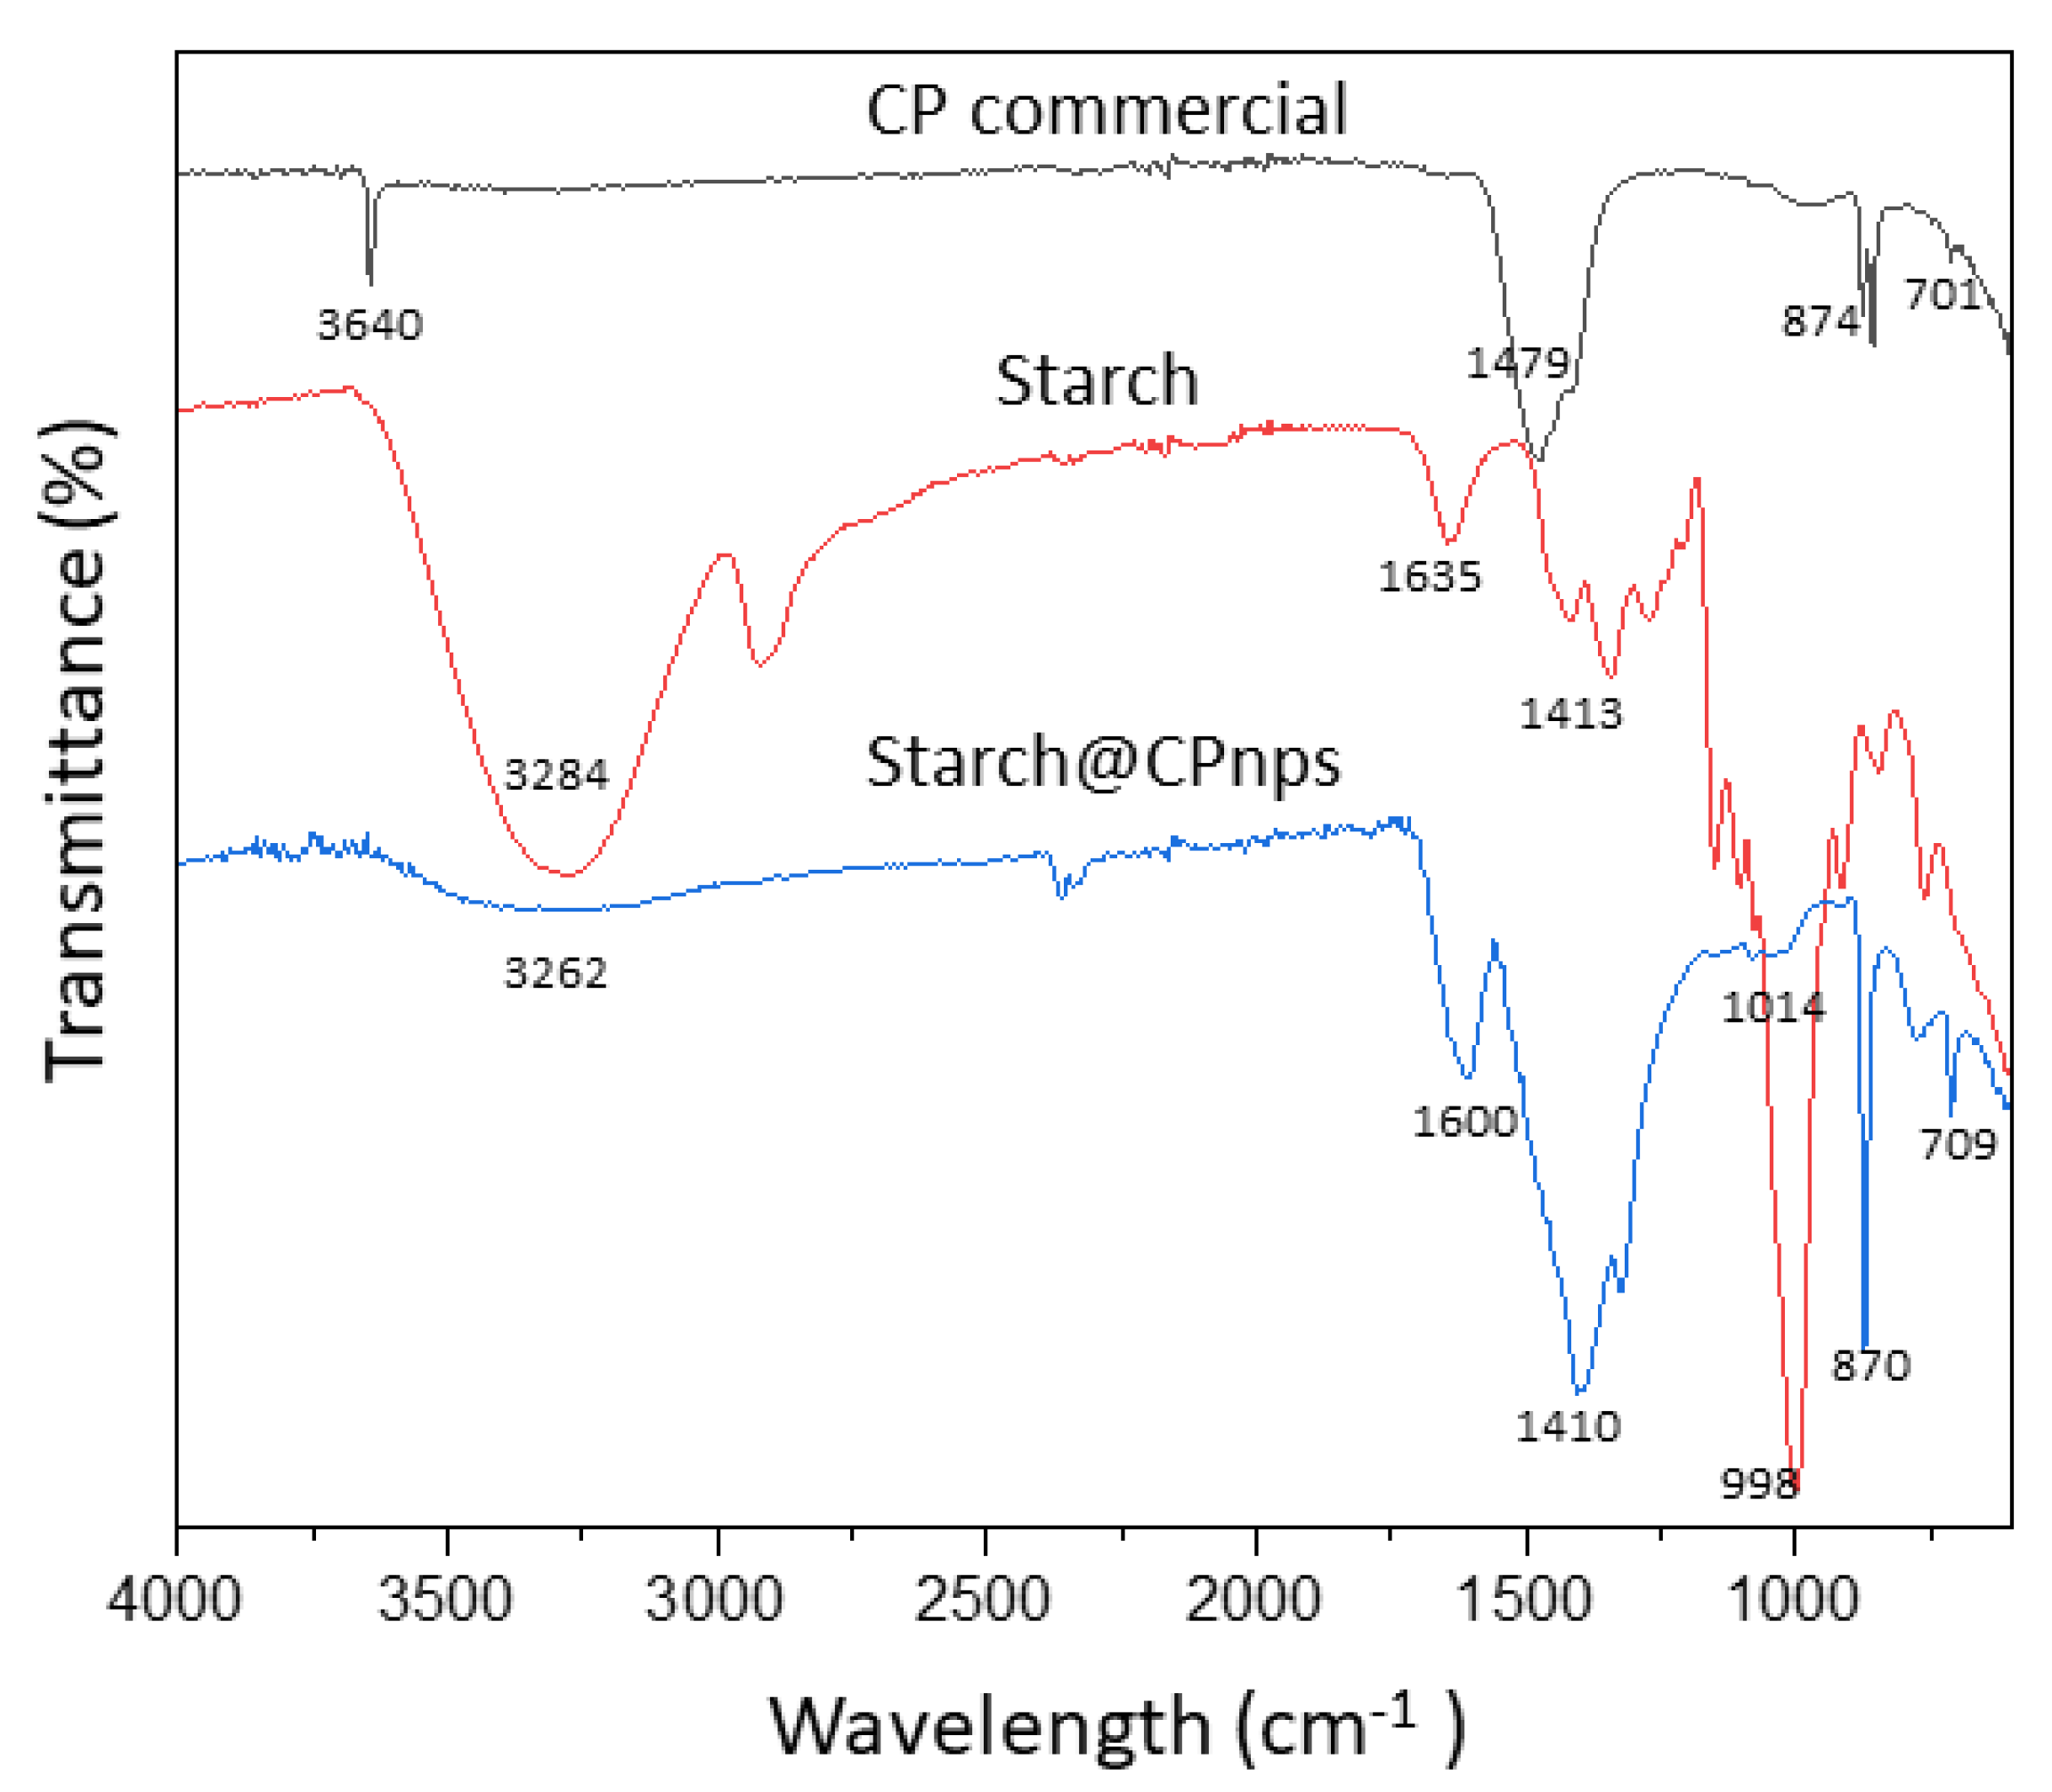
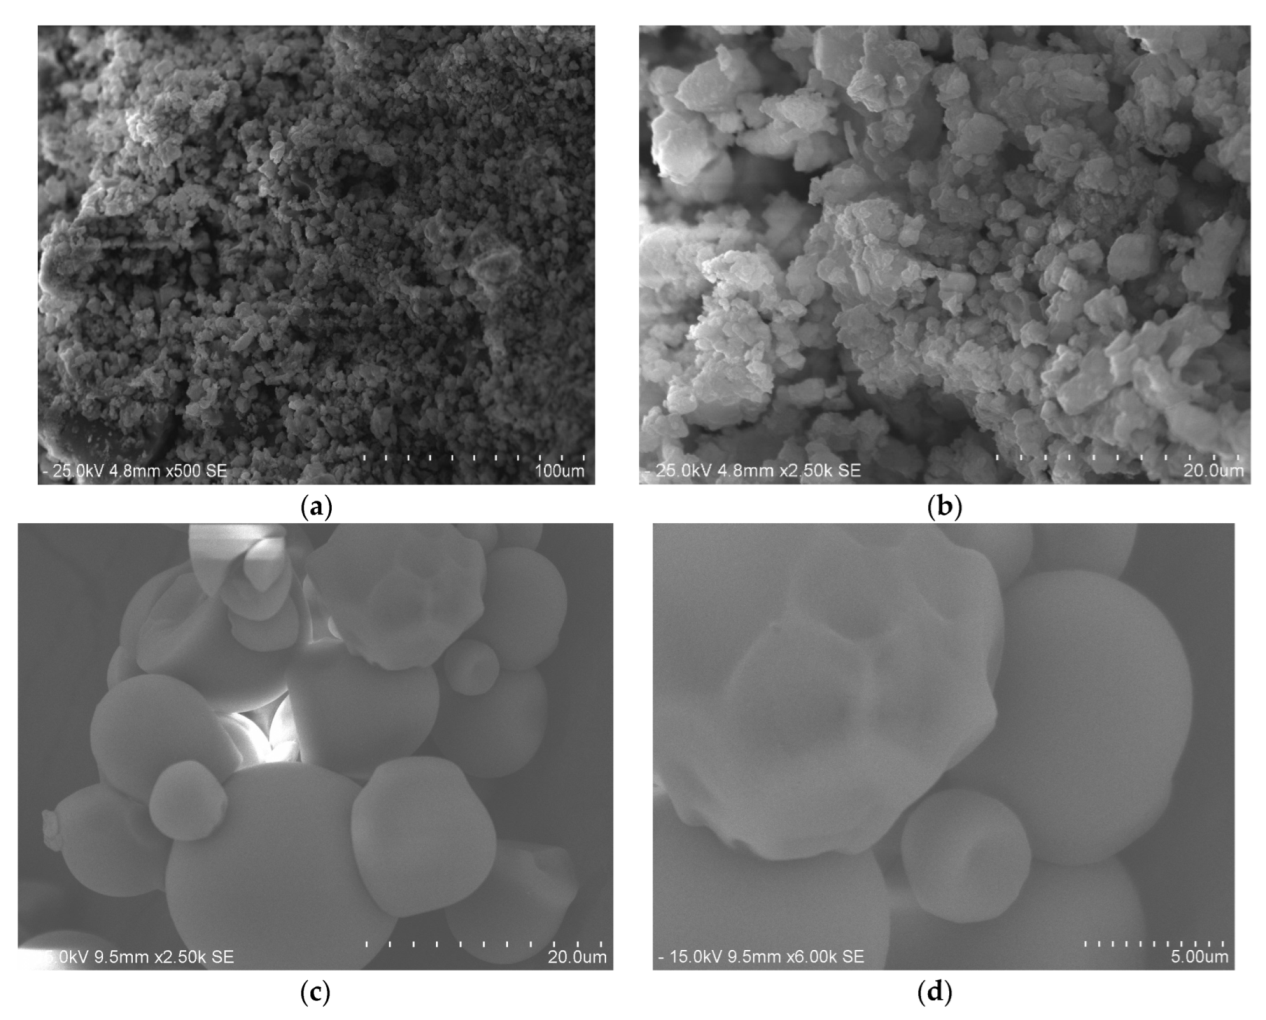
3.1. Characterization of Starch@CPnps
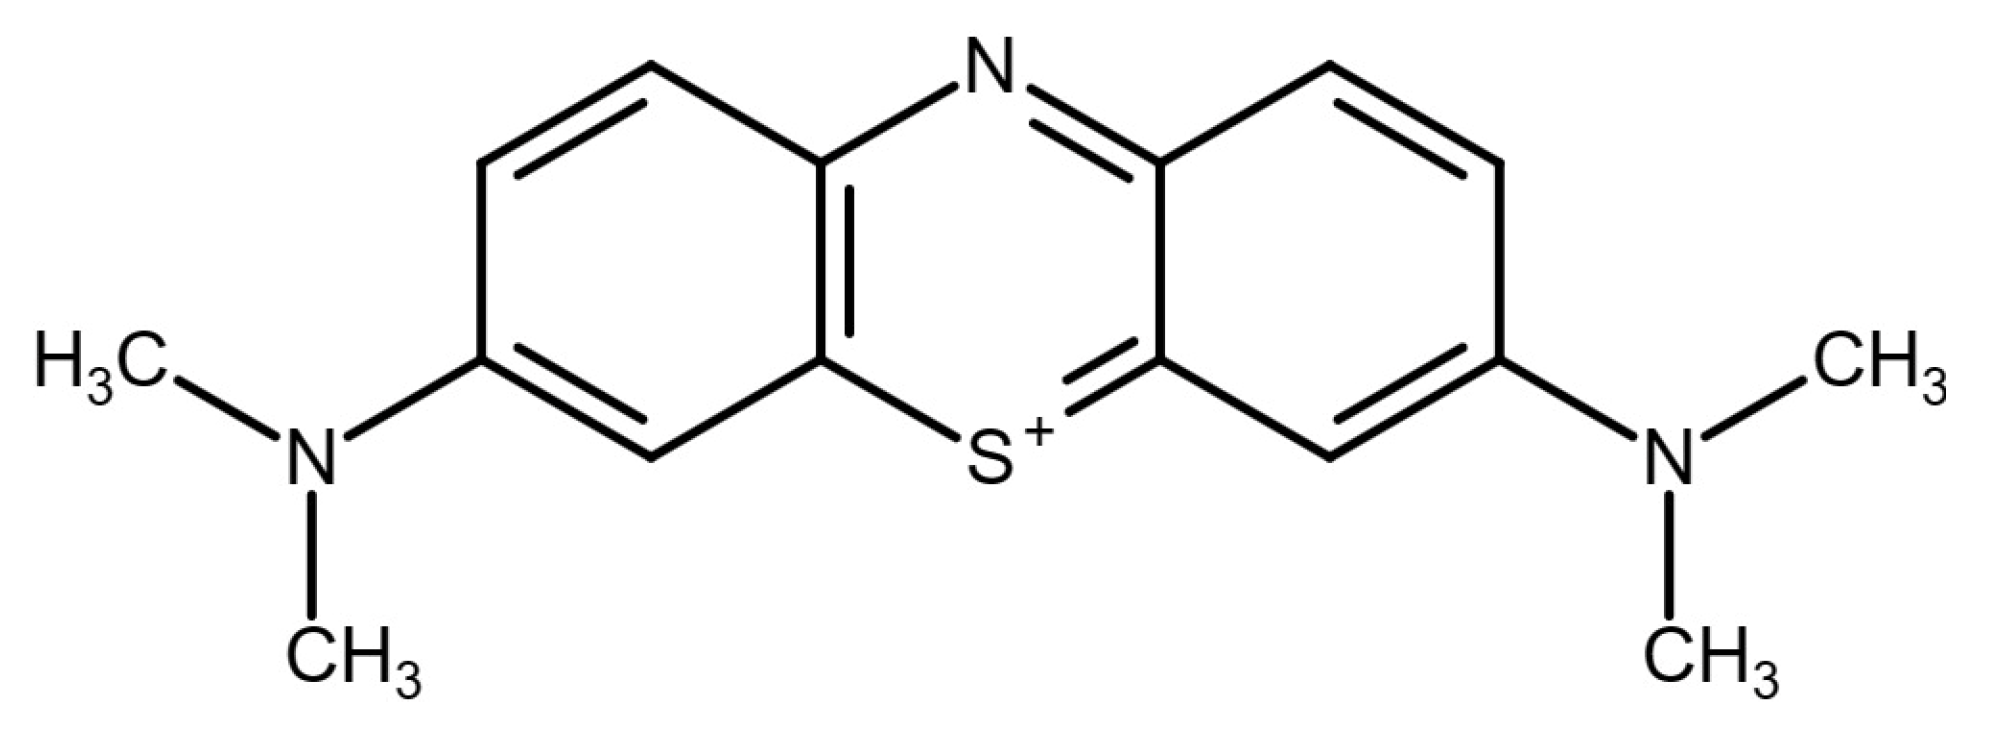
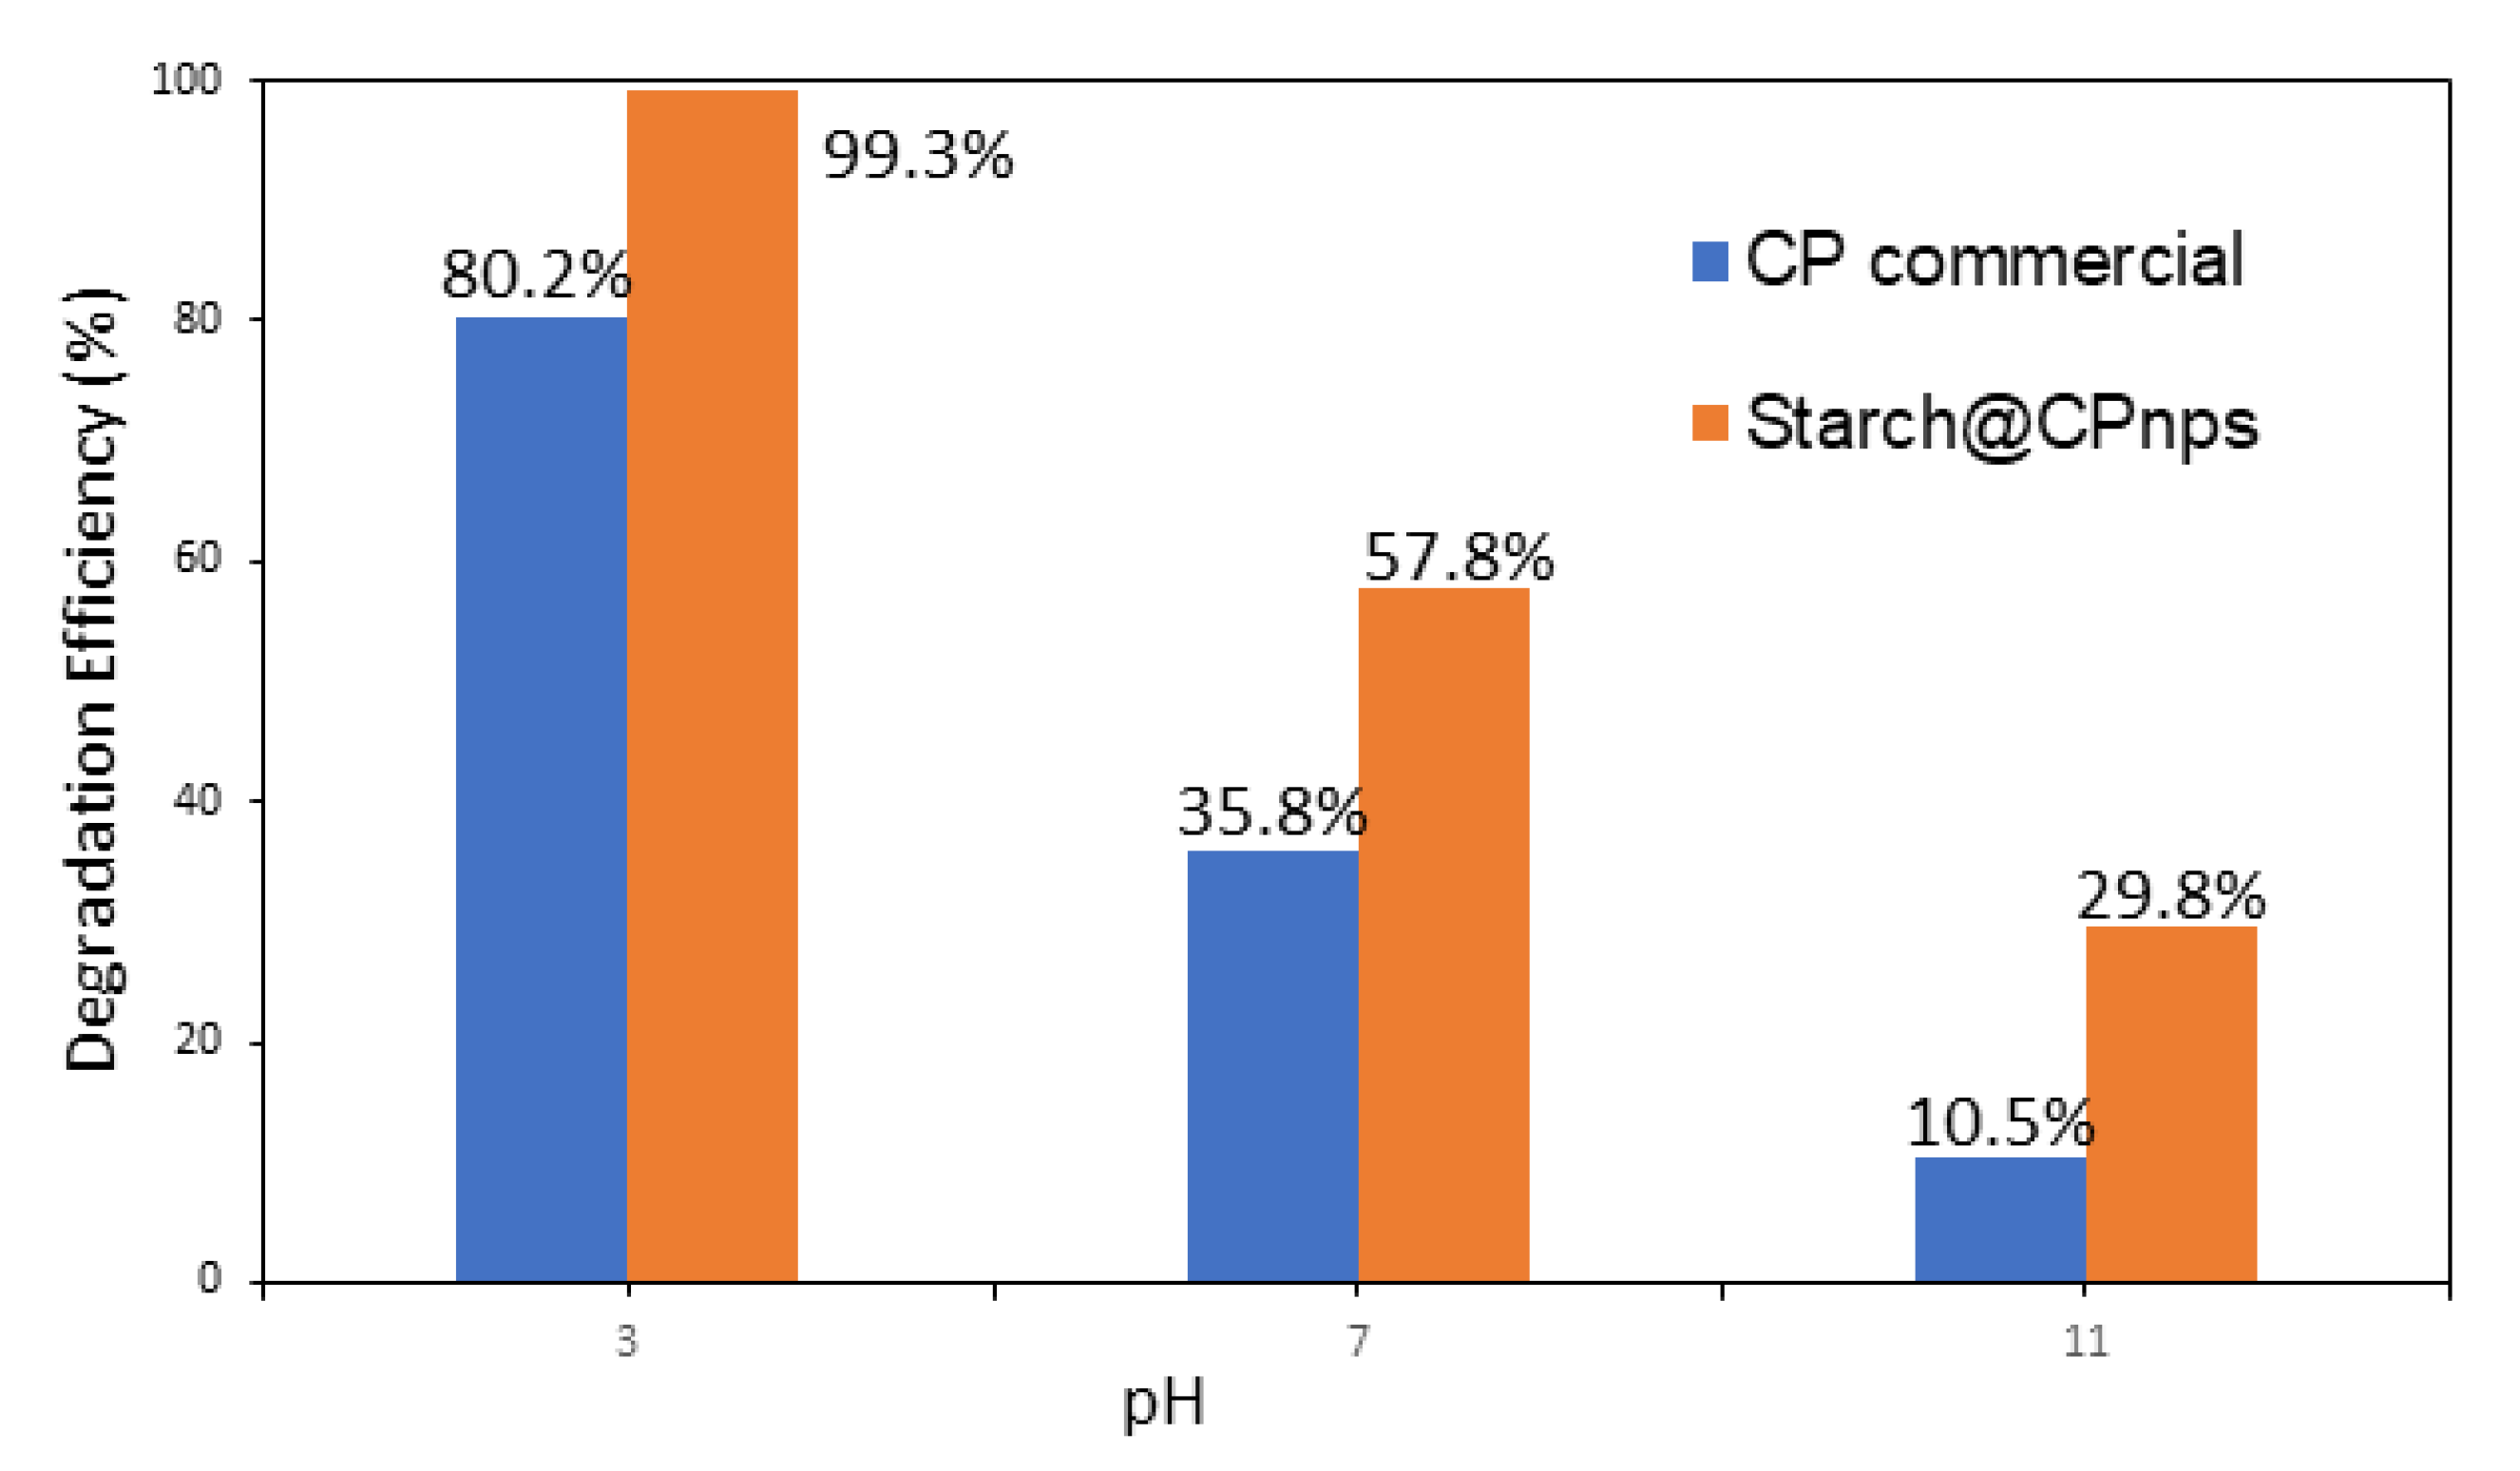
3.2. Methylene Blue Degradation Analysis
- (i)
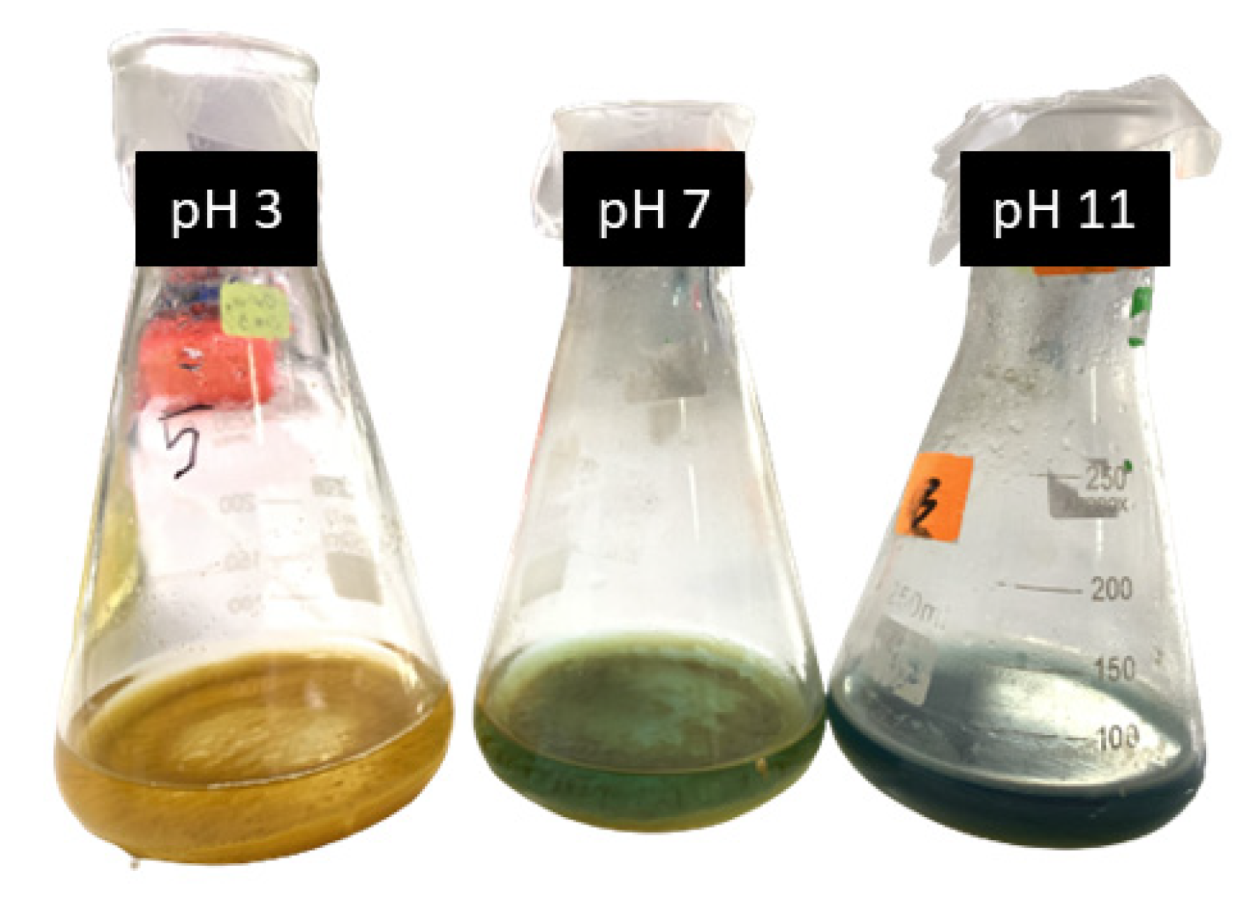
- Effect of Initial pH
- (ii)
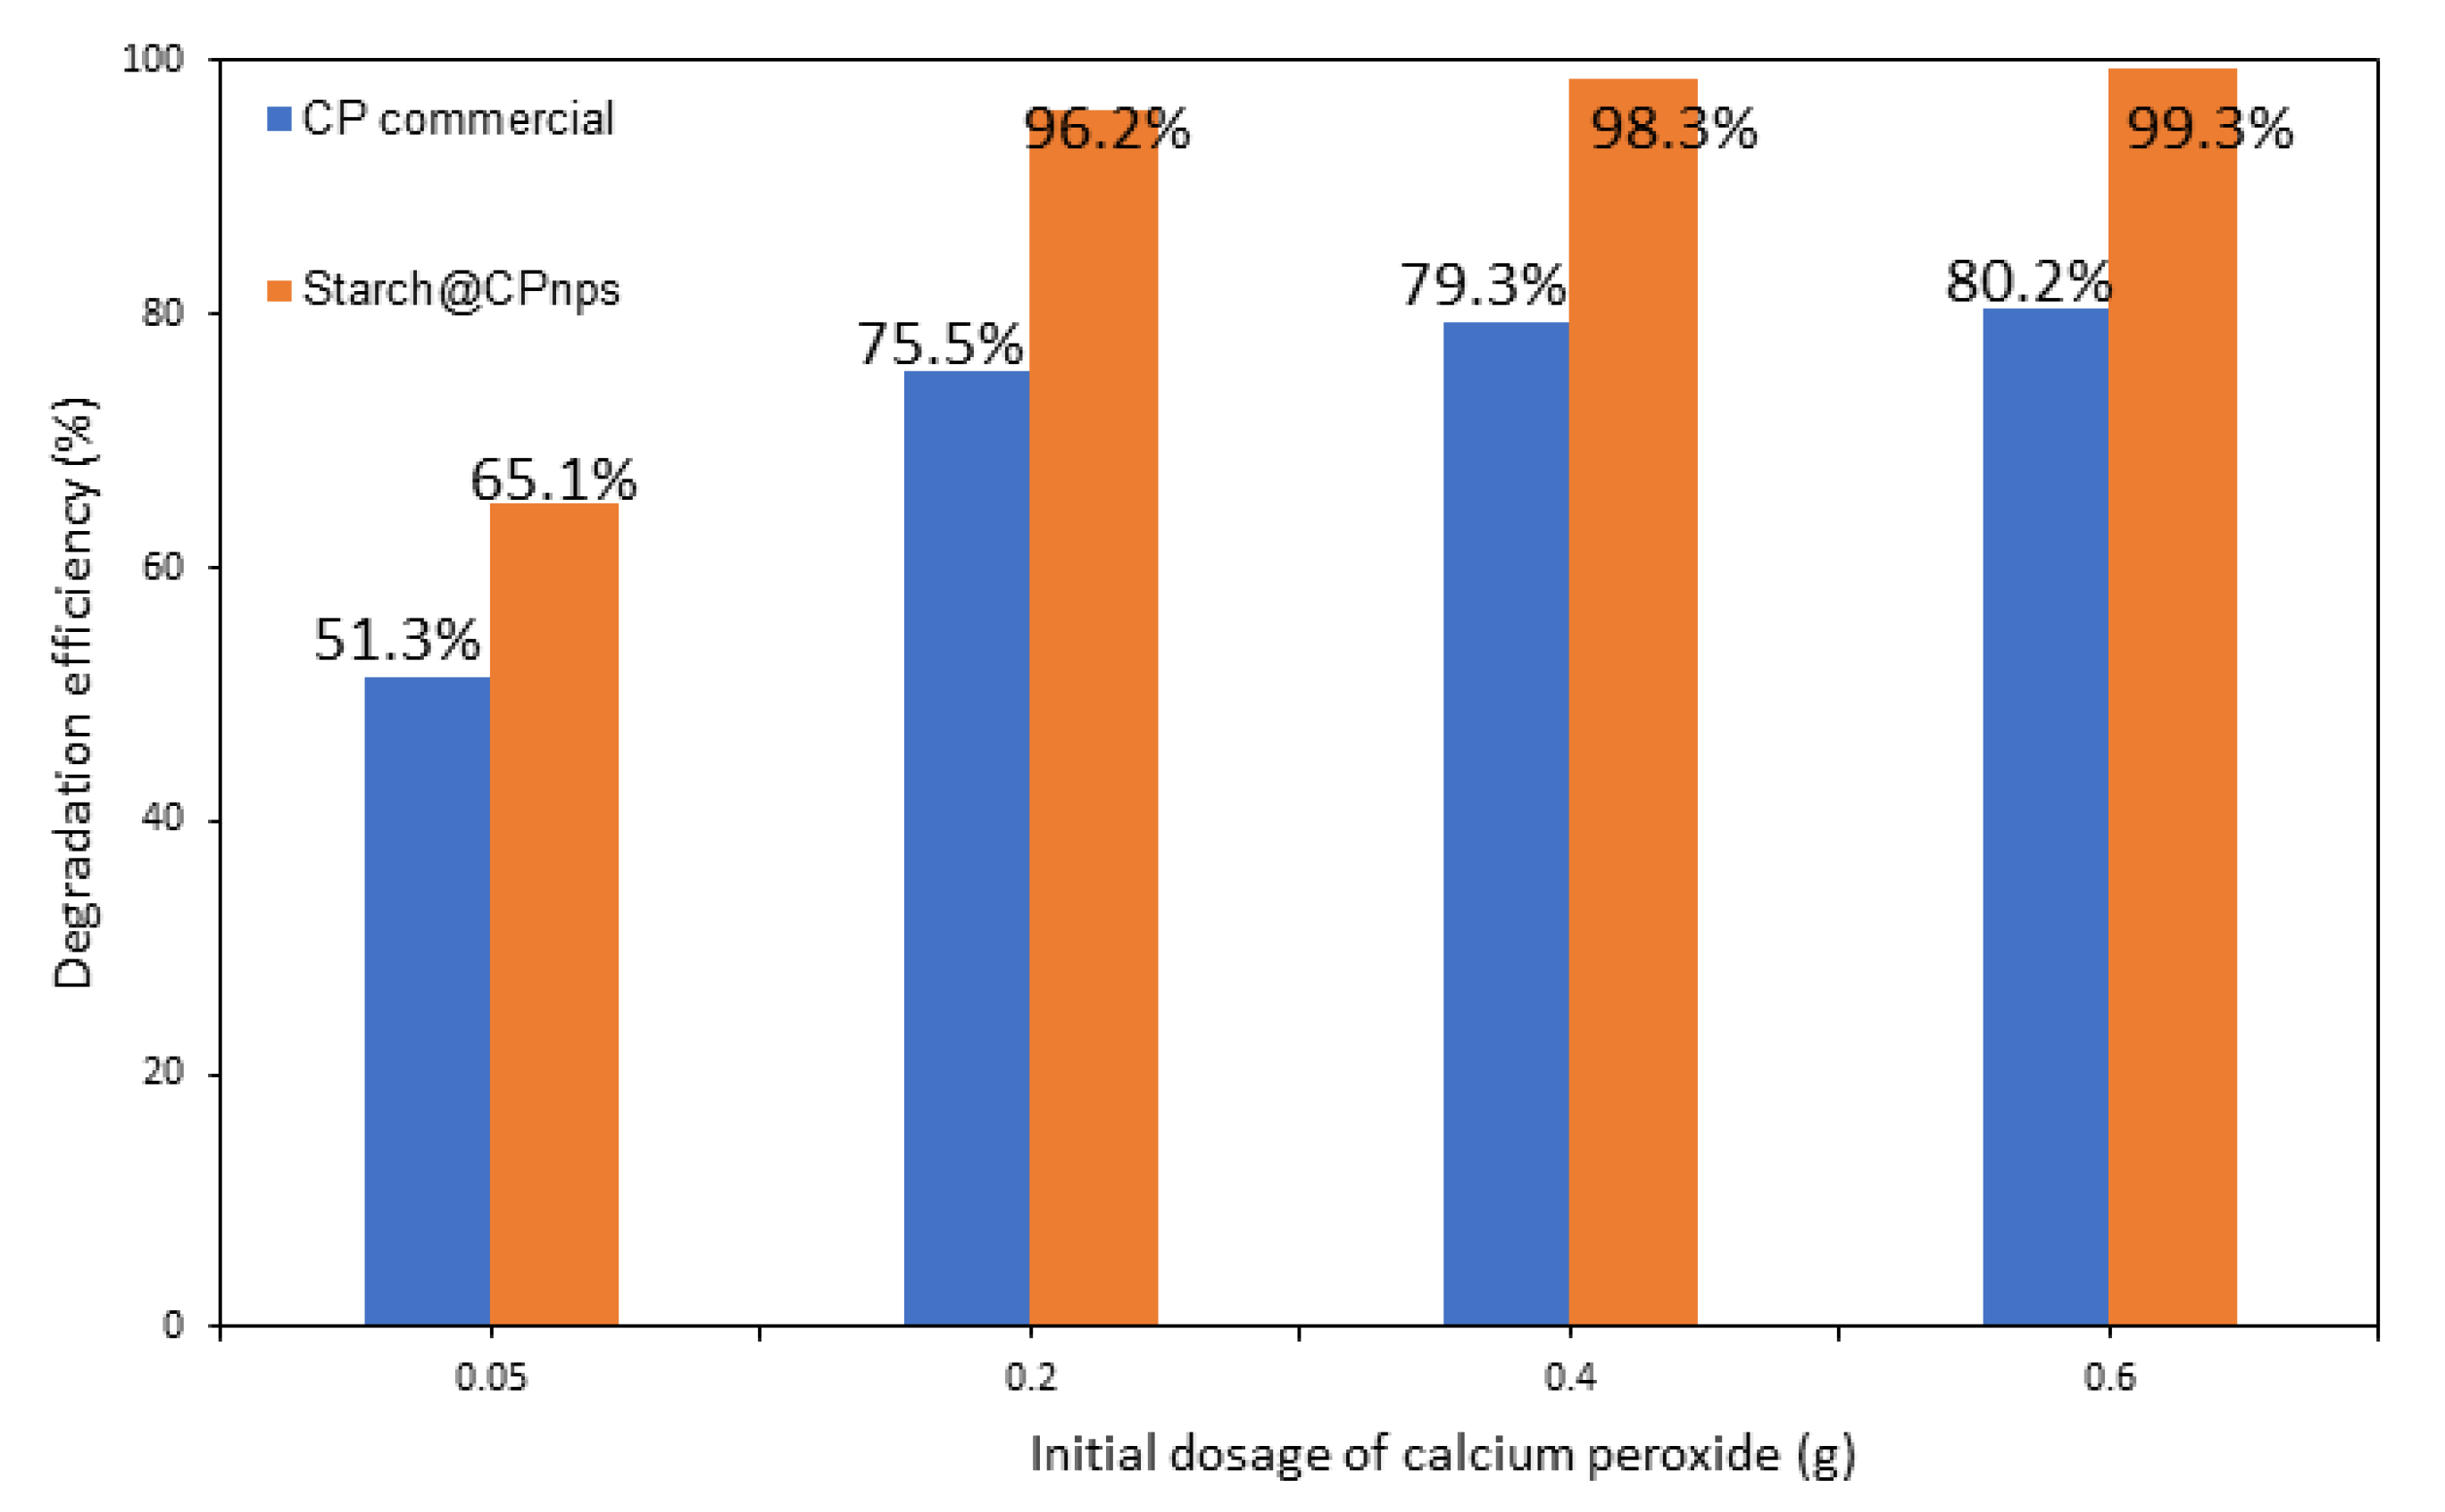
- Effect of Calcium Peroxide Initial Dosage
- (iii)
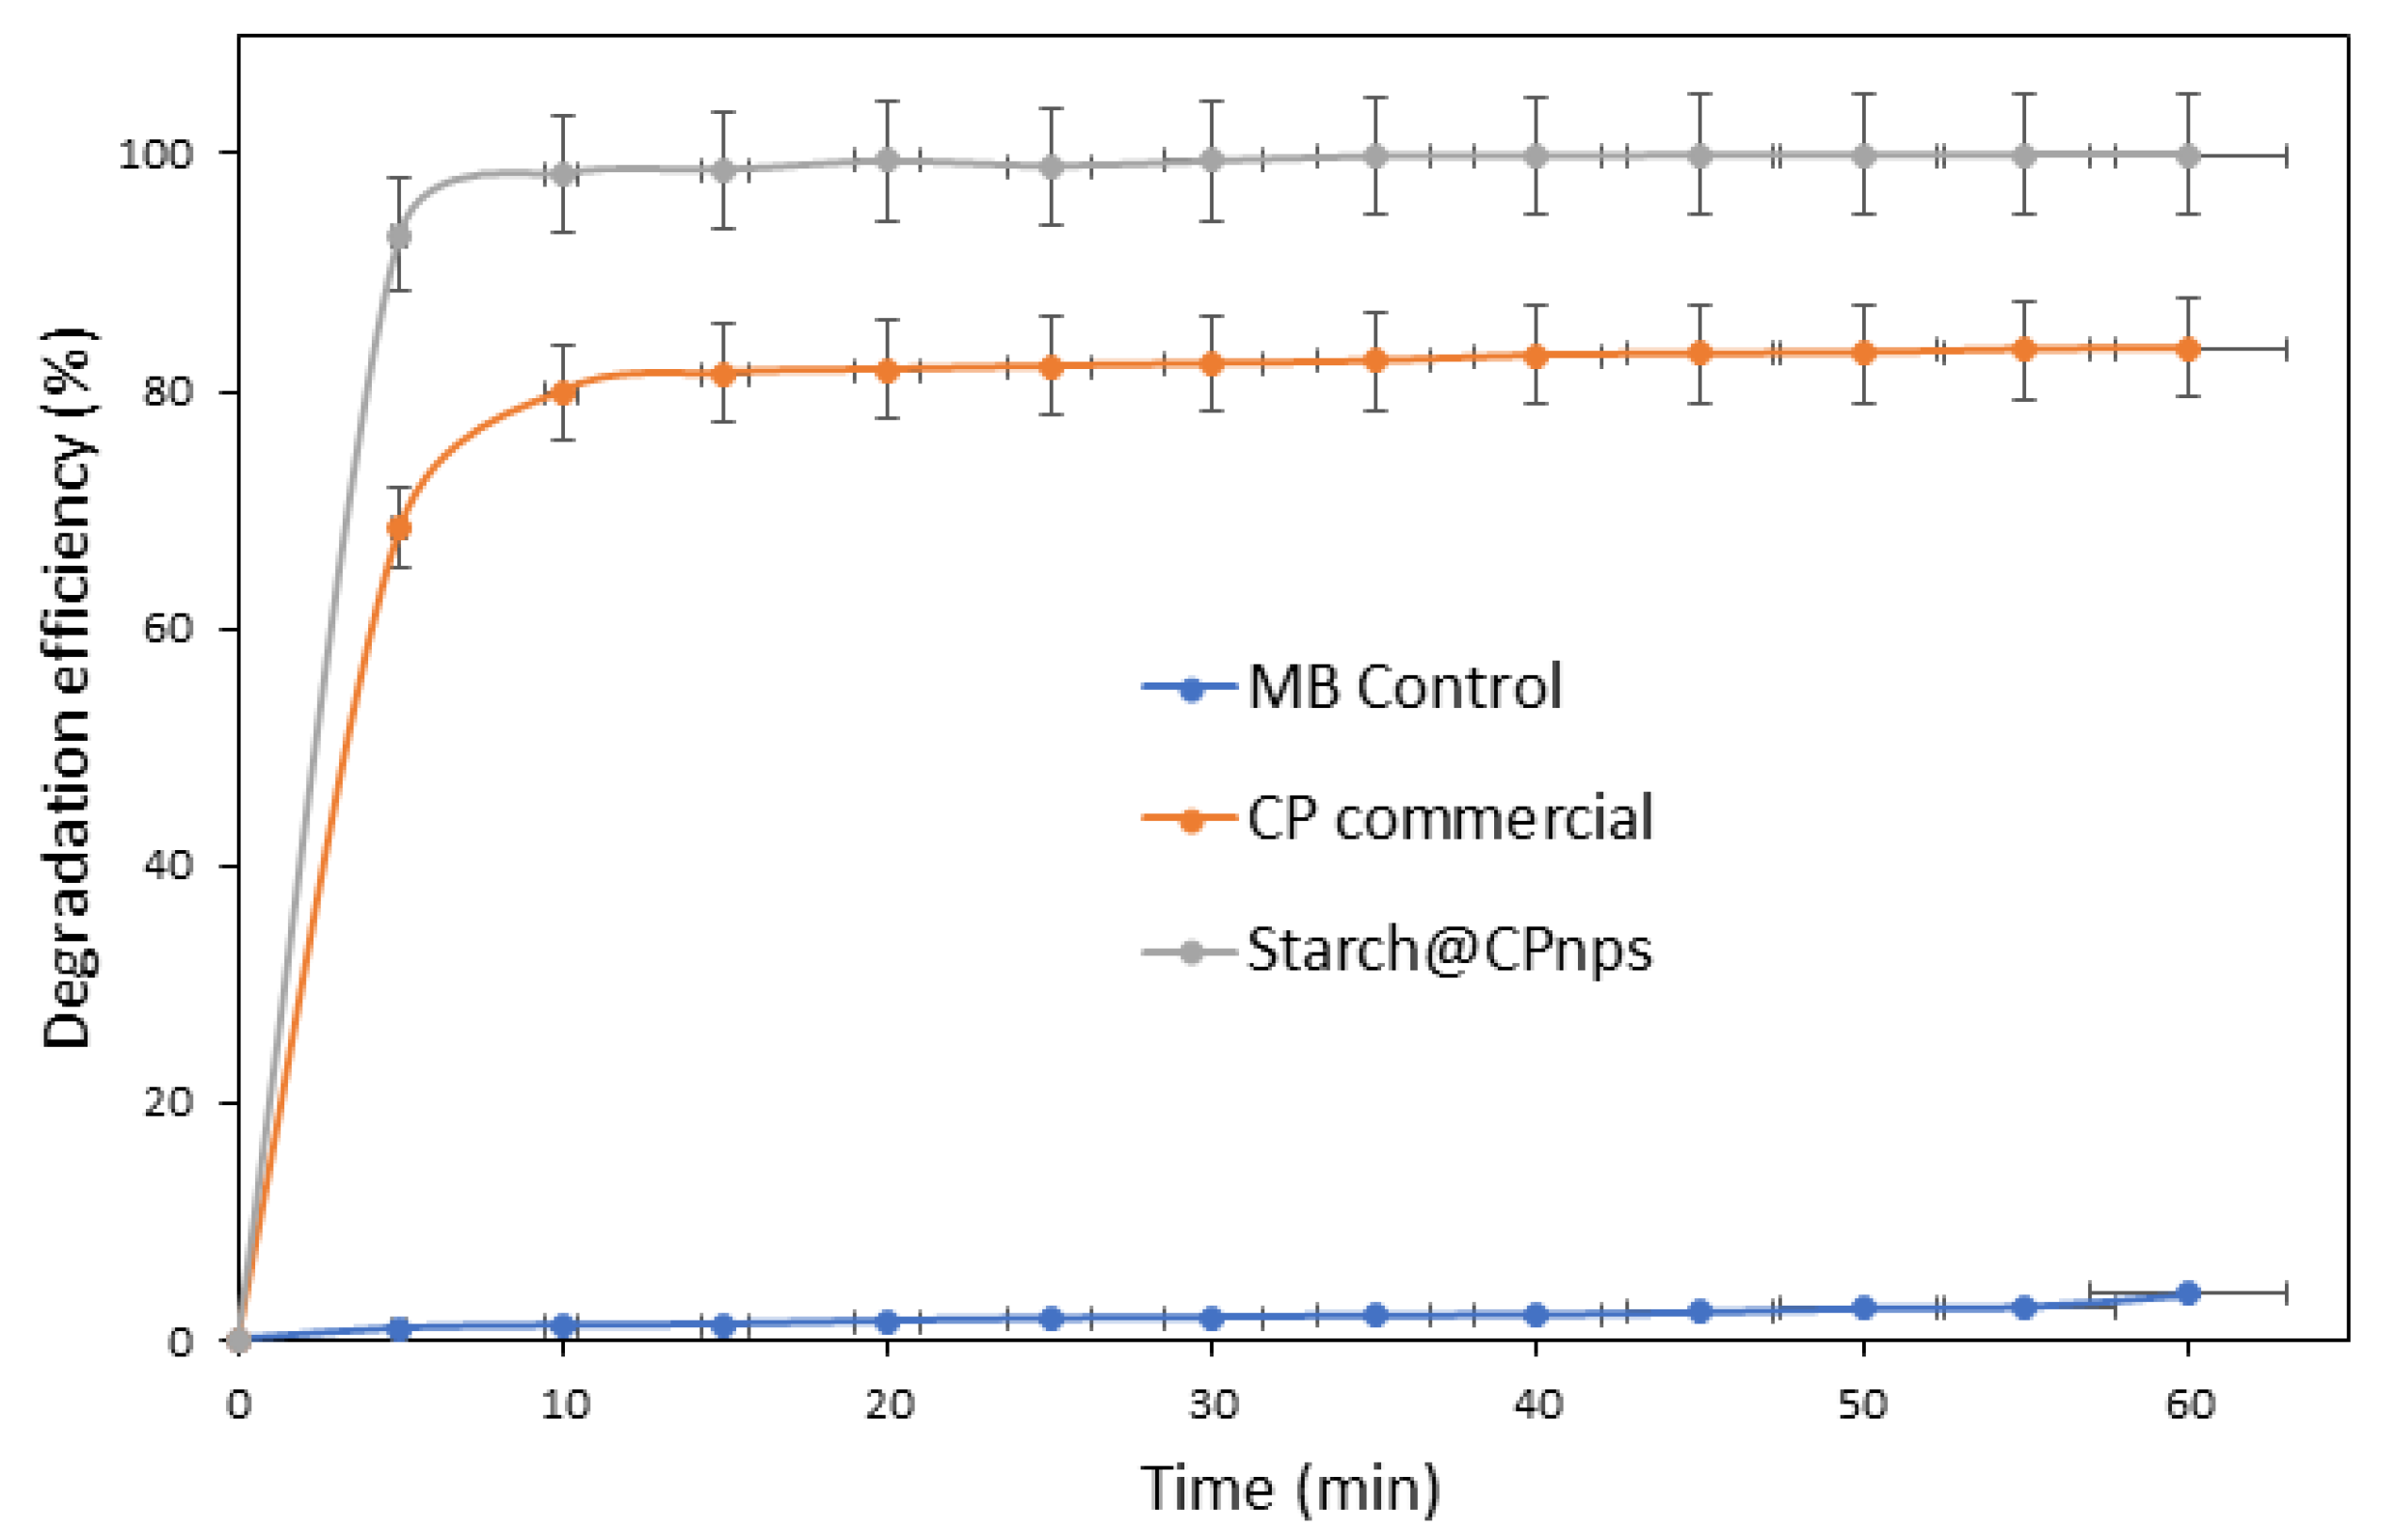
- Effect of Contact Time
4. Kinetics Study
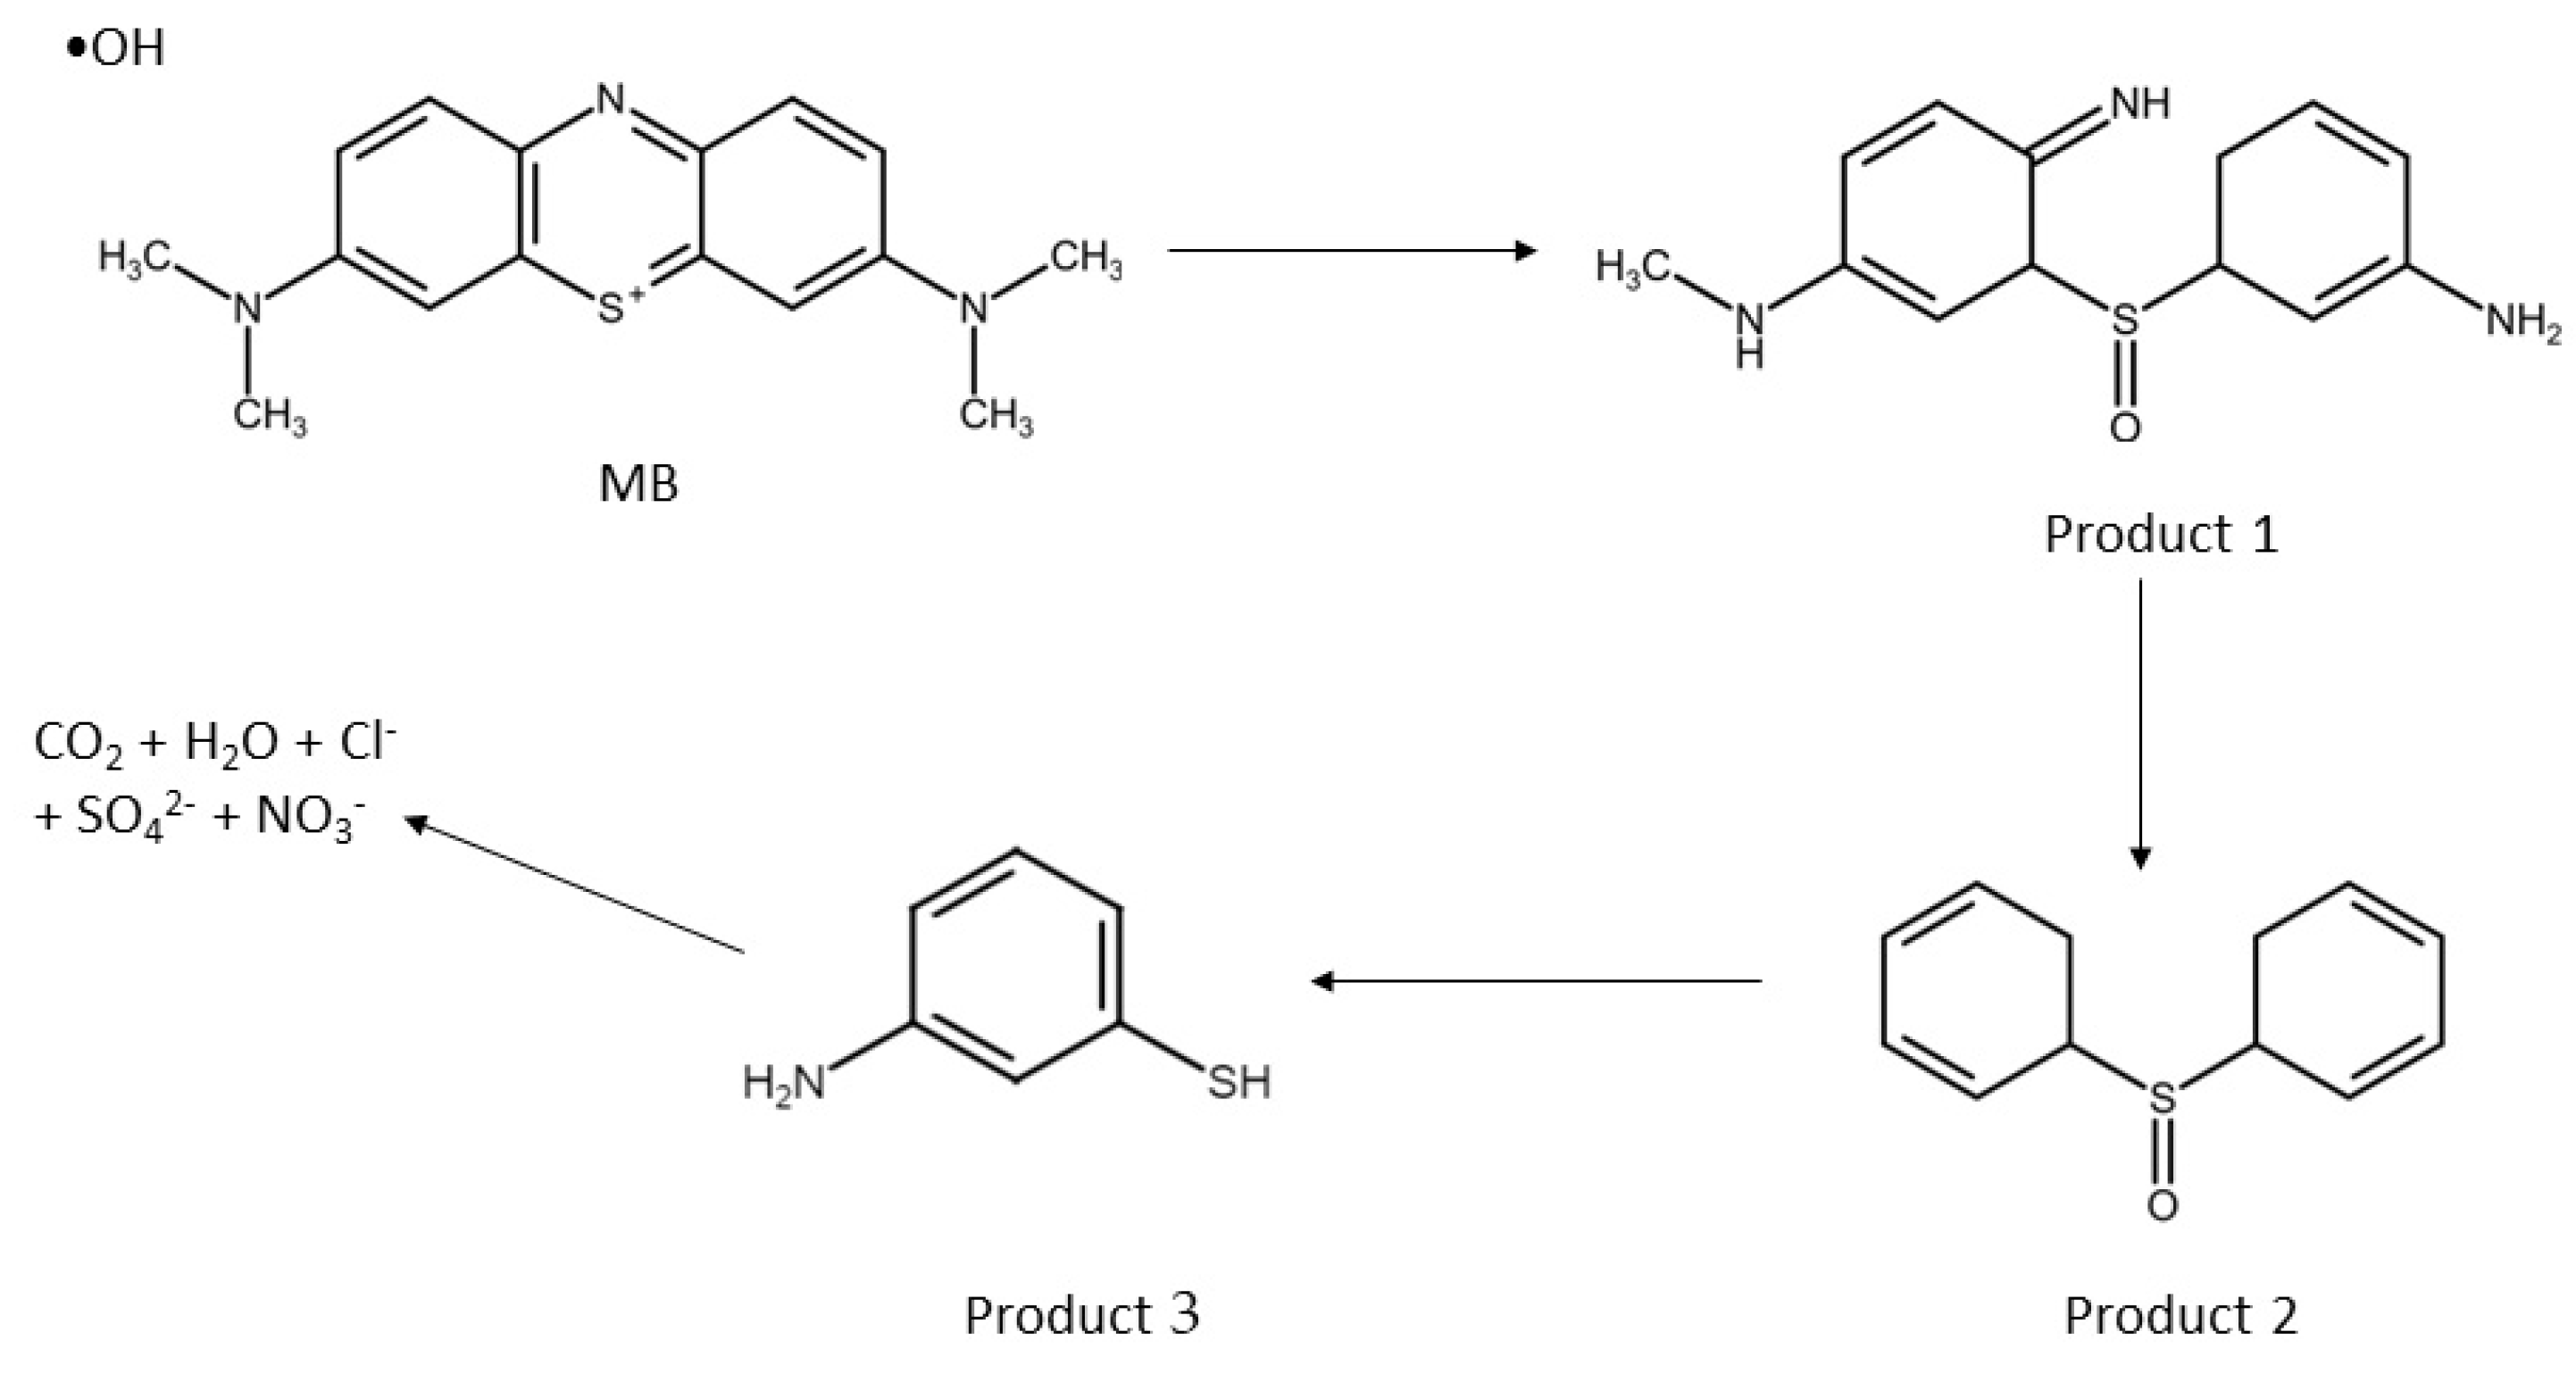
5. Proposed Degradation Pathway
6. Conclusions
Author Contributions
Funding
Institutional Review Board Statement
Informed Consent Statement
Data Availability Statement
Acknowledgments
Conflicts of Interest
References
- Qin, Q.; Liu, Y.; Li, X.; Sun, T.; Xu, Y. Enhanced heterogeneous Fenton-like degradation of methylene blue by reduced CuFe2O4. RSC Adv. 2018, 8, 1071–1077. [Google Scholar] [CrossRef]
- Ethaib, S.; Zubaidi, S.L. Removal of Methylene Blue Dye from Aqueous Solution Using Kaolin. IOP Conf. Ser. Mater. Sci. Eng. 2020, 928, 022030. [Google Scholar] [CrossRef]
- Wang, Z.; Gao, M.; Li, X.; Ning, J.; Zhou, Z.; Li, G. Efficient adsorption of methylene blue from aqueous solution by graphene oxide modified persimmon tannins. Mater. Sci. Eng. C 2020, 108, 110196. [Google Scholar] [CrossRef] [PubMed]
- Andrade Siqueira, T.C.; Zanette da Silva, I.; Rubio, A.J.; Bergamasco, R.; Gasparotto, F.; Aparecida de Souza Paccola, E.; Ueda Yamaguchi, N. Sugarcane bagasse as an efficient biosorbent for methylene blue removal: Kinetics, isotherms and thermodynamics. Int. J. Environ. Res. Public Health 2020, 17, 526. [Google Scholar] [CrossRef] [PubMed]
- Liu, N.; Wu, Y. Removal of methylene blue by electrocoagulation: A study of the effect of operational parameters and mechanism. Ionics 2019, 25, 3953–3960. [Google Scholar] [CrossRef]
- Channei, D.; Khanitchaidecha, W.; Nakaruk, A.; Sci, C.J.M.; Pantorlao, W. Decolorization of Methylene Blue Solution by Electrocoagulation Using Aluminum Electrodes. 2018. Available online: http://epg.science.cmu.ac.th/ejournal/ (accessed on 30 January 2023).
- Salimi, A.; Roosta, A. Experimental solubility and thermodynamic aspects of methylene blue in different solvents. Thermochim. Acta 2019, 675, 134–139. [Google Scholar] [CrossRef]
- Saufi, H.; el Alouani, M.; Alehyen, S.; el Achouri, M.; Aride, J.; Taibi, M. Photocatalytic Degradation of Methylene Blue from Aqueous Medium onto Perlite-Based Geopolymer. Int. J. Chem. Eng. 2020, 2020, 9498349. [Google Scholar] [CrossRef]
- Vasiljevic, Z.Z.; Dojcinovic, M.P.; Vujancevic, J.D.; Jankovic-Castvan, I.; Ognjanovic, M.; Tadic, N.B.; Stojadinovic, S.; Brankovic, G.O.; Nikolic, M.V. Photocatalytic degradation of methylene blue under natural sunlight using iron titanate nanoparticles prepared by a modified sol-gel method: Methylene blue degradation with Fe2TiO5. R. Soc. Open Sci. 2020, 7, 9. [Google Scholar] [CrossRef]
- Mohammed, H.A.; Khaleefa, S.A.; Basheer, M.I. Photolysis of methylene blue dye using an advanced oxidation process (ultraviolet light and hydrogen peroxide). J. Eng. Sustain. Dev. 2022, 25, 59–67. [Google Scholar] [CrossRef]
- Jawad, N.H.; Najim, S.T. Removal of Methylene Blue by Direct Electrochemical Oxidation Method Using a Graphite Anode. IOP Conf. Ser. Mater. Sci. Eng. 2018, 454, 012023. [Google Scholar] [CrossRef]
- Nwanebu, E.O.; Liu, X.; Pajootan, E.; Yargeau, V.; Omanovic, S. Electrochemical degradation of methylene blue using a ni-co-oxide anode. Catalysts 2021, 11, 793. [Google Scholar] [CrossRef]
- Karim, M.A.H.; Aziz, K.H.H.; Omer, K.M.; Salih, Y.M.; Mustafa, F.; Rahman, K.O.; Mohammad, Y. Degradation of aqueous organic dye pollutants by heterogeneous photo-assisted Fenton-like process using natural mineral activator: Parameter optimization and degradation kinetics. IOP Conf. Ser. Earth Environ. Sci. 2022, 958, 012011. [Google Scholar] [CrossRef]
- Amerhaider Nuar, N.N.; Md. Jamil, S.N.A.; Li, F.; Mat Azmi, I.D.; Chiang, P.-C.; Choong, T.S.Y. Synthesis of Controlled-Release Calcium Peroxide Nanoparticles Coated with Dextran for Removal of Doxycycline from Aqueous System. Polymers 2022, 14, 3866. [Google Scholar] [CrossRef] [PubMed]
- Kim, J.G.; Kim, H.B.; Jeong, W.G.; Baek, K. Enhanced-oxidation of sulfanilamide in groundwater using combination of calcium peroxide and pyrite. J. Hazard Mater. 2021, 419, 126514. [Google Scholar] [CrossRef]
- Hung, C.M.; Chen, C.W.; Huang, C.P.; Di Dong, C. Degradation of 4-nonylphenol in marine sediments using calcium peroxide activated by water hyacinth (Eichhornia crassipes)-derived biochar. Environ. Res. 2022, 211, 113076. [Google Scholar] [CrossRef] [PubMed]
- Lu, Z.; Zeng, G.; Zhou, Z.; Liu, Y.; Wang, P.; Sheng, X.; Dong, J.; Idress, A.; Sui, Q.; Lyu, S. Effective degradation of 1,2-dichloroethane in calcium peroxide activated by Fe(III): Performance and mechanisms. Water Supply 2022, 22, 5589–5602. [Google Scholar] [CrossRef]
- Madan, S.S.; Upwanshi W, A.; Wasewar, K.L. 1. Adsorption of α-Toluic Acid by Calcium Peroxide.pdf, 57; Taylor & Francis: Abingdon, UK, 2015; pp. 16507–16513. [Google Scholar] [CrossRef]
- Jamdagni, P.; Khatri, P.; Rana, J.S. Green synthesis of zinc oxide nanoparticles using flower extract of Nyctanthes arbor-tristis and their antifungal activity. J. King Saud. Univ. Sci. 2018, 30, 168–175. [Google Scholar] [CrossRef]
- Rastinfard, A.; Nazarpak, M.H.; Moztarzadeh, F. Controlled chemical synthesis of CaO2 particles coated with polyethylene glycol: Characterization of crystallite size and oxygen release kinetics. RSC Adv. 2018, 8, 91–101. [Google Scholar] [CrossRef]
- Zhu, Q.; Zhang, W.; Cai, J.; Li, J.; Zhong, L.; Pu, S.; Li, A. Morphology-controlled synthesis of gold nanoparticles with chitosan for catalytic reduction of nitrophenol. Colloids Surf. A Phys. Eng. Asp. 2022, 640, 128471. [Google Scholar] [CrossRef]
- Bai, B.; Xu, X.; Li, C.; Xing, J.; Wang, H.; Suo, Y. Magnetic Fe3O4@Chitosan carbon microbeads: Removal of doxycycline from aqueous solutions through a fixed bed via sequential adsorption and heterogeneous fenton-like regeneration. J. Nanomater. 2018, 2018, 52964. [Google Scholar] [CrossRef]
- Su, H.; Han, X.; He, L.; Deng, L.; Yu, K.; Jiang, H.; Wu, C.; Jia, Q.; Shan, S. Synthesis and characterization of magnetic dextran nanogel doped with iron oxide nanoparticles as magnetic resonance imaging probe. Int. J. Biol. Macromol. 2019, 128, 768–774. [Google Scholar] [CrossRef] [PubMed]
- Shen, S.; Mamat, M.; Zhang, S.; Cao, J.; Hood, Z.D.; Figueroa-Cosme, L.; Xia, Y. Synthesis of CaO2 Nanocrystals and Their Spherical Aggregates with Uniform Sizes for Use as a Biodegradable Bacteriostatic Agent. Small 2019, 15, 1902118. [Google Scholar] [CrossRef] [PubMed]
- Jung, J.; Raghavendra, G.M.; Kim, D.; Seo, J. One-step synthesis of starch-silver nanoparticle solution and its application to antibacterial paper coating. Int. J. Biol. Macromol. 2018, 107, 2285–2290. [Google Scholar] [CrossRef]
- Pascu, B.; Negrea, A.; Ciopec, M.; Duteanu, N.; Negrea, P.; Nemeş, N.S.; Seiman, C.; Marian, E.; Micle, O. A green, simple and facile way to synthesize silver nanoparticles using soluble starch. Ph studies and antimicrobial applications. Materials 2021, 14, 4765. [Google Scholar] [CrossRef] [PubMed]
- Kazemi, M.; Akbari, A.; Sabouri, Z.; Soleimanpour, S.; Zarrinfar, H.; Khatami, M.; Darroudi, M. Green synthesis of colloidal selenium nanoparticles in starch solutions and investigation of their photocatalytic, antimicrobial, and cytotoxicity effects. Bioprocess Biosyst. Eng. 2021, 44, 1215–1225. [Google Scholar] [CrossRef] [PubMed]
- De, S.; Lutkenhaus, J.L. Corrosion behaviour of eco-friendly airbrushed reduced graphene oxide-poly(vinyl alcohol) coatings. Green Chem. 2018, 20, 506–514. [Google Scholar] [CrossRef]
- Li, J.; Wang, Z.; Zhang, H.; Gao, J.; Zheng, A. Progress in the development of stabilization strategies for nanocrystal preparations. Drug. Deliv. 2021, 28, 19–36. [Google Scholar] [CrossRef]
- Morán, D.; Gutiérrez, G.; Blanco-López, M.C.; Marefati, A.; Rayner, M.; Matos, M. Synthesis of starch nanoparticles and their applications for bioactive compound encapsulation. Appl. Sci. 2021, 11, 4547. [Google Scholar] [CrossRef]
- Zhang, T.; Han, Z.; Zhang, W.; Wang, J.; Xu, L. Cyanoacrylate-encapsulated calcium peroxide achieved oxygen-sustained release and promoted wound healing. Int. J. Polym. Mater. Polym. Biomater. 2020, 69, 703–708. [Google Scholar] [CrossRef]
- Momina; Mohammad, S.; Suzylawati, I. Study of the adsorption/desorption of MB dye solution using bentonite adsorbent coating. J. Water Process Eng. 2020, 34, 101155. [Google Scholar] [CrossRef]
- Pathania, D.; Sharma, S.; Singh, P. Removal of methylene blue by adsorption onto activated carbon developed from Ficus carica bast. Arab. J. Chem. 2017, 10, S1445–S1451. [Google Scholar] [CrossRef]
- Yeh, C.; Wang, R.; Chang, W.; Shih, Y. Synthesis and characterization of stabilized oxygen-releasing CaO2 nanoparticles for bioremediation. J Environ. Manag. 2018, 212, 17–22. [Google Scholar] [CrossRef] [PubMed]
- Abdullah, A.H.D.; Chalimah, S.; Primadona, I.; Hanantyo, M.H.G. Physical and chemical properties of corn, cassava, and potato starchs. IOP Conf. Ser. Earth Environ. Sci. Pap. 2018, 160, 012003. [Google Scholar] [CrossRef]
- Nikonenko, N.A.; Buslov, D.K.; Sushko, N.I.; Zhbankov, R.G. Spectroscopic manifestation of stretching vibrations of glycosidic linkage in polysaccharides. J. Mol. Struct. 2005, 752, 20–24. [Google Scholar] [CrossRef]
- Dedecan, T.; Baylan, N.; İnci, İ. Synthesis, characterization and application of calcium peroxide nanoparticles as a novel adsorbent for removal of malic acid from aqueous solutions. Chem. Phys. Lett. 2022, 797, 139581. [Google Scholar] [CrossRef]
- Sun, Y.; Lyu, S.; Brusseau, M.L.; Tang, P.; Jiang, W.; Gu, M.; Li, M.; Lyu, Y.; Qiu, Z.; Sui, Q. Degradation of trichloroethylene in aqueous solution by nanoscale calcium peroxide in the Fe(II)-based catalytic environments. Sep. Purif. Technol. 2019, 226, 13–21. [Google Scholar] [CrossRef]
- Olyaie, E.; Banejad, H.; Afkhami, A.; Rahmani, A.; Khodaveisi, J. Development of a cost-effective technique to remove the arsenic contamination from aqueous solutions by calcium peroxide nanoparticles. Sep. Purif. Technol. 2012, 95, 10–15. [Google Scholar] [CrossRef]
- Ali, M.; Farooq, U.; Lyu, S.; Sun, Y.; Li, M.; Ahmad, A.; Shan, A.; Abbas, Z. Synthesis of controlled release calcium peroxide nanoparticles (CR-nCPs): Characterizations, H2O2 liberate performances and pollutant degradation efficiency. Sep. Purif. Technol. 2020, 241, 116729. [Google Scholar] [CrossRef]
- Zhang, G.; Shen, X.; Yang, Y. Facile synthesis of monodisperse porous ZnO spheres by a soluble starch-assisted method and their photocatalytic activity. J. Phys. Chem. C 2011, 115, 7145–7152. [Google Scholar] [CrossRef]
- Wang, H.; Zhao, Y.; Su, Y.; Li, T.; Yao, M.; Qin, C. Fenton-like degradation of 2,4-dichlorophenol using calcium peroxide particles: Performance and mechanisms. RSC Adv. 2017, 7, 4563–4571. [Google Scholar] [CrossRef]
- Mosmeri, H.; Alaie, E.; Shavandi, M.; Dastgheib, S.M.M.; Tasharrofi, S. Benzene-contaminated groundwater remediation using calcium peroxide nanoparticles: Synthesis and process optimization. Environ. Monit. Assess. 2017, 189, 452. [Google Scholar] [CrossRef]
- De, B.S.; Wasewar, K.L.; Dhongde, V.R.; Sontakke, P.B. Recovery of acrylic acid using calcium peroxide nanoparticles: Thermodynamics and continuous column study. Chem. Biochem. Eng. Q. 2018, 32, 19–28. [Google Scholar] [CrossRef]
- Tavares, M.G.; Santos, D.H.; Tavares, M.G.; Duarte, J.L.; Meili, L.; Pimentel, W.R.; Tonholo, J.; Zanta, C.L. Removal of Reactive Dyes from Aqueous Solution by Fenton Reaction: Kinetic Study and Phytotoxicity Tests. Water Air Soil Pollut. 2020, 231, 82. [Google Scholar] [CrossRef]
- Li, F.; Choong, T.S.Y.; Soltani, S.; Abdullah, L.C.; Md. Jamil, S.N.A. Kinetic Study of Fenton-Like Degradation of Methylene Blue in Aqueous Solution Using Calcium Peroxide. Pertanika J. Sci. Technol. 2022, 30, 1087–1102. [Google Scholar] [CrossRef]
- Zhang, X.; Gu, X.; Lu, S.; Miao, Z.; Xu, M.; Fu, X.; Qiu, Z.; Sui, Q. Application of calcium peroxide activated with Fe(II)-EDDS complex in trichloroethylene degradation. Chemosphere 2016, 160, 1–6. [Google Scholar] [CrossRef] [PubMed]
- Lyngsie, G.; Krumina, L.; Tunlid, A.; Persson, P. Generation of hydroxyl radicals from reactions between a dimethoxyhydroquinone and iron oxide nanoparticles. Sci. Rep. 2018, 8, 10834. [Google Scholar] [CrossRef]
- Khan, I.; Saeed, K.; Zekker, I.; Zhang, B.; Hendi, A.H.; Ahmad, A.; Ahmad, S.; Zada, N.; Ahmad, H.; Shah, L.A.; et al. Review on Methylene Blue: Its Properties, Uses, Toxicity and Photodegradation. Water 2022, 14, 242. [Google Scholar] [CrossRef]
- Mondal, S.; de Anda Reyes, M.E.; Pal, U. Plasmon induced enhanced photocatalytic activity of gold loaded hydroxyapatite nanoparticles for methylene blue degradation under visible light. RSC Adv. 2017, 7, 8633–8645. [Google Scholar] [CrossRef]
- Wang, Q.; Tian, S.; Ning, P. Degradation mechanism of methylene blue in a heterogeneous fenton-like reaction catalyzed by ferrocene. Ind. Eng. Chem. Res. 2014, 53, 643–649. [Google Scholar] [CrossRef]
- Luong, T.H.V.; Nguyen, T.H.T.; Nguyen, B.V.; Nguyen, N.K.; Nguyen, T.Q.C.; Dang, G.H. Efficient degradation of methyl orange and methylene blue in aqueous solution using a novel Fenton-like catalyst of CuCo-ZIFs. Green Process. Synth. 2022, 11, 71–83. [Google Scholar] [CrossRef]


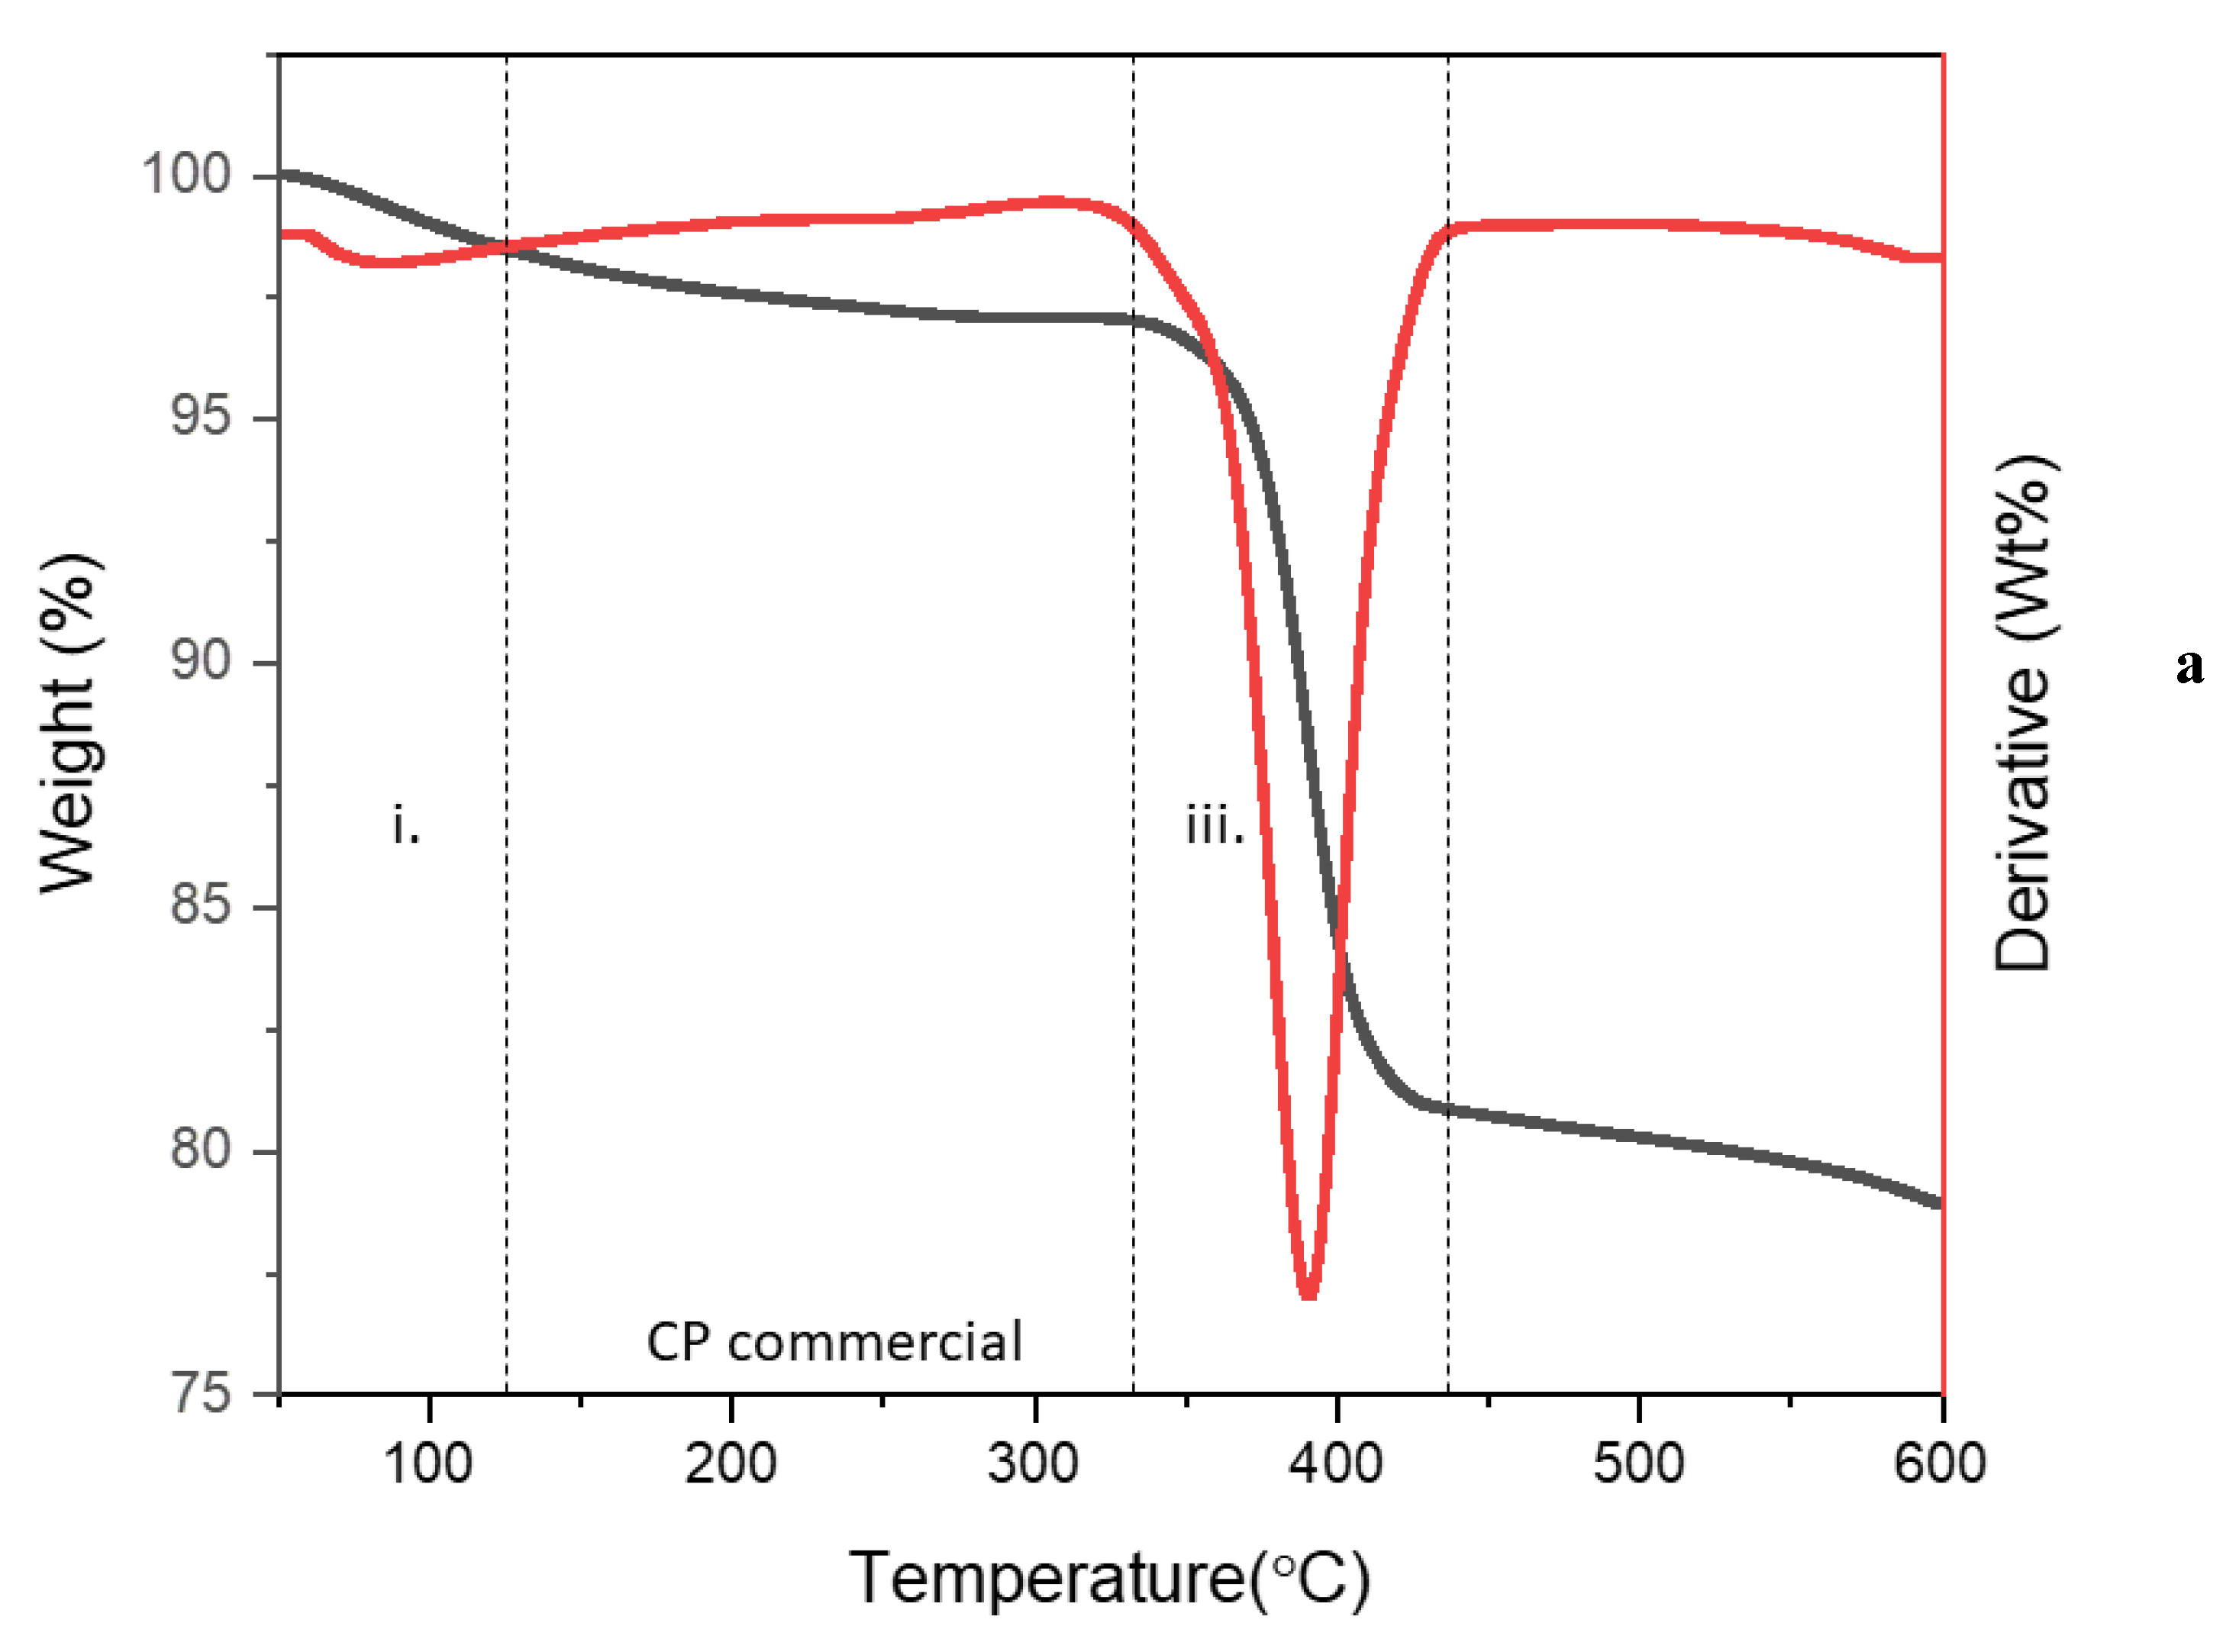
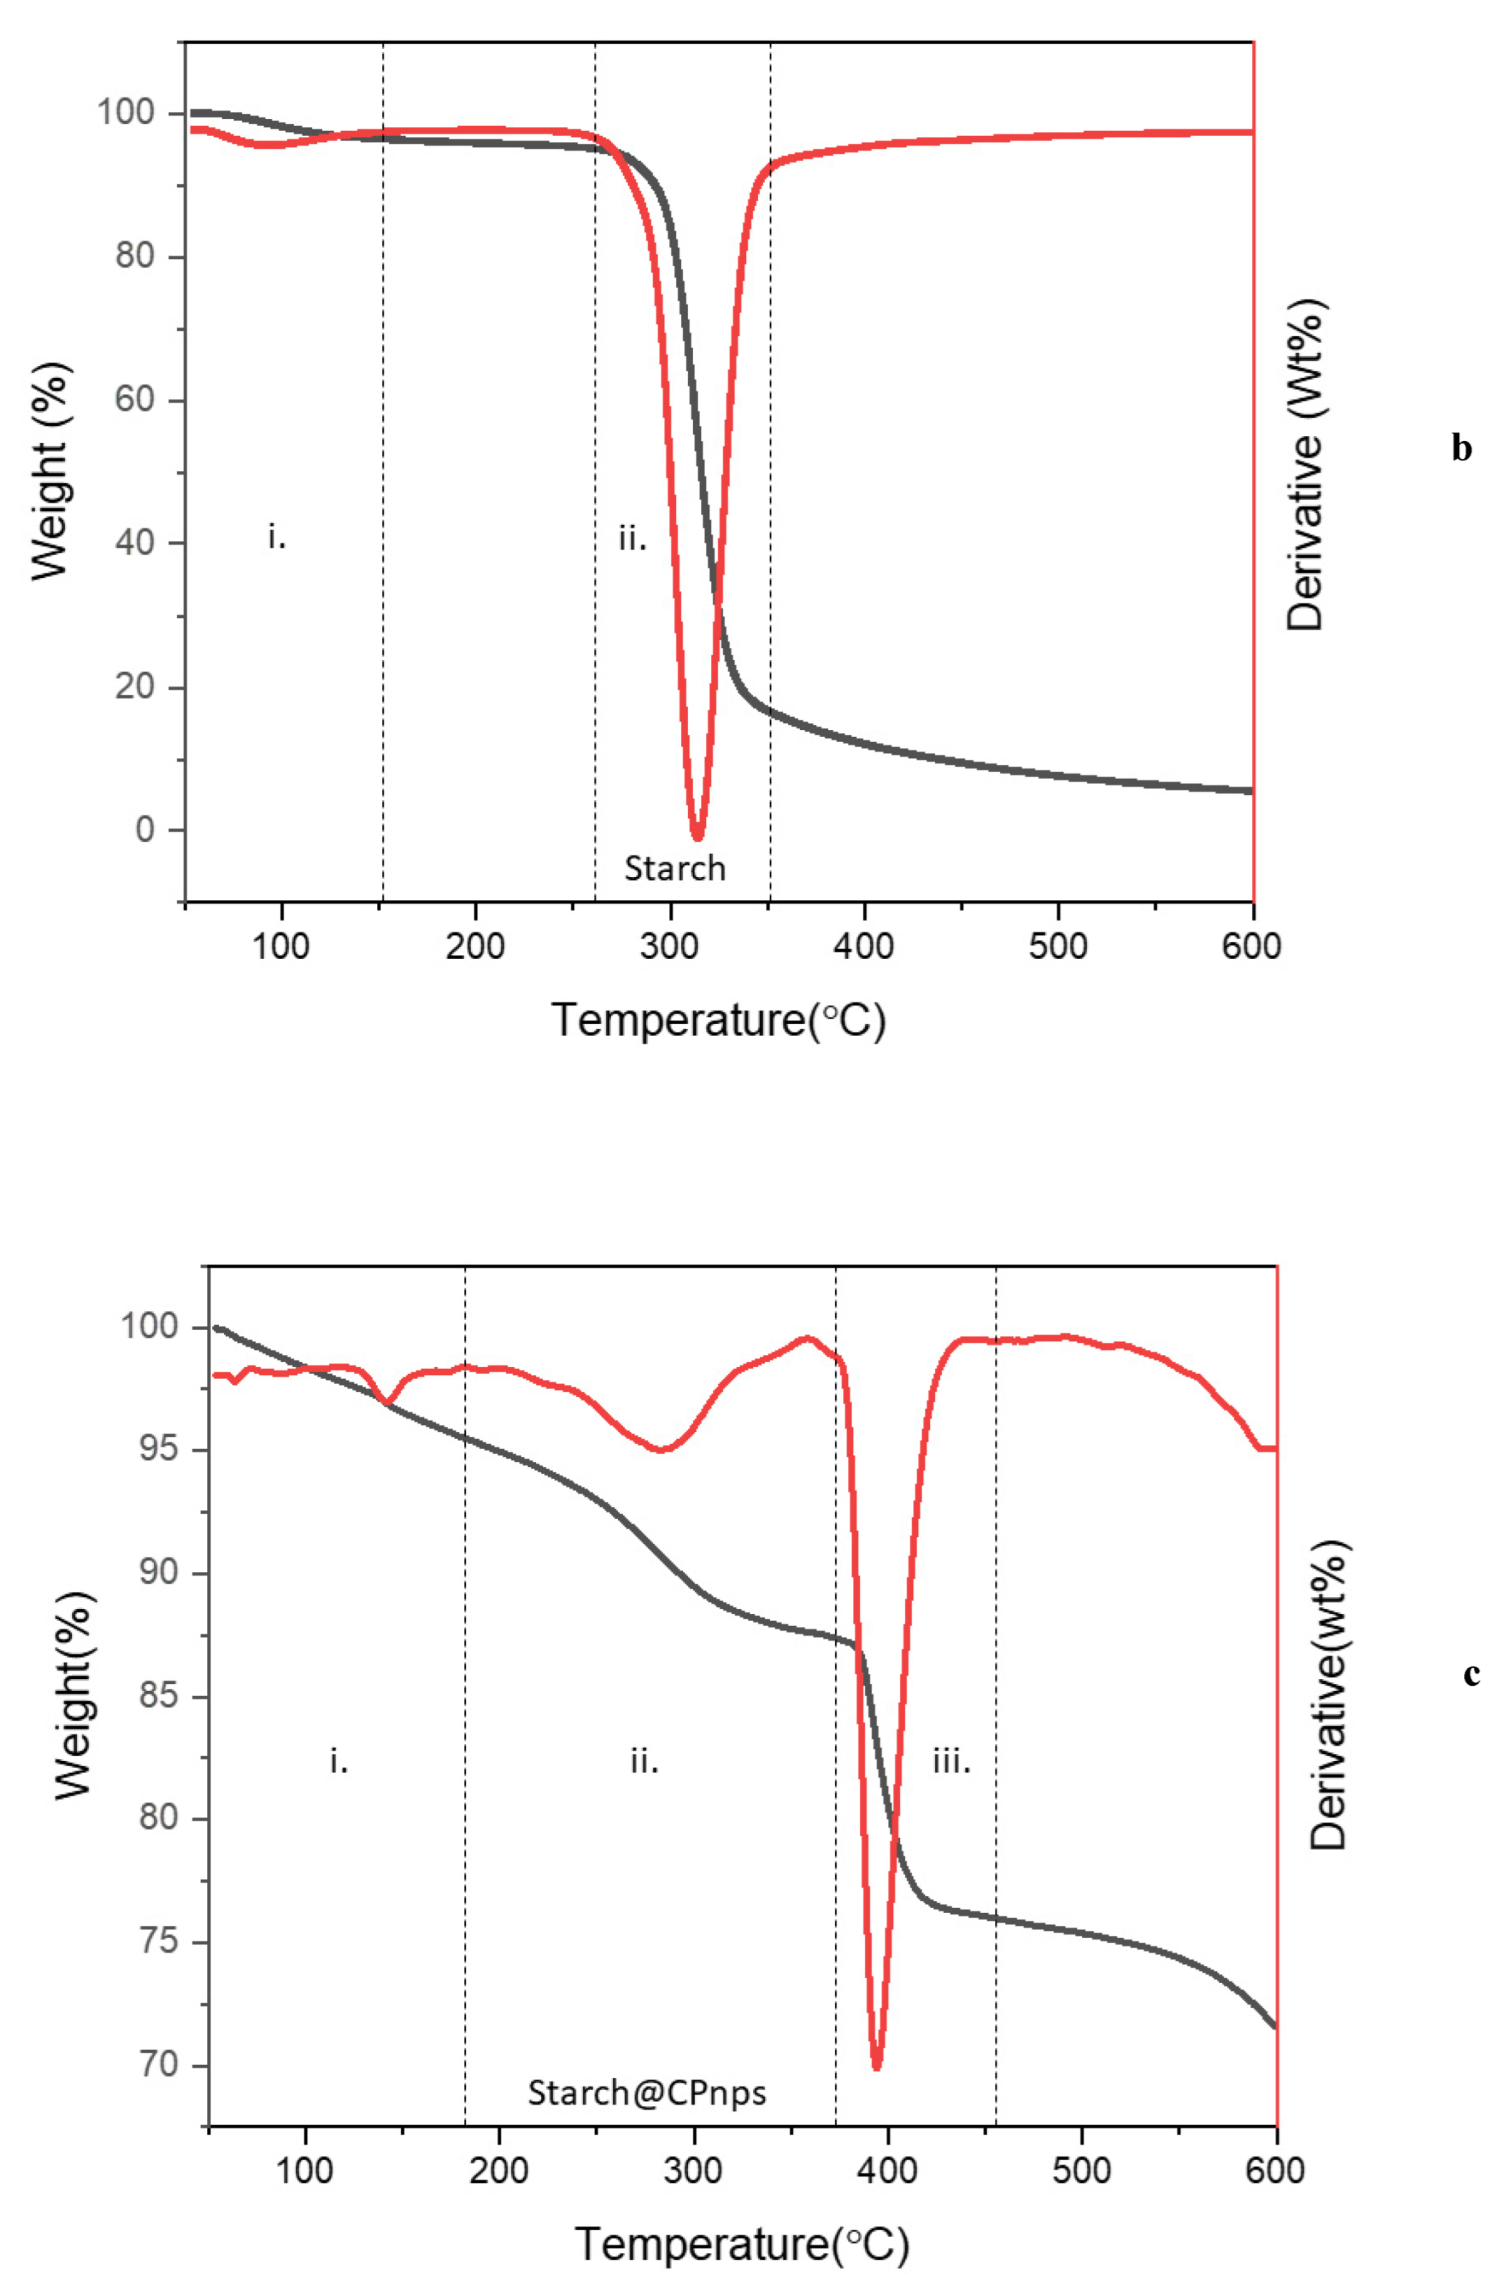
| Sample | Percentage of Residue | Major Thermal Events |
|---|---|---|
| CP commercial | 79% | (i) 88 °C (loss of the adsorbed moisture and the decomposition of impurities) (iii) 391 °C (decomposition of calcium peroxide) |
| Starch | 10% | (i) 100 °C (loss of the adsorbed moisture and the decomposition of impurities) (ii) 256–351 °C (decomposition of polymeric chains of starch) |
| Starch@CPnps | 74% | (i) 54–183 °C (loss of the adsorbed moisture and the decomposition of impurities) (ii) 284 °C (decomposition of polymeric chains of starch) (iii) 394 °C (decomposition of calcium peroxide) |
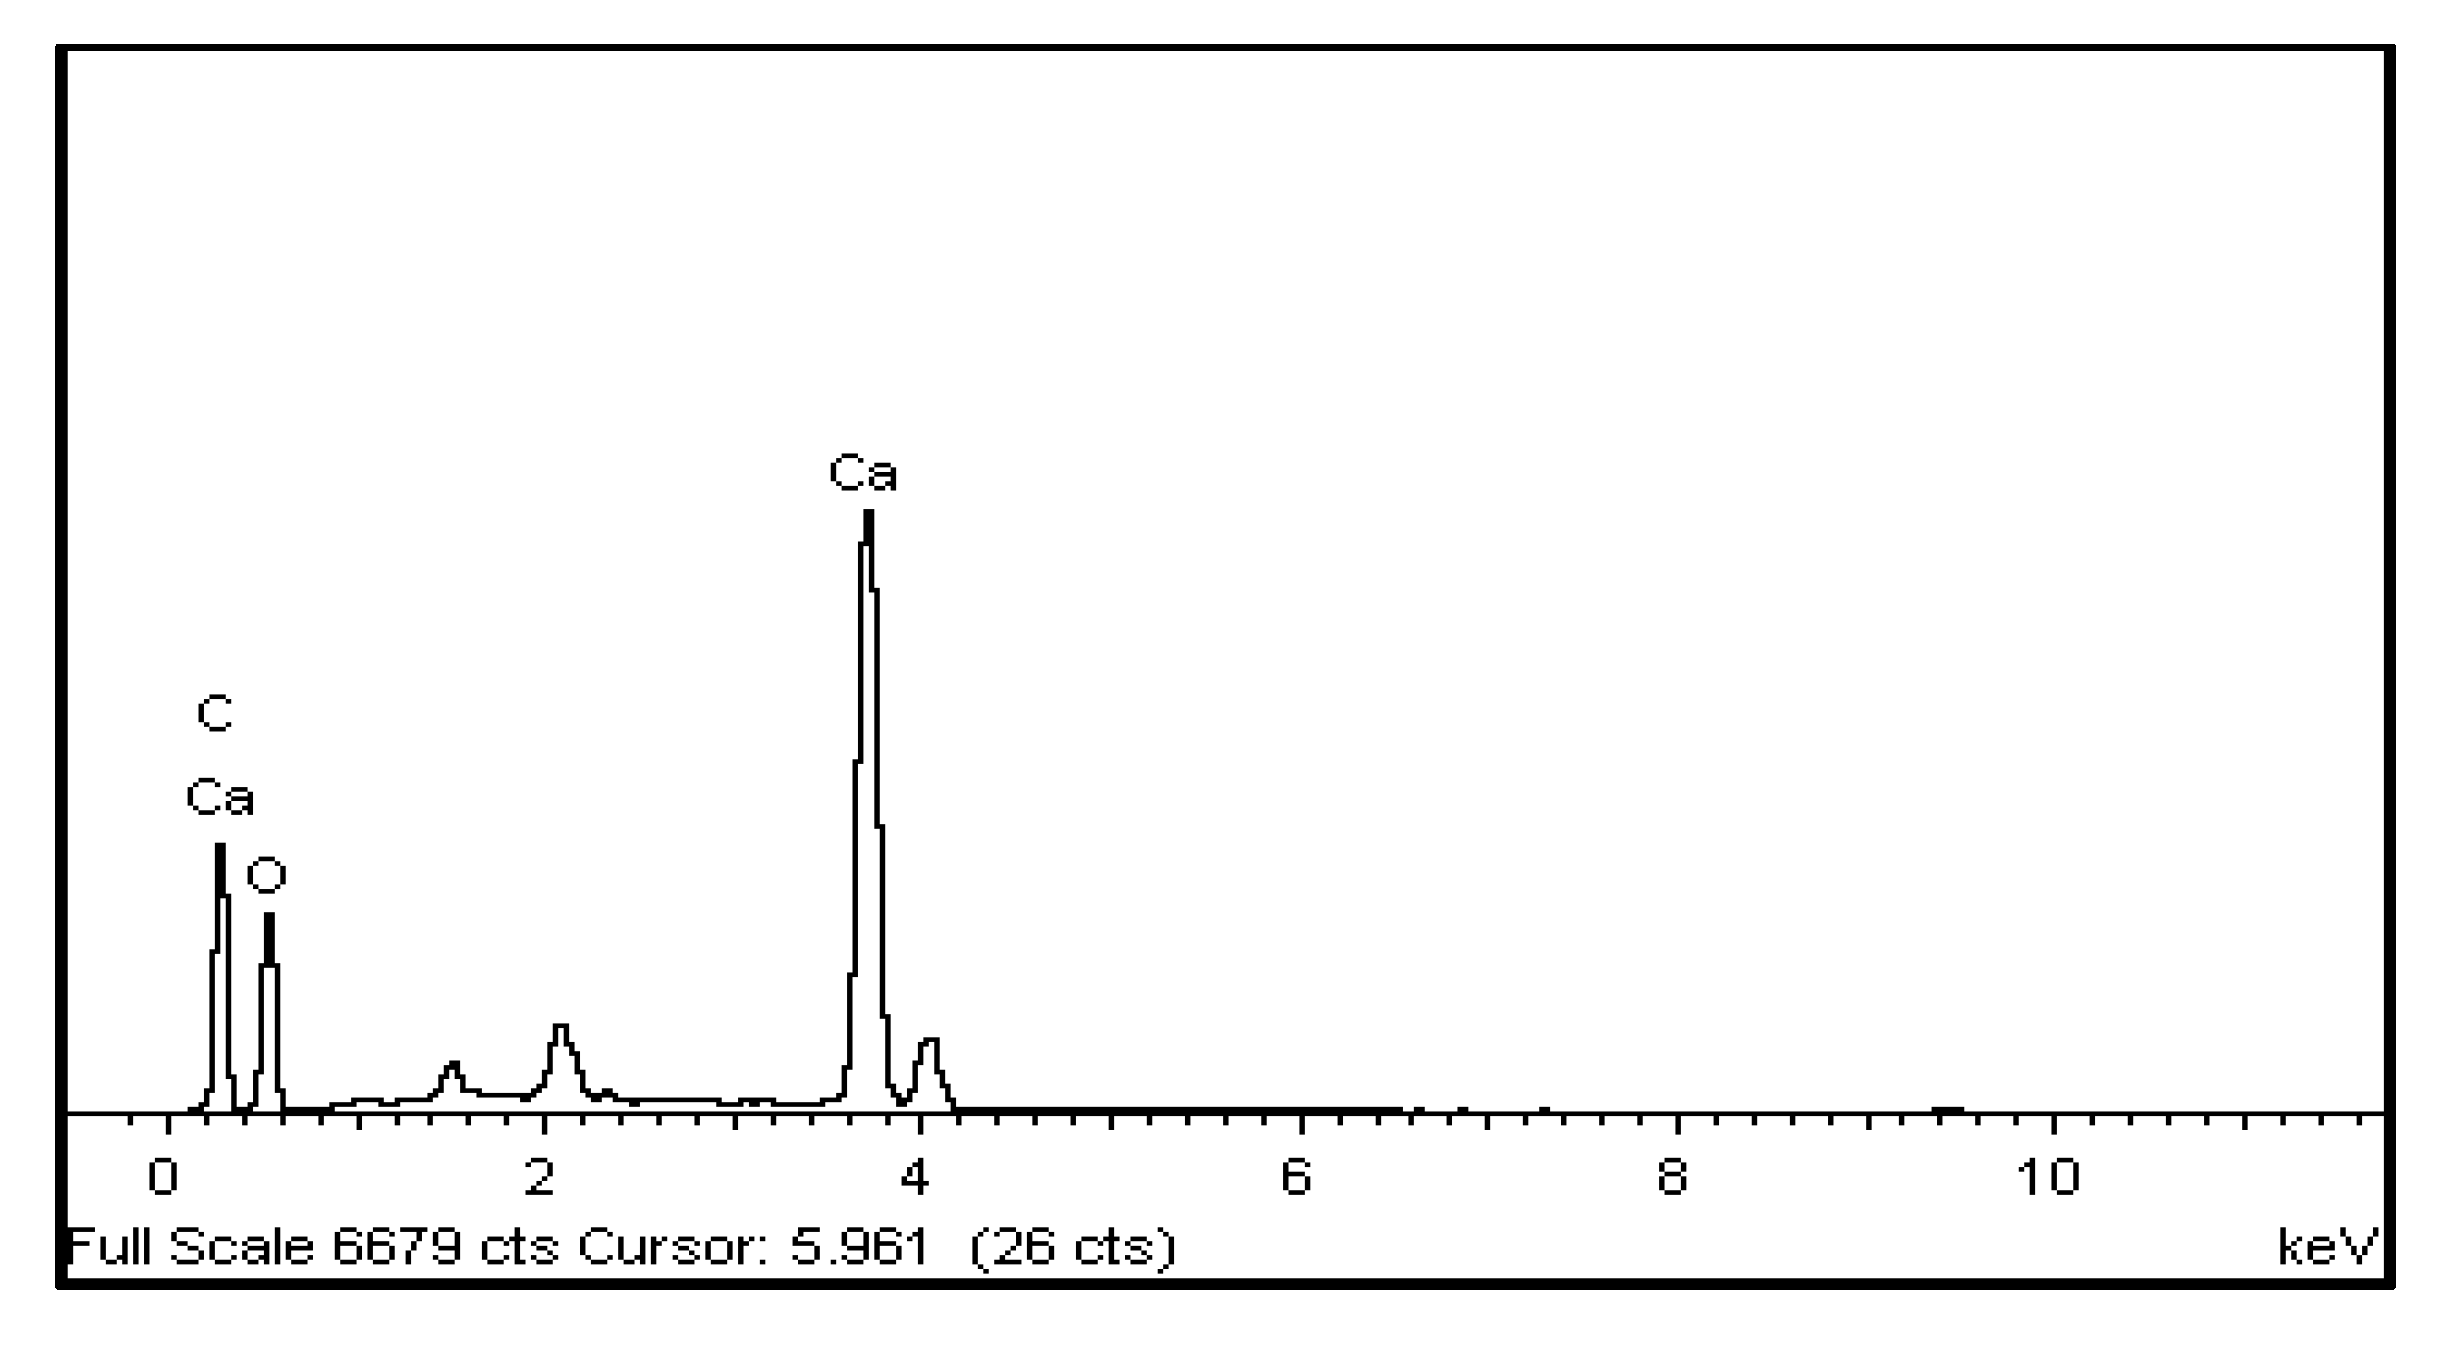
| Elemental Data | Weight (%) | Atomic (%) |
|---|---|---|
| C% | 33.34 | 46.30 |
| O% | 41.12 | 42.83 |
| Ca% | 25.23 | 10.48 |
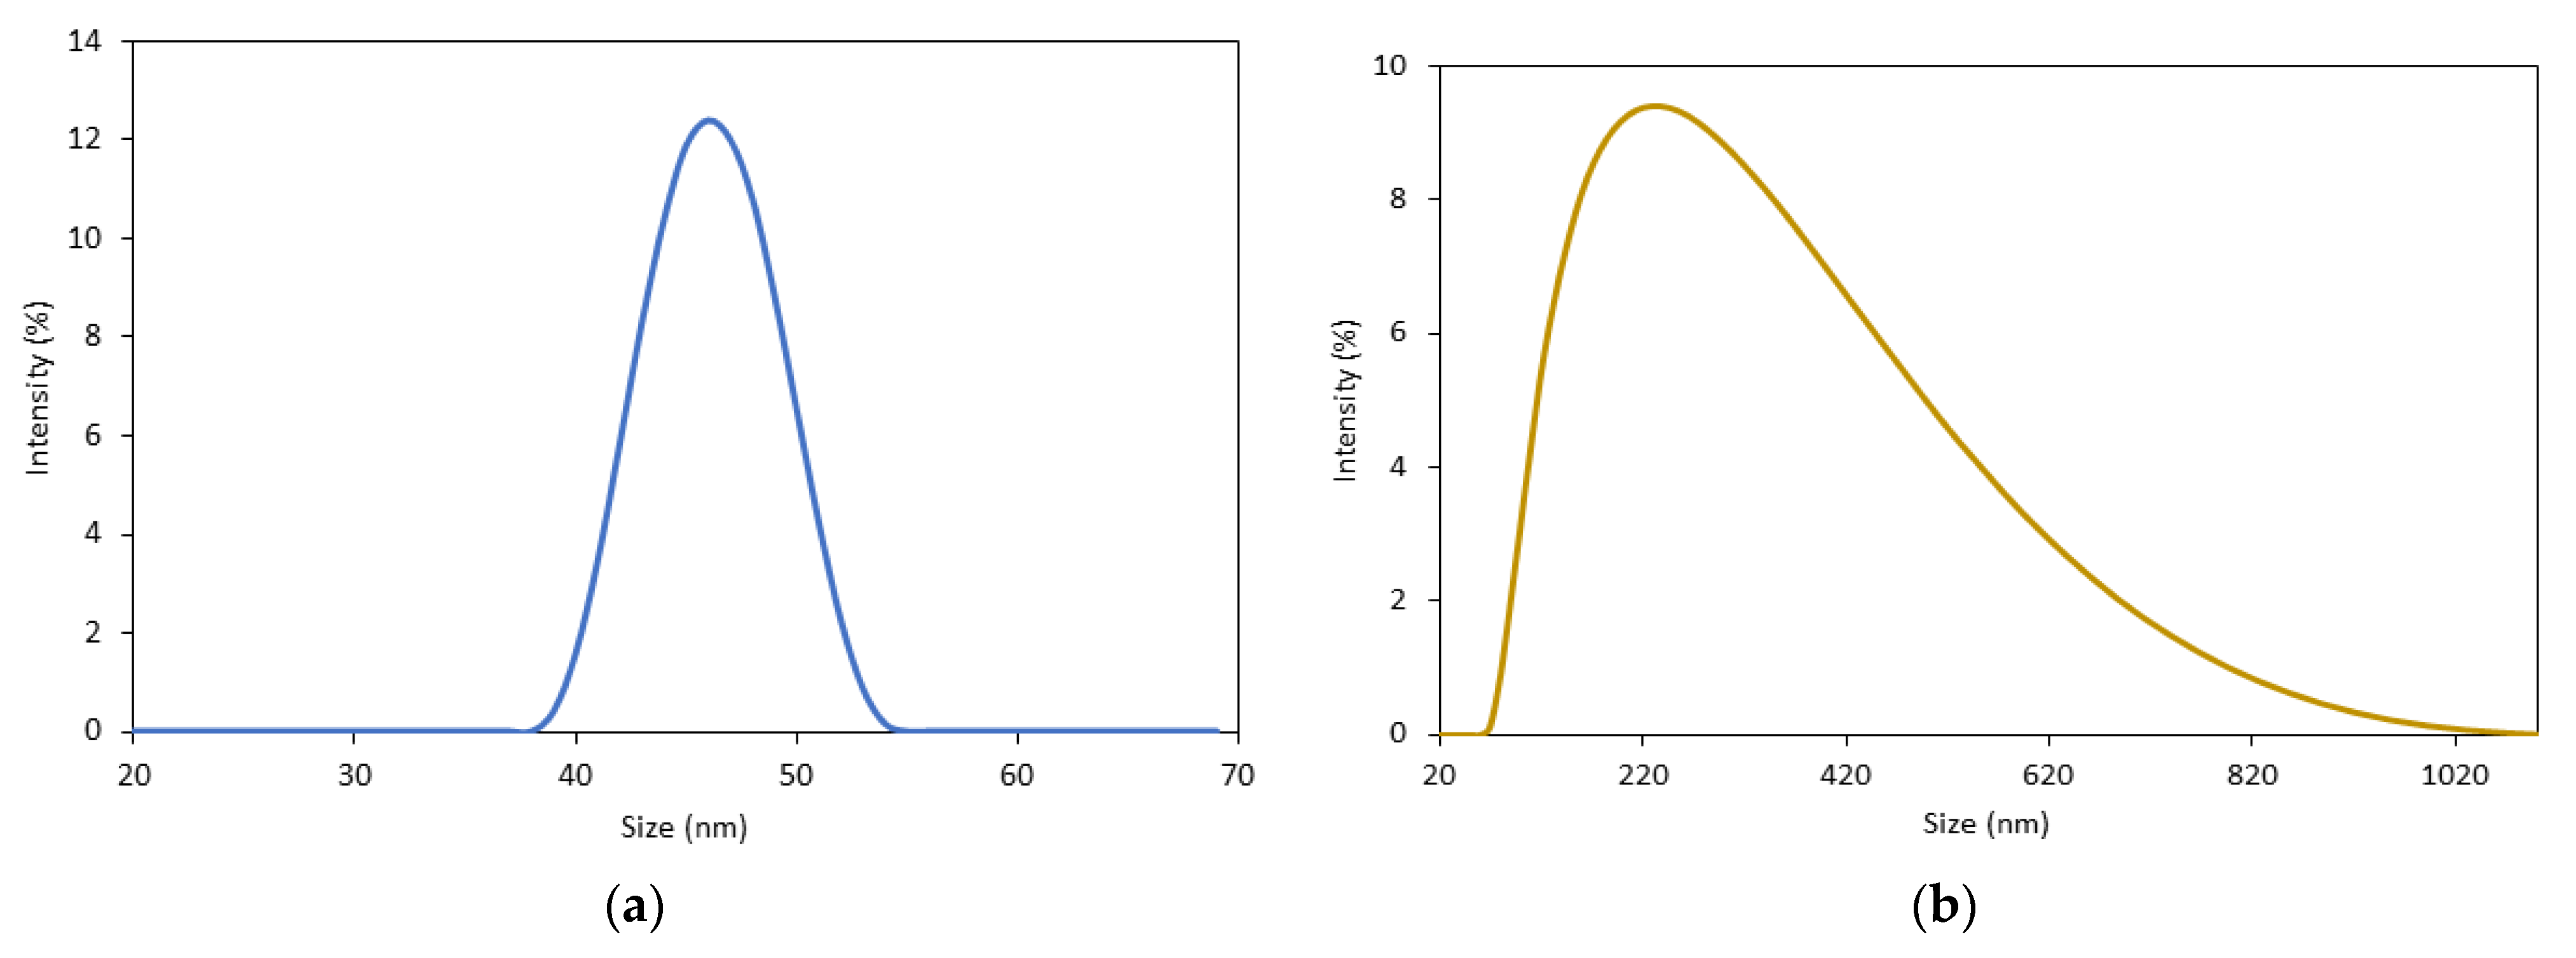
| Permanganate Titration | BET Analysis | DLS Analysis | ||||
|---|---|---|---|---|---|---|
| Sample | CaO2 content | Surface Area (m2/g) | Pore Size (nm) | Pore Volume (cm3/g) | Mean Size (nm) | PDI |
| CP commercial | 65.0% | 1.03 | 30.24 | 1.32 | 200 ± 100 | 0.561 |
| Starch@CPnps | 72.3% | 35.66 | 92.50 | 1.65 | 47±2 | 0.325 |
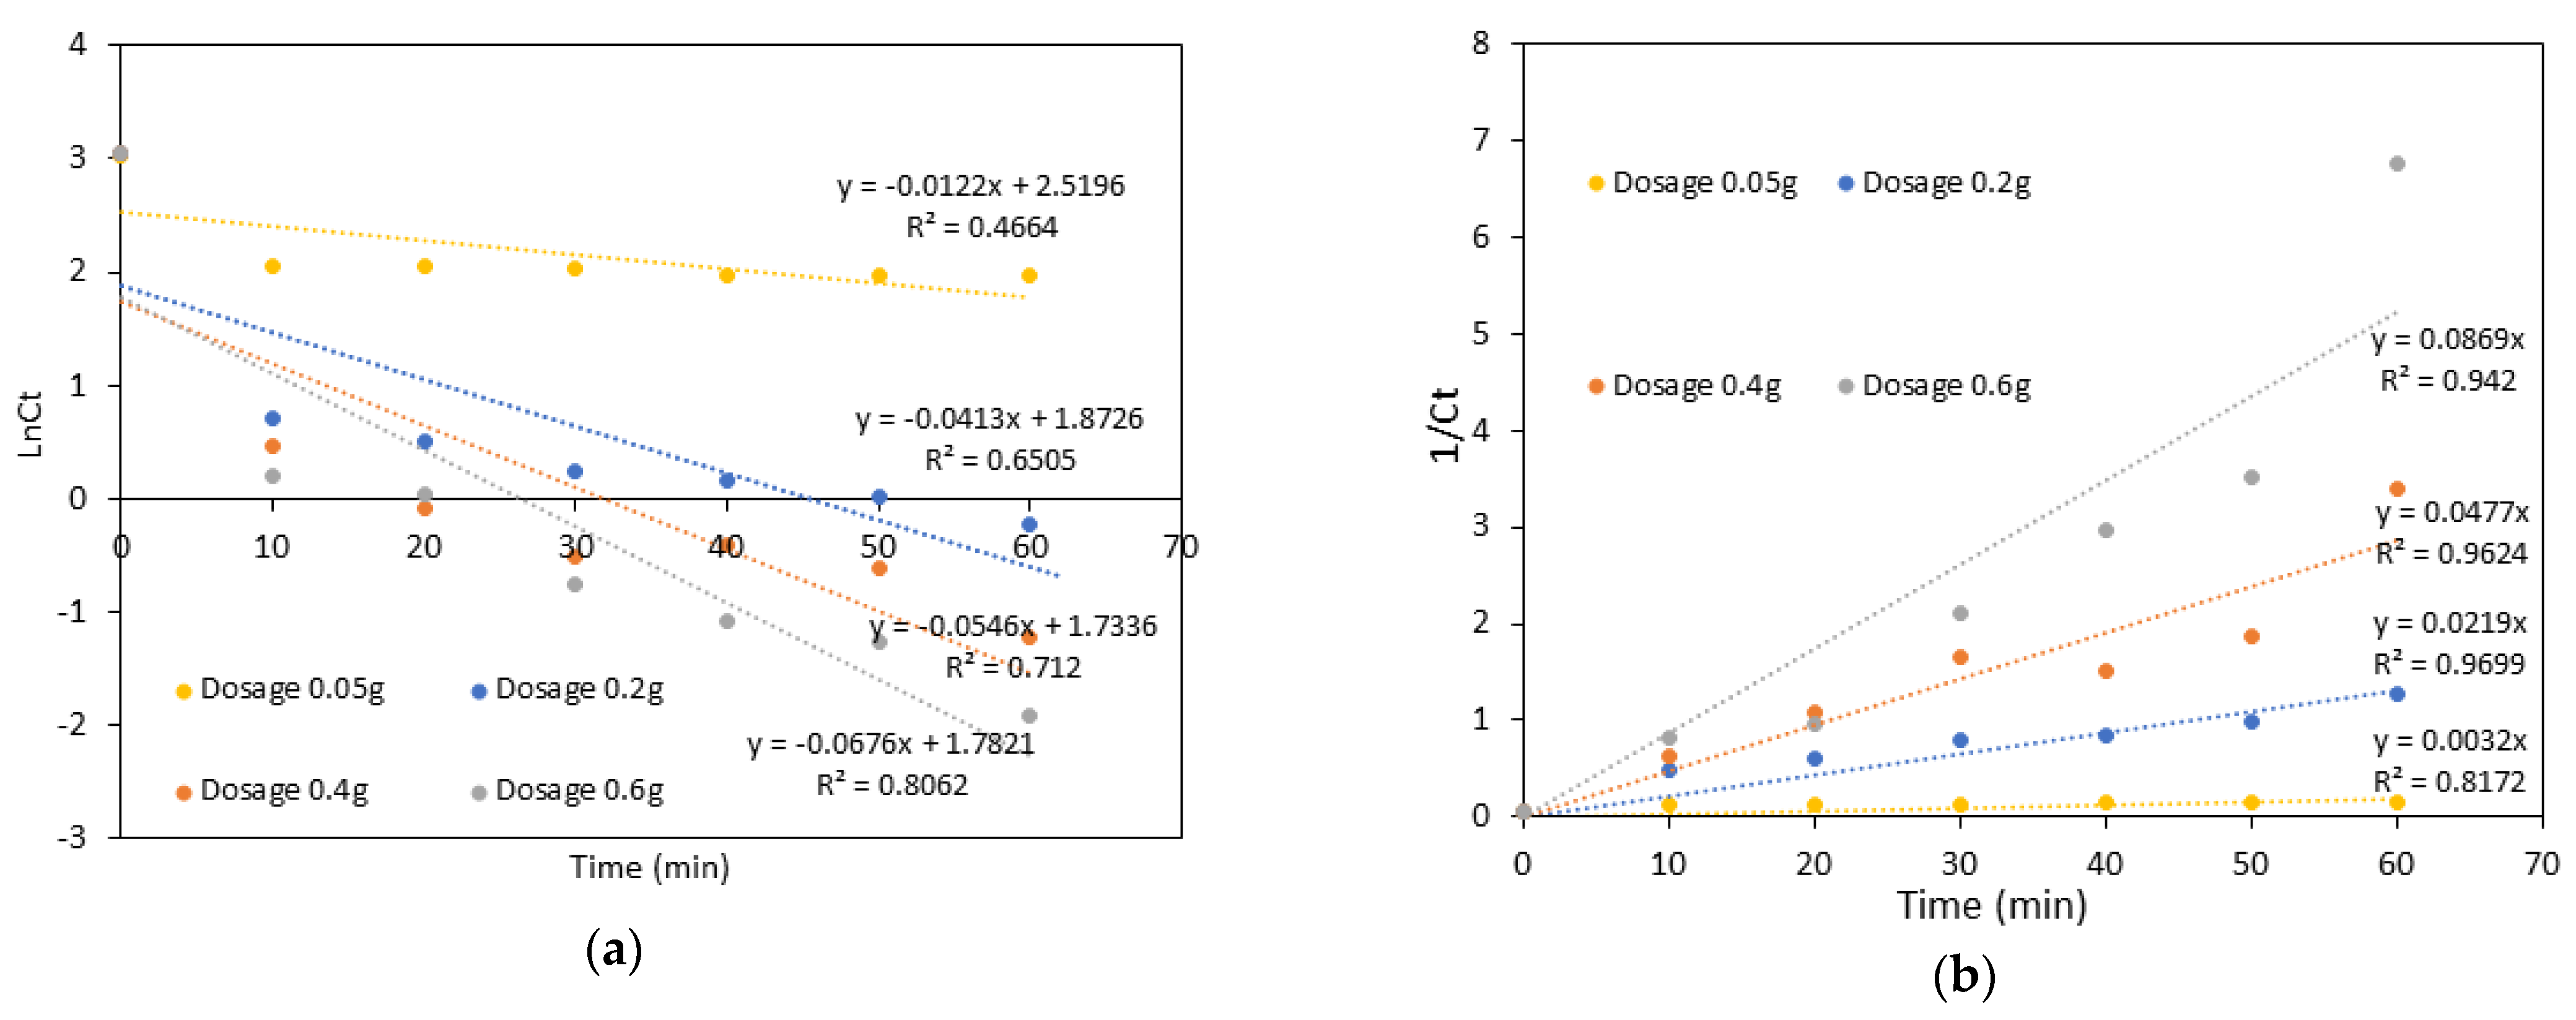
| Sample | Initial CaO2 Dosage | Pseudo-First-Order Model | Pseudo-Second-Order Model | ||
|---|---|---|---|---|---|
| K1 (min−1) | R2 | K2 (M−1min−1) | R2 | ||
| Starch@CPnps | 0.05 g | −0.0122 | 0.4464 | 0.0032 | 0.8172 |
| 0.2 g | −0.0413 | 0.6505 | 0.0219 | 0.9699 | |
| 0.4 g | −0.0546 | 0.7120 | 0.0477 | 0.9624 | |
| 0.6 g | −0.0676 | 0.8062 | 0.0869 | 0.9420 | |
| Average R2 | 0.6538 | 0.9229 | |||
Disclaimer/Publisher’s Note: The statements, opinions and data contained in all publications are solely those of the individual author(s) and contributor(s) and not of MDPI and/or the editor(s). MDPI and/or the editor(s) disclaim responsibility for any injury to people or property resulting from any ideas, methods, instructions or products referred to in the content. |
© 2023 by the authors. Licensee MDPI, Basel, Switzerland. This article is an open access article distributed under the terms and conditions of the Creative Commons Attribution (CC BY) license (https://creativecommons.org/licenses/by/4.0/).
Share and Cite
Amerhaider Nuar, N.N.; Md. Jamil, S.N.A.; Choong, T.S.Y.; Mat Azmi, I.D.; Abdul Romli, N.A.; Abdullah, L.C.; Chiang, P.-C.; Li, F. Synthesis of Calcium Peroxide Nanoparticles with Starch as a Stabilizer for the Degradation of Organic Dye in an Aqueous Solution. Polymers 2023, 15, 1327. https://doi.org/10.3390/polym15051327
Amerhaider Nuar NN, Md. Jamil SNA, Choong TSY, Mat Azmi ID, Abdul Romli NA, Abdullah LC, Chiang P-C, Li F. Synthesis of Calcium Peroxide Nanoparticles with Starch as a Stabilizer for the Degradation of Organic Dye in an Aqueous Solution. Polymers. 2023; 15(5):1327. https://doi.org/10.3390/polym15051327
Chicago/Turabian StyleAmerhaider Nuar, Nurul Nazihah, Siti Nurul Ain Md. Jamil, Thomas Shean Yaw Choong, Intan Diana Mat Azmi, Nor Athirah Abdul Romli, Luqman Chuah Abdullah, Pen-Chi Chiang, and Fan Li. 2023. "Synthesis of Calcium Peroxide Nanoparticles with Starch as a Stabilizer for the Degradation of Organic Dye in an Aqueous Solution" Polymers 15, no. 5: 1327. https://doi.org/10.3390/polym15051327
APA StyleAmerhaider Nuar, N. N., Md. Jamil, S. N. A., Choong, T. S. Y., Mat Azmi, I. D., Abdul Romli, N. A., Abdullah, L. C., Chiang, P.-C., & Li, F. (2023). Synthesis of Calcium Peroxide Nanoparticles with Starch as a Stabilizer for the Degradation of Organic Dye in an Aqueous Solution. Polymers, 15(5), 1327. https://doi.org/10.3390/polym15051327